Accelerated H2 Evolution during Microbial Electrosynthesis with Sporomusa ovata


1
State Key Laboratory of Silicate Materials for Architectures, Wuhan University of Technology, Wuhan 430070, China
2
School of Chemistry, Chemical Engineering and Life Science, Wuhan University of Technology, Wuhan 430070, China
3
The Novo Nordisk Foundation Center for Biosustainability, Technical University of Denmark Kemitorvet-220, 2800 Lyngby, Denmark
*
Author to whom correspondence should be addressed.
†
These two authors contributed equally to this work.
Catalysts 2019, 9(2), 166; https://doi.org/10.3390/catal9020166
Submission received: 14 January 2019
/
Revised: 31 January 2019
/
Accepted: 1 February 2019
/
Published: 8 February 2019
(This article belongs to the Special Issue Biocatalysis: Chemical Biosynthesis)
Abstract
:Microbial electrosynthesis (MES) is a process where bacteria acquire electrons from a cathode to convert CO2 into multicarbon compounds or methane. In MES with Sporomusa ovata as the microbial catalyst, cathode potential has often been used as a benchmark to determine whether electron uptake is hydrogen-dependent. In this study, H2 was detected by a microsensor in proximity to the cathode. With a sterile fresh medium, H2 was produced at a potential of −700 mV versus Ag/AgCl, whereas H2 was detected at −500 mV versus Ag/AgCl with cell-free spent medium from a S. ovata culture. Furthermore, H2 evolution rates were increased with potentials lower than −500 mV in the presence of cell-free spent medium in the cathode chamber. Nickel and cobalt were detected at the cathode surface after exposure to the spent medium, suggesting a possible participation of these catalytic metals in the observed faster hydrogen evolution. The results presented here show that S. ovata-induced alterations of the cathodic electrolytes of a MES reactor reduced the electrical energy required for hydrogen evolution. These observations also indicated that, even at higher cathode potentials, at least a part of the electrons coming from the electrode are transferred to S. ovata via H2 during MES.
1. Introduction
Reductive bioelectrochemical processes rely on the transfer of electrons from a cathode to a microbial catalyst for the reduction of a substrate with protons coming from an anodic reaction [1,2]. The substrate can be inorganic carbon molecules like CO2 that will be reduced to multicarbon compounds or CH4 via microbial electrosynthesis (MES) [3,4,5,6,7,8,9,10]. Organic carbon compounds can also be converted into commodity chemicals via electrofermentation [11,12] or electrorespiration [13].
In reductive bioelectrochemical systems (BES), the electrons are thought to be transferred directly via physical contact between the microbes and the cathode or indirectly via an electron shuttle such as H2 [14,15,16]. Experimental evidences suggest that H2 evolution from a graphite electrode often used in reductive BES starts happening only at potentials below −800 mV vs. Ag/AgCl in batch experiments [17]. Thus, it has been proposed that when the cathode potential is set higher than −800 mV, electrons are transferred via a H2-independent mechanism that could possibly involve the direct acquisition of electrons by components of the bacterium cell wall [3,18].
A recent study indicated that in the presence of cell-free spent medium from the electroactive acetogen Sporomusa sphaeroides, a significant quantity of H2 is produced in a BES with a cathode potential set at −710 mV vs. Ag/AgCl [19]. Furthermore, the same study showed that in the presence of cell-free spent medium from the electroactive methanogen Methanococcus maripaludis, H2, as well as formate, are formed in a BES at higher cathode potential compared to sterile fresh medium control and in sufficient quantities to account for all the methane produced from CO2. The authors suggested a novel electron transfer mechanism in which hydrogenases and formate dehydrogenase released in the medium from microbial cells would interact with a cathode set at a potential above −800 mV vs. Ag/AgCl to catalyze the formation of soluble electron shuttles. Alternatively, other groups have proposed that copper, nickel, iron, or vanadium deposited at the surface of a cathode via microbial activity could be responsible for the increase of bioelectrochemical hydrogen production observed at different potentials after exposure of the cathode to microbial catalysts [20,21,22].
Cathode materials [23], reactor designs [24,25,26,27], and operating modes [28,29] are all parameters that can positively affect H2 evolution. The chemistry of the solution filling the cathodic reactor also has an impact on the relation between the cathode potential and H2 evolution through changes in H2 initial concentration [22,30], changes in buffer composition [31,32,33], and through the presence of weak acids [34,35]. During MES, the microbial catalyst will alter the chemical environment surrounding the cathode by releasing metabolic wastes, products, or diverse cell components or debris in the cathodic solution [19,21,36,37]. To study the possible correlation between microbial alterations and H2 evolution in a MES system, a hydrogen microsensor was placed in close proximity to the surface of a cathode set at different potentials to measure H2 evolution in situ in the presence of sterile medium, bacterial culture or cell-free filtrate. Sporomusa ovata, one of the best pure culture MES catalysts for the production of acetate from CO2 [38,39] is used here as a model because of its capacity to perform MES over a large range of cathode potential [3,40,41,42,43,44,45,46]. In order to further understand H2 evolution and electron uptake during MES, other variables were investigated, including the presence of metals at the cathode surface as well as the presence of hydrogenases and other enzymes in the cell-free spent medium.
2. Results and Discussion
2.1. H2 Evolution in an Abiotic MES Reactor
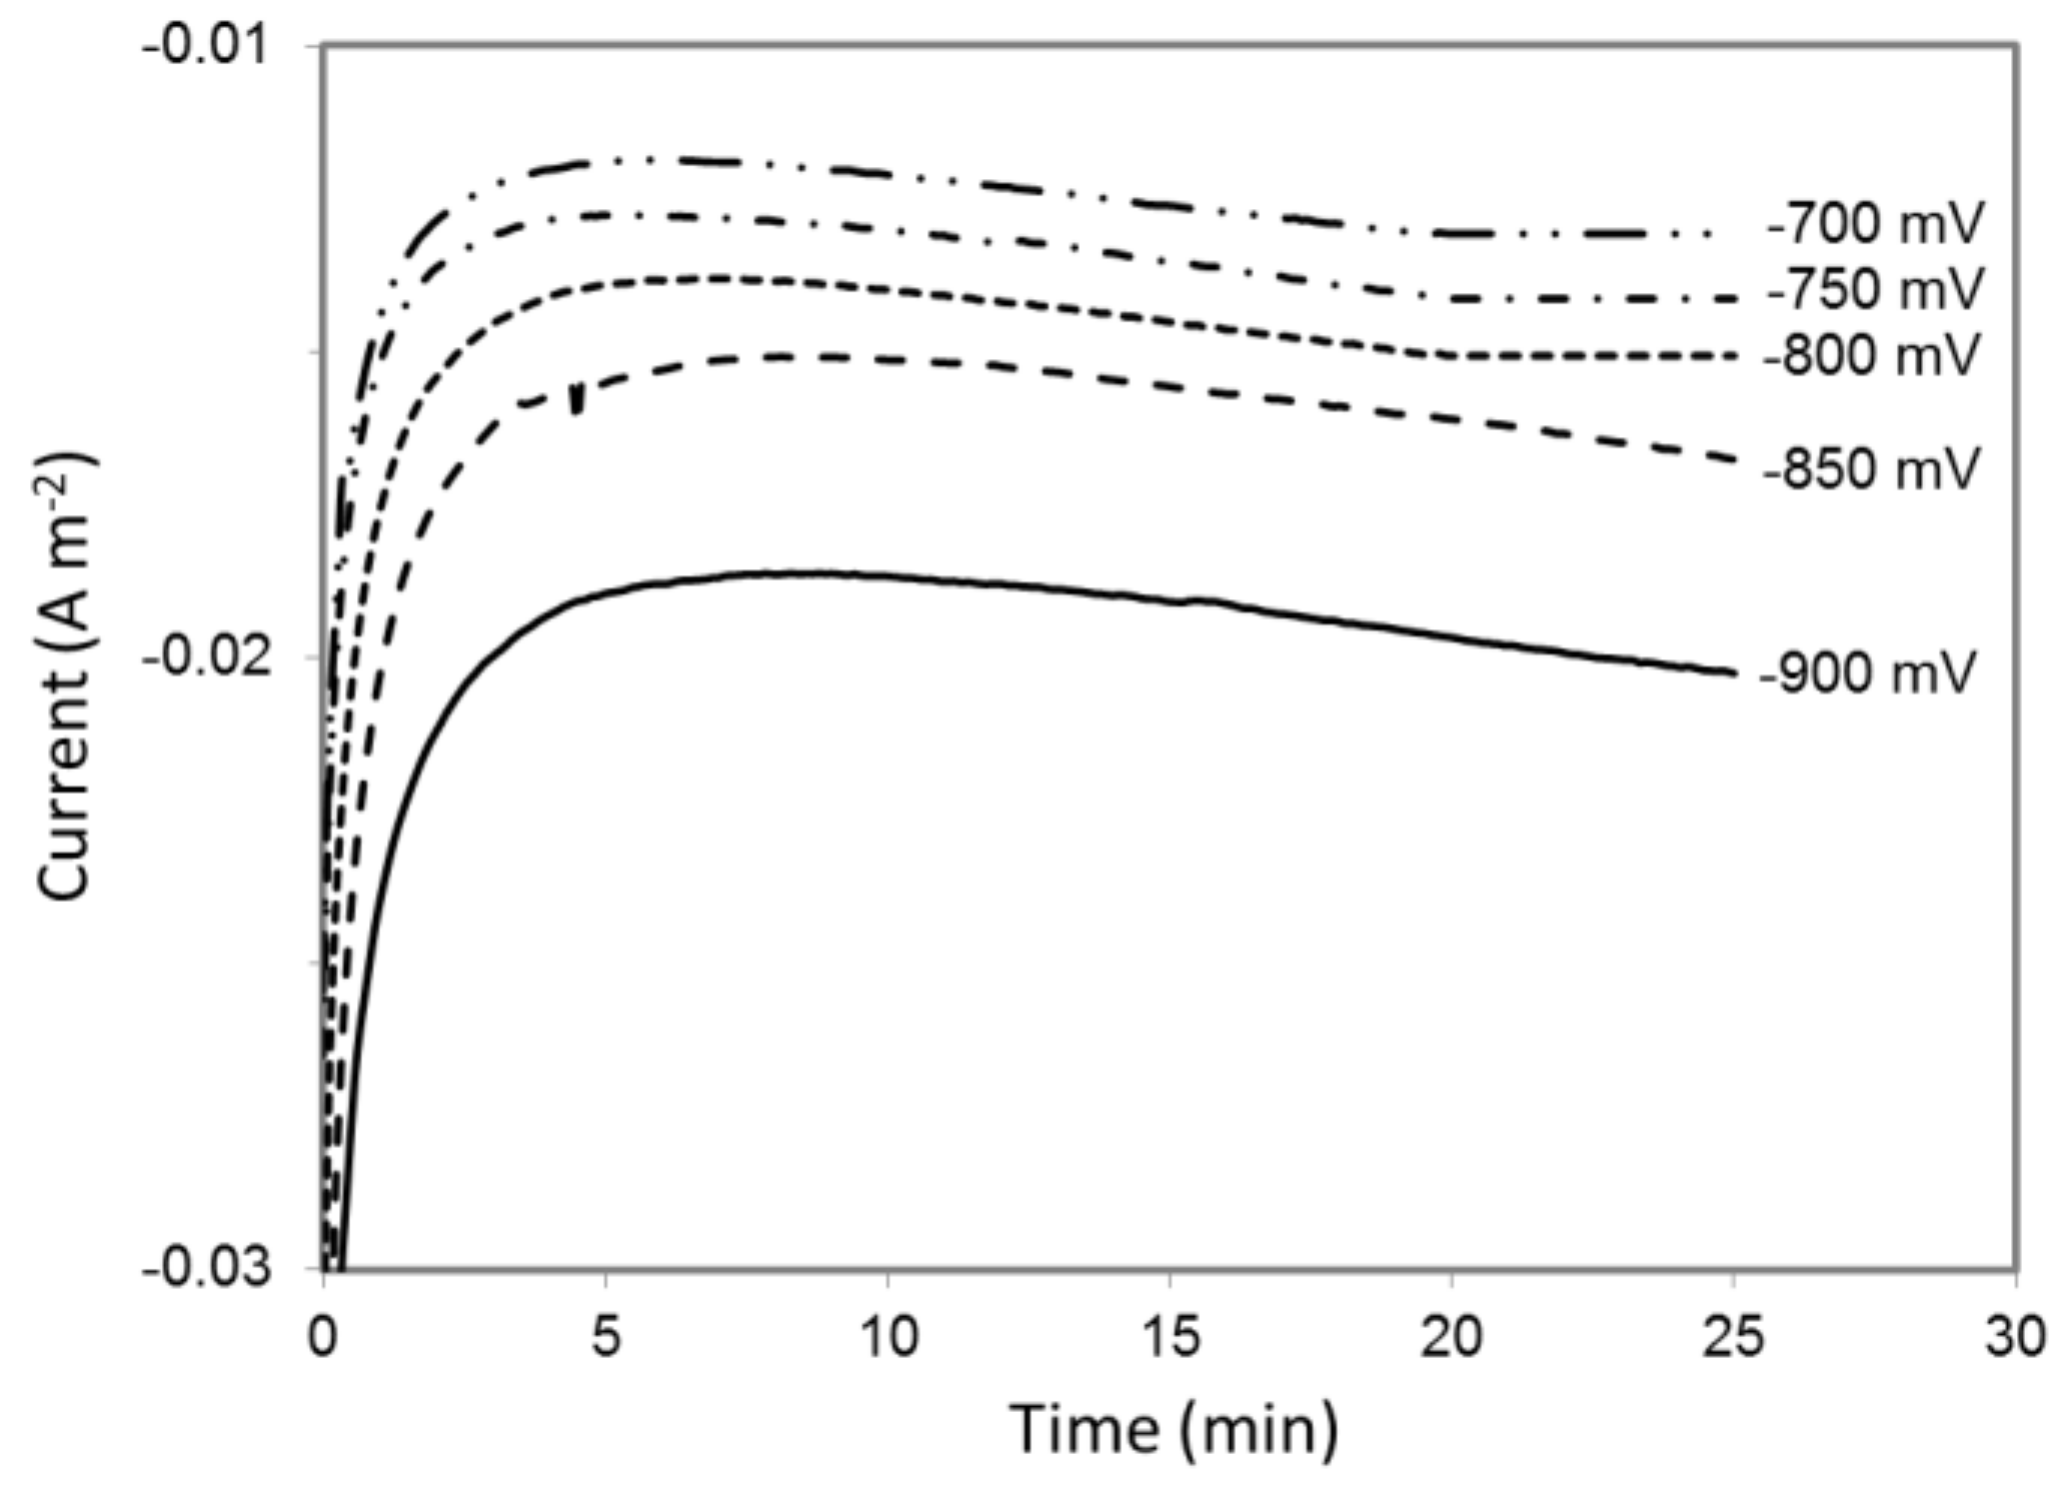
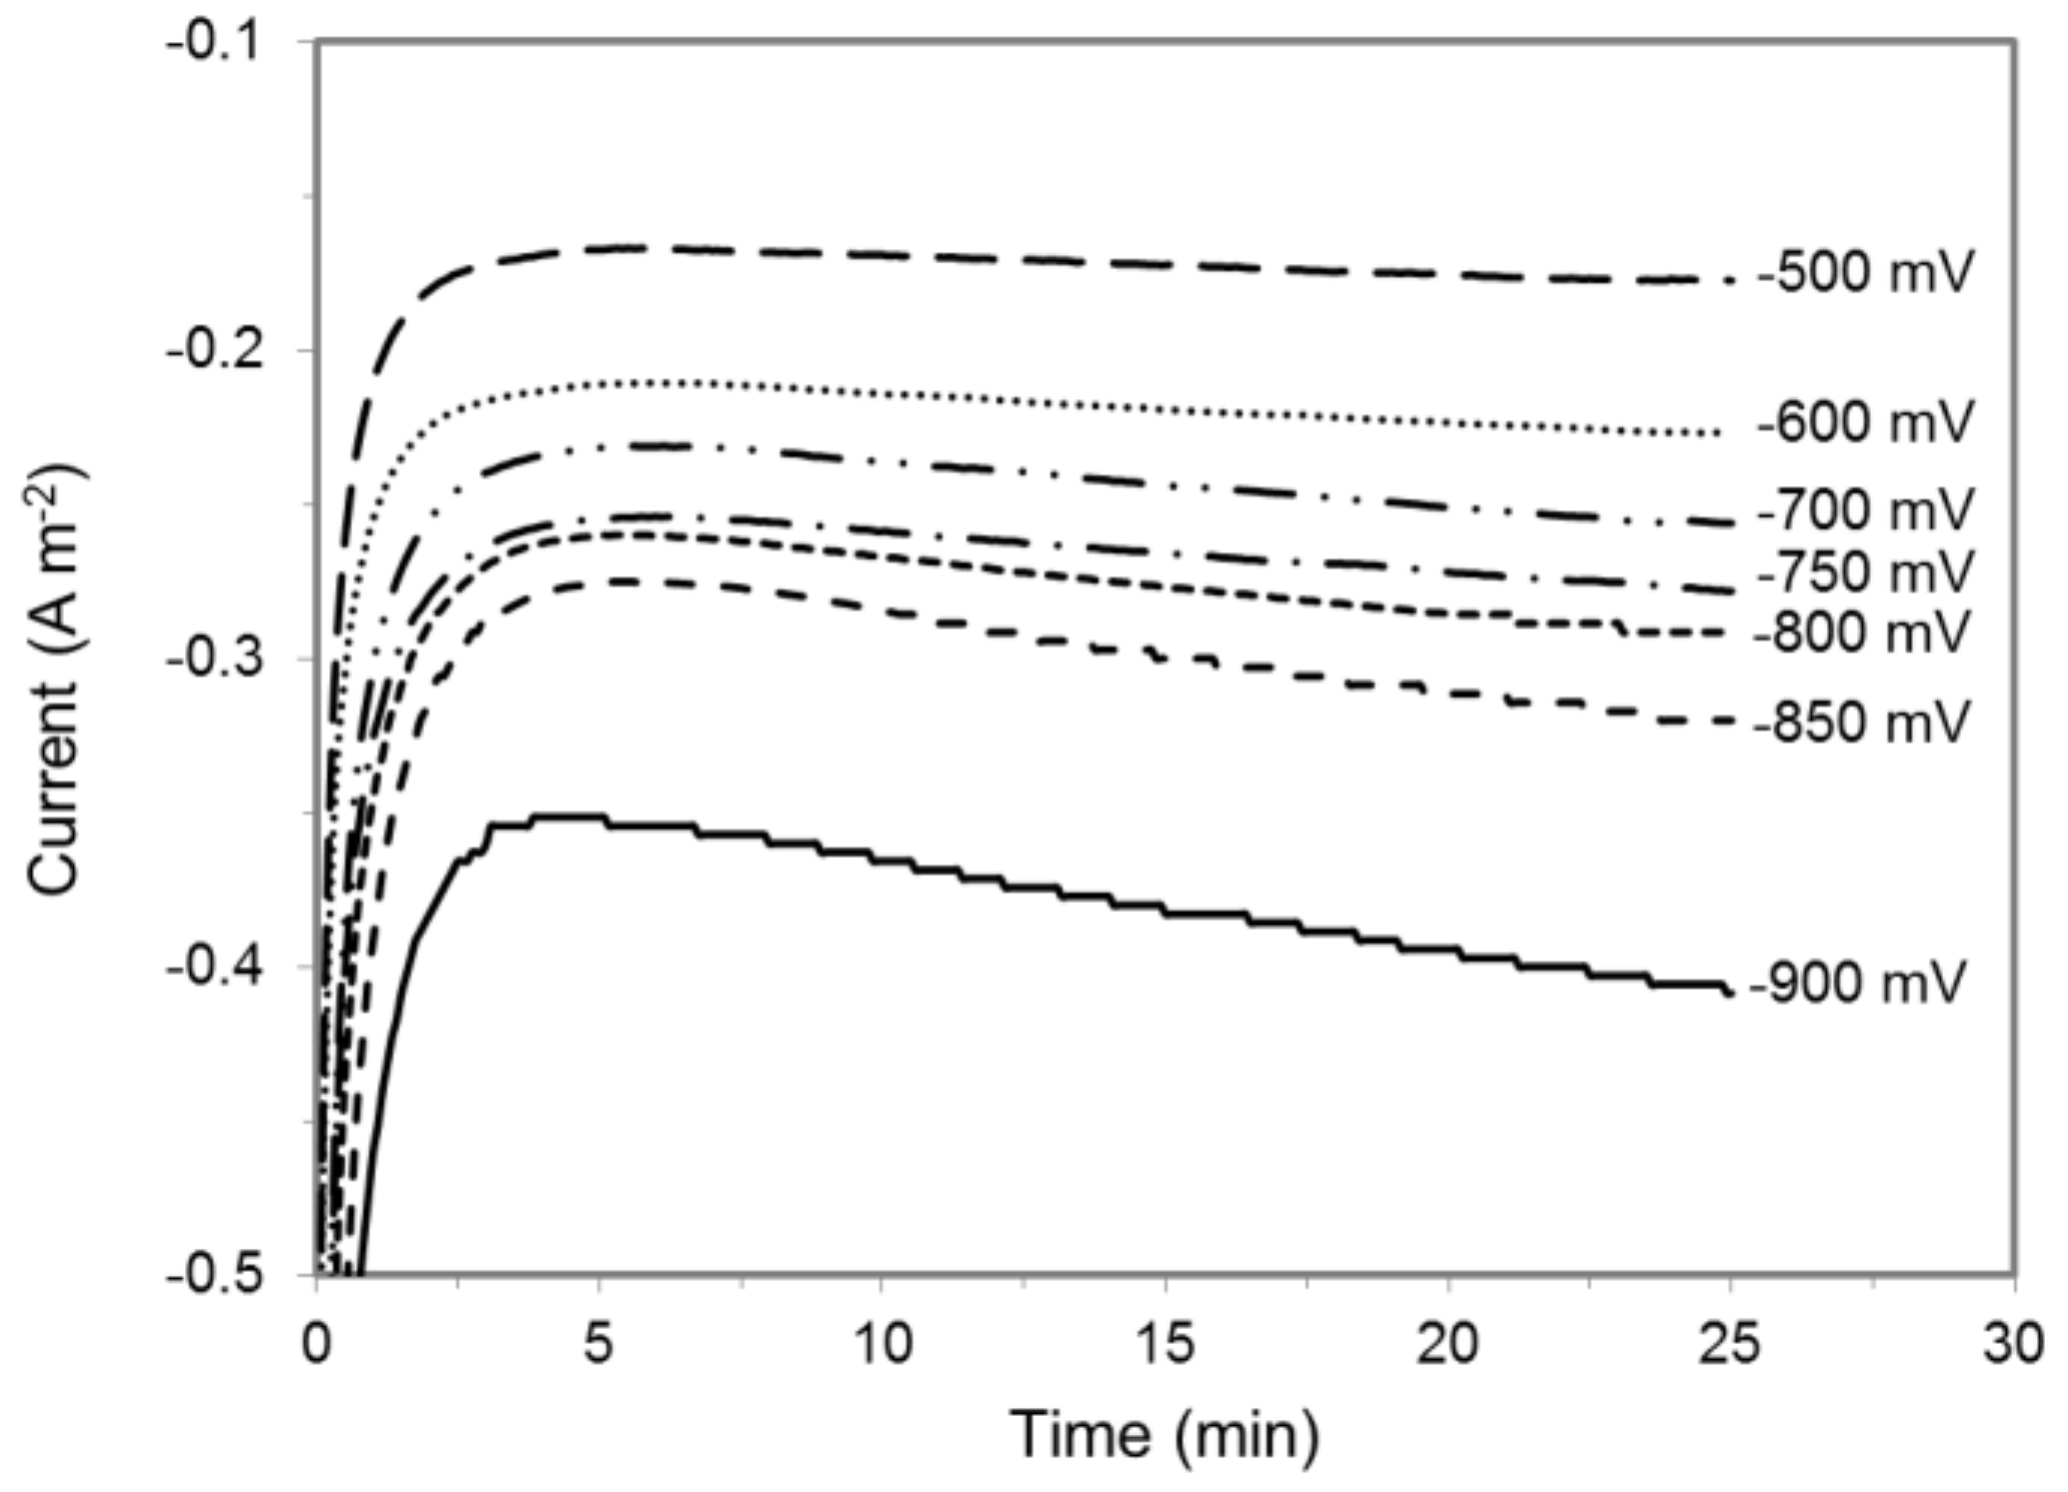
A hydrogen microsensor with a sensitivity of ≥ 0.1 μM was inserted into an abiotic MES reactor to monitor H2 evolution with a cathode set at potential ranging from −900 to −400 mV vs. Ag/AgCl (Figure S1). H2 concentration was measured in close proximity to the cathode surface where microbial catalysts in operating MES reactor [3,38,41] are likely to oxidize large fraction of H2, if any is produced, before it can diffuse away in the medium and in the reactor gas phase. The initial evaluation of H2 evolution was conducted in an abiotic MES reactor. Both cathodic and anodic chambers were filled with sterile 311 medium at pH 6.8, which is the growth medium as well as the electrolyte solution normally used in S. ovata-driven MES reactors [3]. Under these experimental conditions, the highest cathode potential at which H2 evolution was observed was −700 mV vs. Ag/AgCl (Table 1). As expected, more current was drawn at lower potentials versus higher potentials because H2 evolved faster at lower potentials (Figure 1, Table 1, Figure S2).
2.2. H2 Evolution in the Presence of a S. ovata Cell Suspension
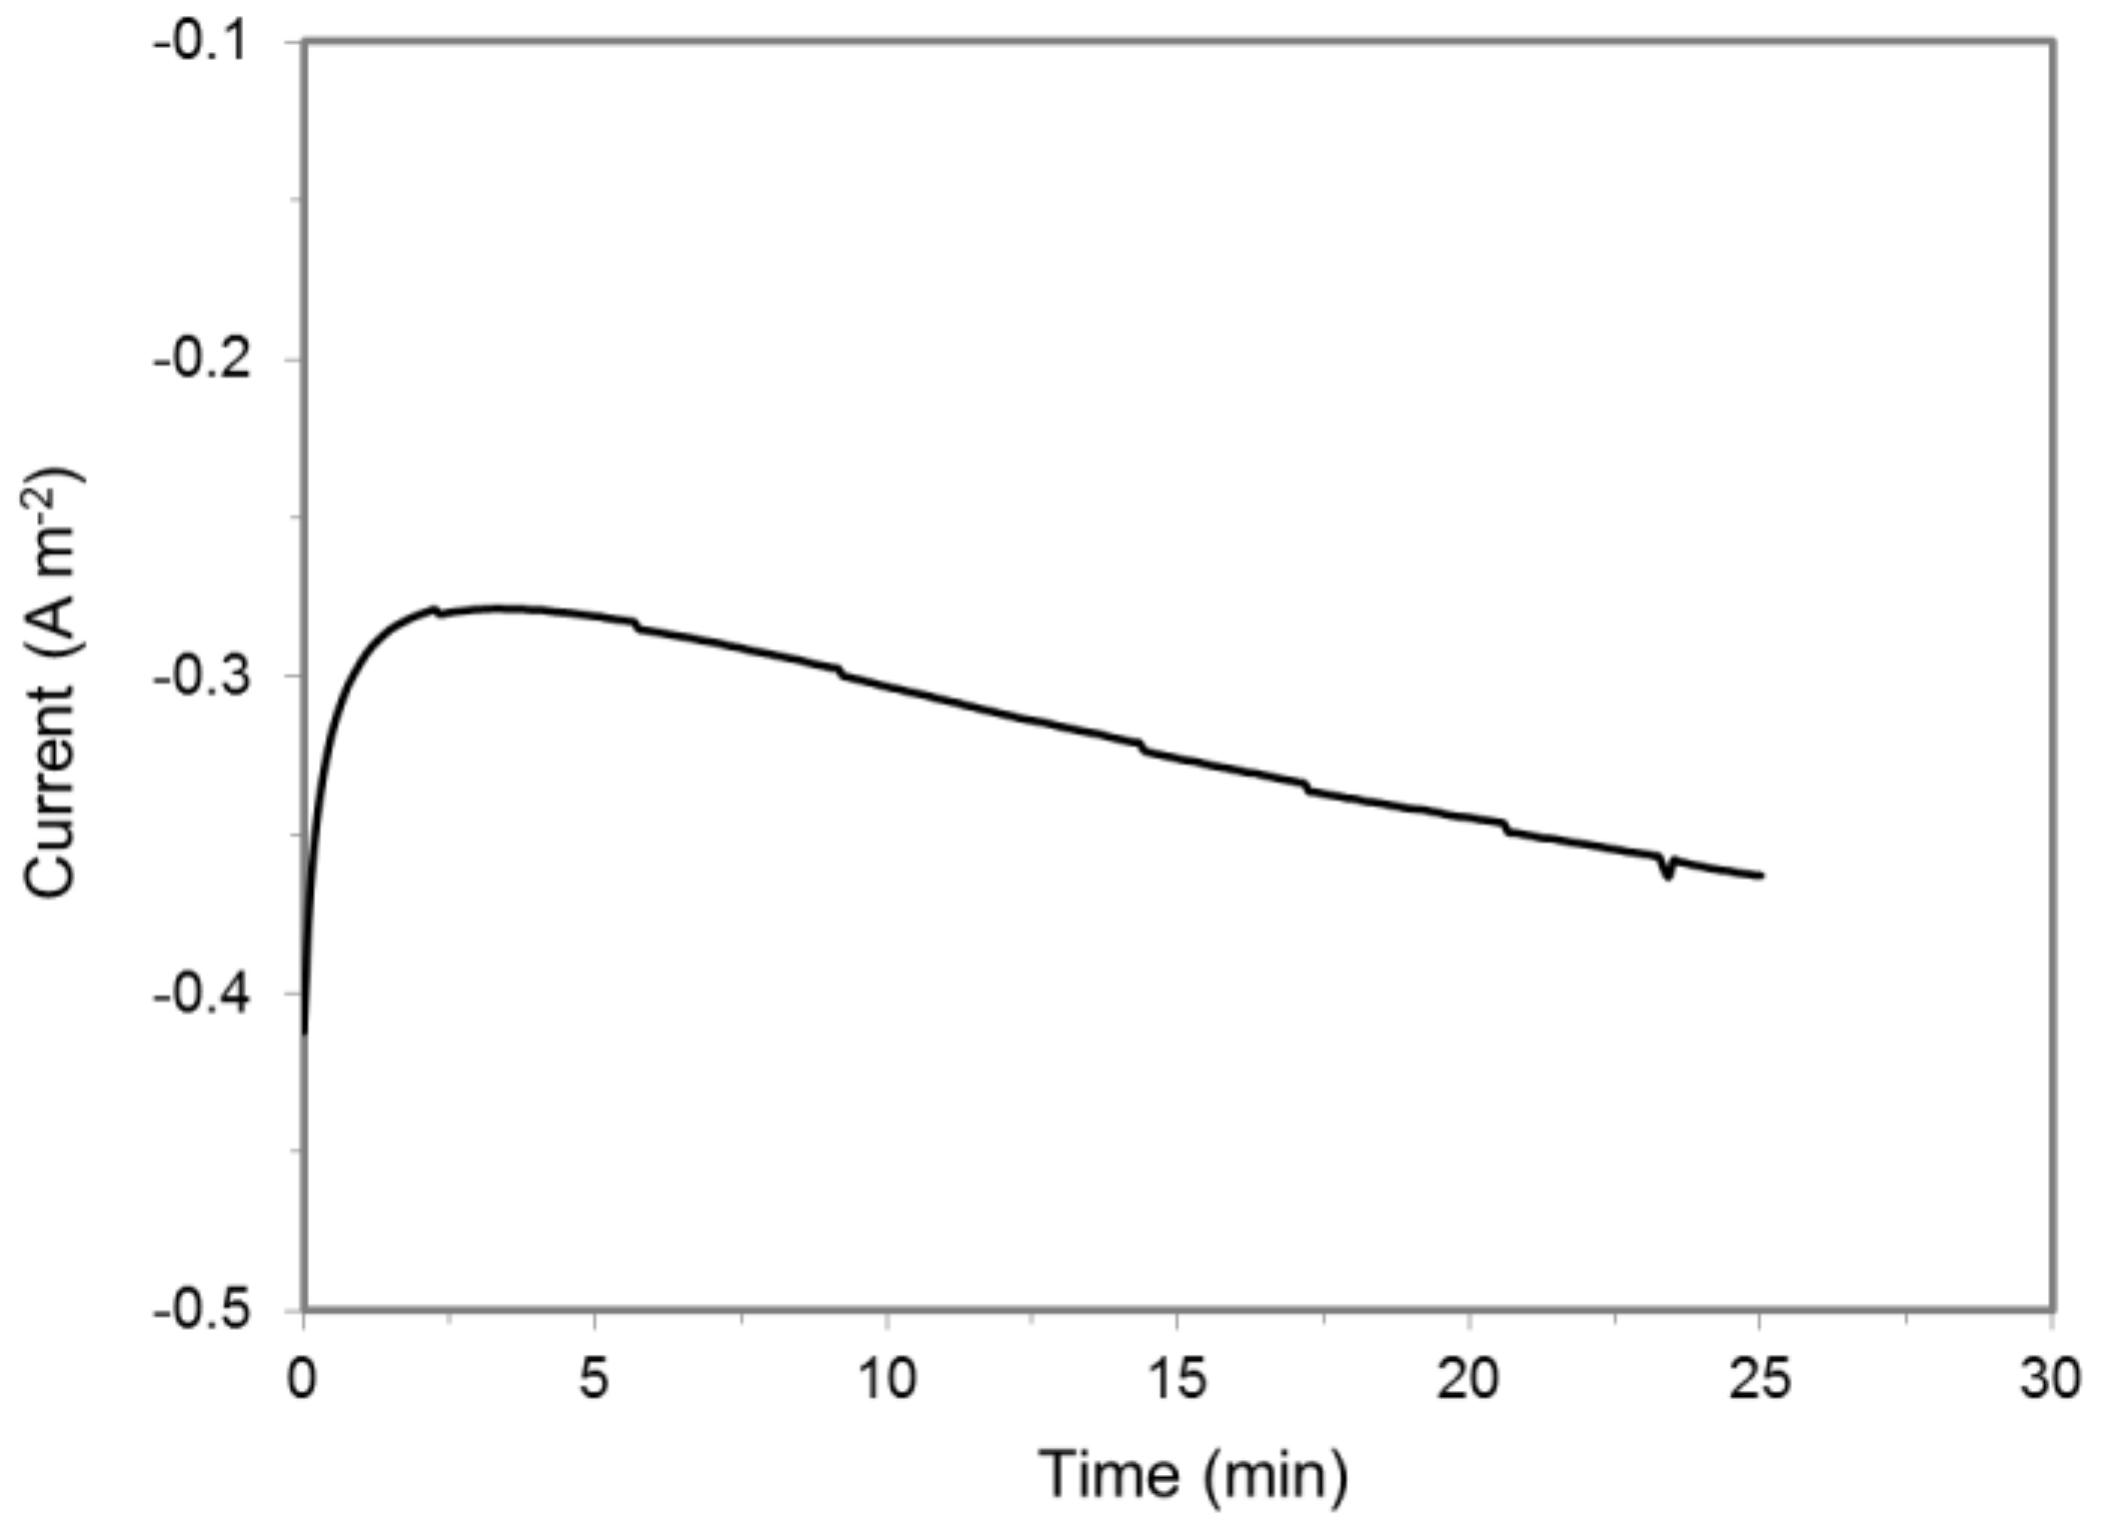
S. ovata is an efficient acetogenic microbial catalyst for the production of acetate from CO2 by MES capable of acquiring electrons from the cathode at potentials as high as −600 mV vs. Ag/AgCl [1,3,41]. To determine the impact of S. ovata on H2 accumulation in a MES system, a cell suspension was added to a cathode chamber equipped with a H2 microsensor. At the tested potentials higher than −900 mV, no H2 was detected (Table 2). At −900 mV, 0.11 ± 0.02 μM min−1 (n = 3) of H2 accumulated, and the electron recovery from current to H2 was only 8.5 ± 1.5% (Table 2, Figure 2, Figure S3), indicating that S. ovata cells probably quickly consumed most of the H2 generated at the cathode. In the meantime, ca. 6.6 ± 0.2 μM of acetate was produced by S. ovata cell suspension from CO2 in the cathode chamber of the MES system over a period of 25 minutes, and the coulombic efficiency was 75 ± 3%.
2.3. H2 Evolution Shifting in the Presence of a Cell-Free Filtrate from S. ovata Culture
To recreate the chemical environment of an operating MES reactor in the absence of the H2-oxidizing microbial catalyst, a cell-free filtrate from a S. ovata culture grown beforehand for four weeks under electrosynthetic condition was employed as the cathodic solution. Compared to a S. ovata cell suspension, H2 was present in significant quantities at −900 mV vs. Ag/AgCl with simultaneous current draw indicating that the cell-free filtrate was unable to oxidize detectable amount of H2 (Table 3, Figure 3). Furthermore, higher H2 evolution rates in the MES reactor were detected with the cell-free filtrate than with the sterile fresh medium at cathode potential ranging from −900 mV to −700 mV vs. Ag/AgCl (Figure 4, Figure S4). In addition, the detectable H2 evolution in the presence of cell-free filtrate was shifted by +200 mV compared to sterile medium control. H2 started to accumulate at −500 mV with S. ovata cell-free filtrate, whereas H2 evolution was detected at −700 mV with sterile fresh 311 medium. These results suggested that secreted metabolites, secreted cell components or chemical characteristics of the S. ovata cell-free filtrate enabled H2 evolution at higher cathode potentials and accelerated it. Furthermore, it seems to indicate that electron transfer in MES driven by S. ovata at high cathode potentials involved H2 as an electron shuttle. However, further characterization is required to determine whether all the electrons required for the acetate production by MES at high cathode potentials are transferred via H2, or if a significant fraction of the electrons comes from an alternative H2-independent route such as direct electron transfer.
A possible explanation for the faster H2 evolution observed here would be the presence of acetic acid in the cell-free spent medium. Weak acids including acetic acid have been shown to have a catalytic effect on H2 evolution in BES at acidic pH as well as in abiotic electrochemical systems [34,35]. In the cell-free filtrate samples of S. ovata tested here, the concentration of acetate/acetic acid varied from 10.4 to 12.4 mM (Figure S5). This was generated by the filtered cells beforehand during the MES process. However, the pH of the cell-free filtrate maintained with a carbonate buffer was measured at ca. 6.8, which suggests that the acetic acid/acetate ratio is unlikely to be high enough to have a significant impact on the electrochemical generation of H2.
2.4. Metals at the Surface of the Cathode after Exposure to Cell-Free Spent Medium
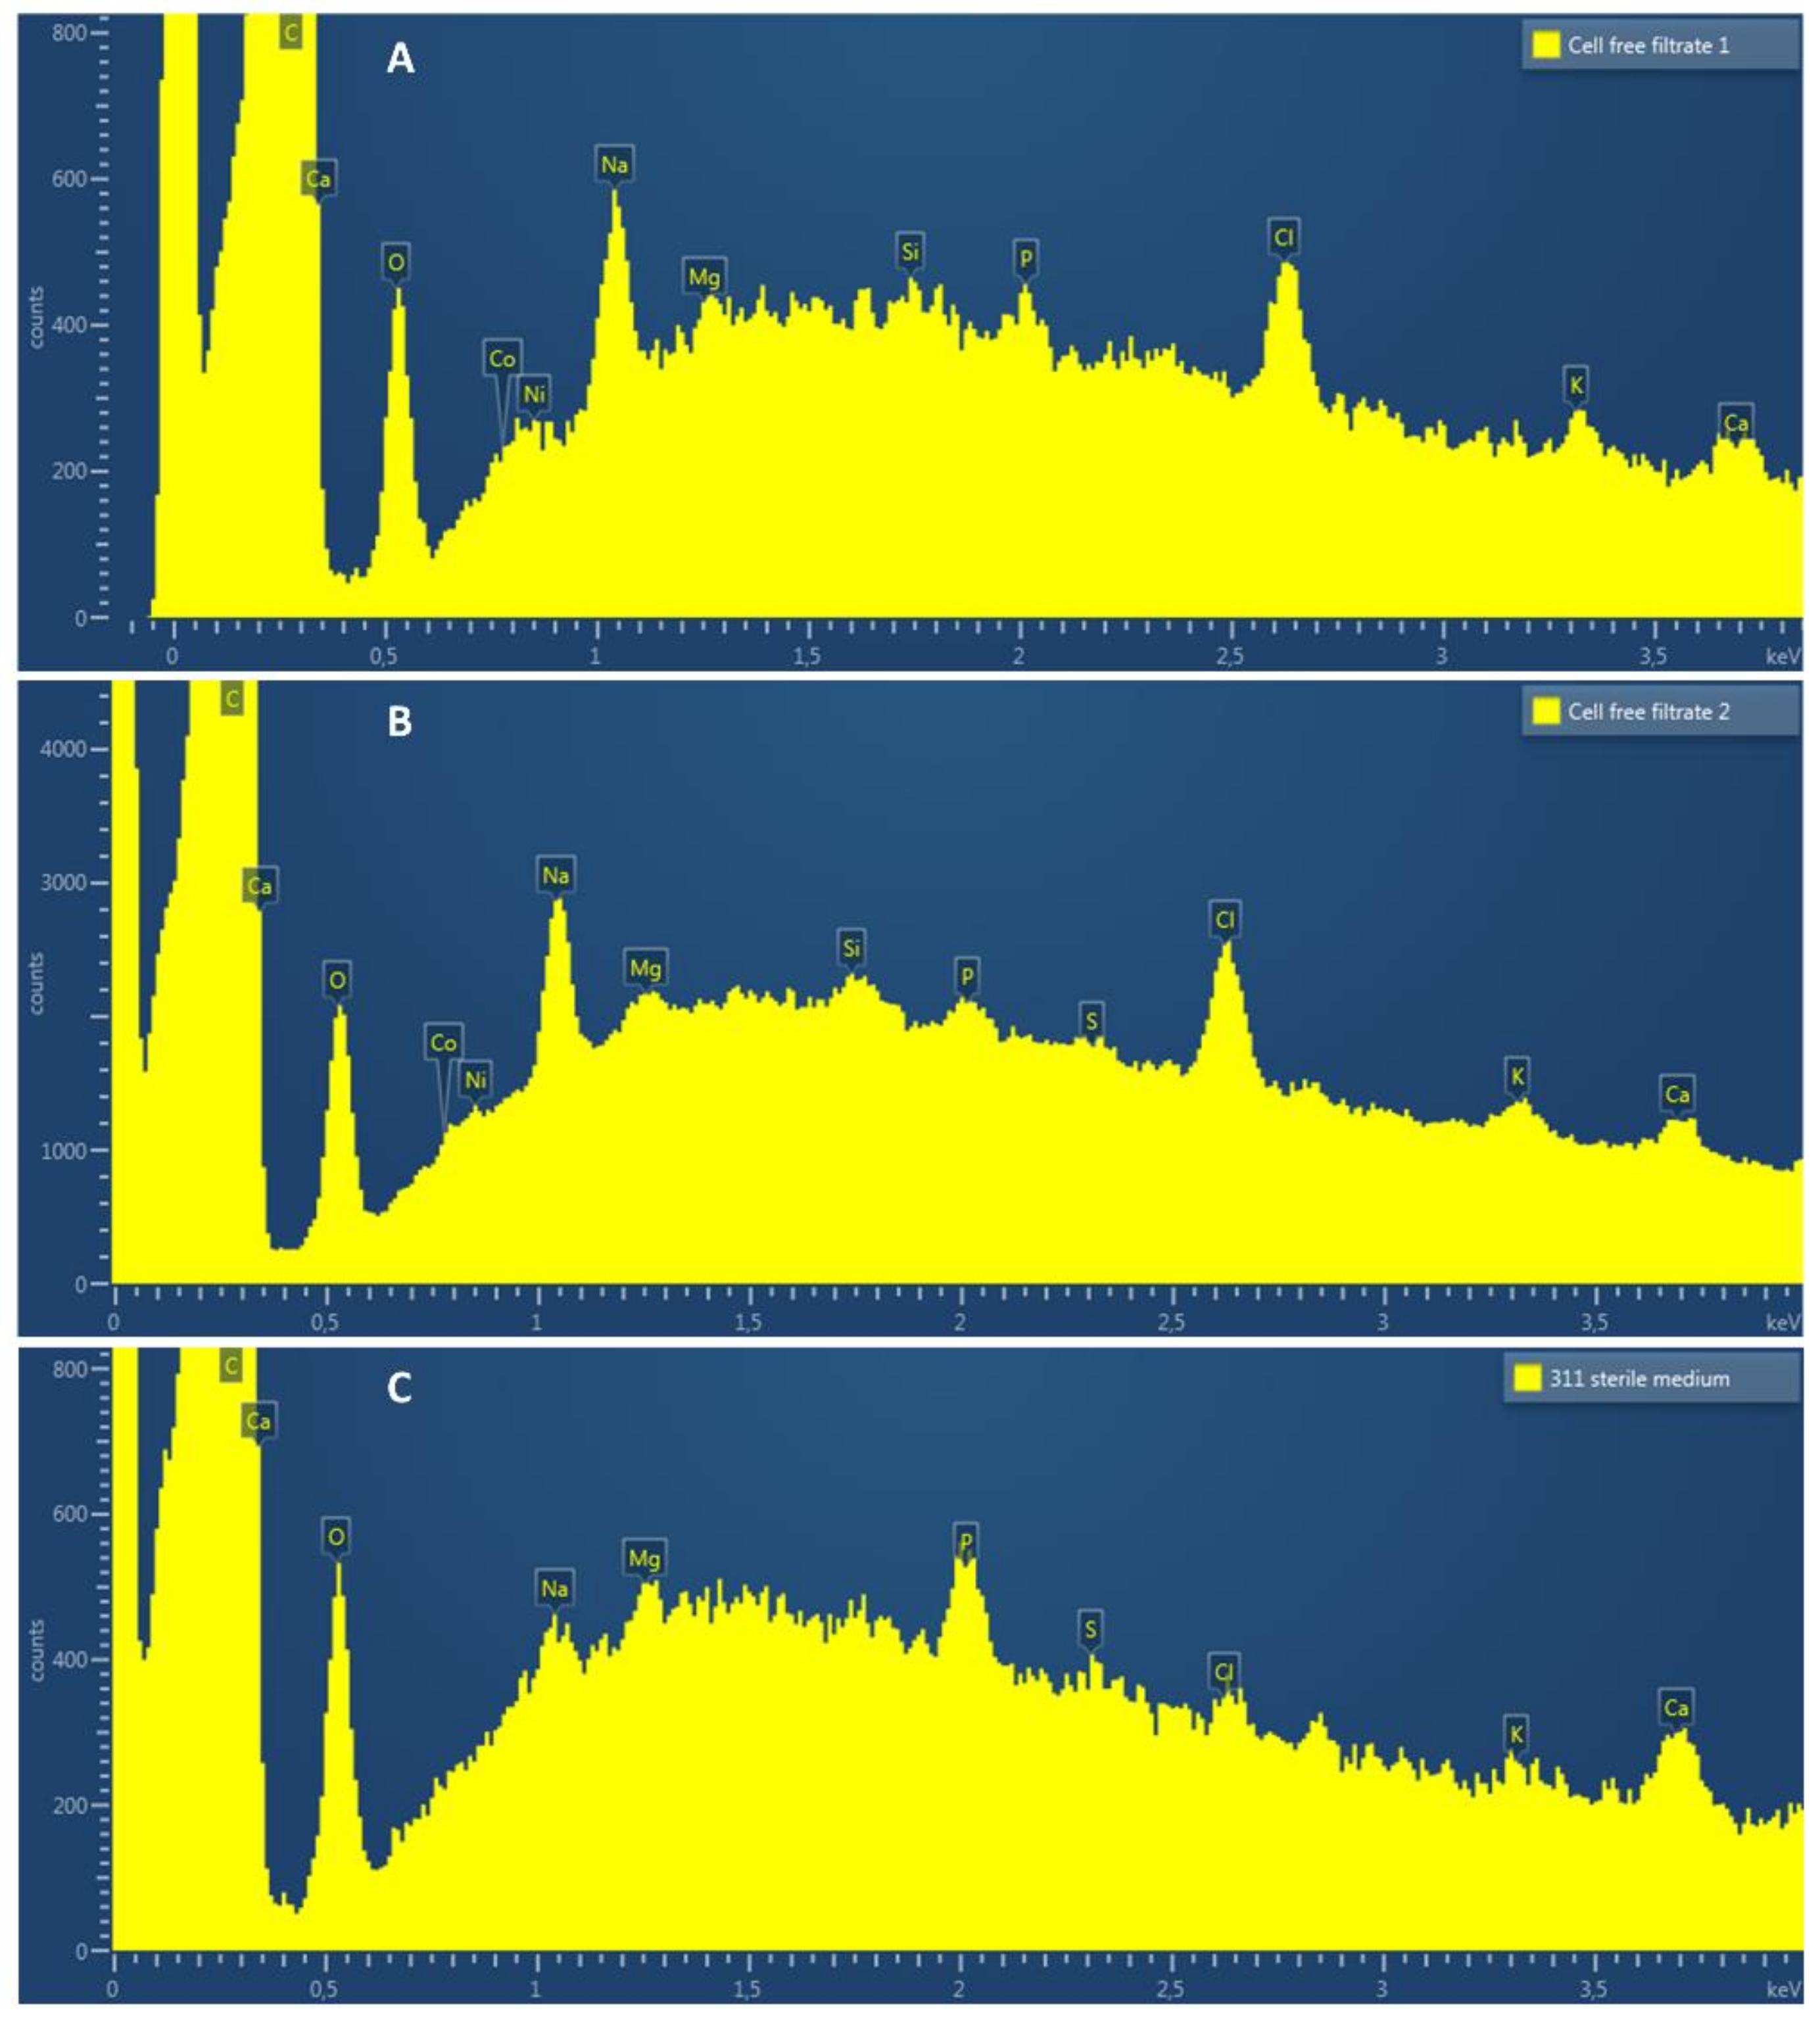
Energy-dispersive X-ray spectroscopy (EDS) was employed to examine the presence of elements on the surface of cathode electrodes exposed to electrosynthetic S. ovata cell-free spent medium or sterile 311 medium. As expected, C, O, Na, Mg, P, Cl, K and Ca were observed on spectra for each condition (Figure 5). Interestingly, two metal elements, i.e., cobalt and nickel, that may be involved in the acceleration of H2 evolution, were detected with the electrode samples exposed to cell-free spent medium but not with samples exposed to sterile 311 medium. When subtracting the background, the EDS signal corresponding to cobalt had an X-ray count of ca. 50 and 120 in cell-free spent medium replicate A and B, respectively. For nickel, the X-ray count was ca. 60 for replicate A and 140 for replicate B. No signal corresponding to nickel or cobalt was detected with sterile 311 medium (Figure 5C).
Multiple proteins and enzymes found in acetogens, such as NiFe hydrogenases, acetyl-CoA synthase, CO dehydrogenase, corrinoid iron-sulfur protein and cobalamin-dependent methyltransferases, have metal centers containing nickel or cobalt [47,48,49]. Evidence suggested that hydrogenases released in the medium by S. sphaeroides cells are responsible for improved H2 evolution from a cathode [19]. In this study, we were unsuccessful at detecting hydrogenase activity in the cell-free spent medium with a methyl-viologen based assay. Additionally, SDS-PAGE and mass spectrometry were applied to examine S. ovata cell-free spent medium and no intact hydrogenases were detected (Figure S6). Further research is warranted to establish if functional hydrogenases or other redox enzymes are released by S. ovata during MES, and if these enzymes participates actively to electron transfer from the cathode.
Three main visible bands were excised from the SDS-PAGE corresponding to an aldehyde oxidoreductase (Sov_1c12660), a glutamate synthase (gltB2) and an ll-diaminopimelate aminotransferase (dapL2) (Figure S6). All three are predicted to be cytoplasmic proteins [50], which suggest that microbial cell content was spilled in the MES reactor medium due to lysis. This further increased the chemical complexity of the material surrounding the cathode. The presence of cytoplasmic enzymes in the cell-free spent medium suggests that the detected nickel and cobalt at the surface of the cathode could come from three sources: intact enzymes, metal centers attached to damaged enzymes and free metal centers detached from apoenzymes. Furthermore, metal centers associated for instance with Sov_1c12660 (Fe, Mo), as well as with other proteins possibly found in the cell-free spent medium of S. ovata, could also interact transiently with the cathode and facilitate hydrogen evolution.
3. Materials and Methods
3.1. Bacterium and Growth Conditions
S. ovata DSM-2662 [51] was obtained from the Deutsche Sammlung Mikroorganismen und Zellkulturen (DSMZ, Braunschweig, Germany). S. ovata strains were routinely maintained in the DSMZ-recommended 311 medium at 30 °C and at pH 6.8 with a H2:CO2 (80:20) atmosphere (1.7 atm). Casitone, sodium sulfide, yeast extract, and resazurin were omitted from the 311 medium. For MES experiments, cysteine was also omitted from the 311 medium.
3.2. Preparation of Cell Suspension
Triplicate of 300 mL of anoxic cultures of S. ovata were harvested by centrifugation and washed two times with 311 sterile medium before being resuspended in a final volume of 3 mL. H2:CO2-grown S. ovata cells were harvested when the optical density was ca. 0.3 (545 nm). Cell suspensions were then used to inoculate the cathodic chamber of MES reactors containing 250 mL of sterile 311 medium.
3.3. Cell-Free Spent Medium of S. ovata
S. ovata cultures at an OD545 of 0.2 catalyzing the conversion of CO2 to acetate for 4 weeks in a MES reactor with a cathode potential of −900 mV vs. Ag/AgCl/3M KCl were filtered two times with 0.45 μm pore size filters. 250 mL of cell-free spent medium was then injected in the cathodic chamber of a MES reactor.
3.4. MES Reactor and H2 Evolution
Three-electrode H-cell glass bioreactor (Adams and Chittenden Scientific Glass, Berkeley, CA, USA) systems were used for H2 evolution experiments during MES. The anode chamber was filled with 250 mL of sterile 311 medium, whereas the cathode chamber contained S. ovata cell suspension, S. ovata cell-free spent medium or sterile 311 medium. The anode and cathode chambers were separated by a Nafion 115 membrane (DuPont Inc., Wilmington, DE, USA). Graphite plates (type HLM, SGL carbon, Wiesbaden, Germany) with a normalized surface area of 35.5 cm2 were used as both anode and cathode. The anode and cathode chamber was stirred at 300 rpm and bubbled with N2:CO2 (80:20) gas mixture at a flow rate of 18.5 ± 1.0 mL/min (ADM 2000 Flowmeter, Agilent, Santa Clara, CA, USA). For the data presented here, the stirring and bubbling in cathode chamber was paused for 25 min during H2 measurement to avoid interference of accuracy measurement. Fixed potentials were applied to the cathode from −900 to −400 mV vs. Ag/AgCl using a multi-potentiostat (CHI 1000C, CH Instrument, Inc., Austin, TX, USA).
H2 evolution was measured in close proximity to the surface of the graphite cathode of a MES reactor maintained at 25 °C with a hydrogen microsensor (H2-500, Unisense, Aarhus, Denmark). The microsensor with a tip surface area of 0.2 mm2 was installed in the MES reactor and the distance between the tip of the H2 microsensor and the cathode surface was ca. 2 mm (Figure S1). Before each experiment, the microsensor was calibrated with a gas mixture containing 7% H2. The sensor data was logged continuously every second using a data logger (Microsensor Multimeter, Unisense, Aarhus, Denmark). H2 evolution was measured for a maximum of 25 min until H2 concentration curves reached an equilibrium plateau. The rates of H2 evolution presented in this study are the slopes of H2 concentration curves before this plateau.
3.5. High-Performance Liquid Chromatography (HPLC)
Acetate concentration was measured with an HPLC apparatus equipped with a HPX-87H anion exchange column (Bio-Rad Laboratories Inc., Hercules, CA, USA) at a temperature of 30 °C, with 5 mM H2SO4 as the mobile phase, and a flow rate of 0.6 mL/min.
3.6. SDS-PAGE and Mass Spectrometry
Proteins from 220 mL of S. ovata cell-free spent medium were concentrated 375 times with Amicon Ultra-15 centrifugal filter devices with a nominal molecular weight limit of 3 kDa (Merck Millipore, Hellerup, Denmark). Protein concentration was measured with a Coomassie Plus Assay kit (ThermoScientific, Hvidovre, Denmark) and 1.5 μg of protein from two cell-free spent medium samples were loaded on a Sodium Dodecyl Sulfate Poly-Acrylamide Gel Electrophoresis (SDS-PAGE, 12.5%). The PageRuler prestained protein ladder (ThermoScientific) was loaded on the same gel to evaluate the molecular weight of protein bands. After protein separation, the SDS-PAGE was stained with the GelCode Blue stain reagent (Life Technologies, Carlsbad, CA, USA). Revealed protein bands were excised and sent to Alphalyse (Odense, Denmark) for protein identification by matrix-assisted laser desorption/ionization-tandem mass spectrometry (MALDI-MS/MS).
3.7. Hydrogenase Activity Assay
Hydrogen-evolving hydrogenase activity in the cell-free spent medium from a S. ovata-driven MES reactor and in 311 sterile fresh medium was measured in triplicate by monitoring the decrease in the absorbance of dithionite-reduced methyl viologen as described previously [52,53]. Briefly, cell-free spent medium or sterile medium were combined with 0.1M HEPES buffer (pH 8.0) and 100 μM reduced methyl viologen in an anoxic rubber-stoppered cuvette. Change in the absorbance at 604 nm was monitored over time at room temperature. The extinction coefficient of methyl viologen at 604 nm is 13.9 mM−1 cm−1.
3.8. Energy-Dispersive X-ray Spectroscopy (EDS)
Duplicate electrode samples were air-dried and examined with a Quanta 200 FEG scanning electron microscope (FEI, Hillsboro, OR, USA). EDS data were collected at an accelerating voltage of 20 kV under high vacuum conditions, with 10 mm working distance and 4.0 spot size.
3.9. Equations
The Nernst Equation (1) was used to calculate theoretical cathode potential (E) at which H2 evolution starts as described in Vincent et al., 2007 [30].
where E0 is the standard reduction potential for H2, R is the gas constant, T is the absolute temperature, n is the number of electrons involved (2 e− for H2 evolution), F is the Faraday constant, aH+ is the activity of H+ and p(H2) is the H2 partial pressure.
E = E0 + 2.3RT/nF log{(aH+)2/p(H2)}
Henry’s law 2 was used to calculate H2 partial pressure in the MES reactor gas phase.
where kH is the Henry’s law constant for H2 and C is the concentration of H2 in solution.
pH2 = kHC
4. Conclusions
This study showed that in a S. ovata-driven MES reactor, faster H2 evolution at higher cathode potential was enabled because the presence of microbial catalyst modified the cathodic solution chemistry. A higher accumulation of H2 means more reducing power, which should lead to lower requirements for electrical energy input for microbial CO2 reduction. The observed acceleration of H2 evolution could be due to the deposition of cobalt and nickel at the surface of the cathode caused by S. ovata catalytic activity. However, given the complexity of chemical species in S. ovata cell-free filtrate, it is possible that a more complicated synergistic effect is involved in H2 evolution during MES with S. ovata.
Supplementary Materials
The following are available online at https://www.mdpi.com/2073-4344/9/2/166/s1, Figure S1: Experimental setup for H2 measurement in close proximity to the cathode surface of a MES reactor, Figure S2: H2 evolution profile over a period of 25 min with fresh sterile medium in the cathode chamber of a MES reactor, Figure S3: H2 evolution profile over a period of 25 min with S. ovata cell suspension in the cathode chamber of a MES reactor, Figure S4: H2 evolution profile over a period of 25 min with S. ovata cell-free spent medium in the cathode chamber of a MES reactor, Figure S5: Evolution of acetate concentration over time in a MES reactor filled with sterile medium or with S. ovata cell-free spent medium with a cathode set at a potential of either −600 mV or −900 mV vs. Ag/AgCl, Figure S6: Proteins found in the cell-free spent medium of electrosynthetic S. ovata.
Author Contributions
P.-L.T. and T.Z. conceived the project and designed the experiments. N.F. assembled and operated MES reactors. N.F. prepared S. ovata cell suspension, cell-free spent medium and measured H2 evolution with a hydrogen microsensor. Energy-dispersive X-ray spectroscopy, protein identification via SDS-PAGE and hydrogenase activity assay were done by P.-L.T. and T.Z. P.-L.T. and T.Z. wrote the manuscript with feedback from N.F.
Funding
This work was funded by the Novo Nordisk Foundation, the Chinese Thousand Talents Plan Program and Wuhan University of Technology.
Acknowledgments
We thank Daniel Höglund and Dawid Mariusz Lizak for their assistance with sampling and data processing.
Conflicts of Interest
The authors declare no conflict of interest.
References
- Tremblay, P.-L.; Zhang, T. Electrifying microbes for the production of chemicals. Front. Microbiol. 2015, 6, 201. [Google Scholar] [CrossRef] [PubMed]
- Rabaey, K.; Rozendal, R.A. Microbial electrosynthesis—Revisiting the electrical route for microbial production. Nat. Rev. Microbiol. 2010, 8, 706–716. [Google Scholar] [CrossRef] [PubMed]
- Nevin, K.P.; Woodard, T.L.; Franks, A.E.; Summers, Z.M.; Lovley, D.R. Microbial electrosynthesis: Feeding microbes electricity to convert carbon dioxide and water to multicarbon extracellular organic compounds. mBio 2010, 1, e00103–e00110. [Google Scholar] [CrossRef] [PubMed]
- Lovley, D.R. Electromicrobiology. Annu. Rev. Microbiol. 2012, 66, 391–409. [Google Scholar] [CrossRef] [PubMed]
- Cheng, S.; Xing, D.; Call, D.F.; Logan, B.E. Direct biological conversion of electrical current into methane by electromethanogenesis. Environ. Sci. Technol. 2009, 43, 3953–3958. [Google Scholar] [CrossRef] [PubMed]
- Ganigué, R.; Puig, S.; Batlle-Vilanova, P.; Balaguer, M.D.; Colprim, J. Microbial electrosynthesis of butyrate from carbon dioxide. Chem. Commun. 2015, 51, 3235–3238. [Google Scholar] [CrossRef] [PubMed]
- Bajracharya, S.; Vanbroekhoven, K.; Buisman, C.J.N.; Pant, D.; Strik, D.P.B.T.B. Application of gas diffusion biocathode in microbial electrosynthesis from carbon dioxide. Environ. Sci. Pollut. Res. Int. 2016, 23, 22292–22308. [Google Scholar] [CrossRef] [PubMed]
- Bajracharya, S.; Yuliasni, R.; Vanbroekhoven, K.; Buisman, C.J.N.; Strik, D.P.B.T.B.; Pant, D. Long-term operation of microbial electrosynthesis cell reducing CO2 to multi-carbon chemicals with a mixed culture avoiding methanogenesis. Bioelectrochemistry 2017, 113, 26–34. [Google Scholar] [CrossRef] [PubMed]
- Zhang, T.; Tremblay, P.-L. Hybrid photosynthesis-powering biocatalysts with solar energy captured by inorganic devices. Biotechnol. Biofuels 2017, 10, 249. [Google Scholar] [PubMed]
- Jourdin, L.; Raes, S.M.T.; Buisman, C.J.N.; Strik, D.P.B.T.B. Critical biofilm growth throughout unmodified carbon felts allows continuous bioelectrochemical chain elongation from CO2 up to caproate at high current density. Front. Energy Res. 2018, 6, 7. [Google Scholar] [CrossRef]
- Harnisch, F.; Rosa, L.F.M.; Kracke, F.; Virdis, B.; Krömer, J.O. Electrifying white biotechnology: Engineering and economic potential of electricity-driven bio-production. ChemSusChem 2015, 8, 758–766. [Google Scholar] [CrossRef] [PubMed]
- Kracke, F.; Vassilev, I.; Krömer, J.O. Microbial electron transport and energy conservation—The foundation for optimizing bioelectrochemical systems. Front. Microbiol. 2015, 6, 575. [Google Scholar] [CrossRef] [PubMed]
- Gregory, K.B.; Bond, D.R.; Lovley, D.R. Graphite electrodes as electron donors for anaerobic respiration. Environ. Microbiol. 2004, 6, 596–604. [Google Scholar] [CrossRef] [PubMed]
- Tremblay, P.-L.; Angenent, L.T.; Zhang, T. Extracellular electron uptake: Among autotrophs and mediated by surfaces. Trends Biotechnol. 2017, 35, 360–371. [Google Scholar] [CrossRef] [PubMed]
- Lovley, D.R.; Nevin, K.P. Electrobiocommodities: Powering microbial production of fuels and commodity chemicals from carbon dioxide with electricity. Curr. Opin. Biotechnol. 2013, 24, 385–390. [Google Scholar] [CrossRef] [PubMed]
- Yates, M.D.; Eddie, B.J.; Kotloski, N.J.; Lebedev, N.; Malanoski, A.P.; Lin, B.; Strycharz-Glaven, S.M.; Tender, L.M. Toward understanding long-distance extracellular electron transport in an electroautotrophic microbial community. Energy Environ. Sci. 2016, 9, 3544–3558. [Google Scholar] [CrossRef]
- Aulenta, F.; Reale, P.; Catervi, A.; Panero, S.; Majone, M. Kinetics of trichloroethene dechlorination and methane formation by a mixed anaerobic culture in a bio-electrochemical system. Electrochim. Acta 2008, 53, 5300–5305. [Google Scholar] [CrossRef]
- Summers, Z.M.; Gralnick, J.A.; Bond, D.R. Cultivation of an obligate Fe(II)-oxidizing lithoautotrophic bacterium using electrodes. mBio 2013, 4, e00420. [Google Scholar] [CrossRef]
- Deutzmann, J.S.; Sahin, M.; Spormann, A.M. Extracellular enzymes facilitate electron uptake in biocorrosion and bioelectrosynthesis. mBio 2015, 6, e00496. [Google Scholar] [CrossRef]
- Jourdin, L.; Lu, Y.; Flexer, V.; Keller, J.; Freguia, S. Biologically induced hydrogen production drives high rate/high efficiency microbial electrosynthesis of acetate from carbon dioxide. ChemElectroChem 2016, 3, 581–591. [Google Scholar] [CrossRef]
- LaBelle, E.V.; Marshall, C.W.; Gilbert, J.A.; May, H.D. Influence of acidic pH on hydrogen and acetate production by an electrosynthetic microbiome. PLoS ONE 2014, 9, e109935. [Google Scholar] [CrossRef] [PubMed]
- May, H.D.; Evans, P.J.; LaBelle, E.V. The bioelectrosynthesis of acetate. Curr. Opin. Biotechnol. 2016, 42, 225–233. [Google Scholar] [CrossRef] [PubMed]
- Kundu, A.; Sahu, J.N.; Redzwan, G.; Hashim, M.A. An overview of cathode material and catalysts suitable for generating hydrogen in microbial electrolysis cell. Int. J. Hydrogen Energy 2013, 38, 1745–1757. [Google Scholar] [CrossRef]
- Call, D.; Logan, B.E. Hydrogen production in a single chamber microbial electrolysis cell lacking a membrane. Environ. Sci. Technol. 2008, 42, 3401–3406. [Google Scholar] [CrossRef] [PubMed]
- Cheng, S.; Logan, B.E. High hydrogen production rate of microbial electrolysis cell (MEC) with reduced electrode spacing. Bioresour. Technol. 2011, 102, 3571–3574. [Google Scholar] [CrossRef] [PubMed]
- Hu, H.; Fan, Y.; Liu, H. Hydrogen production using single-chamber membrane-free microbial electrolysis cells. Water Res. 2008, 42, 4172–4178. [Google Scholar] [CrossRef] [PubMed]
- Lee, H.-S.; Salerno, M.B.; Rittmann, B.E. Thermodynamic evaluation on H2 production in glucose fermentation. Environ. Sci. Technol. 2008, 42, 2401–2407. [Google Scholar] [CrossRef] [PubMed]
- Lee, H.-S.; Rittmann, B.E. Characterization of energy losses in an upflow single-chamber microbial electrolysis cell. Int. J. Hydrogen Energy 2010, 35, 920–927. [Google Scholar] [CrossRef]
- Selembo, P.A.; Merrill, M.D.; Logan, B.E. The use of stainless steel and nickel alloys as low-cost cathodes in microbial electrolysis cells. J. Power Sources 2009, 190, 271–278. [Google Scholar] [CrossRef]
- Vincent, K.A.; Parkin, A.; Armstrong, F.A. Investigating and exploiting the electrocatalytic properties of hydrogenases. Chem. Rev. 2007, 107, 4366–4413. [Google Scholar] [CrossRef] [PubMed]
- Jeremiasse, A.W.; Hamelers, H.V.M.; Kleijn, J.M.; Buisman, C.J.N. Use of biocompatible buffers to reduce the concentration overpotential for hydrogen evolution. Environ. Sci. Technol. 2009, 43, 6882–6887. [Google Scholar] [CrossRef]
- Liang, D.; Liu, Y.; Peng, S.; Lan, F.; Lu, S.; Xiang, Y. Effects of bicarbonate and cathode potential on hydrogen production in a biocathode electrolysis cell. Front. Environ. Sci. Eng. 2014, 8, 624–630. [Google Scholar] [CrossRef]
- De Silva Muñoz, L.; Bergel, A.; Féron, D.; Basséguy, R. Hydrogen production by electrolysis of a phosphate solution on a stainless steel cathode. Int. J. Hydrogen Energy 2010, 35, 8561–8568. [Google Scholar] [CrossRef]
- Merrill, M.D.; Logan, B.E. Electrolyte effects on hydrogen evolution and solution resistance in microbial electrolysis cells. J. Power Sources 2009, 191, 203–208. [Google Scholar] [CrossRef]
- Daniele, S.; Lavagnini, I.; Baldo, M.A.; Magno, F. Steady state voltammetry at microelectrodes for the hydrogen evolution from strong and weak acids under pseudo-first and second order kinetic conditions. J. Electroanal. Chem. 1996, 404, 105–111. [Google Scholar] [CrossRef]
- Rosenbaum, M.; Aulenta, F.; Villano, M.; Angenent, L.T. Cathodes as electron donors for microbial metabolism: Which extracellular electron transfer mechanisms are involved? Bioresour. Technol. 2011, 102, 324–333. [Google Scholar] [CrossRef] [PubMed]
- Yates, M.D.; Siegert, M.; Logan, B.E. Hydrogen evolution catalyzed by viable and non-viable cells on biocathodes. Int. J. Hydrogen Energy 2014, 39, 16841–16851. [Google Scholar] [CrossRef]
- Tremblay, P.-L.; Höglund, D.; Koza, A.; Bonde, I.; Zhang, T. Adaptation of the autotrophic acetogen Sporomusa ovata to methanol accelerates the conversion of CO2 to organic products. Sci. Rep. 2015, 5, 16168. [Google Scholar] [CrossRef] [PubMed]
- Aryal, N.; Tremblay, P.-L.; Xu, M.; Daugaard, A.E.; Zhang, T. Highly conductive poly(3,4-ethylenedioxythiophene) polystyrene sulfonate polymer coated cathode for the microbial electrosynthesis of acetate from carbon dioxide. Front. Energy Res. 2018, 6, 72. [Google Scholar] [CrossRef]
- Aryal, N.; Tremblay, P.-L.; Lizak, D.M.; Zhang, T. Performance of different Sporomusa species for the microbial electrosynthesis of acetate from carbon dioxide. Bioresour. Technol. 2017, 233, 184–190. [Google Scholar] [CrossRef]
- Zhang, T.; Nie, H.; Bain, T.S.; Lu, H.; Cui, M.; Snoeyenbos-West, O.L.; Franks, A.E.; Nevin, K.P.; Russell, T.P.; Lovley, D.R. Improved cathode materials for microbial electrosynthesis. Energy Environ. Sci. 2013, 6, 217–224. [Google Scholar] [CrossRef]
- Nie, H.; Zhang, T.; Cui, M.; Lu, H.; Lovley, D.R.; Russell, T.P. Improved cathode for high efficient microbial-catalyzed reduction in microbial electrosynthesis cells. Phys. Chem. Chem. Phys. 2013, 15, 14290–14294. [Google Scholar] [CrossRef] [PubMed]
- Ammam, F.; Tremblay, P.-L.; Lizak, D.M.; Zhang, T. Effect of tungstate on acetate and ethanol production by the electrosynthetic bacterium Sporomusa ovata. Biotechnol. Biofuels 2016, 9, 163. [Google Scholar] [PubMed]
- Aryal, N.; Halder, A.; Tremblay, P.-L.; Chi, Q.; Zhang, T. Enhanced microbial electrosynthesis with three-dimensional graphene functionalized cathodes fabricated via solvothermal synthesis. Electrochim. Acta 2016, 217, 117–122. [Google Scholar] [CrossRef]
- Aryal, N.; Halder, A.; Zhang, M.; Whelan, P.R.; Tremblay, P.-L.; Chi, Q.; Zhang, T. Freestanding and flexible graphene papers as bioelectrochemical cathode for selective and efficient CO2 conversion. Sci. Rep. 2017, 7, 9107. [Google Scholar] [CrossRef] [PubMed]
- Chen, L.; Tremblay, P.-L.; Mohanty, S.; Xu, K.; Zhang, T. Electrosynthesis of acetate from CO2 by a highly structured biofilm assembled with reduced graphene oxide–tetraethylene pentamine. J. Mater. Chem. A 2016, 4, 8395–8401. [Google Scholar] [CrossRef]
- Ragsdale, S.W.; Pierce, E. Acetogenesis and the Wood–Ljungdahl pathway of CO2 fixation. Biochim. Biophys. Acta 2008, 1784, 1873–1898. [Google Scholar] [CrossRef]
- Ragsdale, S.W. Nickel-based enzyme systems. J. Biol. Chem. 2009, 284, 18571–18575. [Google Scholar] [CrossRef]
- Ragsdale, S.W. Enzymology of the Wood–Ljungdahl pathway of acetogenesis. Ann. N. Y. Acad. Sci. 2008, 1125, 129–136. [Google Scholar] [CrossRef]
- Yu, N.Y.; Wagner, J.R.; Laird, M.R.; Melli, G.; Rey, S.; Lo, R.; Dao, P.; Sahinalp, S.C.; Ester, M.; Foster, L.J.; et al. PSORTb 3.0: Improved protein subcellular localization prediction with refined localization subcategories and predictive capabilities for all prokaryotes. Bioinformatics 2010, 26, 1608–1615. [Google Scholar] [CrossRef]
- Möller, B.; Oßmer, R.; Howard, B.H.; Gottschalk, G.; Hippe, H. Sporomusa, a new genus of gram-negative anaerobic bacteria including Sporomusa sphaeroides spec. nov. and Sporomusa ovata spec. nov. Arch. Microbiol. 1984, 139, 388–396. [Google Scholar] [CrossRef]
- Nakashimada, Y.; Rachman, M.A.; Kakizono, T.; Nishio, N. Hydrogen production of Enterobacter aerogenes altered by extracellular and intracellular redox states. Int. J. Hydrogen Energy 2002, 27, 1399–1405. [Google Scholar] [CrossRef]
- Fernández, V.M.; Gutiérrez, C.; Ballesteros, A. Determination of hydrogenase activity using an anaerobic spectrophotometric device. Anal. Biochem. 1982, 120, 85–90. [Google Scholar] [CrossRef]
Figure 1.
Current draw in a MES reactor filled with sterile fresh 311 medium at different cathode potentials. Results shown are from a representative example of three replicate.
Figure 1.
Current draw in a MES reactor filled with sterile fresh 311 medium at different cathode potentials. Results shown are from a representative example of three replicate.

Figure 2.
Current draw in a MES reactor containing a S. ovata cell suspension at a cathode potential of −900 mV vs. Ag/AgCl. Results shown are from a representative example of three replicate.
Figure 2.
Current draw in a MES reactor containing a S. ovata cell suspension at a cathode potential of −900 mV vs. Ag/AgCl. Results shown are from a representative example of three replicate.

Figure 3.
Current draw in a MES reactor containing cell-free spent medium from an electrosynthetic S. ovata culture. Results shown are from a representative example of three replicate.
Figure 3.
Current draw in a MES reactor containing cell-free spent medium from an electrosynthetic S. ovata culture. Results shown are from a representative example of three replicate.

Figure 4.
H2 evolution rate with fresh sterile medium, S. ovata cell suspension and cell-free spent medium. (A) Cathode potential at −900 mV vs. Ag/AgCl and (B) cathode potentials ranging from −850 to −500 mV. Above −500 mV vs. Ag/AgCl, no H2 evolution was detected under all tested conditions. No H2 evolution was detected with S. ovata cell suspension above −900 mV vs. Ag/AgCl. Each result is the mean and standard deviation of three replicates.
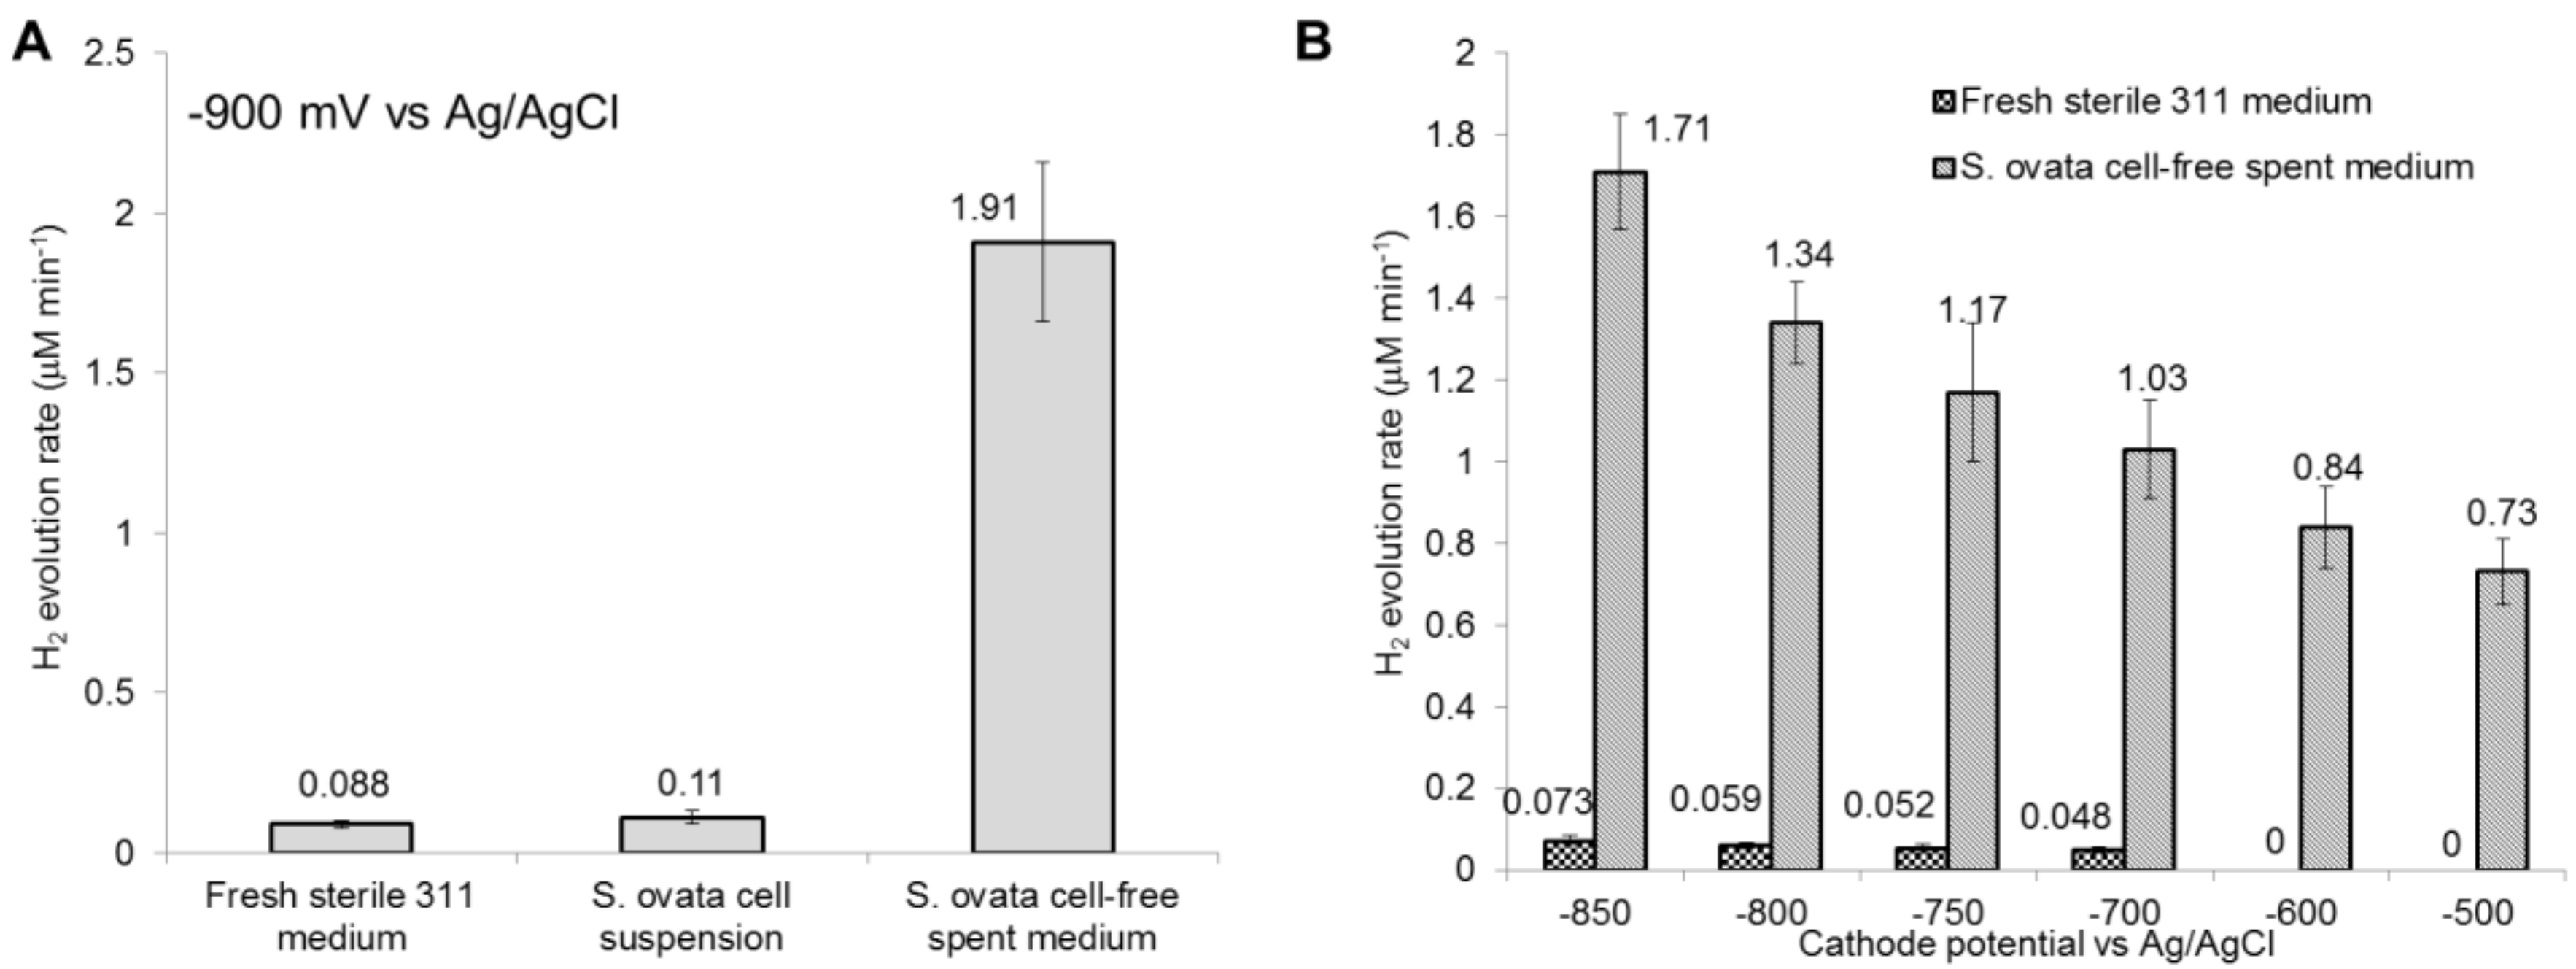
Figure 5.
EDS spectra (from 0.0 to 4 KeV) of the cathode electrode surface after exposure to cell-free spent medium from electrosynthetic S. ovata (A,B) or to sterile fresh 311 medium (C).
Figure 5.
EDS spectra (from 0.0 to 4 KeV) of the cathode electrode surface after exposure to cell-free spent medium from electrosynthetic S. ovata (A,B) or to sterile fresh 311 medium (C).

Table 1.
H2 evolution, current density and electrons recovery in MES reactors with sterile fresh 311 medium a.
Table 1.
H2 evolution, current density and electrons recovery in MES reactors with sterile fresh 311 medium a.
| Potential vs. Ag/AgCl (mV) | H2 Evolution Rates (µM min−1) | Current Density (mA m−2) | Electrons Recovery in H2 (%) |
|---|---|---|---|
| −900 | 0.088 ± 0.012 | −19.8 ± 2.1 | 87 ± 1.8 |
| −850 | 0.073 ± 0.010 | −16.3 ± 1.7 | 85 ± 3.7 |
| −800 | 0.059 ± 0.008 | −14.9 ± 1.8 | 80 ± 2.1 |
| −750 | 0.052 ± 0.011 | −13.7 ± 1.2 | 79 ± 9.0 |
| −700 | 0.048 ± 0.007 | −12.8 ± 1.0 | 78 ± 7.0 |
| −600 | n.d. b | n/a c | n/a |
a Each result is the mean and standard deviation of three replicates. b Not detected. c Not applicable.
Table 2.
H2 evolution, current density and electrons recovery in MES reactors with S. ovata cell suspension a.
Table 2.
H2 evolution, current density and electrons recovery in MES reactors with S. ovata cell suspension a.
| Potential vs. Ag/AgCl (mV) | H2 Evolution Rates (µM min−1) | Current Density (mA m−2) | Electrons Recovery in H2 (%) |
|---|---|---|---|
| −900 | 0.11 ± 0.02 | −317 ± 32 | 8.5 ± 1.5 |
| −850 | n.d. b | n/a c | n/a |
| −800 | n.d. | n/a | n/a |
| −750 | n.d. | n/a | n/a |
| −700 | n.d. | n/a | n/a |
| −600 | n.d. | n/a | n/a |
a Each result is the mean and standard deviation of three replicates. b Not detected. c Not applicable.
Table 3.
H2 evolution, current density and electrons recovery in MES reactors with cell-free spent medium a.
Table 3.
H2 evolution, current density and electrons recovery in MES reactors with cell-free spent medium a.
| Potential vs. Ag/AgCl (mV) | H2 eVolution Rates (µM min−1) | Current Density (mA m−2) | Electrons Recovery in H2 (%) |
|---|---|---|---|
| −900 | 1.91 ± 0.25 | −398 ± 90 | 87 ± 8.4 |
| −850 | 1.71 ± 0.14 | −320 ± 86 | 89 ± 8.0 |
| −800 | 1.34 ± 0.10 | −289 ± 38 | 85 ± 7.9 |
| −750 | 1.17 ± 0.17 | −276 ± 51 | 80 ± 3.2 |
| −700 | 1.03 ± 0.12 | −254 ± 60 | 75 ± 3.0 |
| −600 | 0.84 ± 0.10 | −225 ± 47 | 74 ± 5.9 |
| −500 | 0.73 ± 0.08 | −179 ± 42 | 77 ± 9.0 |
| −400 | n.d. b | n/a c | n/a |
a Each result is the mean and standard deviation of three replicates. b Not detected. c Not applicable.
© 2019 by the authors. Licensee MDPI, Basel, Switzerland. This article is an open access article distributed under the terms and conditions of the Creative Commons Attribution (CC BY) license (http://creativecommons.org/licenses/by/4.0/).
Share and Cite
MDPI and ACS Style
Tremblay, P.-L.; Faraghiparapari, N.; Zhang, T. Accelerated H2 Evolution during Microbial Electrosynthesis with Sporomusa ovata. Catalysts 2019, 9, 166. https://doi.org/10.3390/catal9020166
AMA Style
Tremblay P-L, Faraghiparapari N, Zhang T. Accelerated H2 Evolution during Microbial Electrosynthesis with Sporomusa ovata. Catalysts. 2019; 9(2):166. https://doi.org/10.3390/catal9020166
Chicago/Turabian StyleTremblay, Pier-Luc, Neda Faraghiparapari, and Tian Zhang. 2019. "Accelerated H2 Evolution during Microbial Electrosynthesis with Sporomusa ovata" Catalysts 9, no. 2: 166. https://doi.org/10.3390/catal9020166
Note that from the first issue of 2016, this journal uses article numbers instead of page numbers. See further details here.