Preparation and Analysis of Ni–Co Catalyst Use for Electricity Production and COD Reduction in Microbial Fuel Cells


Institute of Environmental Engineering and Biotechnology, Faculty of Natural Sciences and Technology, University of Opole, Kominka Str. 6, 45-032 Opole, Poland
*
Authors to whom correspondence should be addressed.
Catalysts 2019, 9(12), 1042; https://doi.org/10.3390/catal9121042
Submission received: 31 October 2019
/
Revised: 22 November 2019
/
Accepted: 5 December 2019
/
Published: 8 December 2019
(This article belongs to the Special Issue New Trends in Photo(Electro)catalysis: From Wastewater Treatment to Energy Production)
Abstract
:Microbial fuel cells (MFCs) are devices than can contribute to the development of new technologies using renewable energy sources or waste products for energy production. Moreover, MFCs can realize wastewater pre-treatment, e.g., reduction of the chemical oxygen demand (COD). This research covered preparation and analysis of a catalyst and measurements of changes in the concentration of COD in the MFC with a Ni–Co cathode. Analysis of the catalyst included measurements of the electroless potential of Ni–Co electrodes oxidized for 1–10 h, and the influence of anodic charge on the catalytic activity of the Ni–Co alloy (for four alloys: 15, 25, 50, and 75% concentration of Co). For the Ni–Co alloy containing 15% of Co oxidized for 8 h, after the third anodic charge the best catalytic parameters was obtained. During the MFC operation, it was noted that the COD reduction time (to 90% efficiency) was similar to the reduction time during wastewater aeration. However, the characteristic of the aeration curve was preferred to the curve obtained during the MFC operation. The electricity measurements during the MFC operation showed that power equal to 7.19 mW was obtained (at a current density of 0.47 mA·cm−2).
1. Introduction
Microbial fuel cells (MFCs) are a technology of electric energy generation using organic matter contained in wastewater [1,2]. Thus, this technology allows the production of energy from waste products (e.g., wastewater, also industry wastewater) [1,3,4,5,6,7,8,9]. Moreover, MFCs allow for wastewater pretreatment, e.g., reduction of the chemical oxygen demand (COD) concentration. The first observations of electricity production by bacteria were conducted by Potter [10]. However, greater progress in the development of this technology was only achieved in the 1960s [11,12,13]. Because of the increasing pollution of the environment, research on MFC technology resumed in the 1990s [14,15,16], but real development of these technology has only happened in recent years [1,2,3,4,5,6,7,17,18,19,20,21,22,23,24,25].
MFC forms a bio-electrochemical system in which bacteria oxidize organic matter by acting as a biocatalyst. Therefore, organic matter constitutes the fuel applied for the production of electricity [1,2,3,4,12,22]. This system includes electrodes in the electrode chambers, usually separated by a proton exchange membrane (PEM) [26]. On the anode, bacteria oxidize organic matter to produce e− electrons and H+ ions (as well as an additional volume of CO2), whereas H2O is generated on the cathode through the reaction of e− ions combined with H+ and O2 [1,2,3,4,22]. This is a result of cathode aeration in the cathode chamber. Among many other genera, the Shewanella spp., Pseudomonas spp., or Geobacter spp. bacteria are capable of generating electrons [21,27,28,29,30,31,32,33,34]. Studies have demonstrated that the highest current values in MFC are generated by using multicultural microorganisms. They have higher efficiency in relation to microorganisms accumulated in monocultures, as a result of the competition between the bacterial cultures [35]. Research into the peak limits of the current density and power level of MFC is still at an experimental stage. The limitation of the maximum power density or current density is the result of the low rate of reactions on electrodes [1,2,3,4,36,37]. The rate of the processes taking place on the electrodes is primarily influenced by the type of applied catalyst. Since the role of the anode catalyst is taken over by microorganisms, it is important to look for an adequate cathode catalyst. Because of the excellent catalytic properties, platinum is most commonly used as the catalyst [38,39]. Unfortunately, it is also characterized by high price. Therefore, it is necessary to look for other catalysts that do not contain precious metals [40,41,42,43,44,45,46,47]. As electrodes (also as catalysts) do not contain precious metals, different electrode materials (carbon fiber brush, carbon felt, carbon foam, carbon cloth, graphite paper, and others) were analyzed in various works [48,49,50,51,52,53,54,55,56]. Of these materials, the most efficient anode material is carbon felt. The lowest parameters during MFC operation were obtained using carbon cloth as electrodes. However, it was found that it was also possible to use metal electrodes (also as metal electrodes with metal catalysts) as the cathodes of microbial fuel cells [1,7,8,22,41,57,58]. Nickel is also characterized by good catalytic properties. However, pure nickel (Raney Ni, the most commonly used form of nickel catalyst) is difficult to use, e.g., it should never be exposed to air. Even after preparation, Raney Ni still contains small amounts of hydrogen gas and may spontaneously ignite when exposed to air. Therefore, Ni (mainly as Raney Ni) is supplied as an aqueous suspension [59]. Therefore, nickel alloys should be easier (also safer) to use while maintaining good catalytic properties. Additionally, other metals and metal alloys are used as catalysts. One of them is cobalt and its alloys. These materials have also been used or analyzed during research as a catalytic material [60,61,62,63,64,65].
The description of the current density applies the Butler–Volmer exponential function. However, this function only leads to an output in the form of a theoretical value, which usually deviates significantly from the values that are obtained experimentally in comparable circumstances [38,66]. Therefore, it is necessary to conduct experimental research concerned with the selection of a catalyst suitable for a specific substance (in this case a substance employed as the waste material) that further constitutes the fuel applied in MFC [1,2,38,48,49,50,51,52,53,54,55,66]. The selection of a catalyst has an effect on the final cost of electricity production and the expenses associated with pre-treatment of wastewater for the needs of MFC. Because of the large amount of wastewater, it is necessary to provide its treatment, which incurs huge expenses [67]. However, the energy potential of wastewater allows it to be considered in the role of a potential source of energy in future applications, primarily as fuel for MFCs. MFCs are understood as an element that can support the traditional wastewater treatment techniques, as its role is primarily concerned with reducing COD concentration.
In this work the possibility of using a nickel–cobalt alloy (Ni–Co) in MFC was analyzed. The analysis concerned the use of Ni–Co alloy as a cathode catalyst for electricity production and COD reduction.
2. Results and Discussion
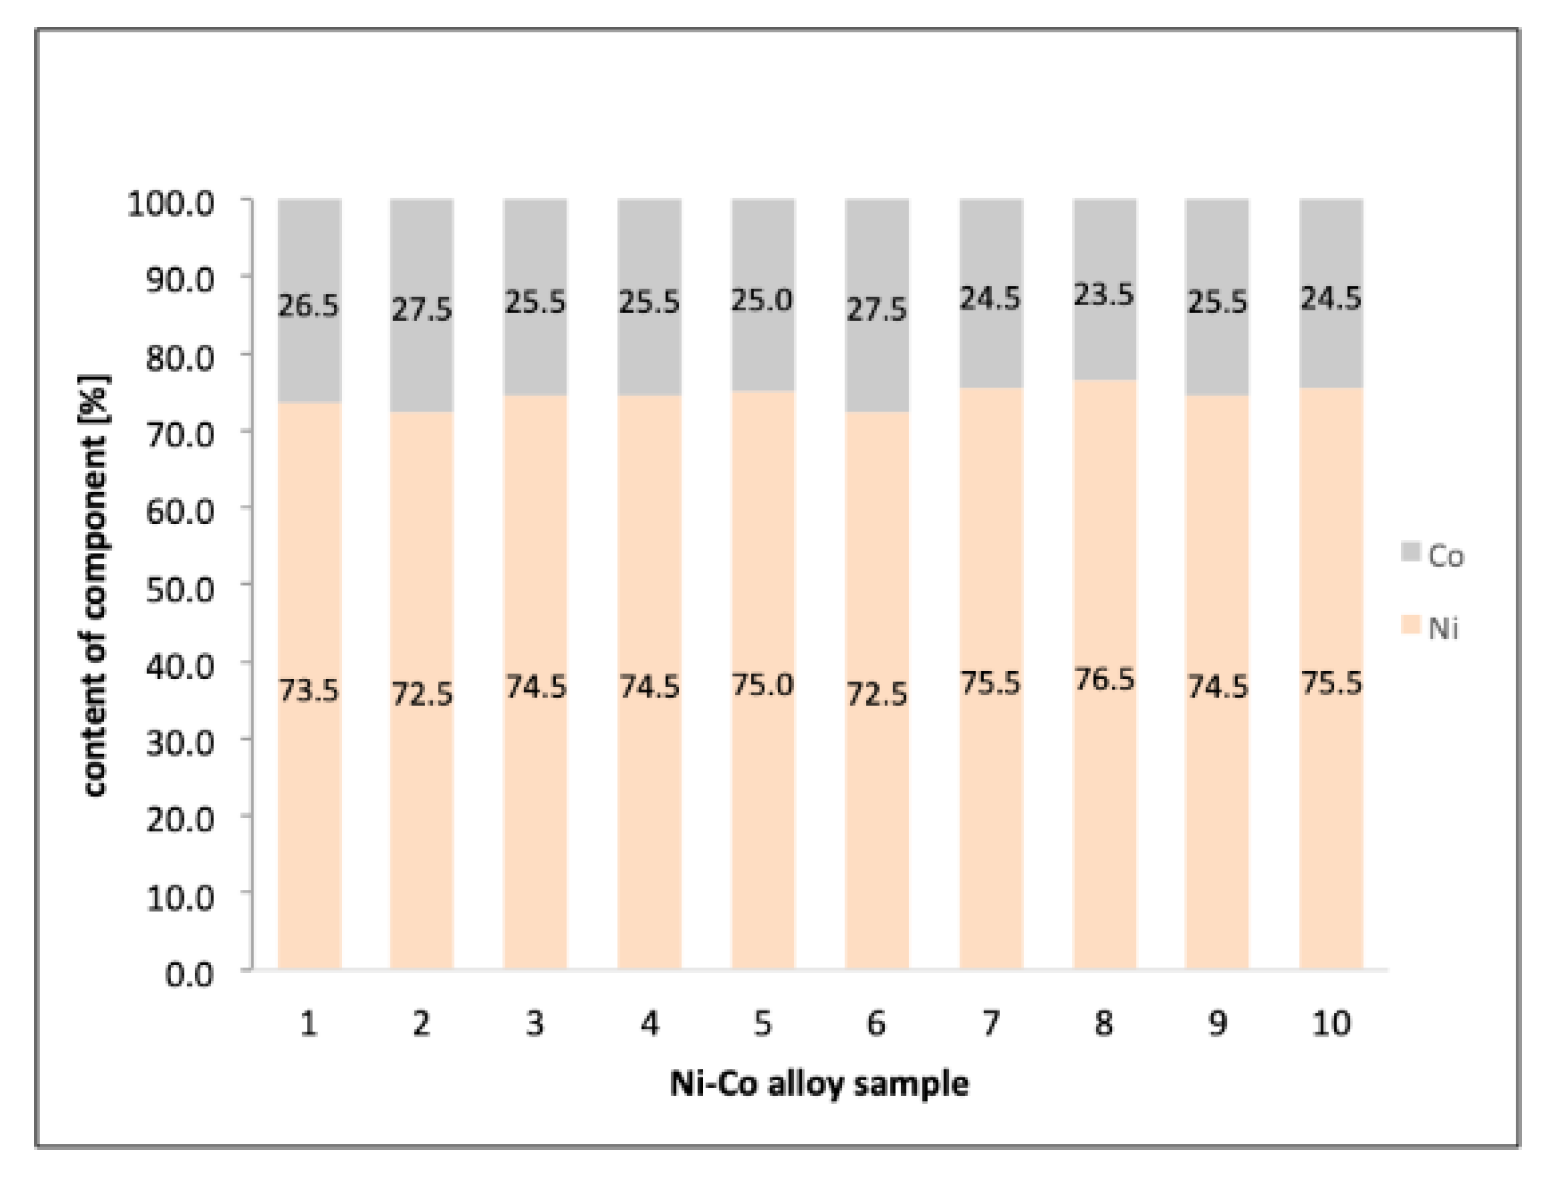
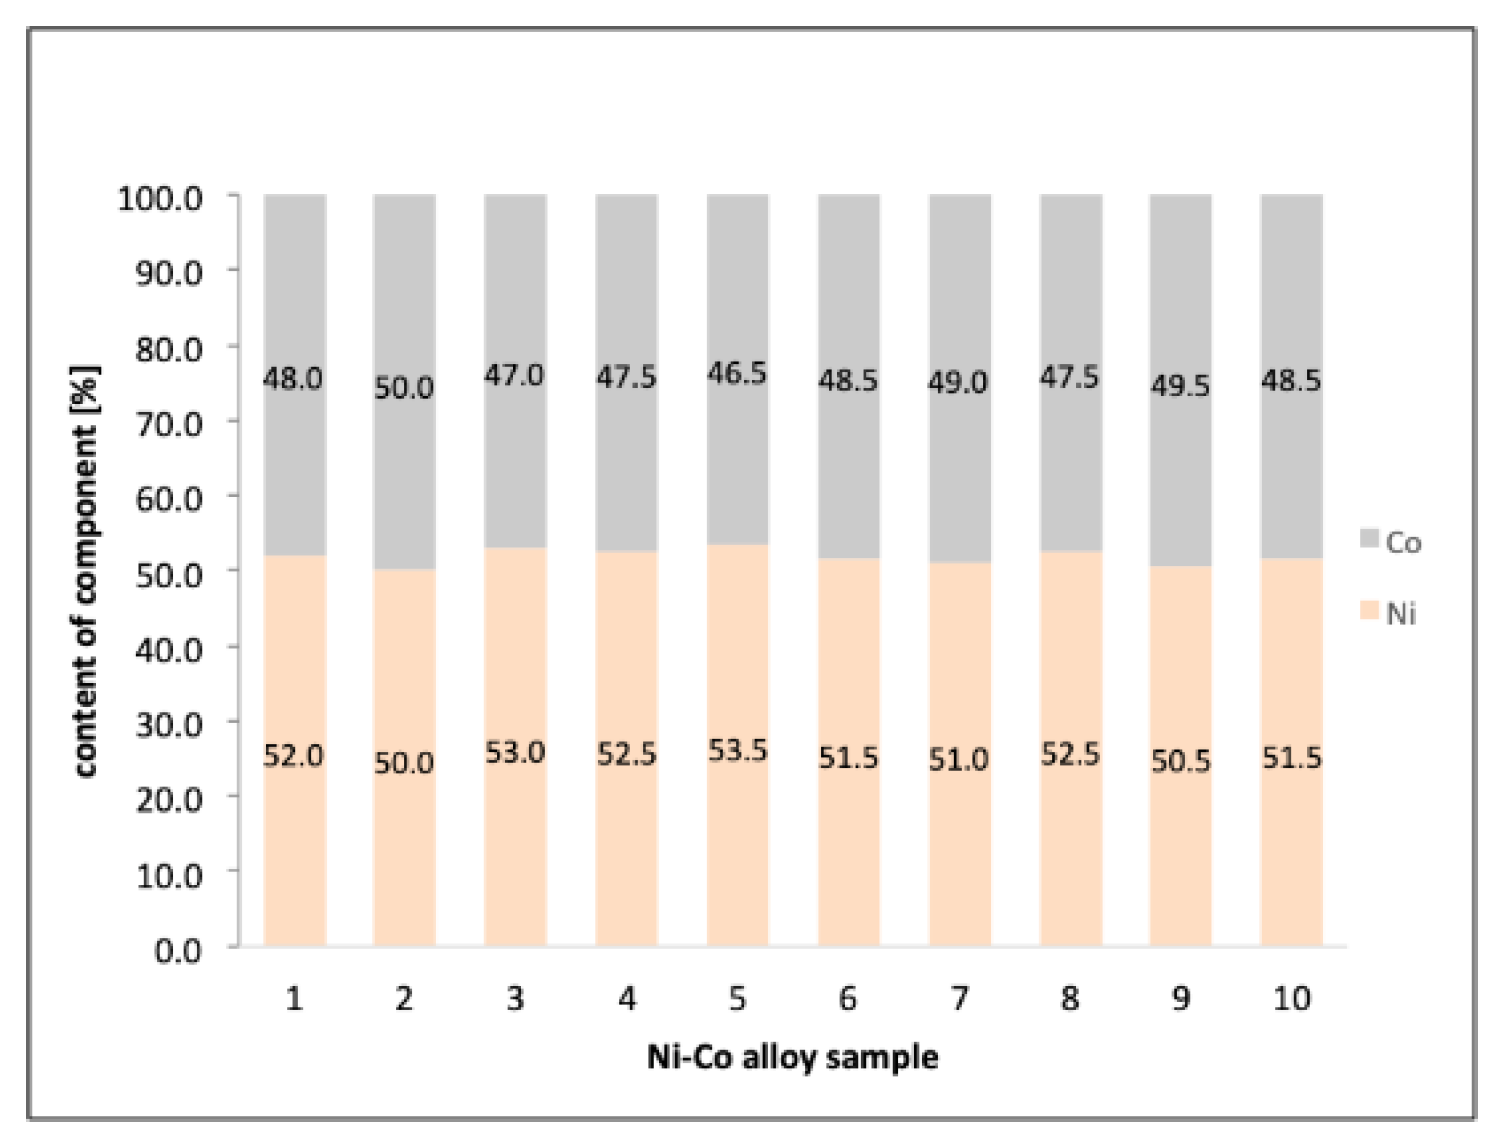
Figure 1, Figure 2, Figure 3 and Figure 4 show the concentrations of Ni and Co in the alloy samples obtained by the method of electrochemical deposition for planned 15, 25, 50, and 75% concentrations of Co.
Figure 1, Figure 2, Figure 3 and Figure 4 allow visualization and understanding that it is necessary not only to preserve the deposition parameters, but also to sort and select the resulting alloys. This necessity arises from the fact that despite maintaining constant deposition parameters, different alloy compositions were obtained in corresponding cases.
For further research, the following Ni–Co alloy samples were selected: 7 (15% of Co; Figure 1), 5 (25% of Co; Figure 2), 2 (50% of Co; Figure 3), and 1 (75% of Co; Figure 4).
Ni–Co alloys that contained exactly 15, 25, 50, and 75% of Co were selected. These alloys were oxidized for 1, 2, 4, 6, 8, and 10 h. Next, measurements were carried out according to the methodology presented in Section 3.2. Before oxidation, all samples were gray, but after oxidation over 4, 6, and 8 h, the surfaces of the samples were multi-colored, while after oxidation over 10 h, the color of the sample surfaces changed to black.
Figure 5 and Figure 6 show stabilization of the electroless potential in the glass half-cell, with the Ni–Co work electrode (oxidized for 1 and 2 h) in alkaline electrolyte (aqueous solution of KOH). 7,8 show alloy oxidized for 4 and 6 h. 9,10 show alloys oxidized for 8 and 10 h.
The data (Figure 5, Figure 6, Figure 7, Figure 8, Figure 9 and Figure 10) show that during each measurement, the electroless potential was the highest for the Ni–Co catalyst with 15% of Co. Moreover, the highest electroless potential was obtained for Ni–Co electrodes oxidized for 8 h (Figure 9).
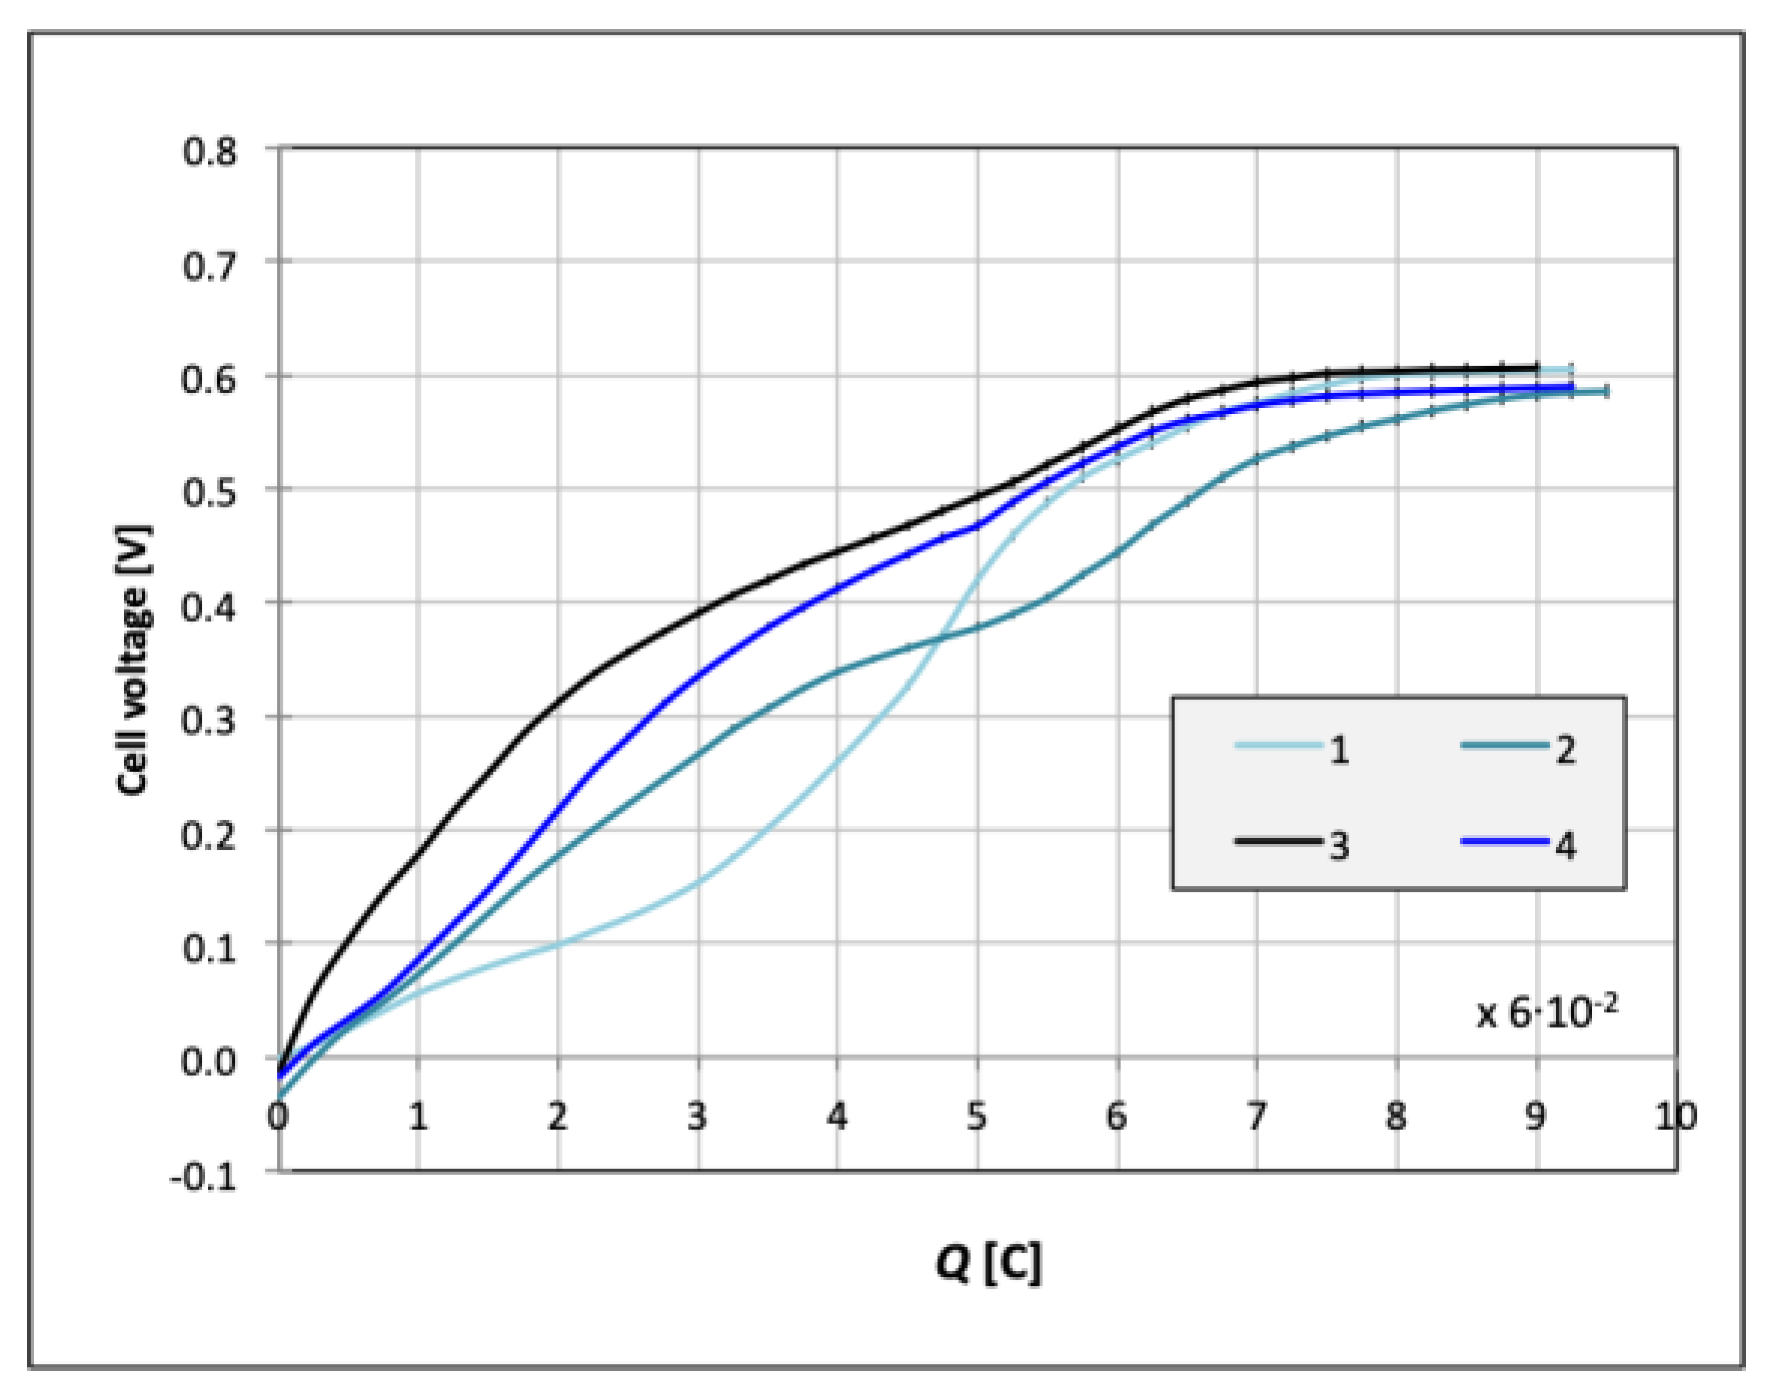
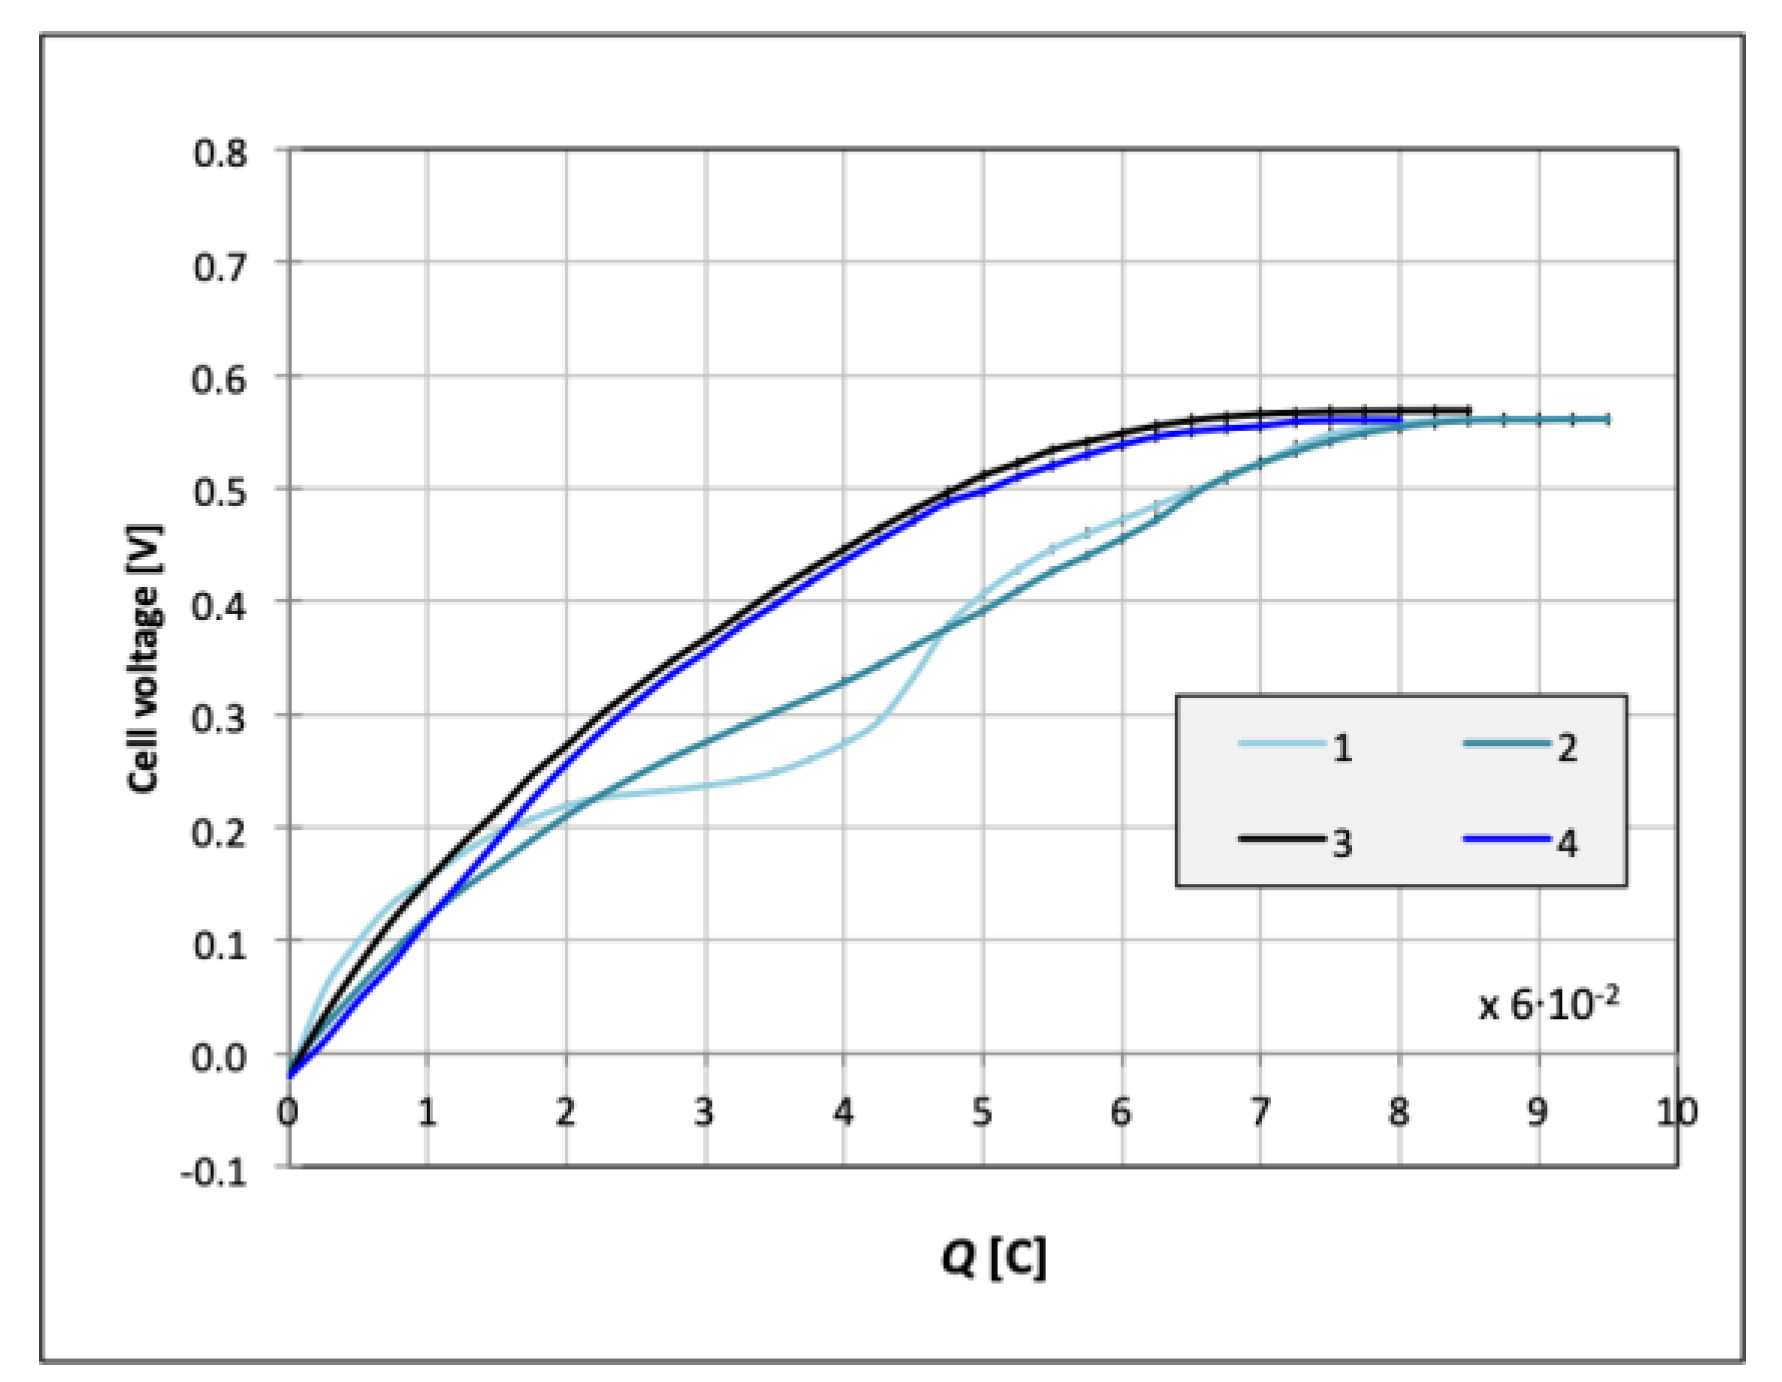
The analysis of the samples also demonstrated that oxides of lower order, NiO and CoO, were generated during oxidation lasting from 1 to 8 h. However, during oxidation taking over 10 h, NiCo2O4 and Co3O4 oxides were formed, which decreased the electroless potential (Figure 10) [68,69,70,71,72,73,74]. Therefore, the next measurements, including the influence of anodic charge on the catalytic activity of the Ni–Co catalyst (described in Section 3.2), were performed for the alloy samples oxidized for 8 h (Figure 11, Figure 12, Figure 13 and Figure 14). Colored lines (1–4) in Figure 11, Figure 12, Figure 13 and Figure 14 refer to the subsequent anodic charges.
In the next step, the MFCs (described in Section 3.3) with different cathodes (with different contents of Co, and after oxidation of electrodes for 1–10 h) were built. Table 1 shows the maximum power and average cell voltage obtained in MFCs, with Ni–Co cathodes oxidized for 1–8 h, without anodic charge before using the electrodes (cathodes).
The highest parameters (power and cell voltage) for the MFC with electrodes oxidized for 8 h were obtained. Thus, these electrodes were chosen for further measurements of the MFCs (with electrodes after the anodic charge). Table 1 shows the maximum power and average cell voltage obtained in MFCs, with Ni–Co cathodes (15% of Co), and oxidized for 8 h, with anodic charge before using the electrodes (cathodes).
The cell voltage of the third anodic charging of the electrode was also highest for the same catalyst (15% Co) (Figure 11, Figure 12, Figure 13 and Figure 14, Table 1). Such parameters (Figure 5, Figure 6, Figure 7, Figure 8, Figure 9, Figure 10, Figure 11, Figure 12, Figure 13 and Figure 14, Table 1 and Table 2) show that the Ni–Co electrode with 15% of Co showed high performance. Figure 15 shows the cell voltage and Figure 16 shows the power curves during the MFC with the highest parameter electrode (Ni–Co cathode with 15% of Co, and after triple the anodic charge) operation.
Figure 17 shows the COD reduction in time in the three reactors without aeration, with aeration, and during the operation of MFC with the highest parameter electrode (Ni–Co cathode with 15% of Co, and after triple the anodic charge) and with the carbon cloth electrode.
On the basis of the results of the measurements of the electrode potential, we can state that among all analyzed Ni and Co concentrations, the highest value was obtained for oxidized alloys over 8 h at 673 K. In addition, for all oxidation times, the highest values of electrode potential were obtained by an alloy containing 15% Co. A similar outcome was obtained when the electrode potential was performed after anodic charging. In each case, the alloy with the composition comprising 15% Co had the higher catalytic activity of the analyzed alloys. In the case of triple anode charging using this alloy (15% Co), the most favorable potential curve was derived. Therefore, the alloy containing 15% Co, after 8 h of oxidation and three times anode loading, was selected for further measurements by application of MFC. MFC (third reactor, see Section 3.3, Figure 18) was investigated in a setup combined with a Ni–Co cathode and for comparison with a cathode made of carbon cloth. During the MFC operation, the levels of COD reduction to the effectiveness of 90% were recorded: 15 days for a Ni–Co catalyst, and 18 days for the carbon cloth catalyst. In comparison to the data regarding the reactor with aeration (Figure 15, blue line), this time was longer by 3 days for the carbon cloth catalyst (Figure 17, black line), and the same for a Ni–Co catalyst (Figure 17, red line). However, the characteristics of the COD decline curve were comparably less favorable when MFC was applied, as using the aeration taking 5 days resulted in an 84.8% decrease in the initial COD level (Figure 17, blue line). We should note that similar results were obtained for the Cu–B catalyst in the conditions when similar wastewater parameters were employed; however, the use of Ni–Co alloy as a catalyst provided slightly better parameters (shorter COD reduction time) compared to that based on the Cu–B alloy [8,22,75].
The measurement of the cell potential demonstrated higher potential during MFC operation of the Ni–Co catalyst than for the case when the carbon cloth was employed (Figure 15). During MFC operation, 5.63 mW of power (with the carbon cloth cathode) and 7.19 mW of power (with the Ni–Co cathode) were obtained (Figure 16). The analysis of the current density (based on data from power measurements and the area of electrodes) showed that the current density for the Ni–Co catalyst reached a maximum of 0.47 mA·cm−2, and 0.23 mA·cm−2 for carbon cloth. The maximum power obtained during the operation of MFC with Ni–Co alloy, was slightly higher (by 1.08 mW) compared to the maximum power obtained during the operation of MFC with a Cu–B cathode (6.11 mW) [22,75].
3. Materials and Methods
3.1. Preparation of a Ni–Co Cathode
The electrochemical deposition technique was applied to obtain Ni–Co alloy. A copper mesh was used as the electrode to apply the catalyst (i.e., Ni–Co alloy). The electrolyte for alloying mainly consisted of a mixture of NiSO4 and CoSO4 [7,76]. The electrochemical deposition was carried out at temperatures of 293–323 K, at a current density of 1–3 A·dm−2, and at pH 2.0–5.5 [7]. Prior to the application process of electrolytic alloy, the copper mesh was first washed with 25% aqueous KOH to ensure its adequate wettability. The next step involved its washing in acetic acid and then in alcohol [22].
On the basis of previous studies [7], alloys containing 15, 25, 50, and 75% content of Co were selected for measurement. The temperature, pH, and current density of electrochemical deposition (to obtain different contents of Ni and Co in the alloys) were selected experimentally, but according to the previously proposed methodology for obtaining the alloy [7]. For further measurements, the Ni–Co electrodes with different contents of Co were selected by the XRD method. During electrochemical deposition, for all of the planned alloys (15, 25, 50, and 75% of Co) the ten different alloys with similar concentrations of Co were obtained according to a previously developed methodology [7,76]. Based on the research results (Figure 1, Figure 2, Figure 3 and Figure 4), for further research, the following alloy samples were selected: 7 (15% of Co; Figure 1), 5 (25% of Co; Figure 2), 2 (50% of Co; Figure 3), and 1 (75% of Co; Figure 4).
The selection was carried out using a single-crystal X-ray diffractometer (Xcalibur, Oxford Diffraction, UK).
3.2. Selection of the Ni–Co Electrodes for Measurement
First, measurements of the stationary potential of the electrodes were performed in order to assess the oxidation activity of the Ni–Co electrodes (with different contents of Ni and Co). Since the electrode is constantly oxidized during the operation of MFC, it was necessary to pre-oxidize the electrodes, otherwise, the electrodes would change their catalytic properties (along with the level of oxidation of the electrode surface) throughout their operation of MFC. The oxidation temperature of all of the Ni–Co alloy samples was 673 K. The oxidation times were 1, 2, 4, 6, 8, and 10 h. Next, we measured the influence of anodic charge on the catalytic activity of the Ni–Co alloy. These measurements were carried out in a glass half-cell (250 mL3) with the use of a potentiostat (Figure 18; 5). An aqueous solution of KOH (2 M) was used as the electrolyte. A saturated calomel electrode (SCE) was used as the reference electrode [7,22,77].
The KS 520/14 silt furnace (ELIOG Industrieofenbau GmbH, Römhild, Germany) was used for electrode oxidation. The experiments of the influence of anodic charge on the catalytic activity of the Ni–Co alloy were conducted using an AMEL System 500 potentiostat (Figure 18; 6) (Amel S.l.r., Milano, Italy). The potentiostat was controlled by a computer using CorrWare software (Scribner Associates Inc., Southern Pines, NC, USA).
3.3. Measurements of Electricity Production and COD Reduction during the Operation of MFC (with Ni–Co Cathode)
The following phase involved the analysis of the Ni–Co alloy in the function of the cathode catalyst in MFC. The research included measurements of COD decline and electric energy production during the operation of the microbial fuel cell.
Waste material was applied to serve as fuel for MFC with Ni–Co cathodes. For this purpose, wastewater (WW) derived from the municipal wastewater treatment plant (WWTP) was used. Table 3 contains the COD concentration and pH of the WW applied in the measurements.
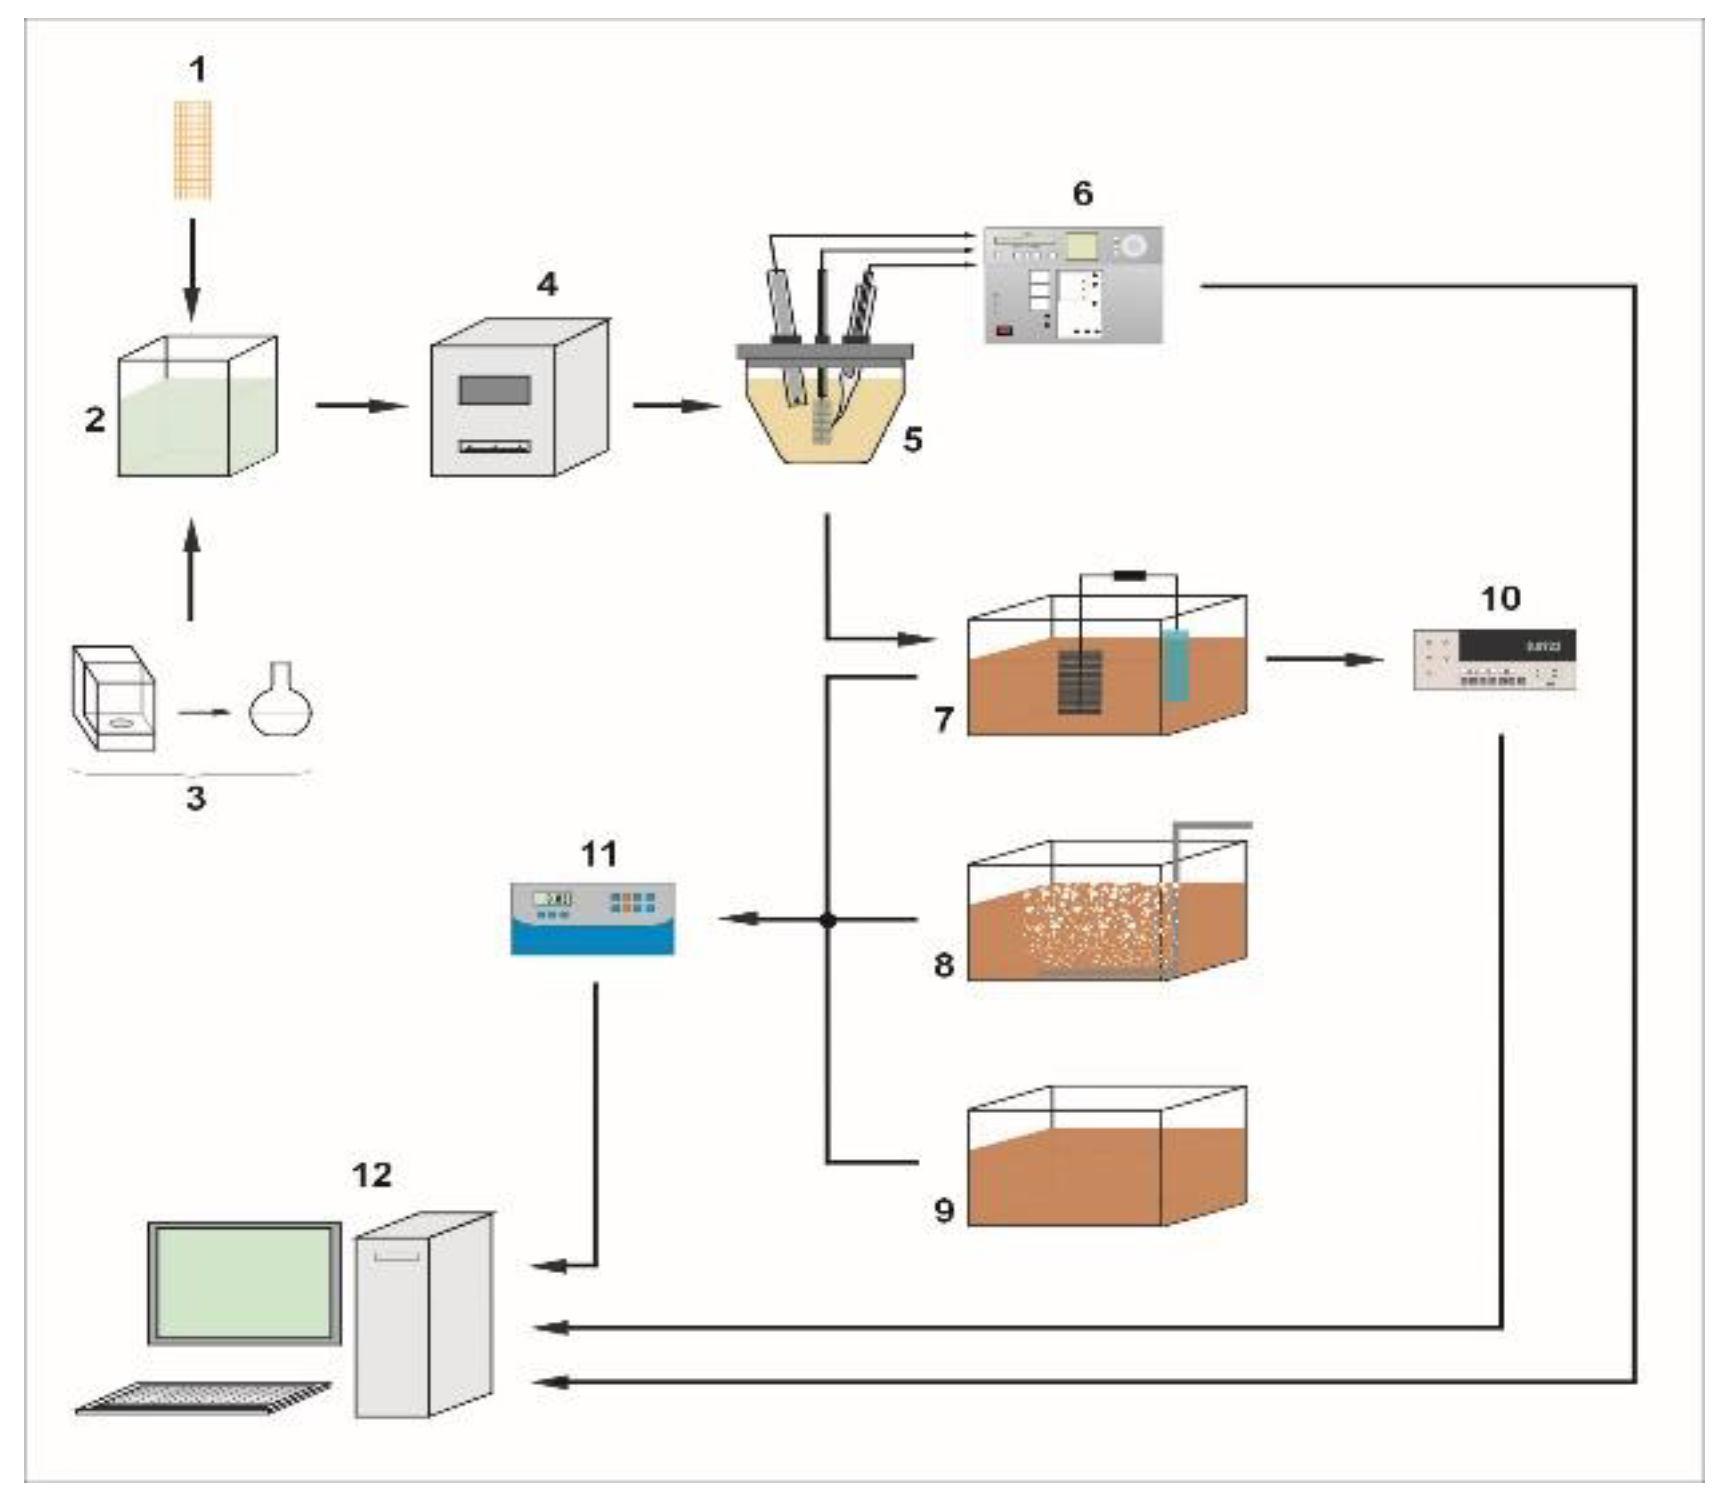
To assess the effectiveness of COD reduction in the microbial fuel cell, the following were compared: COD reduction time in MFC, COD reduction time in WW without interference, and COD reduction time accompanying WW aeration. To this end, three reactors were applied: one without aeration (Figure 18; 9), one with aeration (Figure 18; 8), and one containing MFC (Figure 18; 7). Figure 18 shows the scheme of the measurements.
Electrical parameters of the MFC were measured in parallel (at the same time) with the COD reduction [7,22,78]. All reactors had the same dimensions, and therefore the same volume of WW (15 L) [7,22]. The reactors worked at the same time, and were filled with the same WW. Measurements of COD were performed in all reactors until obtaining a 90% reduction of COD [20,78]. In the reactor with aeration, an interface between the WW and air occurred only at the WW surface [5,20,75]. For the aeration of the WW, the air pump was used (air pump capacity: 270 L·h−1) [7,22]. The MFC included a carbon cloth anode, a Ni–Co cathode, and a Nafion PEM. After the measurements of the MFC with the Ni–Co cathode, measurements of the MFC with the carbon cloth cathode were also made. In both cases (for measurements of the MFC), the surface area of the anode was 20 cm2, and the surface area of the cathode was 15 cm2. The cathode was immersed in 0.1 N aqueous solution KOH and aerated (air pump capacity: 10 L·h−1) [22]. The electrodes of the MFC were constantly connected with a 10 Ω resistor [5,20]. Microorganisms were acclimated for 5 days [1,2,22,78].
Nafion PF 117 (183 μm thick) (The Chemours Company, Wilmington, DE, USA) was used as the PEM. A Zortrax M200 printer (Zortrax S.A, Olsztyn, Poland) was used to print the housing of the cathode (Figure 18; 7). To prepare the 3D object (cathode housing) for printing, Z-Suite software (Zortrax S.A, Olsztyn, Poland) was used. A Hanna HI 83224 colorimeter (HANNA Instruments, Woonsocket, RI, USA) was applied for the COD measurement in WW. A Fluke 8840A multimeter (Fluke Corporation, Everett, WA, USA) was used for the electrical measurements.
4. Conclusions
This paper reports the results of a study concerned with methodology applicable for the production and selection of Ni–Co alloy as a cathode catalyst for MFC fed by municipal WW. Following that, measurements were performed with the application of the resulting alloys. As was demonstrated by the research, the most favorable catalytic parameters were obtained when a Ni–Co alloy containing 15% Co was applied, which was oxidized over 8 h at 673 K. This alloy demonstrated the highest value of the electroless potential (Figure 5, Figure 6, Figure 7, Figure 8, Figure 9 and Figure 10) and the cell potential after charging as an anode (Figure 11, Figure 12, Figure 13 and Figure 14). For this reason, this alloy was applied as a cathode catalyst (Figure 18; 7) in further measurements using MFC.
The measurements concerned with COD reduction also demonstrated that in each of the analyzed cases (without aeration, with aeration, and using MFC), the assumed level of reduction was 90%. The time of COD reduction using MFC with Ni–Co cathode (15% Co) to the assumed level of 90% was 15 days (Figure 15). The time obtained was shorter (by 3 days) than the time of COD reduction using MFC with a carbon cloth electrode, and also shorter than when an electrode with a Cu–B catalyst was applied [22,75].
During MFC (with Ni–Co cathode, 15% Co) operation, a current density of 0.47 mA·cm−2 and a power of 7.19 mW were recorded (Figure 17). For comparison, in MFC with the carbon cloth cathode, a current density of 0.23 mA·cm−2 and a power of 5.63 mW were recorded.
The maximum power obtained during the operation of MFC with Ni–Co alloy was slightly higher (by 1.56 mW) than the maximum power obtained during the operation of MFC with the carbon cloth cathode (Figure 16), and slightly higher (by 1.08 mW) than the maximum power obtained during the operation of MFC with the Cu–B cathode [22,75].
For these reasons, this article demonstrated the applicability of a Ni–Co alloy (containing 15% of Co) as a cathode catalyst in a microbiological fuel cell, which is based on the supply of municipal WW. At the same time, the higher catalytic activity of a Ni–Co catalyst (containing 15% of Co) was demonstrated compared to a carbon cloth, as well as compared to a Cu–B catalyst.
Author Contributions
Data curation, P.P.W. and B.W.; investigation, P.P.W. and B.W.; methodology, P.P.W.; writing—Review and editing, P.P.W. and B.W.; supervision, P.P.W. and B.W.
Funding
This research received no external funding.
Conflicts of Interest
The authors declare no conflict of interest.
References
- Logan, B. Microbial Fuel Cells; Wiley: Hoboken, NJ, USA, 2008. [Google Scholar]
- Logan, B.E.; Hamelers, B.; Rozendal, R.; Schroder, U.; Keller, J.; Verstraete, W.; Rabaey, K. Microbial Fuel Cells: Methodology and Technology. Environ. Sci. Technol. 2006, 40, 5181–5192. [Google Scholar] [CrossRef] [PubMed]
- Rabaey, K.; Verstraete, W. Microbial fuel cells: Novel biotechnology for energy generation. Trends Biotechnol. 2005, 23, 291–298. [Google Scholar] [CrossRef] [PubMed]
- Sivasankar, V.; Mylsamy, P.; Omine, K. Microbial Fuel Cell Technology for Bioelectricity, 1st ed.; Springer: Berlin, Germany, 2018. [Google Scholar]
- Permana, D. Performance of Single Chamber Microbial Fuel Cell (SCMFC) for biological treatment of tofu wastewater. In Proceedings of the IOP Conference Series: Earth and Environmental Science, Saint Petersburg, Russia, 17–18 April 2019; Volume 277, p. 012008. [Google Scholar] [CrossRef]
- Włodarczyk, B.; Włodarczyk, P.P. Comparison of powering the microbial fuel cell with various kinds of wastewater. Infrastruct. Ecol. Rural Areas 2019, 2, 131–140. [Google Scholar] [CrossRef]
- Włodarczyk, P.P.; Włodarczyk, B. Microbial fuel cell with Ni-Co cathode powered with yeast wastewater. Energies 2018, 11, 3194. [Google Scholar] [CrossRef] [Green Version]
- Włodarczyk, B.; Włodarczyk, P.P. Microbial fuel cell with Cu–B cathode powering with wastewater from yeast production. J. Ecol. Eng. 2017, 18, 224–230. [Google Scholar] [CrossRef] [Green Version]
- Włodarczyk, B.; Włodarczyk, P.P. Analysis of the Potential of an Increase in Yeast Output Resulting from the Application of Additional Process Wastewater in the Evaporator Station. Appl. Sci. 2019, 9, 2282. [Google Scholar] [CrossRef] [Green Version]
- Potter, M.C. Electrical effects accompanying the decomposition organic compounds. Proc. R. Soc. Lond. Ser. B 1911, 84, 260–276. [Google Scholar] [CrossRef]
- Davis, J.B.; Yarbrough, H.F., Jr. Preliminary experiments on a microbial fuel cell. Science 1962, 137, 615–616. [Google Scholar] [CrossRef]
- Berk, R.S.; Canfield, J.H. Bioelectrochemical energy conversion. Appl. Microbiol. 1964, 12, 10–12. [Google Scholar]
- Lewis, K. Symposium on bioelectrochemistry of microorganisms: IV. Biochemical fuel cells. Bacteriol. Rev. 1966, 30, 101–113. [Google Scholar]
- Kim, H.J.; Hyun, M.S.; Chang, I.S.; Kim, B.H. A microbial fuel cell type lactate biosensor using a metal-reducing bacterium. Shewanella Putrefaciens J. Microbiol. Biotechnol. 1999, 9, 365–367. [Google Scholar]
- Kim, B.H.; Park, H.S.; Shin, P.K.; Chang, I.S.; Kim, H.J. Mediator-Less Biofuel Cell. U.S. Patent 5,976,719, 2 November 1999. [Google Scholar]
- Allen, R.M.; Benetto, H.P. Microbial fuel cells: Electricity production from carbohydrates. Appl. Biochem. Biotechnol. 1993, 39, 27–40. [Google Scholar] [CrossRef]
- Min, B.; Logan, B.E. Continuous electricity generation from domestic wastewater and organic substrates in a at plate microbial fuel cell. Environ. Sci. Technol. 2004, 38, 5809–5814. [Google Scholar] [CrossRef] [PubMed]
- Liu, H.; Ramnarayanan, R.; Logan, B.E. Production of electricity during wastewater treatment using a single chamber microbial fuel cell. Environ. Sci. Technol. 2004, 38, 2281–2285. [Google Scholar] [CrossRef]
- Min, B.; Cheng, S.; Logan, B.E. Electricity generation using membrane and salt bridge microbial fuel cells. Water Res. 2005, 39, 1675–1686. [Google Scholar] [CrossRef]
- Rabaey, K.; Alterman, P.; Clauwaert, P.; De Schamphelaire, L.; Boon, N.; Verstraete, W. Microbial fuel cells in relation to conventional anaerobic digestion technology. Eng. Life Sci. 2006, 6, 285–292. [Google Scholar]
- Franks, A.E.; Nevin, K.P. Microbial fuel cells, a current review. Energies 2010, 3, 899–919. [Google Scholar] [CrossRef]
- Włodarczyk, P.P.; Włodarczyk, B. Wastewater Treatment and Electricity Production in a Microbial Fuel Cell with Cu–B Alloy as the Cathode Catalyst. Catalysts 2019, 9, 572. [Google Scholar] [CrossRef] [Green Version]
- Cheng, S.; Liu, H.; Logan, B.E. Increased Power Generation in a Continuous Flow MFC with Advective Flow through the Porous Anode and Reduced Electrode Spacing. Environ. Sci. Technol. 2006, 40, 2426–2432. [Google Scholar] [CrossRef]
- Kimberlynn, C. Microbial Fuel Cell Possibilities on American Indian Tribal Lands; Sandia National Lab.(SNL-NM): Albuquerque, NM, USA, 2016. [Google Scholar] [CrossRef]
- Saha, T.C.; Protity, A.T.; Zohora, F.T.; Shaha, M.; Ahmed, I.; Barua, E.; Sarker, P.K.; Mukharjee, S.K.; Barua, A.; Salimullah, M.; et al. Microbial Fuel Cell (MFC) Application for Generation of Electricity from Dumping Rubbish and Identification of Potential Electrogenic Bacteria. Adv. Ind. Biotechnol. 2019, 2, 10. [Google Scholar] [CrossRef]
- Flimban, S.G.A.; Ismail, I.M.I.; Kim, T.; Oh, S.-E. Overview of Recent Advancements in the Microbial Fuel Cell from Fundamentals to Applications: Design, Major Elements, and Scalability. Energies 2019, 12, 3390. [Google Scholar] [CrossRef] [Green Version]
- Bond, D.R.; Lovley, D.R. Evidence for involvement of an electron shuttle in electricity generation by Geothrix fermentans. Appl. Environ. Microbiol. 2005, 71, 2186–2189. [Google Scholar] [CrossRef] [PubMed] [Green Version]
- Bond, D.R.; Lovley, D.R. Electricity production by Geobacter sulfurreducens attached to electrodes. Appl. Environ. Microbiol. 2003, 69, 1548–1555. [Google Scholar] [CrossRef] [PubMed] [Green Version]
- Kim, H.J.; Park, H.S.; Hyun, M.S.; Chang, I.S.; Kim, M.; Kim, B.H. A Mediator-Less Microbial Fuel Cell Using a Metal Reducing Bacterium. Shewanella Putrefaciens. Enzym. Microb. Technol. 2002, 30, 145–152. [Google Scholar] [CrossRef]
- Park, H.S.; Kim, B.H.; Kim, H.S.; Kim, H.J.; Kim, G.T.; Kim, M.; Chang, I.S.; Park, Y.K.; Chang, H.I. A novel electrochemically active and Fe(III)-reducing bacterium phylogenetically related to Clostridium butyricum isolated from a microbial fuel cell. Anaerobe 2001, 7, 297–306. [Google Scholar] [CrossRef]
- Chaudhuri, S.K.; Lovley, D.R. Electricity generation by direct oxidation of glucose in mediatorless microbial fuel cells. Nat. Biotechnol. 2003, 21, 1229–1232. [Google Scholar] [CrossRef]
- Pham, C.A.; Jung, S.J.; Phung, N.T.; Lee, J.; Chang, I.S.; Kim, B.H.; Yi, H.; Chun, J. A novel electrochemically active and Fe(III)-reducing bacterium phylogenetically related to Aeromonas hydrophila, isolated from a microbial fuel cell. FEMS Microbiol. Lett. 2003, 223, 129–134. [Google Scholar] [CrossRef] [Green Version]
- Reguera, G.; McCarthy, K.D.; Mehta, T.; Nicoll, J.S.; Tuominen, M.T.; Lovley, D.R. Extracellular electron transfer via microbial nanowires. Nature 2005, 435, 1098–1101. [Google Scholar] [CrossRef]
- Jenol, M.A.; Ibrahim, M.F.; Kamal Bahrin, E.; Kim, S.W.; Abd-Aziz, S. Direct Bioelectricity Generation from Sago Hampas by Clostridium beijerinckii SR1 Using Microbial Fuel Cell. Molecules 2019, 24, 2397. [Google Scholar] [CrossRef] [Green Version]
- Patil, S.A.; Surakasi, V.P.; Koul, S.; Ijmulwar, S.; Vivek, A.; Shouche, Y.S.; Kapadnis, B.P. Electricity generation using chocolate industry wastewater and its treatment in activated sludge based microbial fuel cell and analysis of developed microbial community in the anode chamber. Bioresour. Technol. 2009, 100, 5132–5139. [Google Scholar] [CrossRef]
- Logan, B.E.; Regan, J.M. Microbial fuel cells—Challenges and applications. Environ. Sci. Technol. 2006, 40, 5172–5180. [Google Scholar] [CrossRef] [PubMed] [Green Version]
- Logan, B.E.; Regan, J.M. Electricity-producing bacterial communities in microbial fuel cells. Trends Microbiol. 2006, 14, 512–518. [Google Scholar] [CrossRef] [PubMed]
- Bockris, J.O.M.; Reddy, A.K.N. Modern Electrochemistry; Kulwer Academic/Plenum Publishers: New York, NY, USA, 2000. [Google Scholar]
- Cheng, S.; Hong Liu, H.; Logan, B.E. Power Densities Using Different Cathode Catalysts (Pt and CoTMPP) and Polymer Binders (Nafion and PTFE) in Single Chamber Microbial Fuel Cells. Environ. Sci. Technol. 2006, 40, 364–369. [Google Scholar] [CrossRef] [PubMed]
- Sanchez, D.V.P.; Huynh, P.; Kozlov, M.E.; Baughman, R.H.; Vidic, R.D.; Yun, M. Carbon Nanotube/Platinum (Pt) Sheet as an Improved Cathode for Microbial Fuel Cells. Energy Fuels 2010, 24, 5897–5902. [Google Scholar] [CrossRef]
- Martin, E.; Tartakovsky, B.; Savadogo, O. Cathode materials evaluation in microbial fuel cells: A comparison of carbon, Mn2O3, Fe2O3 and platinum materials. Electrochim. Acta 2011, 58, 58–66. [Google Scholar] [CrossRef] [Green Version]
- Morris, J.M.; Jin, S.; Wang, J.; Zhu, C.; Urynowiczcz, M.A. Lead dioxide as an alternative catalyst to platinum in microbial fuel cells. Electrochem. Commun. 2007, 9, 1730–1734. [Google Scholar] [CrossRef]
- Liew, K.B.; Daud, W.R.W.; Ghasemia, M.; Leong, J.X.; Lim, S.S.; Ismail, M. Non-Pt catalyst as oxygen reduction reaction in microbial fuel cells: A review. Int. J. Hydrog. Energy 2014, 39, 4870–4883. [Google Scholar] [CrossRef]
- Zhang, L.; Liu, C.; Zhuang, L.; Li, W.; Zhou, S.; Zhang, J. Manganese dioxide as an alternative cathodic catalyst to platinum in microbial fuel cells. Biosens. Bioelectron. 2009, 24, 2825–2829. [Google Scholar] [CrossRef]
- Santoro, C.; Lei, Y.; Li, B.; Cristianid, P. Power generation from wastewater using single chamber microbial fuel cells (MFCs) with platinum-free cathodes and pre-colonized anodes. Biochem. Eng. J. 2012, 62, 8–16. [Google Scholar] [CrossRef]
- Wang, Z.; Huang, H.; Liu, H.; Zhou, X. Self-sustained electrochemical promotion catalysts for partial oxidation reforming of heavy hydrocarbons. Int. J. Hydrog. Energy 2012, 37, 17928–17935. [Google Scholar] [CrossRef]
- Huang, H.; Wang, Z.; Zhou, X.; Liu, H.; Wei, Y.; Pramuanjaroenkij, A.; Bordas, A.; Page, M.; Cai, S.; Zhang, X. Development and study of self-sustained electrochemical promotion catalysts for hydrocarbon reforming. In ECS Transactions, 2nd ed.; Electrochemical Society Inc.: Pennington, NJ, USA, 2013; Volume 58, pp. 243–254. [Google Scholar] [CrossRef]
- Liu, Y.; Harnisch, F.; Fricke, K.; Schroeder, U.; Climent, V.; Feliu, J.M. The study of electrochemically active microbial biofilms on different carbon-based anode materials in microbial fuel cells. Biosens. Bioelectron. 2010, 25, 2167–2171. [Google Scholar] [CrossRef] [PubMed]
- Yuan, Y.; Zhou, S.; Zhuang, L. Polypyrrole/carbon black composite as a novel oxygen reduction catalyst for microbial fuel cells. J. Power Sources 2010, 195, 3490–3493. [Google Scholar] [CrossRef]
- Erbay, C.; Yang, G.; de Figueiredo, P.; Sadr, R.; Yu, C.; Han, A. Three-dimensional porous carbon nanotube sponges for high-performance anodes of microbial fuel cells. J. Power Sources 2015, 298, 177–183. [Google Scholar] [CrossRef] [Green Version]
- Zuo, K.; Liang, S.; Liang, P.; Zhou, X.; Sun, D.; Zhang, X.; Huang, X. Carbon filtration cathode in microbial fuel cell to enhance wastewater treatment. Bioresour. Technol. 2015, 185, 426–430. [Google Scholar] [CrossRef]
- Penteado, E.D.; Fernández-Marchante, C.M.; Zaiat, M.; Cañizares, P.; Gonzalez, E.R.; Rodrigo, M.A. Influence of carbon electrode material on energy recovery from winery wastewater using a dual-chamber microbial fuel cell. Environ. Technol. 2017, 38, 1333–1341. [Google Scholar] [CrossRef]
- Asensio, Y.; Montes, I.B.; Fernández-Marchante, C.M.; Lobato, J.; Cañizares, P.; Rodrigo, M.A. Selection of cheap electrodes for two-compartment microbial fuel cells. J. Electroanal. Chem. 2017, 785, 235–240. [Google Scholar] [CrossRef]
- Wu, W.; Niu, H.; Yang, D.; Wang, S.-B.; Wang, J.; Lin, J.; Hu, C. Controlled layer-by-layer deposition of carbon nanotubes on electrodes for microbial fuel cells. Energies 2019, 12, 363. [Google Scholar] [CrossRef] [Green Version]
- Sudirjo, E.; Buisman, C.J.; Strik, D.P. Activated Carbon Mixed with Marine Sediment is Suitable as Bioanode Material for Spartina anglica Sediment/Plant Microbial Fuel Cell: Plant Growth, Electricity Generation, and Spatial Microbial Community Diversity. Water 2019, 11, 1810. [Google Scholar] [CrossRef] [Green Version]
- Ling, J.; Xu, Y.; Lu, C.; Lai, W.; Xie, G.; Zheng, L.; Talawar, M.P.; Du, Q.; Li, G. Enhancing Stability of Microalgae Biocathode by a Partially Submerged Carbon Cloth Electrode for Bioenergy Production from Wastewater. Energies 2019, 12, 3229. [Google Scholar] [CrossRef] [Green Version]
- Dumas, C.; Mollica, A.; Féron, D.; Basséguy, R.; Etcheverry, L.; Bergel, A. Marine microbial fuel cell: Use of stainless steel electrodes as anode and cathode materials. Electrochim. Acta 2006, 53, 468–473. [Google Scholar] [CrossRef] [Green Version]
- Osorio de la Rosa, E.; Vázquez Castillo, J.; Carmona Campos, M.; Barbosa Pool, G.R.; Becerra Nuñez, G.; Castillo Atoche, A.; Ortegón Aguilar, J. Plant Microbial Fuel Cells–Based Energy Harvester System for Self-powered IoT Applications. Sensors 2019, 19, 1378. [Google Scholar] [CrossRef] [PubMed] [Green Version]
- Armour, M.A. Hazarodous Laboratory Chemicals Disposal Guide; CRC Press: Boca Raton, FL, USA, 2003. [Google Scholar]
- HaoYu, E.; Cheng, S.; Scott, K.; Logan, B.E. Microbial fuel cell performance with non-Pt cathode catalysts. Journal of Power Sources. J. Power Sources 2007, 171, 275–281. [Google Scholar] [CrossRef]
- Li, B.; Wang, M.; Zhou, X.; Wang, X.; Liu, B.; Li, B. Pyrolyzed binuclear-cobalt-phthalocyanine as electrocatalyst for oxygen reduction reaction in microbial fuel cells. Bioresour. Technol. 2015, 193, 545–548. [Google Scholar] [CrossRef] [PubMed]
- Tang, X.; Ng, H.Y. Cobalt and nitrogen-doped carbon catalysts for enhanced oxygen reduction and power production in microbial fuel cells. Electrochim. Acta 2017, 247, 193–199. [Google Scholar] [CrossRef]
- Ahmed, J.; Yuan, Y.; Zhou, L.; Kim, S. Carbon supported cobalt oxide nanoparticles–iron phthalocyanine as alternative cathode catalyst for oxygen reduction in microbial fuel cells. J. Power Sources 2012, 208, 170–175. [Google Scholar] [CrossRef]
- Williams, H.; Gnanamani, M.K.; Jacobs, G.; Shafer, W.D.; Coulliette, D. Fischer–Tropsch Synthesis: Computational Sensitivity Modeling for Series of Cobalt Catalysts. Catalysts 2019, 9, 857. [Google Scholar] [CrossRef] [Green Version]
- Jo, S.B.; Kim, T.Y.; Lee, C.H.; Woo, J.H.; Chae, H.J.; Kang, S.-H.; Kim, J.W.; Lee, S.C.; Kim, J.C. Selective CO Hydrogenation Over Bimetallic Co-Fe Catalysts for the Production of Light Paraffin Hydrocarbons (C2–C4): Effect of Space Velocity, Reaction Pressure and Temperature. Catalysts 2019, 9, 779. [Google Scholar] [CrossRef] [Green Version]
- Twigg, M.V. Catalyst Handbook; Wolfe Publishing Ltd.: London, UK, 1989. [Google Scholar]
- US EPA Report. Clean Watersheds Needs Survey Overview; United States Environmental Protection Agency: Washington, DC, USA, 2008.
- Zhou, J.; Zhang, Y.; Li, S.; Chen, J. Ni/NiO Nanocomposites with Rich Oxygen Vacancies as High-Performance Catalysts for Nitrophenol Hydrogenation. Catalysts 2019, 9, 944. [Google Scholar] [CrossRef] [Green Version]
- Wang, Y.; Guo, J.; Wang, T.; Shao, J.; Wang, D.; Yang, Y.-W. Mesoporous Transition Metal Oxides for Supercapacitors. Nanomaterials 2015, 5, 1667–1689. [Google Scholar] [CrossRef]
- Huang, L.; Chen, D.C.; Ding, Y.; Feng, S.; Wang, Z.L.; Liu, M.L. Nickel-cobalt hydroxide nanosheets coated on NiCo2O4 nanowires grown on carbon fiber paper for high-performance pseudocapacitors. Nano Lett. 2013, 13, 3135–3139. [Google Scholar] [CrossRef]
- Rakhi, R.B.; Chen, W.; Hedhili, M.N.; Cha, D.; Alshareef, H.N. Enhanced rate performance of mesoporous Co3O4 nanosheet supercapacitor electrodes by hydrous RuO2 nanoparticle decoration. ACS Appl. Mater. Interfaces 2014, 6, 4196–4206. [Google Scholar] [CrossRef] [PubMed]
- Yuan, C.Z.; Zhang, X.G.; Su, L.H.; Gao, B.; Shen, L.F. Facile synthesis and self-assembly of hierarchical porous NiO nano/micro spherical superstructures for high performance supercapacitors. J. Mater. Chem. 2009, 19, 5772–5777. [Google Scholar] [CrossRef]
- Lee, J.W.; Ahn, T.; Kim, J.H.; Ko, J.M.; Kim, J. Nanosheets based mesoporous NiO microspherical structures via facile and template-free method for high performance supercapacitors. Electrochim. Acta 2011, 56, 4849–4857. [Google Scholar] [CrossRef]
- Yang, M.; Li, J.X.; Li, H.H.; Su, L.W.; Wei, J.P.; Zhou, Z. Mesoporous slit-structured NiO for high-performance pseudocapacitors. Phys. Chem. Chem. Phys. 2012, 14, 11048–11052. [Google Scholar] [CrossRef]
- Włodarczyk, B.; Włodarczyk, P.P. Comparsion of Cu-B alloy and stainless steel as electrode material for microbial fuel cell. In Renewable Energy Sources: Engineering, Technology, Innovation ICORES 2018; Wróbel, M., Jewiarz, M., Szlek, A., Eds.; Springer Nature Switzerland AG: Basel, Switzerland, 2020. [Google Scholar] [CrossRef]
- Włodarczyk, P.P.; Włodarczyk, B. Ni-Co alloy as catalyst for fuel electrode of hydrazine fuel cell. China-USA Bus. Rev. 2015, 14, 269–279. [Google Scholar] [CrossRef] [Green Version]
- Holtzer, M.; Staronka, A. Physical chemistry (in Polish); AGH University of Science and Technology Press: Cracow, Poland, 2000. [Google Scholar]
- Huggins, T.; Fallgren, P.H.; Jin, S.; Ren, Z.J. Energy and performance comparison of microbial fuel cell and conventional aeration treating of wastewater. J. Microb. Biochem. Technol. 2013, S6:002, 1–5. [Google Scholar] [CrossRef] [Green Version]
Figure 1.
Concentration of Ni and Co in the alloy samples obtained by electrochemical deposition for planned 15% concentration of Co.
Figure 1.
Concentration of Ni and Co in the alloy samples obtained by electrochemical deposition for planned 15% concentration of Co.

Figure 2.
Concentration of Ni and Co in the alloy samples obtained by electrochemical deposition for planned 25% concentration of Co.
Figure 2.
Concentration of Ni and Co in the alloy samples obtained by electrochemical deposition for planned 25% concentration of Co.

Figure 3.
Concentration of Ni and Co in the alloy samples obtained by electrochemical deposition for planned 50% concentration of Co.
Figure 3.
Concentration of Ni and Co in the alloy samples obtained by electrochemical deposition for planned 50% concentration of Co.

Figure 4.
Concentration of Ni and Co in the alloy samples obtained by electrochemical deposition for planned 75% concentration of Co.
Figure 4.
Concentration of Ni and Co in the alloy samples obtained by electrochemical deposition for planned 75% concentration of Co.

Figure 5.
The electroless potential of Ni–Co electrodes (oxidized for 1 h).

Figure 6.
The electroless potential of Ni–Co electrodes (oxidized for 2 h).

Figure 7.
The electroless potential of Ni–Co electrodes (oxidized for 4 h).

Figure 8.
The electroless potential of Ni–Co electrodes (oxidized for 6 h).

Figure 9.
The electroless potential of Ni–Co electrodes (oxidized for 8 h).

Figure 10.
The electroless potential of Ni–Co electrodes (oxidized for 10 h).

Figure 11.
Voltage of a half-cell with Ni–Co electrode (alloy with 15% of Co); influence of anodic charge on the catalytic activity of Ni–Co catalyst (lines 1–4 show subsequent anodic charges).
Figure 11.
Voltage of a half-cell with Ni–Co electrode (alloy with 15% of Co); influence of anodic charge on the catalytic activity of Ni–Co catalyst (lines 1–4 show subsequent anodic charges).

Figure 12.
Voltage of a half-cell with Ni–Co electrode (alloy with 25% of Co); influence of anodic charge on the catalytic activity of Ni–Co catalyst (lines 1–4 show subsequent anodic charges).
Figure 12.
Voltage of a half-cell with Ni–Co electrode (alloy with 25% of Co); influence of anodic charge on the catalytic activity of Ni–Co catalyst (lines 1–4 show subsequent anodic charges).

Figure 13.
Voltage of a half-cell with Ni–Co electrode (alloy with 50% of Co); influence of anodic charge on the catalytic activity of Ni–Co catalyst (lines 1–4 show subsequent anodic charges).
Figure 13.
Voltage of a half-cell with Ni–Co electrode (alloy with 50% of Co); influence of anodic charge on the catalytic activity of Ni–Co catalyst (lines 1–4 show subsequent anodic charges).

Figure 14.
Voltage of a half-cell with Ni–Co electrode (alloy with 75% of Co); influence of anodic charge on the catalytic activity of Ni–Co catalyst (lines 1–4 show subsequent anodic charges).
Figure 14.
Voltage of a half-cell with Ni–Co electrode (alloy with 75% of Co); influence of anodic charge on the catalytic activity of Ni–Co catalyst (lines 1–4 show subsequent anodic charges).

Figure 15.
Cell voltage of the MFC in time: red line—with Ni–Co cathode (15% Co), black line—carbon cloth cathode.
Figure 15.
Cell voltage of the MFC in time: red line—with Ni–Co cathode (15% Co), black line—carbon cloth cathode.

Figure 16.
Power curves during the MFC operation: red line—with Ni–Co cathode (15% Co), black line—carbon cloth cathode.
Figure 16.
Power curves during the MFC operation: red line—with Ni–Co cathode (15% Co), black line—carbon cloth cathode.

Figure 17.
Chemical oxygen demand (COD) reduction in time in the three reactors: without aeration, with aeration, and during the MFC operation (with Ni–Co and carbon cloth electrodes).
Figure 17.
Chemical oxygen demand (COD) reduction in time in the three reactors: without aeration, with aeration, and during the MFC operation (with Ni–Co and carbon cloth electrodes).

Figure 18.
Scheme of the measurements: 1—copper mesh (electrode) to deposit the catalyst, 2—electrolysis bath to deposit the catalyst, 3—electrolyte preparation, 4—furnace for electrode (catalyst) oxidation, 5—glass cell for electroless potential analysis and for the anodic charge analysis, 6—potentiostat, 7—third reactor (MFC), 6—second reactor (with aeration), 9—first reactor (without aeration), 10—multimeter, 11—colorimeter, 12—computer.


Table 1.
Maximum power and average cell voltage obtained in microbial fuel cells (MFCs), with Ni–Co cathodes oxidized for 1–8 h, and without anodic charge before using the electrodes (cathodes).
Table 1.
Maximum power and average cell voltage obtained in microbial fuel cells (MFCs), with Ni–Co cathodes oxidized for 1–8 h, and without anodic charge before using the electrodes (cathodes).
| Oxidizing Time of the Ni–Co Electrode (h) | Max Power Obtained in MFC (mW) | Average Voltage of the MFC (V) | ||||||
|---|---|---|---|---|---|---|---|---|
| Content of Co in the Alloy (%) | Content of Co in the Alloy (%) | |||||||
| 15 | 25 | 50 | 75 | 15 | 25 | 50 | 75 | |
| 1 | 5.38 | 4.67 | 4.60 | 4.15 | 0.88 | 0.81 | 0.80 | 0.76 |
| 2 | 5.41 | 4.62 | 4.61 | 4.34 | 0.89 | 0.80 | 0.78 | 0.75 |
| 4 | 5.55 | 4.75 | 4.66 | 4.66 | 0.91 | 0.83 | 0.79 | 0.77 |
| 6 | 5.76 | 5.01 | 4.67 | 4.68 | 0.91 | 0.83 | 0.81 | 0.78 |
| 8 | 6.02 | 5.08 | 4.76 | 4.70 | 0.93 | 0.87 | 0.86 | 0.82 |
| 10 | 4.62 | 4.79 | 4.60 | 4.33 | 0.88 | 0.79 | 0.80 | 0.69 |
Table 2.
Maximum power and average cell voltage obtained in MFCs, with Ni–Co cathodes oxidized for 8 h, and with anodic charge before using the electrodes (cathodes).
Table 2.
Maximum power and average cell voltage obtained in MFCs, with Ni–Co cathodes oxidized for 8 h, and with anodic charge before using the electrodes (cathodes).
| Content of Co in the Ni–Co Electrode (%) | Max Power Obtained in MFC (mW) | Average Voltage of the MFC (V) | ||||||
|---|---|---|---|---|---|---|---|---|
| Number of Anodic Charge | Number of Anodic Charge | |||||||
| 1 | 2 | 3 | 4 | 1 | 2 | 3 | 4 | |
| 15 | 6.34 | 6.66 | 7.19 | 7.09 | 0.99 | 0.99 | 1.03 | 1.01 |
| 25 | 5.45 | 5.52 | 6.72 | 6.63 | 0.96 | 0.97 | 0.99 | 0.96 |
| 50 | 5.44 | 5.63 | 6.69 | 6.59 | 0.93 | 0.94 | 0.96 | 0.91 |
| 75 | 5.03 | 5.59 | 6.68 | 6.65 | 0.88 | 0.91 | 0.92 | 0.88 |
Table 3.
Parameters of wastewater (WW) (from the wastewater treatment plant (WWTP)) used in measurements of electricity production and COD reduction.
Table 3.
Parameters of wastewater (WW) (from the wastewater treatment plant (WWTP)) used in measurements of electricity production and COD reduction.
| Parameter | Value |
|---|---|
| COD (mg·L−1) | 1899.0 |
| pH | 6.5 |
© 2019 by the authors. Licensee MDPI, Basel, Switzerland. This article is an open access article distributed under the terms and conditions of the Creative Commons Attribution (CC BY) license (http://creativecommons.org/licenses/by/4.0/).
Share and Cite
MDPI and ACS Style
Włodarczyk, P.P.; Włodarczyk, B. Preparation and Analysis of Ni–Co Catalyst Use for Electricity Production and COD Reduction in Microbial Fuel Cells. Catalysts 2019, 9, 1042. https://doi.org/10.3390/catal9121042
AMA Style
Włodarczyk PP, Włodarczyk B. Preparation and Analysis of Ni–Co Catalyst Use for Electricity Production and COD Reduction in Microbial Fuel Cells. Catalysts. 2019; 9(12):1042. https://doi.org/10.3390/catal9121042
Chicago/Turabian StyleWłodarczyk, Paweł P., and Barbara Włodarczyk. 2019. "Preparation and Analysis of Ni–Co Catalyst Use for Electricity Production and COD Reduction in Microbial Fuel Cells" Catalysts 9, no. 12: 1042. https://doi.org/10.3390/catal9121042
Note that from the first issue of 2016, this journal uses article numbers instead of page numbers. See further details here.