The Role of Fe2O3 Species in Depressing the Formation of N2O in the Selective Reduction of NO by NH3 over V2O5/TiO2-Based Catalysts

Department of Environmental Engineering, Daegu University 201 Daegudae-ro, Jillyang, Gyeongsan 38453, Korea
*
Author to whom correspondence should be addressed.
Catalysts 2018, 8(4), 134; https://doi.org/10.3390/catal8040134
Submission received: 28 February 2018
/
Revised: 23 March 2018
/
Accepted: 27 March 2018
/
Published: 30 March 2018
(This article belongs to the Special Issue Selective Catalytic Reduction of NOx)
Abstract
:Promotion of 2.73% Fe2O3 in an in-house-made V2O5-WO3/TiO2 (VWT) and a commercial V2O5-WO3/TiO2 (c-VWT) has been investigated as a cost effective approach to the suppression of N2O formation in the selective catalytic reduction of NO by NH3 (NH3-SCR). The promoted VWT and c-VWT catalysts all gave a significantly decreased N2O production at temperatures >400 °C compared to the unpromoted samples. However, such a promotion led to the loss in high temperature NO conversion, mainly due to the oxidation of NH3 to N-containing gases, particularly NO. Characterization of the unpromoted and promoted catalysts using X-ray diffraction (XRD), NH3 adsorption-desorption, and Raman spectroscopy techniques could explain the reason why the promotion showed much lower N2O formation levels at high temperatures. The addition of Fe2O3 to c-VWT resulted in redispersion of the V2O5 species, although this was not visible for 2.73% Fe2O3/VWT. The iron oxides exist as a highly-dispersed noncrystalline α-Fe2O3 in the promoted catalysts. These Raman spectra had a new Raman signal that could be tentatively assigned to Fe2O3-induced tetrahedrally coordinated polymeric vanadates and/or surface V-O-Fe species with significant electronic interactions between the both metal oxides. Calculations of the monolayer coverage of each metal oxide and the surface total coverage are reasonably consistent with Raman measurements. The proposed vanadia-based surface polymeric entities may play a key role for the substantial reduction of N2O formed at high temperatures by NH3 species adsorbed strongly on the promoted catalysts. This reaction is a main pathway to greatly suppress the extent of N2O formation in NH3-SCR reaction over the promoted catalysts.
1. Introduction
Commercially-available, anatase-type TiO2-supported V2O5 catalysts with either WO3 or MoO3 as a structure stabilizer of the support and a surface acidity enhancer are typical for selective catalytic reduction (SCR) of NOx from relatively large scale stationary and mobile sources in the presence of N-containing reductants, such as gaseous NH3 and aqueous urea [1,2]. They are usually formulated to 0.1–3% V2O5 and 7–10% WO3 or 6–10% MoO3 [3,4,5,6,7,8], depending on industrial application target, and V2O5-WO3/TiO2 systems are prevailed for such deNOx processes. The overall NH3-SCR reaction with V2O5/TiO2-based catalysts could be adequately described by [5,6,7]:
4NO + 4NH3 + O2 → 4N2 + 6H2O,
NO + NO2 + 2NH3 → 2N2 + 3H2O.
The standard Reaction (1) takes place in the presence of excess oxygen, while Reaction (2) has been known as the fast SCR pathway in an equimolar mixture of NO and NO2 and is known to be much faster than the Reaction (1) at low temperatures [6,9,10].
In addition to the main SCR reactions over V2O5-WO3 (or MoO3)/TiO2 catalysts, many side reactions can occur, and among them, one is the production of N2O that is a greenhouse gas with a global warming potential of 310 at a 100-year time horizon, and the extent of its emissions can greatly depend on the loading and crystallinity of V2O5, the secondary component, reaction temperature, concentrations of H2O and O2, and so forth [3,6,11,12,13,14,15]. Such a formation of N2O in the NH3-SCR reaction is proposed by the following major routes [6,12,13,14,15]:
4NO + 4NH3 + 3O2 → 4N2O + 6H2O
2NH3 + 2O2 → N2O + 3H2O.
These reactions predominantly occur at high temperatures when V2O5-WO3/TiO2 catalysts are employed for deNOx SCR reaction and are associated with a decrease in high-temperature NO conversion and N2 selectivity [12,13,14,15].
An attempt to minimize the formation of N2O in NH3-SCR processes has been reported: a direct coating of Fe-ZSM-5 onto a commercial V2O5-WO3/TiO2 catalyst [16], a sequential configuration of V2O5-WO3/TiO2 and Fe-ZSM-5 [17], and a modification of TiO2 using Fe2O3 before V2O5 and WO3 loadings [18,19]. These studies were started from the fact that Fe-exchanged zeolites, representatively Fe-ZSM-5, are a commercially proven catalyst not only for the NH3-SCR reaction but also for direct N2O decomposition; thereby, the decomposition of N2O produced in the SCR reaction into N2 on Fe ions and/or its reduction by residual NH3 species [20,21,22,23] is expected, and from that a nanosized iron oxide, γ-Fe2O3 (maghemite), is active for the NH3-SCR reaction, although N2O production levels were not addressed for this system [24]. The Fe-ZSM-5-coated V2O5-WO3/TiO2 catalysts could greatly depress the formation of N2O in NH3-SCR reaction, depending on the coating content [16], unlike the series configuration systems [17]. Samples of coprecipitated, Fe2O3-TiO2-supported 1% V2O5, and 1% V2O5-10% WO3/TiO2, had similar NO conversions at 150–400 °C but at higher temperatures, lower ones, depending on the temperature, were indicated for the former sample [18]. This showed a better N2 selectivity at high temperatures ≥400 °C [18]; however, this observation may be apparent because of the difference in NO conversion at the temperature region between the catalysts. All 1% V2O5-10% WO3 catalysts dispersed on 1–5% Fe2O3/TiO2 gave an improvement to N2 selectivity at temperatures >450 °C, compared to the bare TiO2-based catalyst; in addition to that, they showed higher NO conversion below 350 °C but comparable NO conversion at higher temperatures [19].
Unsupported and supported Fe2O3 are still suspicious of the tolerance to SO2 existing in flue gases, depending strongly on their preparation techniques [19,24,25,26], but this point can be avoided for no sulfur applications, such as natural gas-fired plants. The earlier approaches to the reduction in N2O emissions from NH3-SCR reaction could advise us of an efficient way of promoting V2O5-WO3/TiO2 catalysts using Fe2O3. Such a utilization of Fe2O3 is cost effective, compared to Fe-zeolites whose preparation requires more complicated, expensive processes. Therefore, we have studied a promotional effect of Fe2O3 in samples of laboratory-made V2O5-WO3/TiO2 and commercial V2O5-WO3/TiO2 on the suppression of N2O production in NH3-SCR reaction. The Fe2O3 as a promoter was added to the V2O5/TiO2-based catalysts using the well-known impregnation technique, and this is much simpler than the utilization of a coprecipitated Fe2O3-TiO2 and a Fe2O3-coated TiO2 to support V2O5 and WO3 reported in the literature.
2. Results and Discussion
2.1. Physicochemical Properties of Fe2O3-Promoted V2O5-WO3/TiO2 Catalysts
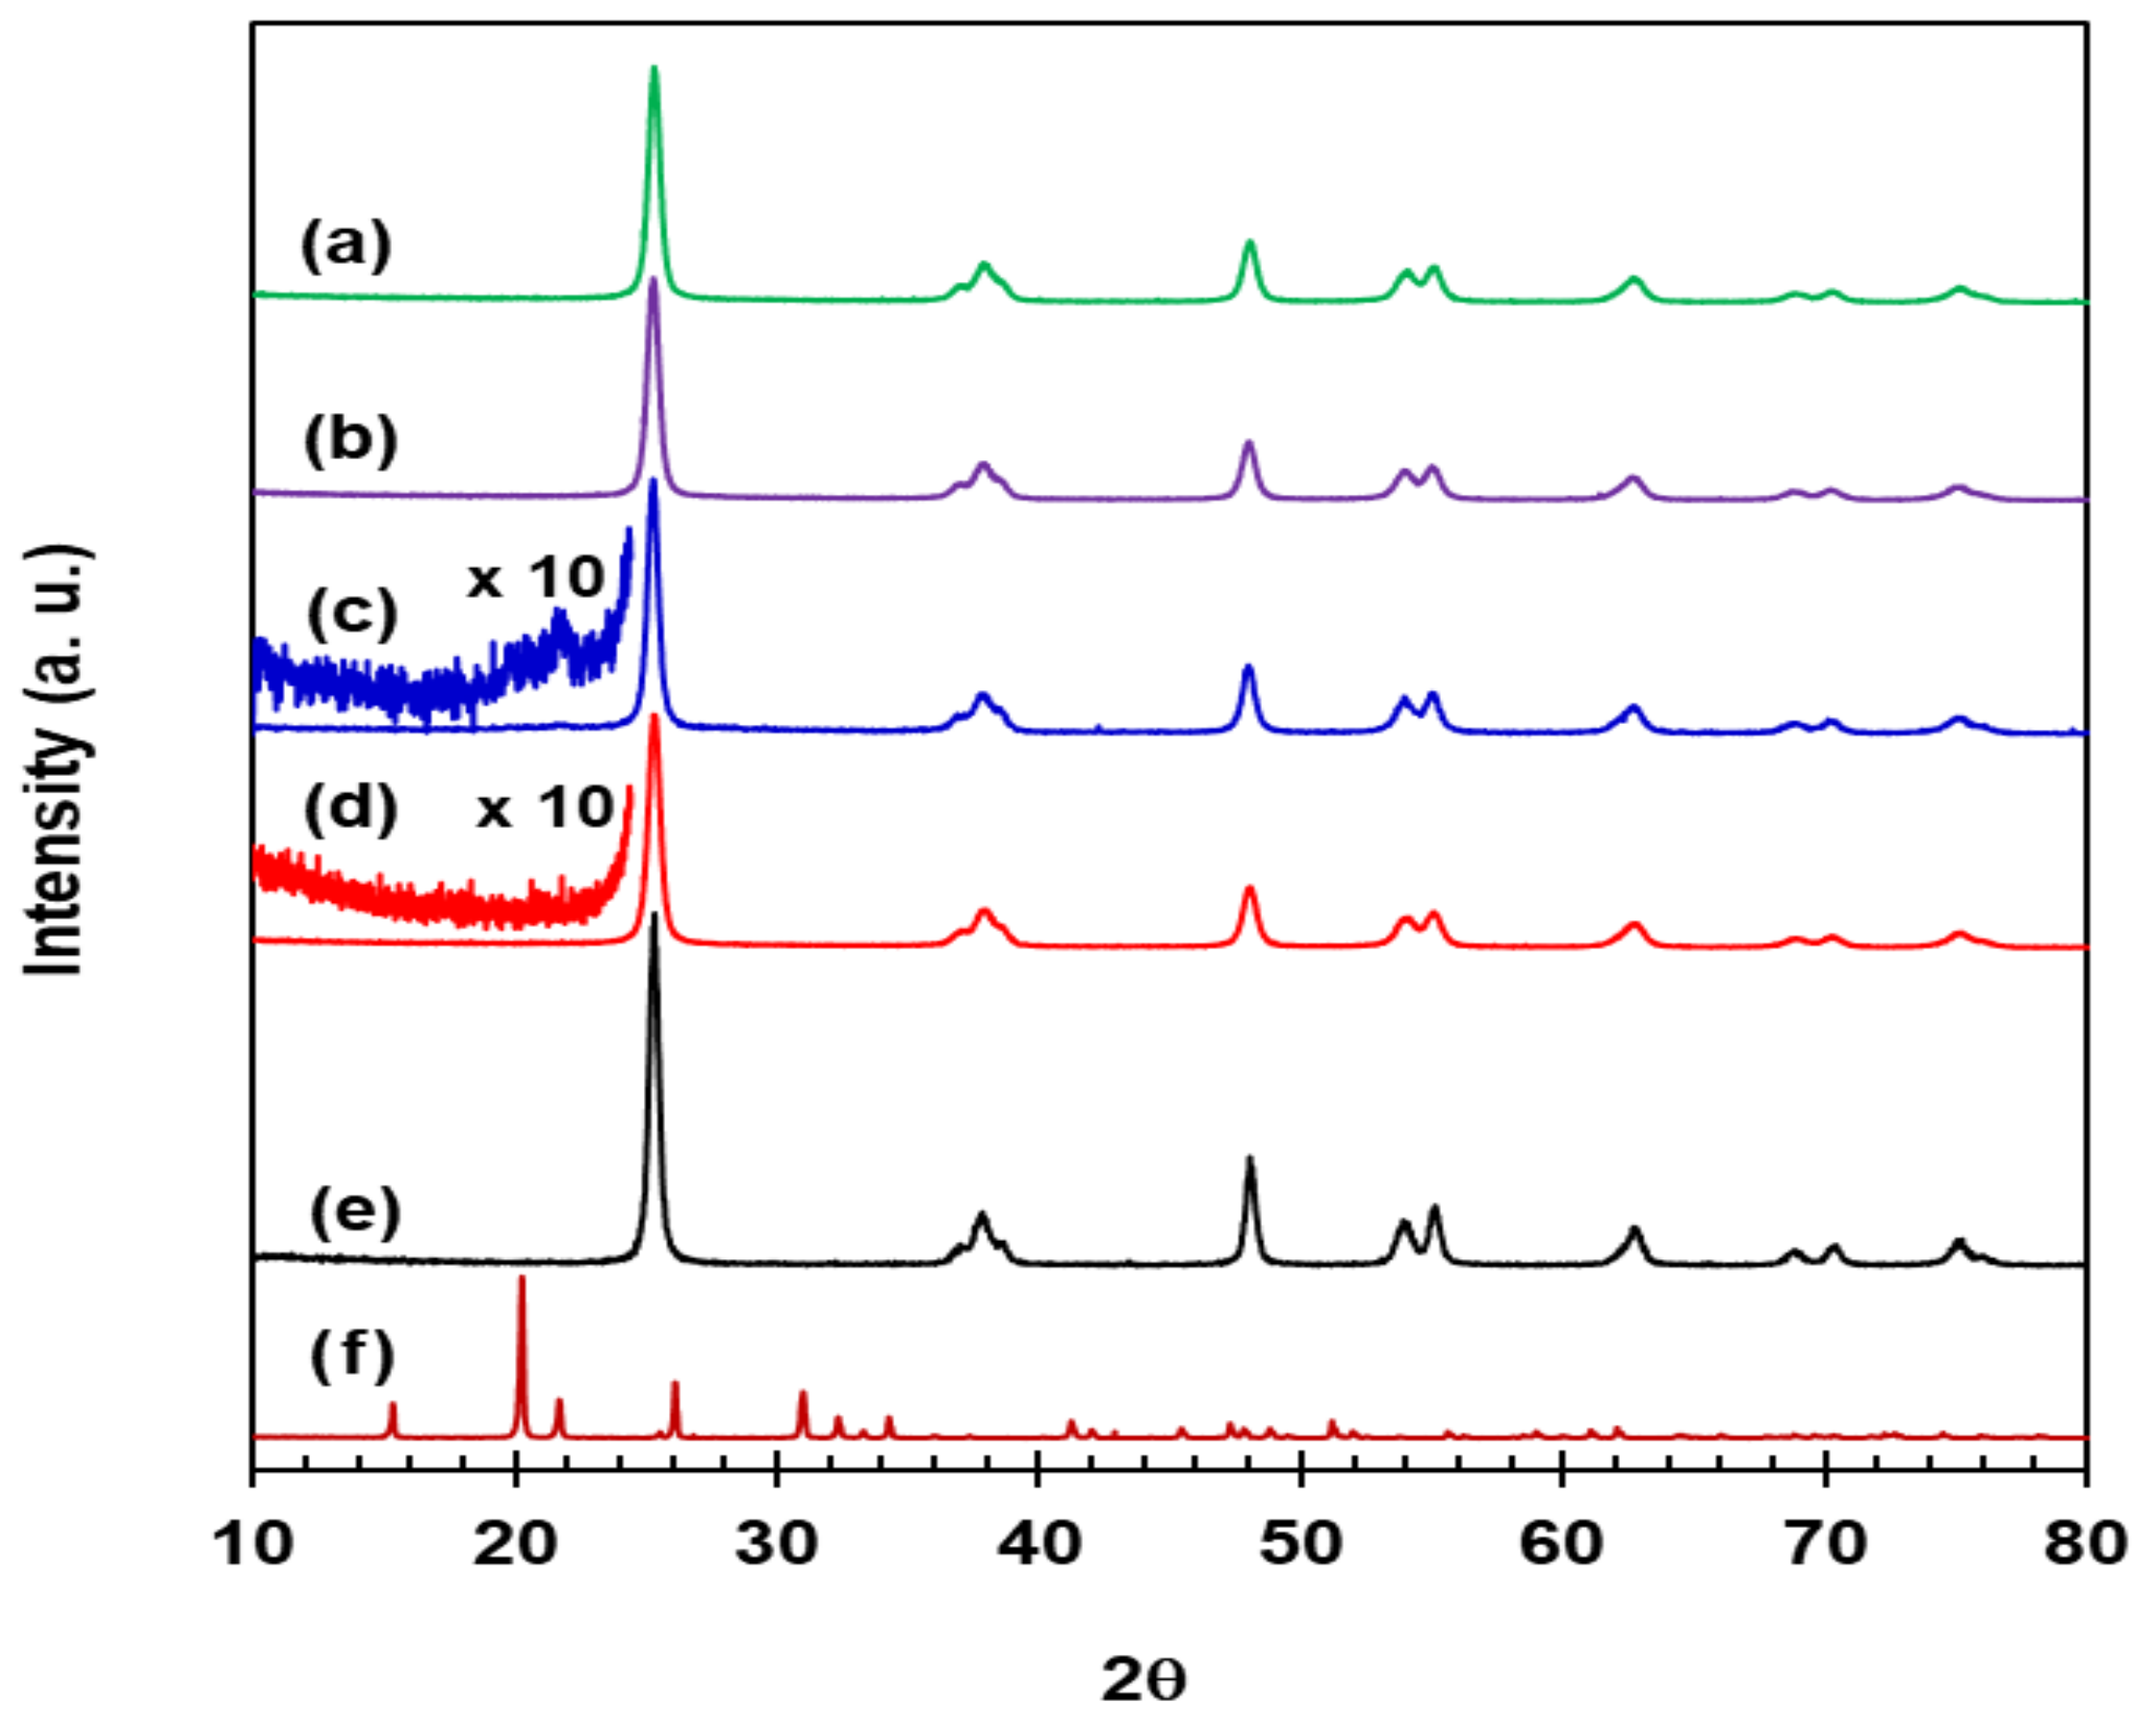
X-ray diffraction (XRD) patterns for VWT, 2.73% Fe2O3/VWT, c-VWT, and 2.73% Fe2O3/c-VWT at a 2θ value of 10–80° are shown in Figure 1. All the catalysts gave a predominant peak at 2θ = 25.31° with much smaller diffractions at higher 2θ values, as displayed in Figure 1a–d, and all these peaks were the same as those existing in the pattern for anatase TiO2 shown in Figure 1e. No diffraction due to the crystalline WO3 was shown for all the samples, indicating that WO3 existing in them is amorphous WOx species [27]. There was also no presence of crystalline V2O5 phases, except for c-VWT, in which a weak reflection near 2θ = 21.64° appeared when the diffraction was magnified, as indicated in Figure 1c, which is assigned to the crystallographic (101) plane of a polycrystalline α-V2O5 (JCPDS card # 41-1426) by comparing it with the pure reference V2O5 with an orthorhombic structure as provided in Figure 1f [27,28]. However, the XRD peak disappeared in 2.73% Fe2O3/c-VWT, as shown in the magnified pattern in Figure 1d. It should be mentioned that all of the other catalysts gave no peak at the 2θ value, even in similar magnified spectra (not shown here).
Comparing hematite (α-Fe2O3), maghemite (γ-Fe2O3), magnetite (Fe3O4), goethite (α-FeOOH), akaganeite (β-FeOOH), lepidocrocite (γ-FeOOH), and feroxyhyte (δ-FeOOH) in the corresponding JCPDS card #s 33-0664, 39-1346, 02-1035, 29-0713, 34-1266, 08-98, and 29-712, neither of them were indicated in XRD patterns for 2.73% Fe2O3-promoted catalysts, as disclosed in Figure 1b,d. Even a sample of 8% Fe2O3/VWT after calcination at 500 °C gave no crystalline peaks due to the iron compounds (not shown here). Magnetite nanoparticles are easily transformed to γ-Fe2O3 and α-Fe2O3 when, respectively, calcined at 300 and 500 °C in air [29], and all the FeOOH phases can be altered to α-Fe2O3 even at relatively lower thermal energy [30]. Our XRD measurements, and the thermal stability of the iron oxides and oxyhydroxides, reasonably indicate that FeOx species existing in the promoted catalysts are in the form of α-Fe2O3 as a highly-dispersed noncrystalline particle, and that the Fe2O3 could significantly interact with V2O5 in c-VWT, thereby resulting in redispersion of the V2O5.
2.2. Textural Features of Fe2O3-Promoted V2O5-WO3/TiO2 Catalysts
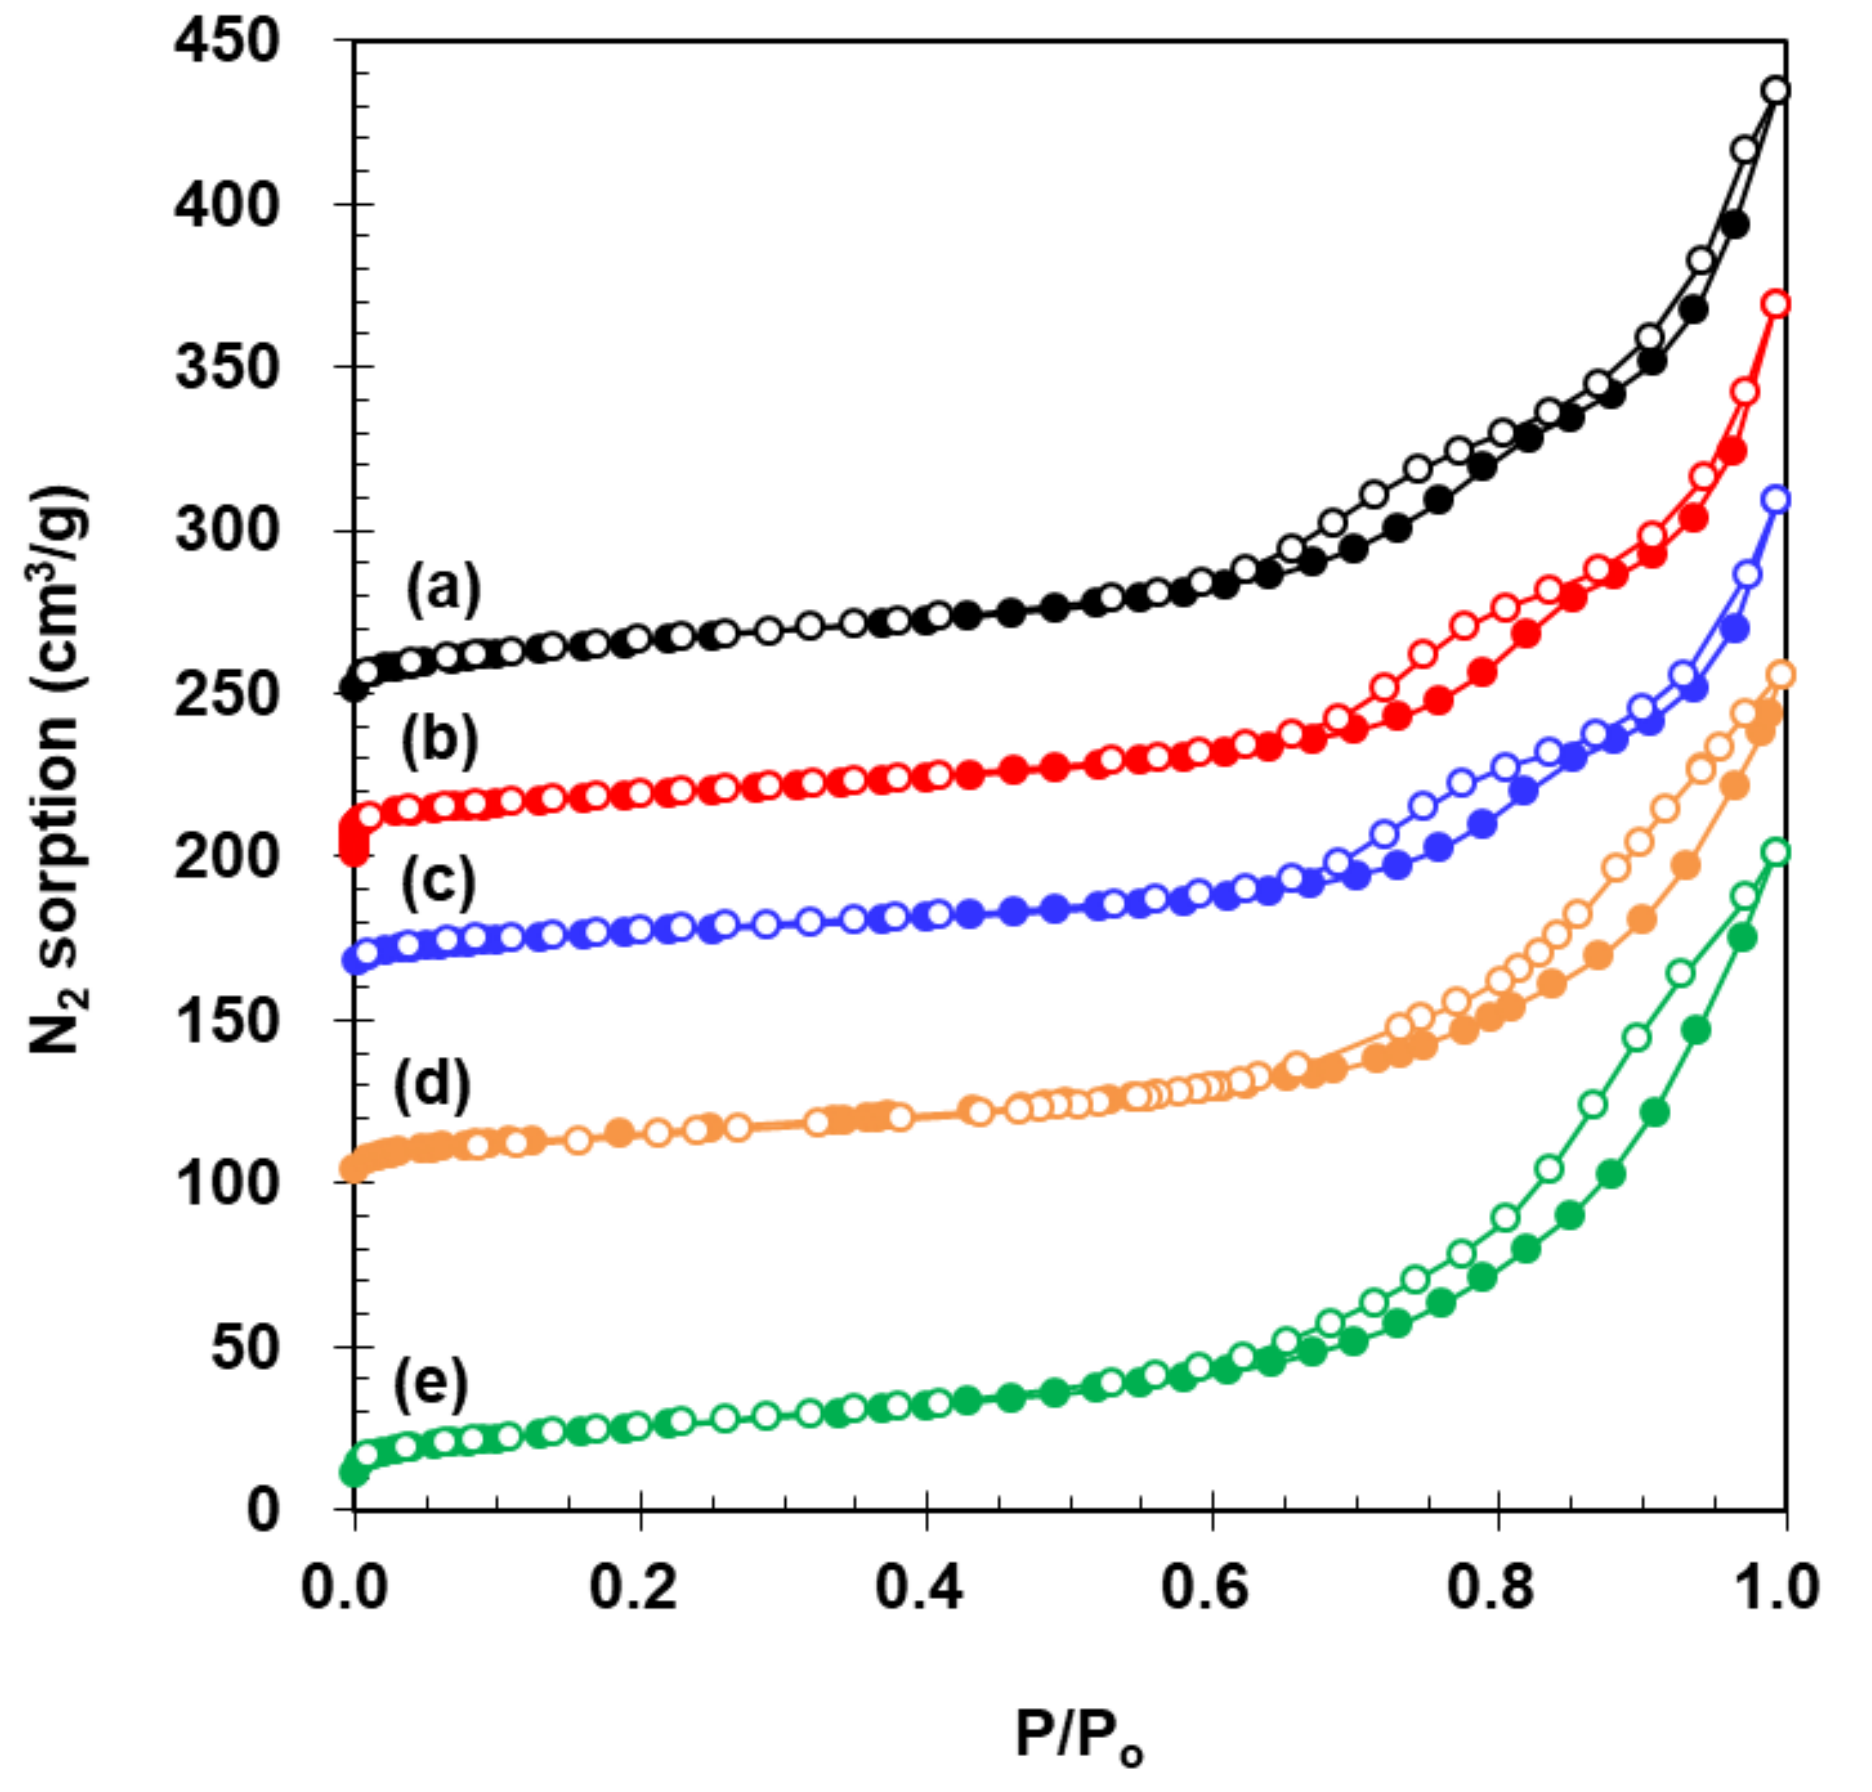
N2 sorption isotherm of 2.73% Fe2O3/VWT was similar to that measured for VWT and WT, as provided in Figure 2a–c. This case was the same for c-VWT and 2.73% Fe2O3/c-VWT (Figure 2d,e). All the isotherms showed a typical character of mesoporous materials because of the desorption hysteresis at P/Po = 0.53–0.67 [31], depending on the sample.
Values for the specific BET surface area (SBET), the mesopore size (dm), and the total pore volume (Vt) are listed in Table 1. The SBET value of WT decreased upon 1.6% V2O5 loading, which is due to some blockage of relatively small pores by the vanadia, but a further decrease after 2.73% Fe2O3 addition to the VWT was insignificant. These are consistent with changes in values for dm and Vt. On the other hand, the promotion of c-VWT using 2.73% Fe2O3 led to an increased SBET compared to the bare sample, and yielded somewhat smaller dm and larger Vt values (Table 1). This might be caused by rearrangement of mechanical additives existing in c-VWT, such as glass fibers, during the sample preparation using an aqueous solution of the iron precursor [6,32,33].
2.3. Effect of Fe2O3 Species on NH3-SCR Reaction and N2O Formation
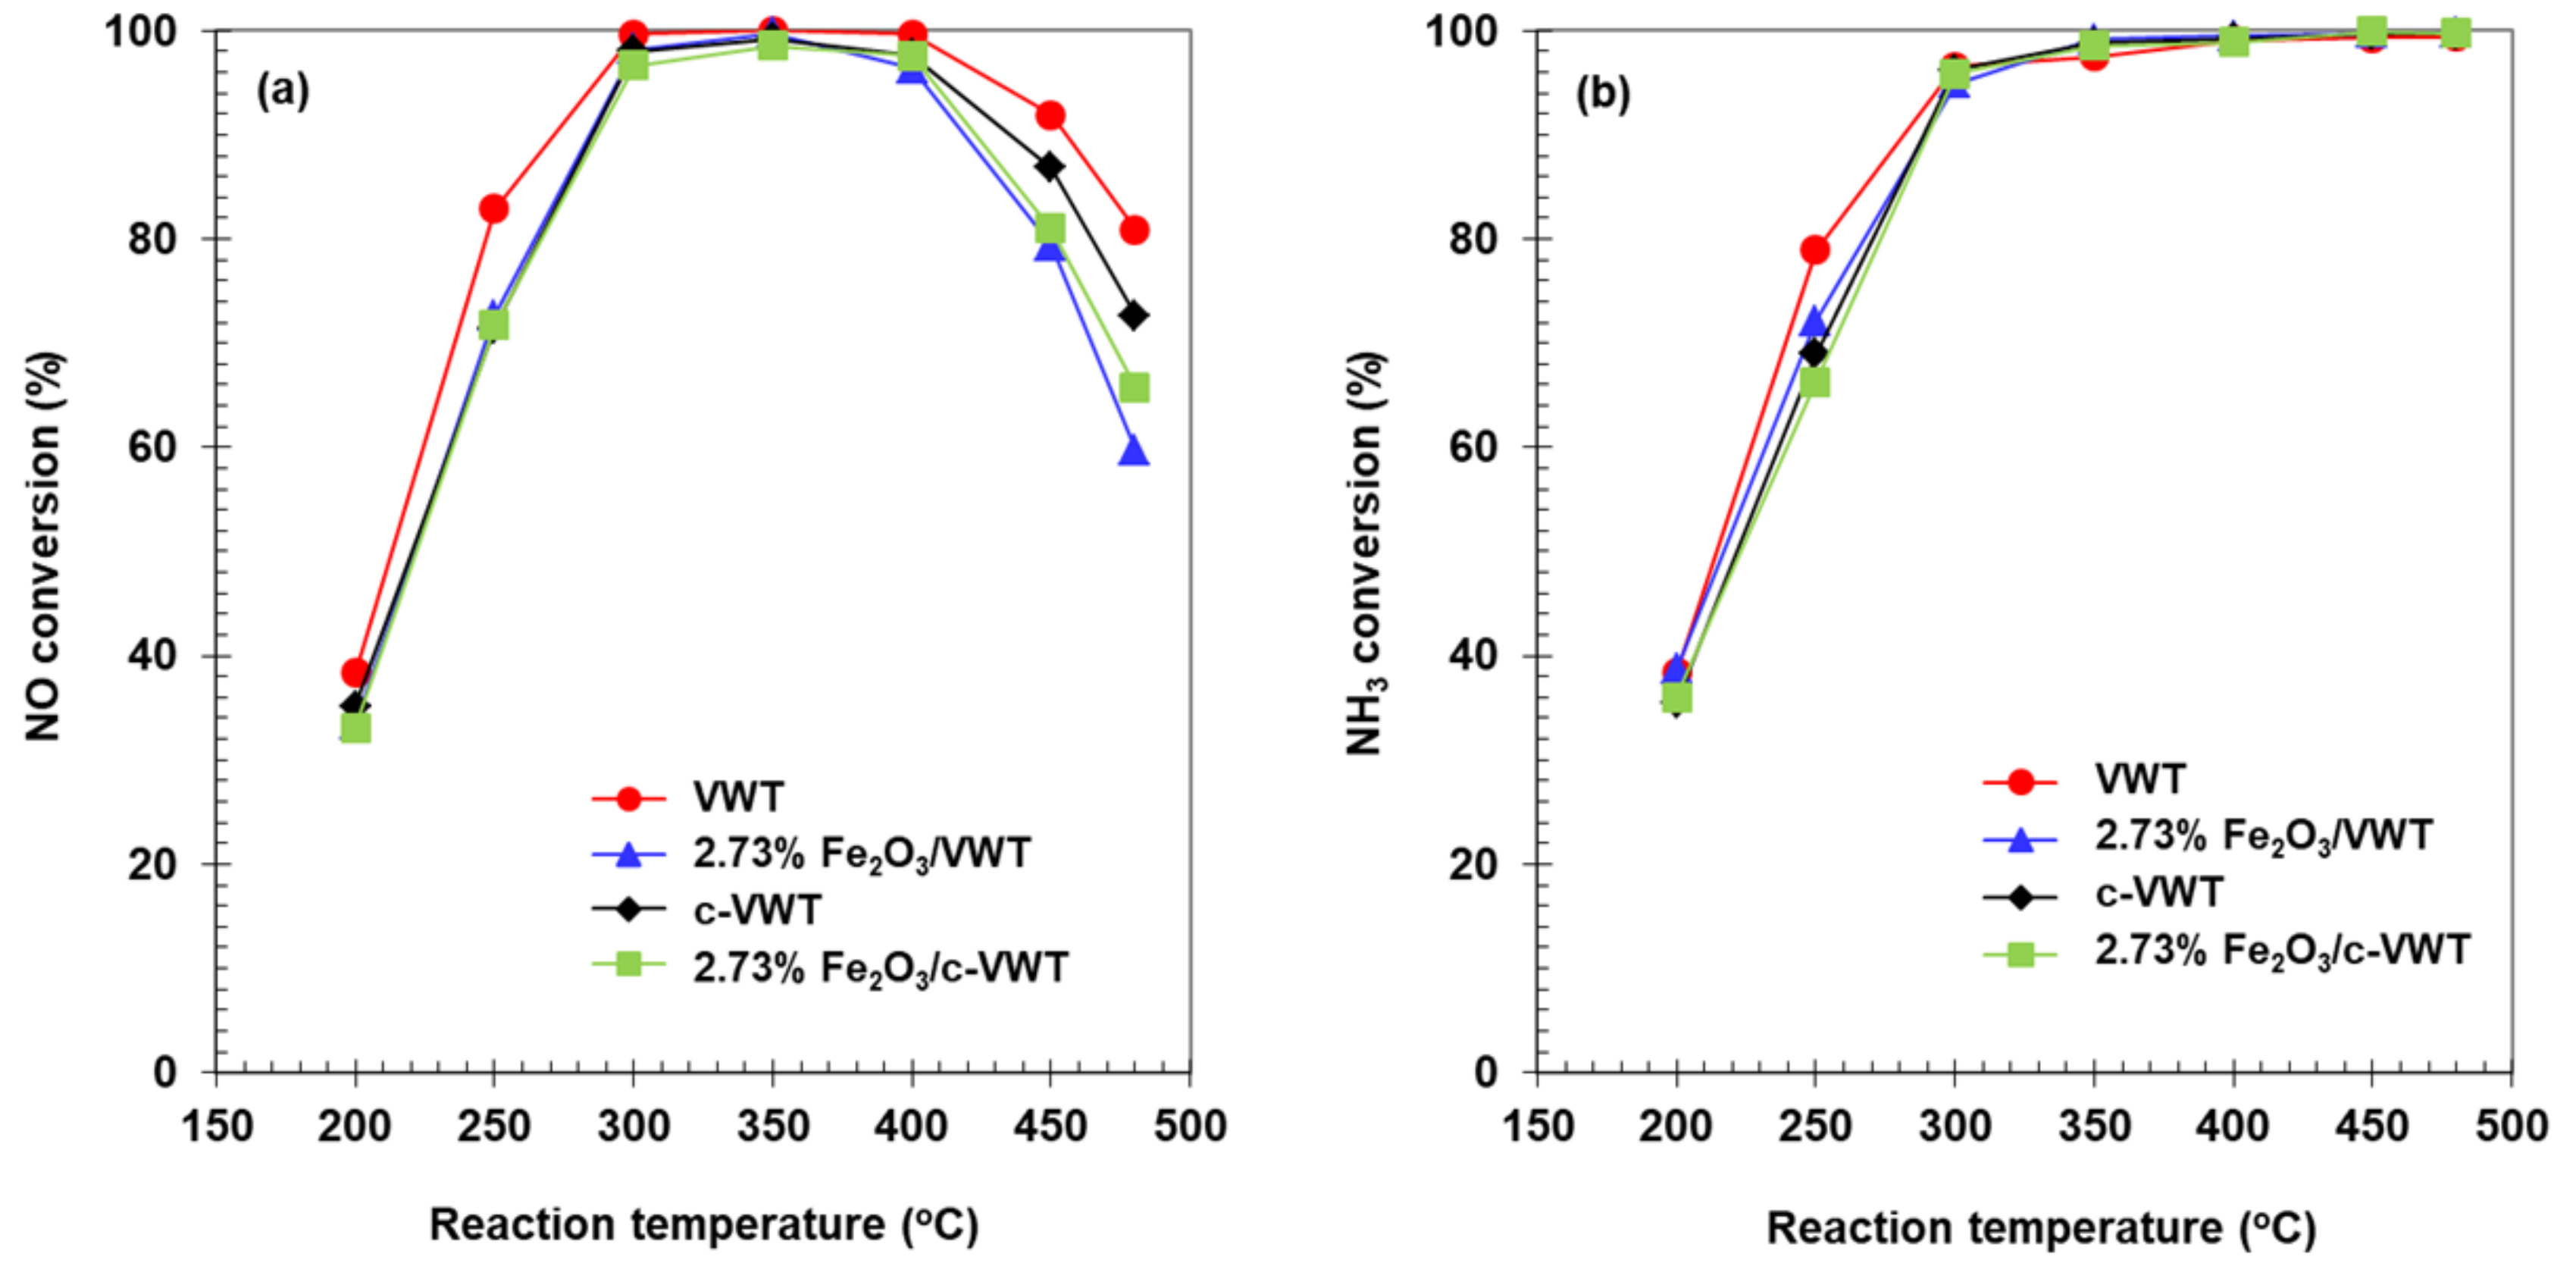
Conversions of NO and NH3 in deNOx reaction with VWT, 2.73% Fe2O3/VWT, c-VWT, and 2.73% Fe2O3/c-VWT and N2O production are shown in Figure 3 and Figure 4, respectively. The VWT-only exhibited 100% NO conversion at 300–400 °C, while at higher temperatures, it decreased depending on the temperature, as provided in Figure 3a. This shape of activity loss is a common feature of NH3-SCR reaction over V2O5/TiO2-based catalysts due to some side reactions giving N2O, N2, and NO [1,13,34]. The commercial unpromoted catalyst, i.e., c-VWT, basically showed a similar temperature vs. deNOx activity. These behaviors are consistent with those reported for 1.7–3.5% V2O5 dispersed on a commercial 10% WO3/TiO2 [1], 1.5% V2O5-10% WO3/TiO2 [35], and 1–5% V2O5 on four different commercial WO3/TiO2 supports with a WO3 content of 4.7–6.8% [36]. After addition of 2.73% Fe2O3 to VWT and c-VWT, these all gave a significant decrease in NO conversion above 400 °C. As an example, the 2.73% Fe2O3/VWT had a NO conversion of 60% at 480 °C, which is lower, by 20%, than that indicated over the unpromoted catalyst. In case the 2.73% Fe2O3/c-VWT was used, the extent of such a decrease was much smaller.
Figure 3b shows NH3 conversions over the unpromoted and promoted catalysts. Each value for NH3 conversion below 400 °C could be comparable to that indicated for NO (Figure 3a), which is consistent with the overall reaction described by Equations (1) and (2). However, at higher temperatures the value was 100% regardless of the catalyst employed, and there is a difference in conversion between NH3 and NO. This discrepancy depended not only on the catalyst employed but also on the presence of the iron oxide. The extent of the difference was smaller over the laboratory-made VWT than over the c-VWT, but this trend was reversed when 2.73% Fe2O3 was promoted to VWT and c-VWT (Figure 3a,b). Consequently, it is definitely represented that besides the general SCR mechanism, NH3 would be consumed via undesired pathways at high temperatures >400 °C.
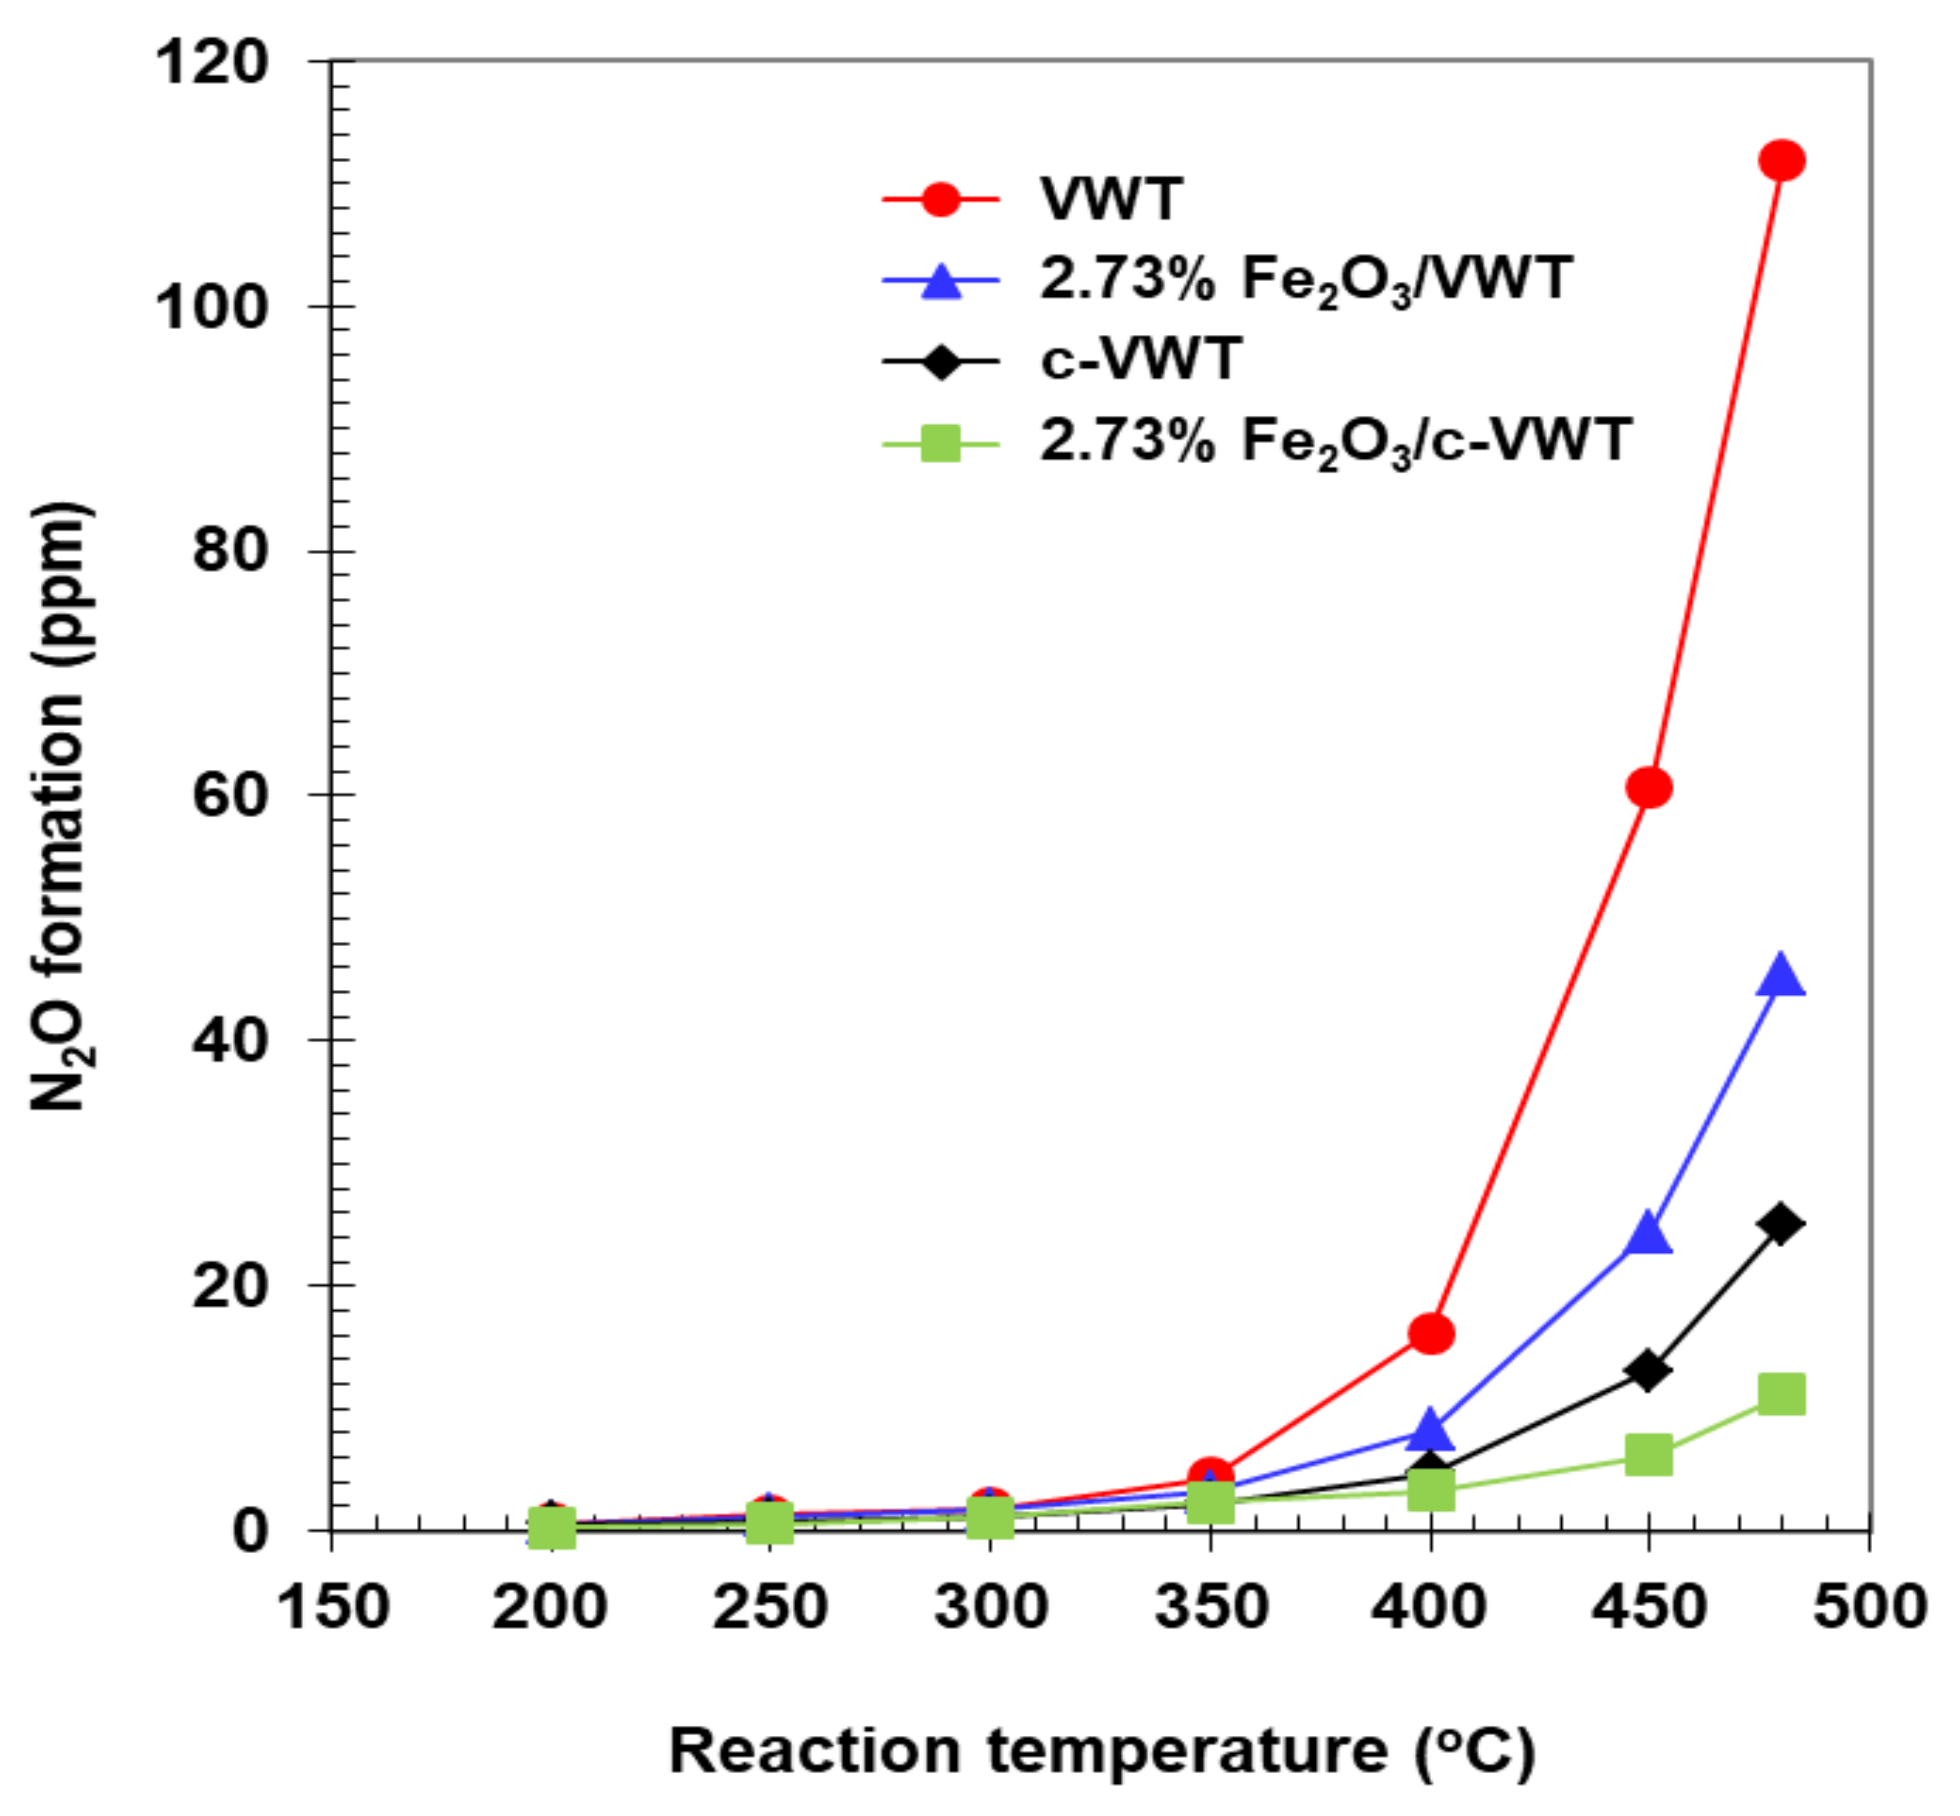
N2O could be produced over V2O5-WO3 (or MoO3)/TiO2 catalysts widely used for stationary and mobile applications and it can approach about 750 ppm depending strongly on the catalyst formulation and reaction conditions [8,13,37]. Whether or not the formation of N2O in NH3-SCR reaction with Fe2O3-promoted V2O5-WO3/TiO2 catalysts can be significantly depressed is of particular interest. Results are provided in Figure 4. A comparison between VWT and 2.73% Fe2O3/VWT indicated that the Fe2O3 promotion can greatly suppress N2O production. That is, the VWT catalyst had, respectively, ca. 60 and 110 ppm N2O at 450 and 480 °C, but the respective values decreased to about 25 and 45 ppm over the promoted VWT sample, corresponding to a reduction by 60% regardless of the temperature. This catalyst lost a NO conversion by 12–20% at 450–480 °C, compared to that observed for the VWT-only (Figure 3a). Although the indicated difference in NO conversion between c-VWT and 2.73% Fe2O3/c-VWT at temperatures >400 °C was less than 10% (Figure 3a), a depression effect on N2O formation was similar to that of the promoted VWT catalyst (Figure 4). It represents that the Fe2O3 species in the VWT and c-VWT can be responsible for significant reduction in N2O emissions from NH3-SCR reaction at high temperatures.
The small changes in the textural properties of the Fe2O3-promoted catalysts (Table 1) might not contribute to the observed decrease in both NO removal and N2O formation above 400 °C, because these reactions are predominantly determined by chemical compositions rather than textural features [8,38]. A commercial V2O5-WO3/TiO2 catalyst after prolonged usage at industrial deNOx plants could yield a large amount of N2O via Equation (3) at high temperatures [6]. However, low N2O production over the Fe2O3-promoted catalysts may not be due to significant inactivation of Equation (3), since in this circumstance, all NO and NH3 conversions shall decrease by Equation (1). If the observed decrease in the NO conversion were because of Equation (4), the extent of the N2O formed should increase. Based on the discussion, and the measured data for NO and NH3 conversions, it is proposed that the oxidation of NH3 into NO over the promoted catalysts at high temperatures,
could occur. Thus, the NO gives rise to the decrease in deNOx, activity while NH3 conversion is still high. Such a NO generation even at 300 °C can take place over Fe2O3-containing mixed metal oxides, such as Fe2O3-TiO2, which has been also highly active for NH3-SCR reaction [39]. A 3% V2O5-9% WO3/TiO2 catalyst shows the formation of NO in NH3 oxidation at temperatures >425 °C, depending on concentrations of O2 in a feed gas stream [14]. Consequently, the addition of Fe2O3 to V2O5/TiO2-based catalysts depresses the formation of N2 in NH3-SCR reaction at high temperatures, but unfortunately this approach can accompany the undesired pathway.
4NH3 + 5O2 → 4NO + 6H2O,
Another interest to us is whether or not different N2O production levels of unpromoted and Fe2O3-promoted catalysts could result in a difference in absolute NO conversion between them. VWT had a NO conversion near 80% at 480 °C, and a similar value could be exhibited over 2.73% Fe2O3/VWT at 450 °C (Figure 3a). Therefore, both samples should give 50 ppm N2O because of 100% conversion for NH3 at each temperature (Figure 3b) and the fact that all the NH3 was consumed according to Equation (4). However, the latter catalyst generated ca. 25 ppm N2O at 450 °C (Figure 4), which is only a half of the concentration of N2O expected using Equation (4), while the unpromoted one did ca. 110 ppm N2O at 480 °C, which is over twice as high as the expected N2O (Figure 4). These points represent that the VWT-only could produce N2O via Equation (3) and that Fe2O3 species added to VWT can depress N2O emissions in NH3-SCR reaction. Such a role is probable, with an assumption not only that the promoted VWT could have more abundant NH3 species strongly adsorbed on the surface but also that the NH3 could readily reduce N2O produced [24]. This surface reaction can be successfully described as the overall stoichiometry [16,20,21],
and it is consistent with earlier studies that N2O has been easily reduced by NH3 over Fe-zeolites [20,21,40]. Furthermore, this pathway to decrease N2O production was very similar to that reported in our previous work for a commercial V2O5-WO3/TiO2 catalyst coated by Fe-ZSM-5 [16], indicating that Fe2O3 is promised as a much cheaper, simpler promoter for significant reduction in N2O emissions in NH3-SCR reaction at high temperatures. On the other hand, 2.73% Fe2O3/c-VWT and c-VWT both showed much lower N2O concentrations than maximum values that can be reached by only a single pathway of Equation (4) at similar a NO conversion to each other (Figure 3a and Figure 4). Besides this, all the catalysts above 350 °C gave lesser N2O production than those over the unpromoted and promoted VWT (Figure 4). It suggests that the c-VWT-based catalysts may possess much greater ability to catalyze Equation (6). Surface chemistry regarding this reaction occurring on the Fe2O3-promoted VWT and c-VWT catalysts will be evident in NH3 TPD (temperature-programmed desorption) measurements below.
4N2O + 4NH3 + O2 → 6N2 + 6H2O,
2.4. Role of Fe2O3 Species for the Suppression of N2O Formation
In the TPD of NH3 adsorbed on VWT, 2.73% Fe2O3/VWT, c-VWT, and 2.73% Fe2O3/c-VWT, mass spectra for the releasing NH3 and gaseous products such as H2O, N2O, NO, and N2 are provided in Figure 5 and Figure 6. Predominant desorption of the adsorbed NH3 occurred at temperatures ranging from 225 to 275 °C with bumps at 370–425 °C and high-temperature peaks at 650–690 °C, depending on the catalyst, as shown in spectra S1 to S4 in Figure 5a. Both a downward-shift of a maximum desorption temperature by 20–35 °C and an appreciable increase of the 650–690 °C NH3 occurred on the Fe2O3-promoted samples (Figure 5a(S2,S4)). This implies that although the Fe2O3 species weakened the acid strength of sites for NH3 desorbing at relatively low temperature region, they could significantly increase very stable NH3 species. This agrees well with the discussion above. Figure 5b shown for H2O generation is indicative of the oxidation of the adsorbed NH3 to the N-containing products. The H2O gave peaks with maxima around 250–260, 450–470, and 645–660 °C, depending on the sample (Figure 5b(S1–S4)). A relatively much higher H2O production at the 645–660 °C region was detected for c-VWT and 2.73% Fe2O3/c-VWT (Figure 5b(S3,S4)), proposing that these catalysts can, to a much greater extent, oxidize the adsorbed NH3 species into the N-containing gases, as shown below.
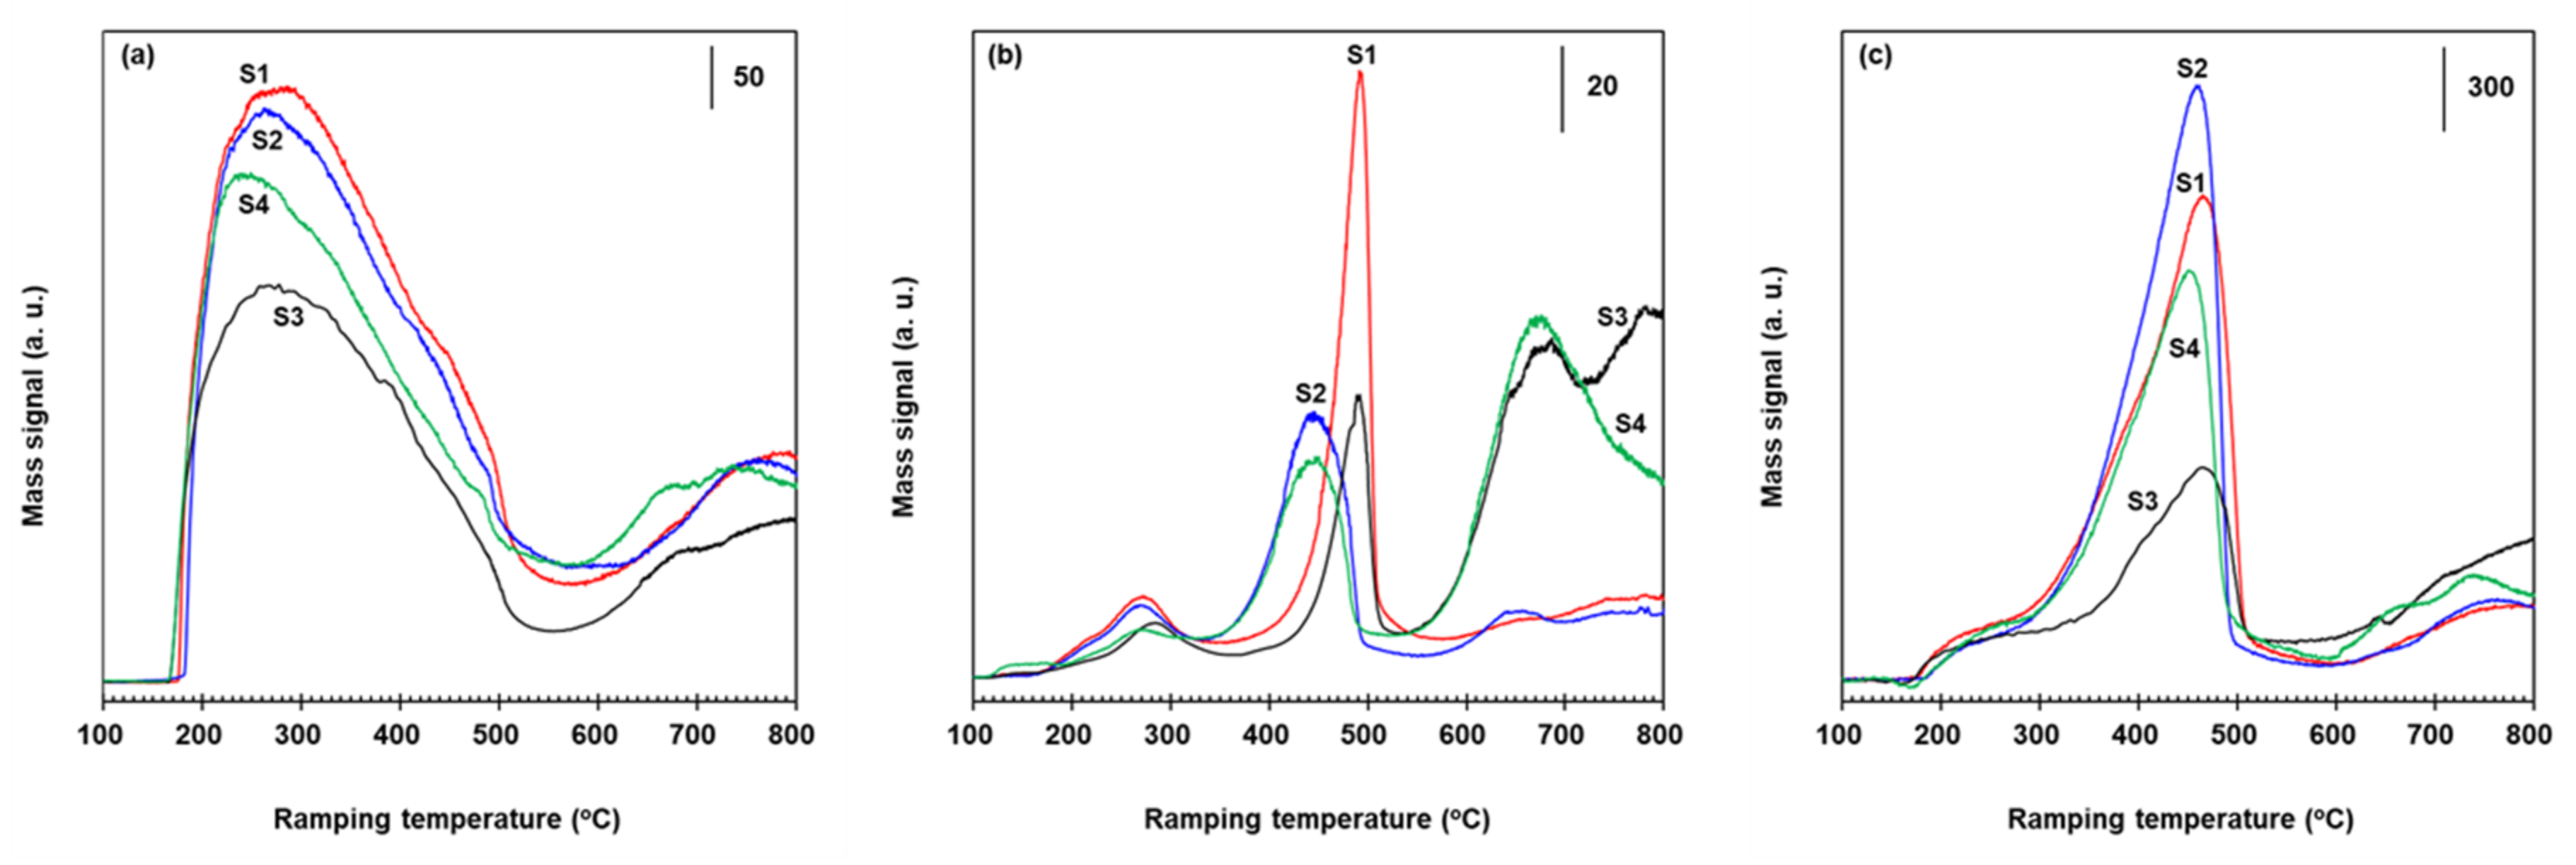
Mass spectra for N2O, NO, and N2 in the NH3 TPD runs with the bare and Fe2O3-promoted catalysts are provided in Figure 6. All these catalysts gave major NO peaks having a maximum at 240–280 °C with shoulders at 375–415 and 480–495 °C, and relatively small peaks at temperatures >570 °C (Figure 6a). The last peaks are indirect evidence of NH3-related species strongly adsorbed on the catalyst surface. It is clear that NH3 adsorbed on the catalysts reacts with labile surface oxygen atoms existing in VOx, FeOx, and WOx to create gaseous NO [41,42]. The most appropriate overall stoichiometry of this surface reaction can be described using Equation (5). Of course, the extent of the NO formation is small when the indicated size of the vertical solid bar in Figure 5 and Figure 6 was compared each other.
Figure 6b shows N2O production whose peaks at 270–285, 445–490, and 650–680 °C appear. Their intensity greatly depended on the catalyst, as seen in spectra S1–S4. c-VWT had an additional peak at 780 °C and showed a N2O production profile similar to that reported for another commercial 1.68% V2O5-7.6% WO3/TiO2 catalyst [16]. The 780 °C N2O peak disappeared after promotion with 2.73% Fe2O3 (Figure 6b(S4)). All these N2O peaks might come from NH4+-like species on Bronsted acid sites such as W5+-OH and WO3-induced V4+-OH, and from NHx moieties (x = 1–3) adsorbed on Lewis acid sites, VOx, WOx, and FeOx [43,44,45]. Both α-Fe2O3 and γ-Fe2O3 have no Bronsted acidity [46,47]. An intensity of the 650–680 °C N2O peak in VWT and 2.73% Fe2O3/VWT (S1 and S2) was very weak compared to that in the other samples (S3 and S4), which is in excellent agreement with the H2O production levels (Figure 5b). All the unpromoted catalysts (spectra S1 and S3 in Figure 6b) gave N2O peaks at 490 °C. This temperature was shifted to 445 °C over Fe2O3-promoted samples (S2 and S4), implying that the Fe2O3 allows a decrease in the activation energy for the oxidation of adsorbed NH3 to N2O. The promoted catalysts showed lesser N2O emissions in NH3-SCR reaction (Figure 4). It is well-known that direct oxidation of NH3 to N2 and N2O, not via adsorbed NHx species (x = 1 or 2), is improbable and NH species on V5+=O sites reacts with gas-phase NO to form N2O and V4+-OH [11,39,48]. This represents that gaseous NO is essential for such N2O production, suggesting an involvement of NO molecules shown in Figure 6a because of no feed of NO upon NH3 TPD experiments.
Mass spectra for N2 evolved in NH3 TPD runs with the unpromoted and promoted catalysts are shown in Figure 6c. Each catalyst had a predominant peak at 450–465 °C with a shoulder at 280–350 °C and a broad peak at temperatures >600 °C, depending on the sample, as seen in profiles S1–S4. As for NO and N2O in Figure 6a,b, all those N2 peaks would be associated with ammonium ions and NHx on Bronsted and Lewis acid centers [43,44,45]. The NHx species are oxidized to N2 via NO-assistant route, as discussed [11,39,48]. The presence of Fe2O3 in VWT and c-VWT caused not only a shift of the major N2 peak to lower temperatures, by 5–15 °C, but also a significant increase in their intensity, and such changes were greater for the commercial-based catalysts (Figure 6c(S3,S4)). These are in good accordance with the observed trend in the water production of H2O as an indicator of N-associated side reactions (Figure 5b). It is thought that the promotion by amorphous iron oxide particles can decrease the activation energy for the oxidation of the adsorbed NH3 species into N2 and significantly enhance this reaction.
Based on the results in NH3 TPD experiments with the unpromoted and 2.73% Fe2O3-promoted catalysts, and the previous discussion, the iron oxide promotion could significantly increase surface NH3 species, producing the 650–690 °C peak (Figure 5a), and this ammonia species can be oxidized to NO, N2O, and N2 at high temperatures >550 °C (Figure 6). The presence of the Fe2O3 is, to some extent, responsible for the loss in deNOx activity at temperatures >400 °C due to the NO formation (Figure 3a). The NO formed via Equation (5) and/or NO in the feed stream may act as an intermediate for the N2O and N2 production [11,39,48]. Thus, Equation (3) rather than Equation (4) may be a main route for the formation of N2O in NH3-SCR reaction at temperatures >350 °C, and according to Equation (6), the N2O can be easily reduced by the strongly-adsorbed NH3 species on Fe2O3 and/or its related surface complex interacting with surface V2O5 species, thereby producing less N2O in NH3-SCR reaction with the promoted catalysts (Figure 4). This proposal is similar to that reported for great reduction in N2O emissions over Fe-zeolites alone and Fe-ZSM-5-coated V2O5-WO3/TiO2 catalysts [16,20,21,23,40]. Consequently, Fe2O3 species existing in V2O5/TiO2-based catalysts play a significant role for the suppression of N2O formation in NH3-SCR reaction at high temperature side, and this approach is a much simpler and more cost-effective compared to Fe-zeolite promotion techniques.
2.5. Surface Structure of Fe2O3, V2O5, and WO3 Species
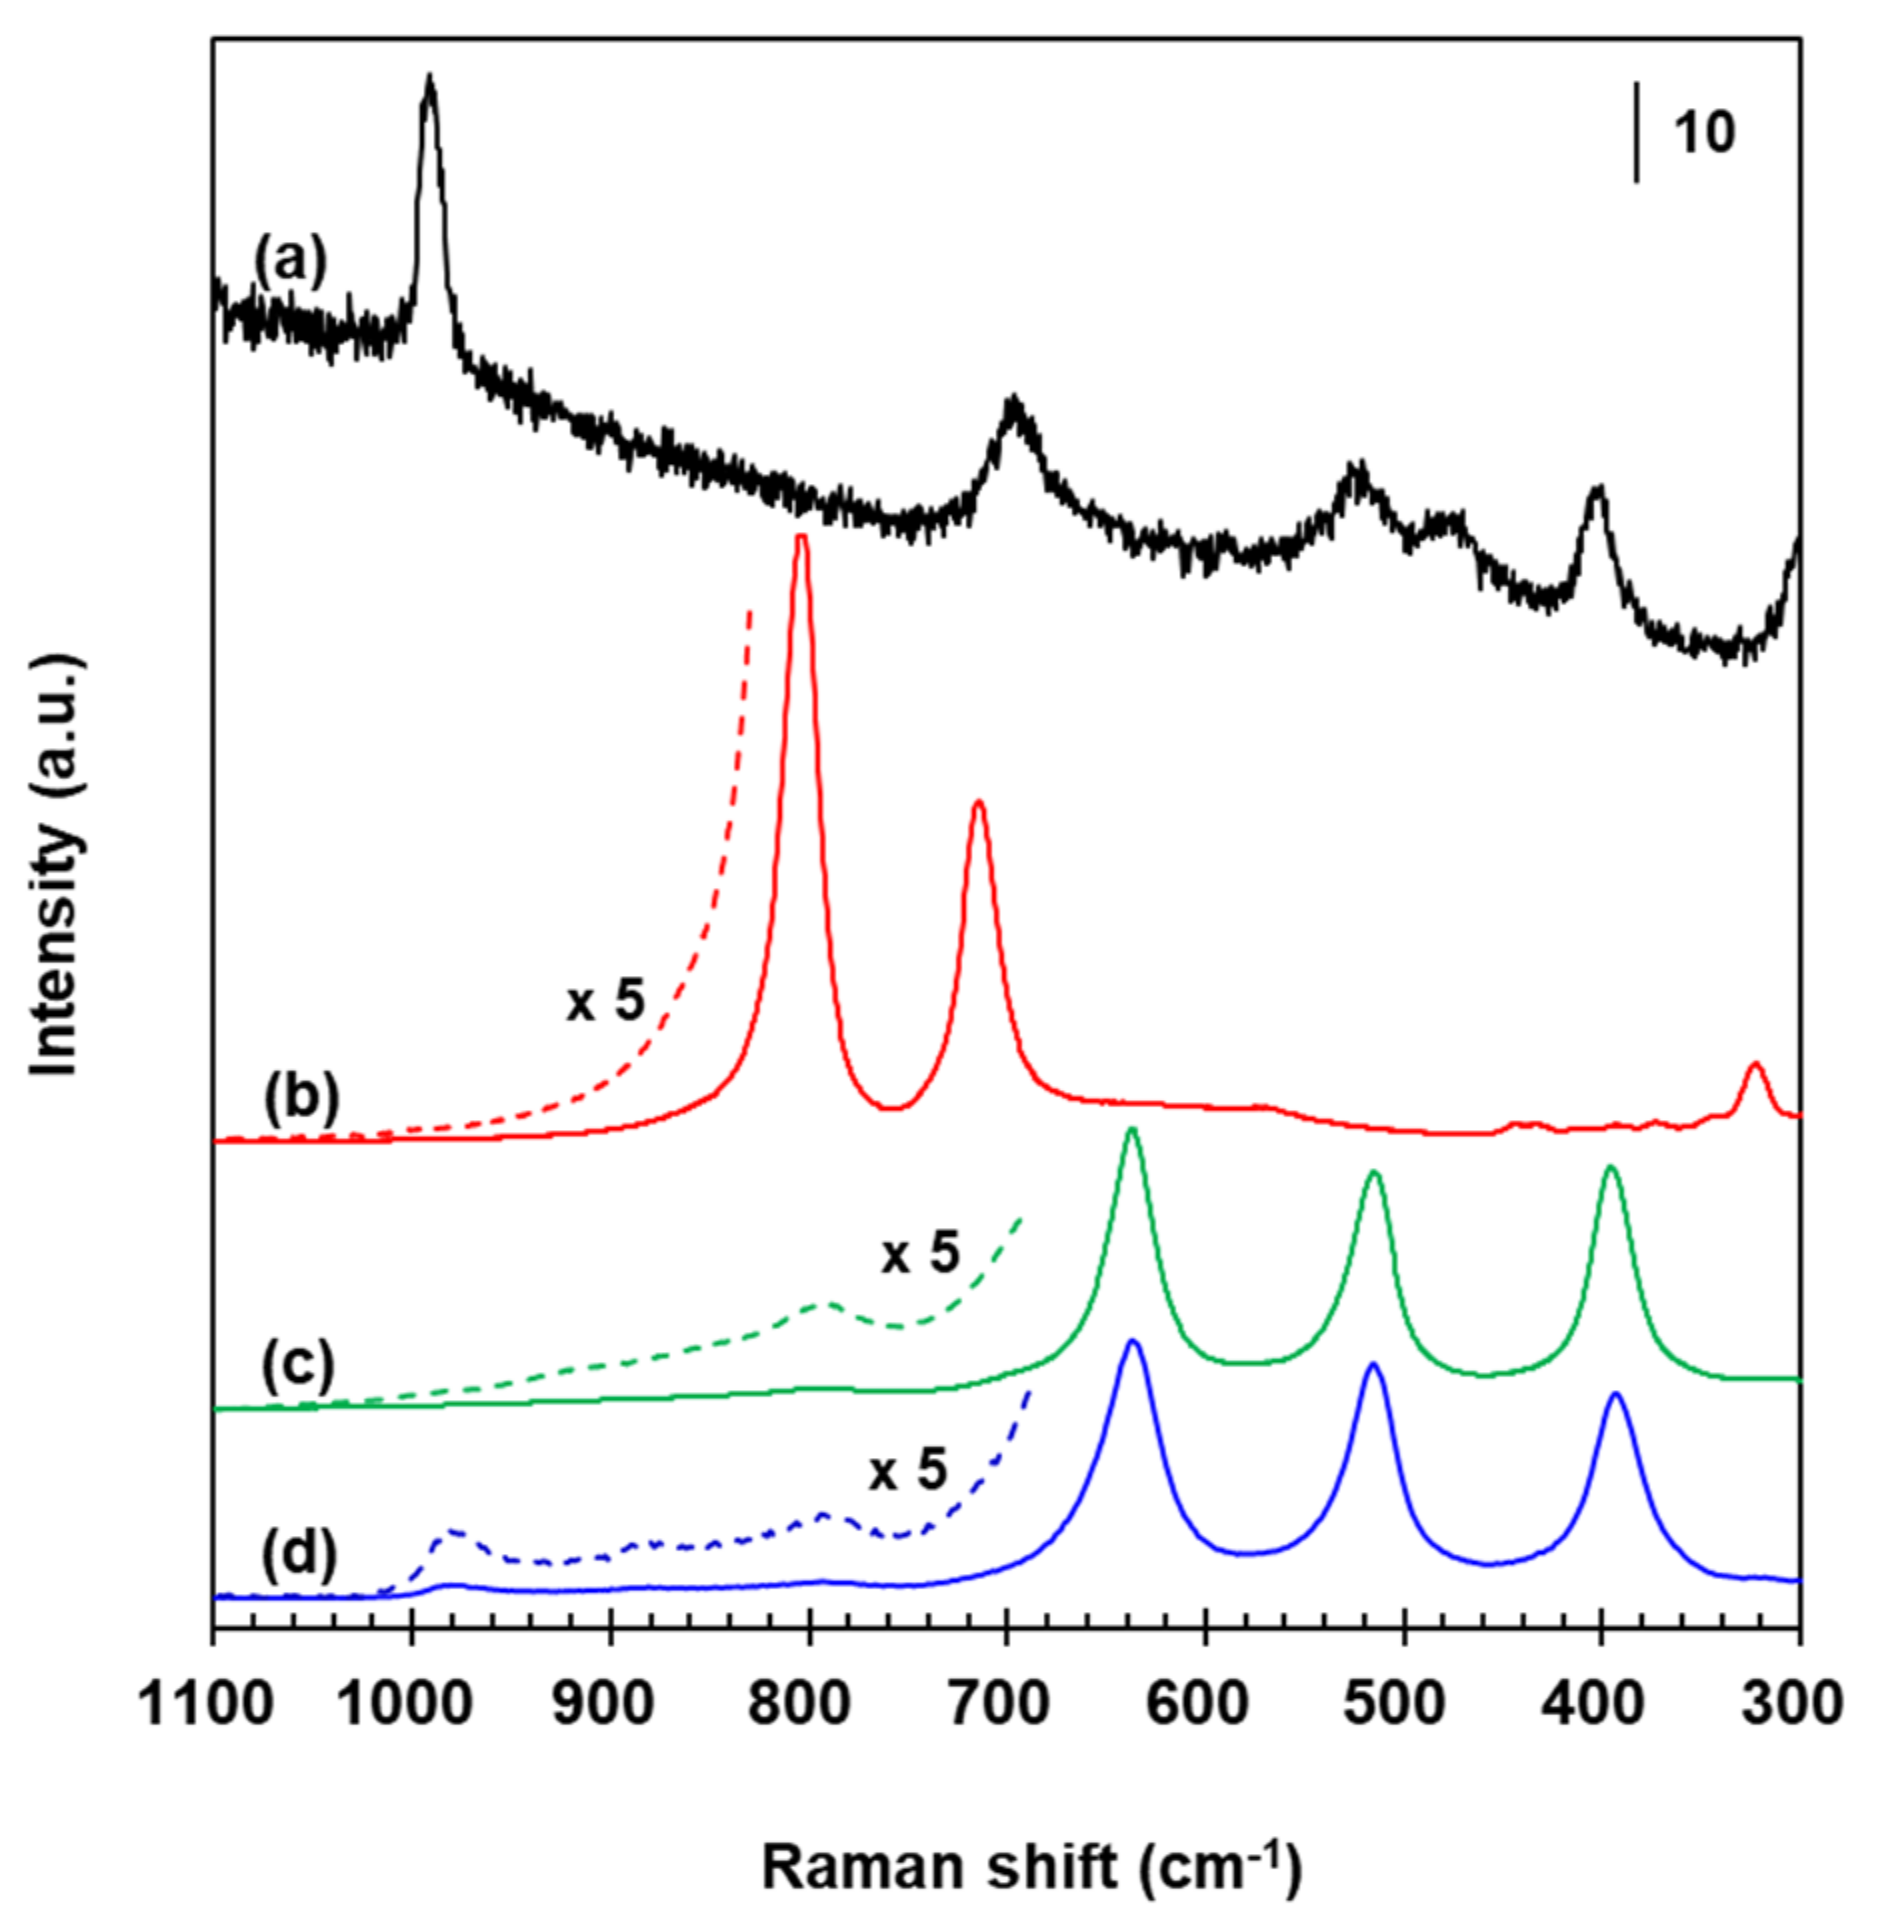
Figure 7 shows Raman spectra for reference materials and WT whose original signals have been reduced by 1/10–1/1000 for an easier comparison, but all bands have been kept unchanged even after such a data processing. α-phase V2O5 polycrystallites yielded a sharp peak at 990 cm−1 with subsequent signals near 400, 470, 515, and 700 cm−1, as seen in Figure 7a. Crystalline WO3 had characteristic sharp bands around 800 and 715 cm−1 (Figure 7b), and no Raman signals at frequencies >800 cm−1 even in a magnified spectrum existed as indicated by the dashed line. The measured spectra for the V2O5 and monoclinic γ-WO3 (P21/n) are in agreement with earlier studies [49,50]. Bands due to highly-dispersed amorphous WOx in a sample of WT that has been employed for preparing VWT and 2.73% Fe2O3/VWT catalysts can be differentiated by comparing with those existing in a bare anatase TiO2 (Figure 7c,d). This support had Raman signals at 397, 515, and 638 cm−1 (Figure 7c) with a predominant band at 145 cm−1 and a weak one at 197 cm−1 (not shown here). The 397, 515 and 145, and 197 and 638 cm−1 bands correspond to the respective B1g, A1g + B1g and Eg phonon vibrations of anatase-type TiO2 [49,51,52,53]. A weak signal at 793 cm−1 (see the magnified spectrum in Figure 7c) is due to the first overtone of the 395 cm−1 [49,52,53]. Besides these peaks, bands at 882 and 980 cm−1 existed in the WT sample, as provided in the magnified spectrum in Figure 7d. The 980 cm−1 peak is assigned to two-dimensional polytungstate species with distorted octahedrally-coordinated environments that have been reported for calcined WO3/TiO2 samples not exceeding a monolayer coverage [53,54]. The 882 cm−1 is associated with asymmetric W-O-W vibrations in polymeric surface WOx species [53]. It is represented that the WT sample has two different surface WOx species. The absence of the 800 and 715 cm−1 bands reveals no crystalline WO3 particles, indicating a very good dispersion of the tungsten oxide on the titania.
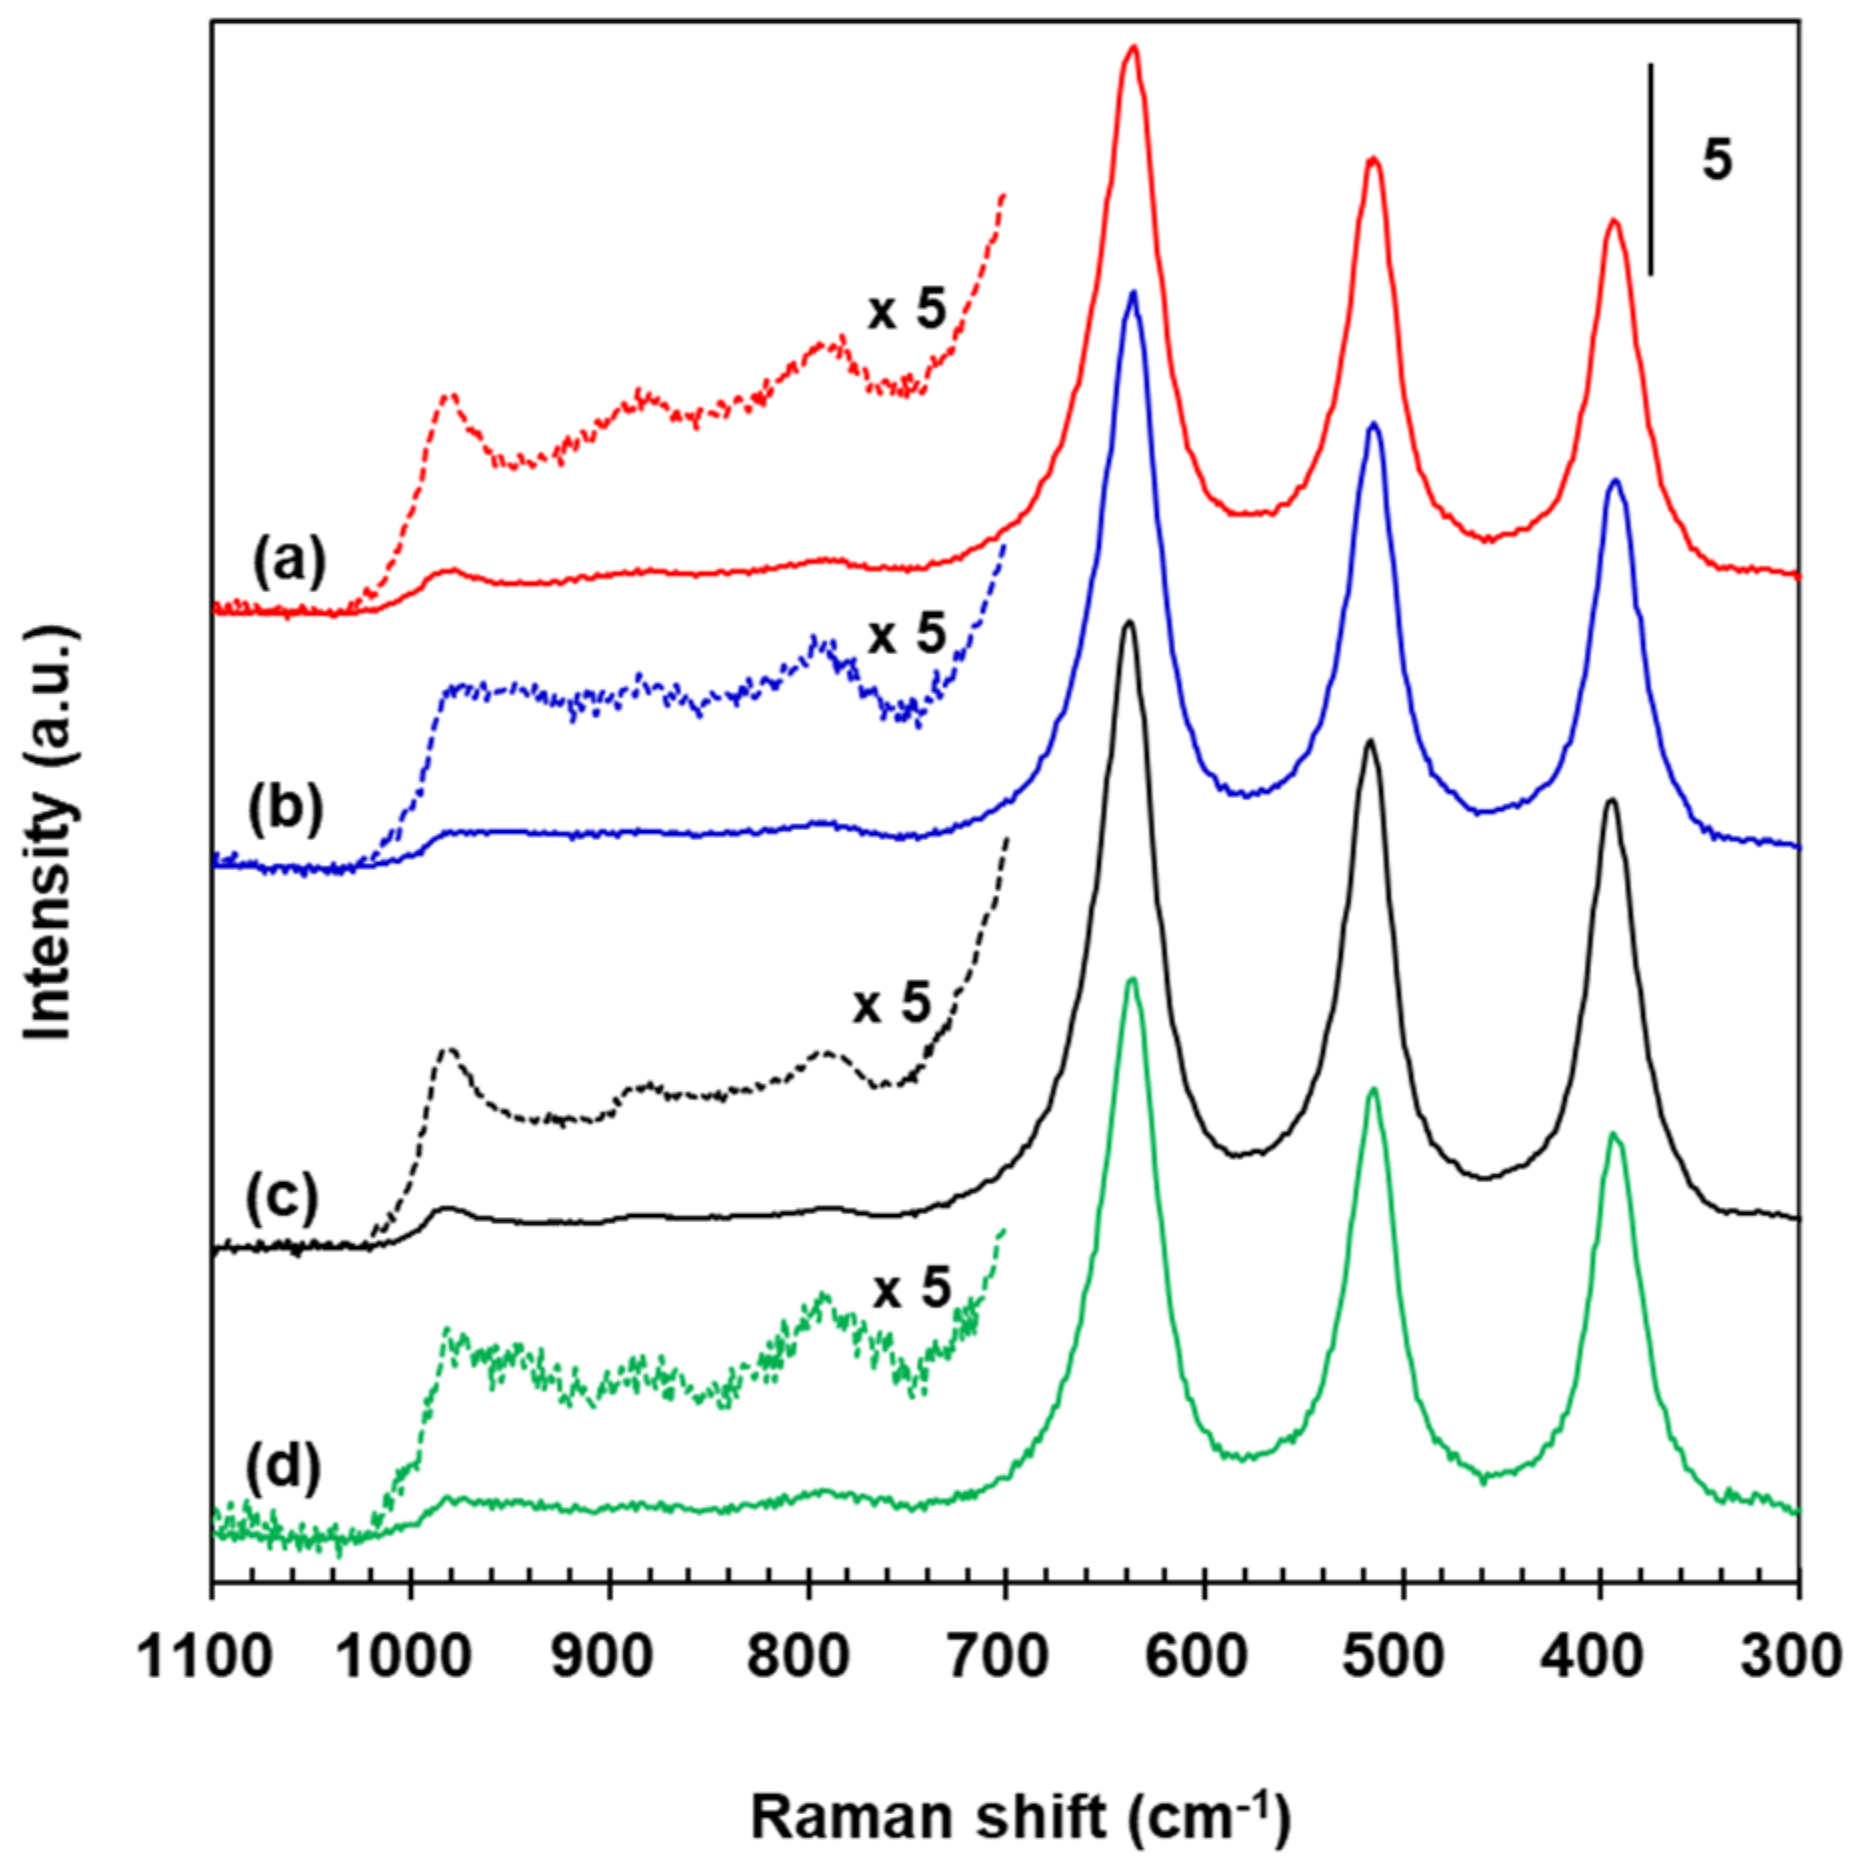
Raman spectra for VWT, 2.73% Fe2O3/VWT, c-VWT, and 2.73% Fe2O3/c-VWT are provided in Figure 8. All the catalysts had bands near 394, 515, 636, and 790 cm−1, that are due to the TiO2 support (Figure 7c), and they all also produced peaks at 880 and 981 cm−1 (Figure 7a–d). Any of the catalysts indicated no band near 1020–1030 cm−1 regarding isolated surface VOx species [35,55]. The 981 and 880 cm−1 peaks had appeared even in the WT-only sample (Figure 7d). Regardless, these two bands may not be originated from the W=O and W-O-W structures in the surface tungsten oxide species. Symmetric V=O and W=O stretching vibrations occur at 950–990 cm−1, making it difficult to clearly distinguish between both species, but the V=O species have an interaction cross section that is almost four times greater than that of the W=O groups [53,55,56,57]; thus, a Raman signal by the V=O structures in surface vanadium oxide species would give much stronger intensity at the frequency region. Furthermore, it has been reported not only for no appreciable mutual effect on the surface structures of VOx and WOx species in V2O5-WO5/TiO2 systems with low total VOx and WOx coverages but also for Raman bands at 940–987 cm−1, due to two-dimensional VOx species in 1–4.5% V2O5/TiO2 below a monolayer coverage, whose positions are usually higher, by 10–30 cm−1, than that of surface WOx species in 1–7% WO3/TiO2 [55,58]. Consequently, the 880 and 981 cm−1 bands correspond to the respective bridging V-O-V and terminal V=O structures in distorted octahedrally coordinated VO6 species, even in the TiO2-supported binary and ternary component systems employed here, and indicate the presence of polymerized mono-oxo vanadate species [49,53,55,56,58].
All the iron oxides discussed in the XRD measurements, except for magnetite, exhibit Raman bands at 1000–1600 cm−1 in which no Raman signals by TiO2 appear [30,49,51,59]. However, all the 2.73% Fe2O3-promoted catalysts gave no bands in the frequency region as well as at 800–1100 cm−1 (Figure 8b,d). The latter is because of the absence of Fe=O bonds in the iron oxides. Of course, bands below 800 cm−1 by Fe-O in surface iron oxide species could not be visible due to very intense signals of the titania support itself. All the promoted samples also gave no peaks near 1320, and 1375 and 1580 cm−1 for crystalline α- and γ-Fe2O3, respectively [30]. The intensity of all the characteristic vibration modes of the support was maintained unchanged even after the addition of 2.73% Fe2O3 to VWT and c-VWT, proposing that no great interaction of the iron oxide species with the titania surface occurred. There is no indication of the formation of V2O5, WO3, and Fe2O3 crystals even in the titania-supported ternary systems, consistent with the previous discussion in the XRD measurements (Figure 1). This indicates that they all consist of submonolayer coverage of the metal oxides species. Table 2 lists the surface density of each metal oxide existing in the unpromoted and promoted catalysts that was estimated using its amount and their SBET value given in Table 1. Calculations of the surface coverage based on monolayer coverage of each metal oxide reported in the literature [60,61,62,63,64,65,66] are also provided in Table 2. Both VOx and FeOx were below monolayer coverage irrespective of the catalyst, but WOx in VWT, 2.73% Fe2O3/VWT and c-VWT could exceed the monolayer coverage, which is mainly due to a rather wide range of experimentally-determined WOx monolayer values, such as 4.6–7.0 μmol WOx/m2 [60,61,63,65,66]. The upper limit can give us a value near monolayer coverage. The calculated coverages are in reasonable agreement with the Raman measurements. The total surface coverage expressed as MeOx in Table 2 can be similarly explained, even though it was somewhat high for 2.73% Fe2O3/VWT. Finally, c-VWT after Fe2O3 promotion indicated a decrease in the surface coverages of each component, as well as of MeOx, consistent with the redispersion of V2O5 in the promoted catalyst (Figure 1d).
The noticeable difference between the unpromoted samples and the promoted ones is a new shoulder around 945 cm−1, broadening of the 981 cm−1 band, and appreciable weakening of the phonon intensity of the 880 cm−1 signal associated with polymeric surface VOx species (see the magnified spectra in Figure 8b,d). These strongly suggest an alteration of the molecular structure of surface vanadia and/or tungsta species when 2.73% Fe2O3 was introduced to VWT and c-VWT. However, it does not seem that there was a great structural interaction between the surface VOx species and the FeOx species, since the position of the 880 and 981 cm−1 bands is the same even after the promotion [61]. The terminal V=O band broadening is because of small interactions between the surface metal oxides, perhaps VOx and FeOx [55,60,63]. This was indicated by the disappearance of the XRD peak due to V2O5 in 2.73% Fe2O3/c-VWT (see Figure 1c,d), although such a change was not visible for VWT and 2.73% Fe2O3/VWT. The interaction can increase the extent of the disorder of the catalyst surface, and this becomes more energetically heterogeneous, suggesting that an enhancement to the main NH3-SCR routes and/or the side reactions over the promoted catalysts is probable. The new signal at 945 cm−1 may be associated with rearrangement of the polymeric surface VOx species, because it appeared with the weakening of the 880 cm−1 band. All samples of V2O5/TiO2 and V2O5-WO3/TiO2 with low total surface coverage exhibited signals near 945 cm−1 in their Raman spectra collected at ambient conditions, and these were assigned to surface metavanadate species [55]. On the other hand, not only a significant electronic interaction between Fe3+ species and V5+ ones in titania-supported iron vanadates that are highly active for NH3-SCR reaction could be evident from the Fe and V K-edge X-ray absorption, but a reduced oxidation capability of the vanadium oxide in the V-O-Fe species was alsoproposed to give a better N2 selectivity at high temperatures >300 °C [67]. Combining our Raman results with the earlier reports suggests that the tetrahedrally coordinated polymeric vanadates adjacent to Fe2O3 species play a role in the reduction of N2O formed in NH3-SCR reaction at high temperatures by strongly-adsorbed NH3 residues.
3. Experimental
3.1. Preparation of Catalyst Samples
A commercial powder-type 10% WO3/TiO2 (Tronox Ltd., formerly Kerr-McGee Corp., Stamford, CT, USA), hereafter designated to “WT”, was employed to prepare a V2O5-WO3/TiO2 catalyst. An appropriate amount of the WT (ca. 10 g) was calcined at 500 °C for 4 h in flowing 21% O2/79% N2 (Praxair, 99.999%, Changwon, Korea) at a total flow rate of 300 cm3/min. A 1.6% V2O5/WT catalyst was prepared by impregnating the calcined WT with an aqueous NH4VO3 (Aldrich, 99.99%, Saint Louis, MO, USA) solution with the corresponding vanadium content, which had been obtained by dissolving it in an aqueous solution of oxalic acid (Aldrich, ≥99%) with a pH near 2.5 dissolved in distilled, deionized water (DDI), referred to as “VWT”. A part of this sample was used for the preparation of approximately 5 g 2.73% Fe2O3/VWT that was made by impregnating the VWT with a aqueous solution of Fe(NO3)3·9H2O (Aldrich, ≥99.95%) dissolved in DDI water. A commercial extruded V2O5-WO3/TiO2 honeycomb was supplied from a domestic coal-fired power plant and crushed, finely ground, and calcined as for the WT, denoted to “c-VWT” to differentiate it from the VWT. A 2.73% Fe2O3/c-VWT catalyst was prepared using the calcined c-VWT in a fashion similar to that described for the VWT-supported iron oxide. All the catalysts used were dried at 110 °C overnight in an oven and then calcined as for the WT prior to using them for NH3-SCR reaction and characterization. The N2 and O2 used were further purified by passing them through moisture trap and Oxytraps (Alltech Assoc., Deerfield, IL, USA). The amounts of V2O5 and WO3 existing in the c-VWT were determined using ICP (inductively-coupled plasma) measurements.
3.2. NH3-SCR deNOx Reaction and Determination of N2O Formation
Details of the modified Model MARS 0.75 L/8.0 V White gas cell (Zemini Scientific Instr., Buena Park, CA, USA) combined with a Thermo Electron Nicolet 7600 FT-IR spectrophotometer (Thermo Fisher Scientific, Waltham, MA, USA) used in the present study to measure conversions of NO and NH3 and the extent of N2O production in NH3-SCR reaction have been described earlier [6,68]. A continuous purge of this system was allowed by flowing a compressed air at a rate of 15 L/min that had passed through a train of large volume silica traps to remove H2O in the air. The NH3-SCR reaction with catalyst samples was conducted in a continuous flow type I-shaped 3/8″ OD quartz reactor placed in a three-independent temperature adjustable electric furnace (Lindberg/Blue M Model HTF55347C, Thermo Electron Corp., Asheville, NC, USA) coupled with a Lindberg/Blue M Model CC584343PC PID controller [6,16,27,68]. All gas feed lines were maintained at a temperature near 180 °C to prevent the homogeneous reaction between NO and O2, and the condensation of H2O produced in the reaction.
A flowing mixture of 21% O2/79% N2 at a total rate of 1000 cm3/min was flowed through the reactor with typically 0.5 g catalyst sample to calcine it at 500 °C for 1 h, and then the temperature and oxygen concentration were changed to 200 °C and 5%, respectively. After this, the downstream was switched to the upstream, at which point the gas cell was fully purged prior to recording a background interferogram that was used for Fourier-transforming sample interferograms. Then NO and NH3 were added to the gas flow so as to be 500 ppm, respectively. An interferogram before reaction was collected at their steady-state concentration. Following this, the gas mixture was flowed over the catalyst bed at chosen temperatures, corresponding to a gas hourly space velocity of 76,200 h−1, and a sample interferogram was obtained after ca. 30 min. All interferograms were collected with a resolution of 0.5 cm−1 and a scan number of 100. The NO (Omega grade, 99.99%, Scott Specialty Gases, South Plainfield, NJ, USA) and NH3 (Scott Specialty Gases, Electronic grade, 99.999%) were used without any purification, while the N2 was flowed through an Alltech moisture trap. All gas flows were accurately controlled by using a Model 5850E mass flow controller (Brooks Instr., Hatfield, PA, USA) and a Model F-200CV one (Bronkhorst High-Tech, Ruurlo, The Netherland). Details of the standard procedures to collect the gas-phase spectra have been provided elsewhere [6,68].
3.3. Characterization of Catalyst Samples
A Model D/MAX2500 PC diffractometer (Rigaku, Tokyo, Japan) with a Cu Kα (λ = 1.5405 Å) radiation source was employed for XRD measurements in which an X-ray tube voltage and current were 40 kV and 20 mA, respectively. Each calcined sample charged in a thin quartz holder was scanned from a 2θ value of 10 to 80° at a scanning rate of 0.1°/min to allow an accurate resolution.
A Model 3 Flex Version 3.01 system (Micromeritics Instr., Norcross, GA, USA) was used to determine textural properties of the catalysts, such as SBET, dm, and Vt. A cell containing ca. 60 mg of each sample was directly connected to the system, evacuated at 300 °C overnight (under a high dynamic vacuum below 10−7 Torr (1 Torr = 133.3 Pa)) and allowed for a further evacuation at room temperature. Following this, N2 was introduced into the sample cell at a liquid nitrogen temperature (−196 °C).
Temperature-programmed desorption (TPD) studies were conducted using a Model HPR-20 QIC quadrupole mass (Hiden Analytical, Warrington, UK) spectrometer system described in detail elsewhere [16,69,70]. For this, an adsorption cell with 160 mg of each sample was coupled with a gas handling system to calcine at 500 °C for 1 h in a flowing mixture of 21% O2/79% He (Praxair, 99.9999%) at a total flow rate of 100 cm3/min. Then, 2% NH3 in flowing He at the same flow rate was admitted to the cell at 100 °C for 1 h prior to fully purging it using the pure He flow. After the NH3 approached a background level, it was heated to 800 °C at 10 °C/min in a He flow at a total rate of 20 cm3/min. During this process, N-containing products, i.e., N2O, NO, and N2, were monitored at each corresponding m/z, but NH3 desorbed was monitored at m/z = 16, because H2O formed upon the surface reaction, producing the nitrogenous products that could be fragmentized to OH [16,69]. All the gases were controlled using a Model 5850E mass flow controller (Brooks Instr., Hatfield, PA, USA). The He used has been further purified in a similar fashion as described above.
Ex situ Raman spectra for fresh catalysts calcined in a fashion similar to that described for the activity measurements were recorded in the range of 50–3400 cm−1 with a 2 cm−1 spectral resolution. V2O5 (Aldrich, 99.99%), WO3 (99.995%), TiO2 (DT51D, Millennium Inorganic Chemicals, Henderson, Australia), and the WT were used as a reference material. The measurements were conducted using a Thermo Scientific DXR 2xi Raman spectrometer (Thermo Fisher Scientific, Waltham, MA, USA) equipped with a liquid N2-cooled EM-CCD detector around −120 °C. A 532-nm diode laser was employed to excite the samples. A power of the laser at a surface of each sample was applied to be ca. 2 mW in order to minimize laser heating effects. Exposure of each sample to the laser beam was approximately 0.01–0.03 s with 500 to 800 averaged signal accumulations, depending on the sample. All spectra were collected with a powder under ambient conditions.
4. Conclusions
Fe2O3-promoted V2O5/TiO2-based catalysts show no great changes in the textural features, and no XRD peaks due to crystalline Fe2O3 phases are indicated. Significant depression of N2O emissions in NH3-SCR reaction over V2O5-WO3/TiO2 catalysts at high temperatures could be successfully established by their promotion using Fe2O3 particles. This approach results in a decrease in NO conversion at high temperatures, which is mainly because of the oxidation of NH3 to NO. NH3 TPD measurements suggest that the Fe2O3 existing in VWT and c-VWT can significantly increase strongly-adsorbed NH3 and NHx moieties, and these species participate in the reduction of N2O formed at high temperatures. Raman spectra for the promoted catalysts propose the presence of Fe2O3-induced, tetrahedrally coordinated polyvanadates and/or surface V-O-Fe species that are probably responsible for the N2O reduction. The reaction between NO and NH3 may predominantly take place to form N2O that can be readily reduced by the strongly adsorbed NH3 over the Fe2O3-promoted catalysts.
Acknowledgments
A partial grant-in-aid for this study was provided by Basic Science Research Program through the National Research Foundation of Korea (NRF) via Grant # 2017080772.
Author Contributions
The key approach to this study was designed by Moon Hyeon Kim who also determined a significance of all data and wrote this manuscript. Ki Hyuck Yang performed the experiments regarding activity measurements and instrumental characterization. He also prepared a draft version of all Figures included here. The co-authors have made an approval of the final version of this manuscript.
Conflicts of Interest
The authors declare no conflict of interest.
References
- Marberger, A.; Elsener, M.; Ferri, D.; Krocher, O. VOx surface coverage optimization of V2O5/WO3-TiO2 SCR catalysts by variation of the V loading and by aging. Catalysts 2015, 5, 1704–1720. [Google Scholar] [CrossRef]
- He, Y.; Ford, M.E.; Zhu, M.; Liu, Q.; Tumuluri, U.; Wu, Z.; Wachs, I.E. Influence of catalyst synthesis method on selective catalytic reduction (SCR) of NO by NH3 with V2O5-WO3/TiO2 catalysts. Appl. Catal. B 2016, 193, 141–150. [Google Scholar] [CrossRef]
- Madia, G.; Elsener, M.; Koebel, M.; Raimondi, F.; Wokaun, A. Thermal stability of vanadia-tungsta-titania catalysts in the SCR process. Appl. Catal. B 2002, 39, 181–190. [Google Scholar] [CrossRef]
- Forzatti, P. Present status and perspectives in de-NOx SCR catalysis. Appl. Catal. A 2001, 222, 221–236. [Google Scholar] [CrossRef]
- Nova, I.; dall’Acqua, L.; Lietti, L.; Giamello, E.; Forzatti, P. Study of thermal deactivation of a de-NOx commercial catalyst. Appl. Catal. B 2001, 35, 31–42. [Google Scholar] [CrossRef]
- Kim, M.H.; Ham, S.W. Determination of N2O emissions levels in the selective reduction of NOx by NH3 over an on-site-used commercial V2O5-WO3/TiO2 catalyst using a modified gas cell. Top. Catal. 2010, 53, 597–607. [Google Scholar] [CrossRef]
- Kompio, P.G.W.A.; Bruckner, A.; Hipler, F.; Auer, G.; Loffler, E.; Grunert, W. A new view on the relations between tungsten and vanadium in V2O5-WO3/TiO2 catalysts for the selective reduction of NO with NH3. J. Catal. 2012, 286, 237–247. [Google Scholar] [CrossRef]
- Lietti, L.; Nova, I.; Ramis, G.; Dall’Acqua, L.; Busca, G.; Giamello, E.; Forzatti, P.; Bregani, F. Characterization and reactivity of V2O5–MoO3/TiO2 de-NOx SCR catalysts. J. Catal. 1999, 187, 419–435. [Google Scholar] [CrossRef]
- Nova, I.; Ciardelli, C.; Tronconi, E.; Chatterjee, D.; Weibel, M. Unifying redox kinetics for standard and fast NH3-SCR over a V2O5-WO3/TiO2 catalyst. AIChE J. 2009, 55, 1514–1529. [Google Scholar] [CrossRef]
- Nova, I.; Ciardelli, C.; Tronconi, E.; Chatterjee, D.; Bandl-Konrad, B. NH3-NO/NO2 chemistry over V-based catalysts and its role in the mechanism of the fast SCR reaction. Catal. Today 2006, 114, 3–12. [Google Scholar] [CrossRef]
- Xiong, S.; Xiao, X.; Liao, Y.; Dang, H.; Shan, W.; Yang, S. Global kinetic study of NO reduction by NH3 over V2O5–WO3/TiO2: Relationship between the SCR performance and the key factors. Ind. Eng. Chem. Res. 2015, 54, 11011–11023. [Google Scholar] [CrossRef]
- Koebel, M.; Madia, G.; Elsener, M. Selective catalytic reduction of NO and NO2 at low temperatures. Catal. Today 2002, 73, 239–247. [Google Scholar] [CrossRef]
- Madia, G.; Koebel, M.; Elsener, M.; Wokaun, A. Side reactions in the selective catalytic reduction of NOx with various NO2 fractions. Ind. Eng. Chem. Res. 2002, 41, 4008–4015. [Google Scholar] [CrossRef]
- Djerad, S.; Crocoll, M.; Kureti, S.; Tifouti, L.; Weisweiler, W. Effect of oxygen concentration on the NOx reduction with ammonia over V2O5–WO3/TiO2 catalyst. Catal. Today 2006, 113, 208–214. [Google Scholar] [CrossRef]
- Kim, M.H.; Lee, H.S. Effect of Fe-zeolite on formation of N2O in selective reduction of NO by NH3 over V2O5-WO3/TiO2 catalyst. Res. Chem. Intermed. 2016, 42, 171–184. [Google Scholar] [CrossRef]
- Kim, M.H.; Park, S.W. Selective reduction of NO by NH3 over Fe-zeolite-promoted V2O5-WO3/TiO2-based catalysts: Great suppression of N2O formation and origin of NO removal activity loss. Catal. Commun. 2016, 86, 82–85. [Google Scholar] [CrossRef]
- Krocher, O.; Elsener, M. Combination of V2O5/WO3-TiO2, Fe-ZSM5, and Cu-ZSM5 catalysts for the selective catalytic reduction of nitric oxide with ammonia. Ind. Eng. Chem. Res. 2008, 47, 8588–8593. [Google Scholar] [CrossRef]
- Yang, S.; Wang, C.; Ma, L.; Peng, Y.; Qu, Z.; Yan, N.; Chen, J.; Chang, H.; Li, J. Substitution of WO3 in V2O5/WO3-TiO2 by Fe2O3 for selective catalytic reduction of NO with NH3. Catal. Sci. Technol. 2013, 3, 161–168. [Google Scholar] [CrossRef]
- Gao, R.; Zhang, D.; Liu, X.; Shi, L.; Maitarad, P.; Li, H.; Zhang, J.; Cao, W. Enhanced catalytic performance of V2O5-WO3/Fe2O3/TiO2 microspheres for selective catalytic reduction of NO by NH3. Catal. Sci. Technol. 2013, 3, 191–199. [Google Scholar] [CrossRef]
- Devadas, M.; Krocher, O.; Elsener, M.; Wokaun, A.; Mitrikas, G.; Soger, N.; Pfeifer, M.; Demel, Y.; Mussmann, L. Characterization and catalytic investigation of Fe-ZSM5 for urea-SCR. Catal. Today 2007, 119, 137–144. [Google Scholar] [CrossRef]
- Qi, G.; Yang, R.T. Ultra-active Fe/ZSM-5 catalyst for selective catalytic reduction of nitric oxide with ammonia. Appl. Catal. B 2005, 60, 13–22. [Google Scholar] [CrossRef]
- Rivallan, M.; Ricchiardi, G.; Bordiga, S.; Zecchina, A. Adsorption and reactivity of nitrogen oxides (NO2, NO, N2O) on Fe-zeolites. J. Catal. 2009, 264, 104–116. [Google Scholar] [CrossRef]
- Coq, B.; Mauvezin, M.; Delahay, G.; Butet, J.B.; Kieger, S. The simultaneous catalytic reduction of NO and N2O by NH3 using an Fe-zeolite-beta catalyst. Appl. Catal. B 2000, 27, 193–198. [Google Scholar] [CrossRef]
- Mou, X.; Zhang, B.; Li, Y.; Yao, L.; Wei, X.; Su, D.S.; Shen, W. Rod-shaped Fe2O3 as an efficient catalyst for the selective reduction of nitrogen oxide by ammonia. Angew. Chem. Int. Ed. 2012, 51, 2989–2993. [Google Scholar] [CrossRef] [PubMed]
- Qu, Z.; Miao, L.; Wang, H.; Fu, Q. Highly dispersed Fe2O3 on carbon nanotubes for low-temperature selective catalytic reduction of NO with NH3. Chem. Commun. 2015, 51, 956–958. [Google Scholar] [CrossRef] [PubMed]
- Liu, F.; Asakura, K.; He, H.; Shan, W.; Shi, X.; Zhang, C. Influence of sulfation on iron titanate catalyst for the selective catalytic reduction of NOx with NH3. Appl. Catal. B 2011, 103, 369–377. [Google Scholar] [CrossRef]
- Kim, M.H.; An, T.H. A commercial V2O5-WO3/TiO2 catalyst used at an NH3-SCR deNOx process in an oil-fired power plant: Cause of an increase in deNOxing and NH3 oxidation performances at low temperatures. Res. Chem. Intermed. 2011, 37, 1333–1344. [Google Scholar] [CrossRef]
- Chen, Y.; Yang, G.; Zhang, Z.; Yang, X.; Hou, W.; Zhu, J.J. Polyaniline-intercalated layered vanadium oxide nanocomposites—One-pot hydrothermal synthesis and application in lithium battery. Nanoscale 2010, 2, 2131–2138. [Google Scholar] [CrossRef] [PubMed]
- Xu, J.; Yang, H.; Fu, W.; Du, K.; Sui, Y.; Chen, J.; Zeng, Y.; Li, M.; Zou, G. Preparation and magnetic properties of magnetite nanoparticles by sol–gel method. J. Magn. Magn. Mater. 2007, 309, 307–311. [Google Scholar] [CrossRef]
- De Faria, D.L.A.; Silva, S.V.; de Oliveira, M.T. Raman microspectroscopy of some iron oxides and oxyhydroxides. J. Raman Spectrosc. 1997, 28, 873–878. [Google Scholar] [CrossRef]
- Thommes, M.; Smarsly, B.; Groenewolt, M.; Ravikovitch, P.I.; Neimark, A.V. Adsorption hysteresis of nitrogen and argon in pore networks and characterization of novel micro- and mesoporous silicas. Langmuir 2006, 22, 756–764. [Google Scholar] [CrossRef] [PubMed]
- Xia, B.; Li, W.; Zhang, B.; Xie, Y. Low temperature vapor-phase preparation of TiO2 nanopowder. J. Mater. Sci. 1999, 34, 3505–3511. [Google Scholar] [CrossRef]
- Alemany, L.J.; Berti, F.; Busca, G.; Ramis, G.; Robba, D.; Toledo, G.P.; Trombetta, M. Characterization and composition of commercial V2O5-WO5-TiO2 SCR catalysts. Appl. Catal. B 1996, 10, 299–311. [Google Scholar] [CrossRef]
- Gutierrez, M.J.F.; Baxter, D.; Hunter, C.; Svoboda, K. Nitrous Oxide (N2O) emissions from waste and biomass to energy plants. Waste Manag. Res. 2005, 23, 133–147. [Google Scholar] [CrossRef] [PubMed]
- Kompio, P.G.W.A.; Bruckner, A.; Hipler, F.; Manoylova, O.; Auer, G.; Mestl, G.; Grunert, W. V2O5-WO3/TiO2 catalysts under thermal stress: Responses of structure and catalytic behavior in the selective catalytic reduction of NO by NH3. Appl. Catal. B 2017, 217, 365–377. [Google Scholar] [CrossRef]
- Wang, C.; Yang, S.; Chang, H.; Peng, Y.; Li, J. Dispersion of tungsten oxide on SCR performance of V2O5-WO3/TiO2: Acidity, surface species and catalytic activity. Chem. Eng. J. 2013, 225, 520–527. [Google Scholar] [CrossRef]
- Lietti, L.; Nova, I.; Forzatti, P. Selective catalytic reduction (SCR) of NO by NH3 over TiO2-supported V2O5-WO3 and V2O5-MoO3 catalysts. Top. Catal. 2000, 11, 111–122. [Google Scholar] [CrossRef]
- Busca, G.; Lietti, L.; Ramis, G.; Berti, F. Chemical and mechanistic aspects of the selective catalytic reduction of NOx by ammonia over oxide catalysts: A review. Appl. Catal. B 1998, 18, 1–36. [Google Scholar] [CrossRef]
- Long, R.Q.; Yang, R.T. Selective catalytic oxidation of ammonia to nitrogen over Fe2O3-TiO2 prepared with a sol–gel method. J. Catal. 2002, 207, 158–165. [Google Scholar] [CrossRef]
- Zhang, X.; Shen, Q.; He, C.; Ma, C.; Cheng, J.; Hao, Z. N2O catalytic reduction by NH3 over Fe-zeolites: Effective removal and active site. Catal. Commun. 2012, 18, 151–155. [Google Scholar] [CrossRef]
- Went, G.T.; Leu, L.J.; Rosin, R.R.; Bell, A.T. The effects of structure on the catalytic activity and selectivity of V2O5/TiO2 for the reduction of NO by NH3. J. Catal. 1992, 134, 492–505. [Google Scholar] [CrossRef]
- Usberti, N.; Jablonska, M.; Blasi, M.D.; Forzatti, P.; Lietti, L.; Beretta, A. Design of a “high-efficiency” NH3-SCR reactor for stationary applications. A kinetic study of NH3 oxidation and NH3-SCR over V-based catalysts. Appl. Catal. B 2015, 179, 185–195. [Google Scholar] [CrossRef]
- Giraud, F.; Geantet, C.; Guilhaume, N.; Loridant, S.; Gros, S.; Porcheron, L.; Kanniche, M.; Bianchi, D. Experimental microkinetic approach of de-NOx by NH3 on V2O5/WO3/TiO2 catalysts. 3. Impact of superficial WOz and VxOy/WOz groups on the heats of adsorption of adsorbed NH3 species. J. Phys. Chem. C 2015, 119, 15401–15413. [Google Scholar] [CrossRef]
- Kantcheva, M.M.; Hadjiivanov, K.I.; Klissurski, D.G. An IR spectroscopy study of the state and localization of vanadium-oxo species adsorbed on TiO2 (anatase). J. Catal. 1992, 134, 299–310. [Google Scholar] [CrossRef]
- Topsoe, N.Y. Characterization of the nature of surface sites on vanadia-titania catalysts by FTIR. J. Catal. 1991, 128, 499–511. [Google Scholar] [CrossRef]
- Lorenzelli, V.; Busca, G. Infrared studies of the surface of α-Fe2O3. Mater. Chem. Phys. 1985, 13, 261–281. [Google Scholar] [CrossRef]
- Ramis, G.; Yi, L.; Busca, G.; Turco, M.; Kotur, E.; Willey, R.J. Adsorption, activation, and oxidation of ammonia over SCR catalysts. J. Catal. 1995, 157, 523–535. [Google Scholar] [CrossRef]
- Jung, S.M.; Grange, P. DRIFTS investigation of V=O behavior and its relations with the reactivity of ammonia oxidation and selective catalytic reduction of NO over V2O5 catalyst. Appl. Catal. B 2002, 36, 325–332. [Google Scholar] [CrossRef]
- Went, G.T.; Oyama, S.T.; Bell, A.T. Laser Raman spectroscopy of supported vanadium oxide catalysts. J. Phys. Chem. 1990, 94, 4240–4246. [Google Scholar] [CrossRef]
- Boulova, M.; Lucazeau, G. Crystallite nanosize effect on the structural transitions of WO3 studied by Raman spectroscopy. J. Solid State Chem. 2002, 167, 425–434. [Google Scholar] [CrossRef]
- Ohsaka, T.; Izumi, F.; Fujiki, Y. Raman spectrum of anatase, TiO2. J. Raman Spectrosc. 1978, 7, 321–324. [Google Scholar] [CrossRef]
- Frank, O.; Zukalova, M.; Laskova, B.; Kurti, J.; Koltai, J.; Kavan, L. Raman spectra of titanium dioxide (anatase, rutile) with identified oxygen isotopes (16, 17, 18). Phys. Chem. Chem. Phys. 2012, 14, 14567–14572. [Google Scholar] [CrossRef] [PubMed]
- Kim, D.S.; Ostromecki, M.; Wachs, I.E. Surface structures of supported tungsten oxide catalysts under dehydrated conditions. J. Mol. Catal. A 1996, 106, 93–102. [Google Scholar] [CrossRef]
- Engweiler, J.; Harf, J.; Baiker, A. WOx/TiO2 catalysts prepared by grafting of tungsten alkoxides: Morphological properties and catalytic behavior in the selective reduction of NO by NH3. J. Catal. 1996, 159, 259–269. [Google Scholar] [CrossRef]
- Vuurman, M.A.; Wachs, I.E.; Hirt, A.M. Structural determination of supported V2O5-WO3/TiO2 catalysts by in situ Raman spectroscopy and X-ray photoelectron spectroscopy. J. Phys. Chem. 1991, 95, 9928–9937. [Google Scholar] [CrossRef]
- Reiche, M.A.; Burgi, T.; Baiker, A.; Scholz, A.; Schnyder, B.; Wokaun, A. Vanadia and tungsta grafted on TiO2: Influence of the grafting sequence on structural and chemical properties. Appl. Catal. A 2000, 198, 155–169. [Google Scholar] [CrossRef]
- Wachs, I.E.; Roberts, C.A. Monitoring surface metal oxide catalytic active sites with Raman spectroscopy. Chem. Soc. Rev. 2010, 39, 5002–5017. [Google Scholar] [CrossRef] [PubMed]
- Amiridis, M.D.; Duevel, R.V.; Wachs, I.E. The effect of metal oxide additives on the activity of V2O5/TiO2 catalysts for the selective catalytic reduction of nitric oxide by ammonia. Appl. Catal. B 1999, 20, 111–122. [Google Scholar] [CrossRef]
- Colomban, P.; Cherifi, S.; Despert, G. Raman identification of corrosion products on automotive galvanized steel sheets. J. Raman Spectrosc. 2008, 39, 881–886. [Google Scholar] [CrossRef]
- Bourikas, K.; Fountzoula, C.; Kordulis, C. Monolayer transition metal supported on titania catalysts for the selective catalytic reduction of NO by NH3. App. Catal. B 2004, 52, 145–153. [Google Scholar] [CrossRef]
- Dunn, J.P.; Stenger, H.G., Jr.; Wachs, I.E. Oxidation of SO2 over supported metal oxide catalysts. J. Catal. 1999, 181, 233–243. [Google Scholar] [CrossRef]
- Amiridis, M.; Wachs, I.E.; Deo, G.; Jehng, J.M.; Kim, D.S. Reactivity of V2O5 catalysts for the selective catalytic reduction of NO by NH3: Influence of vanadia loading, H2O, and SO2. J. Catal. 1996, 161, 247–253. [Google Scholar] [CrossRef]
- Wachs, I.E. Raman and IR studies of surface metal oxide species on oxide supports: Supported metal oxide catalysts. Catal. Today 1996, 27, 437–455. [Google Scholar] [CrossRef]
- Bond, G.C.; Bruckman, K. Selective oxidation of o-xylene by monolayer V2O5-TiO2 catalysts. Faraday Discuss. Chem. Soc. 1981, 72, 235–246. [Google Scholar] [CrossRef]
- Vermaire, D.C.; van Berge, P.C. The preparation of WO3/TiO2 and WO3/A12O3 and characterization by temperature-programmed reduction. J. Catal. 1989, 116, 309–317. [Google Scholar] [CrossRef]
- Yu, X.F.; Wu, N.Z.; Huang, H.Z.; Xie, Y.C.; Tang, Y.Q. A study on the monolayer dispersion of tungsten oxide on anatase. J. Mater. Chem. 2001, 11, 3337–3342. [Google Scholar] [CrossRef]
- Liu, F.; He, H.; Lian, Z.; Shan, W.; Xie, L.; Asakura, K.; Yang, W.; Deng, H. Highly dispersed iron vanadate catalyst supported on TiO2 for the selective catalytic reduction of NOx with NH3. J. Catal. 2013, 307, 340–351. [Google Scholar] [CrossRef]
- Kim, D.W.; Kim, M.H.; Ham, S.W. An on-line infrared spectroscopic system with a modified multipath White cell for direct measurements of N2O from NH3-SCR reaction. Korean J. Chem. Eng. 2010, 27, 1730–1737. [Google Scholar] [CrossRef]
- Kim, M.H.; Cho, I.H.; Park, J.H.; Choi, S.O.; Lee, I.S. Adsorption of CO2 and CO on H-zeolites with different framework topologies and chemical compositions and a correlation to probing protonic sites using NH3 adsorption. J. Porous Mater. 2016, 23, 291–299. [Google Scholar] [CrossRef]
- Kim, M.H.; Cho, I.H.; Choi, S.O.; Lee, I.S. Surface energetic heterogeneity of nanoporous solids for CO2 and CO adsorption: The key to an adsorption capacity and selectivity at low pressures. J. Nanosci. Nanotechnol. 2016, 16, 4474–4479. [Google Scholar] [CrossRef] [PubMed]
Figure 1.
XRD patterns for: (a) VWT; (b) 2.73% Fe2O3/VWT; (c) c-VWT; (d) 2.73% Fe2O3/c-VWT; (e) pure anatase TiO2; and (f) α-phase orthorhombic V2O5.
Figure 1.
XRD patterns for: (a) VWT; (b) 2.73% Fe2O3/VWT; (c) c-VWT; (d) 2.73% Fe2O3/c-VWT; (e) pure anatase TiO2; and (f) α-phase orthorhombic V2O5.

Figure 2.
N2 sorption isotherms on: (a) WT; (b) VWT; (c) 2.73% Fe2O3/VWT; (d) c-VWT; and (e) 2.73% Fe2O3/c-VWT.
Figure 2.
N2 sorption isotherms on: (a) WT; (b) VWT; (c) 2.73% Fe2O3/VWT; (d) c-VWT; and (e) 2.73% Fe2O3/c-VWT.

Figure 3.
Conversions of (a) NO and (b) NH3 in the reduction of NO by NH3 over unpromoted and Fe2O3-promoted V2O5/TiO2-based catalysts.
Figure 3.
Conversions of (a) NO and (b) NH3 in the reduction of NO by NH3 over unpromoted and Fe2O3-promoted V2O5/TiO2-based catalysts.
Figure 4.
Formation of N2O in the reduction of NO by NH3 over unpromoted and Fe2O3-promoted V2O5/TiO2-based catalysts.
Figure 4.
Formation of N2O in the reduction of NO by NH3 over unpromoted and Fe2O3-promoted V2O5/TiO2-based catalysts.
Figure 5.
Mass spectra for NH3 desorbed and H2O produced during NH3 TPD runs with unpromoted and Fe2O3-promoted catalysts: (a) NH3 and (b) H2O. In (a) and (b), S1: VWT; S2: 2.73% Fe2O3/VWT; S3: c-VWT; S4: 2.73% Fe2O3/c-VWT.
Figure 5.
Mass spectra for NH3 desorbed and H2O produced during NH3 TPD runs with unpromoted and Fe2O3-promoted catalysts: (a) NH3 and (b) H2O. In (a) and (b), S1: VWT; S2: 2.73% Fe2O3/VWT; S3: c-VWT; S4: 2.73% Fe2O3/c-VWT.
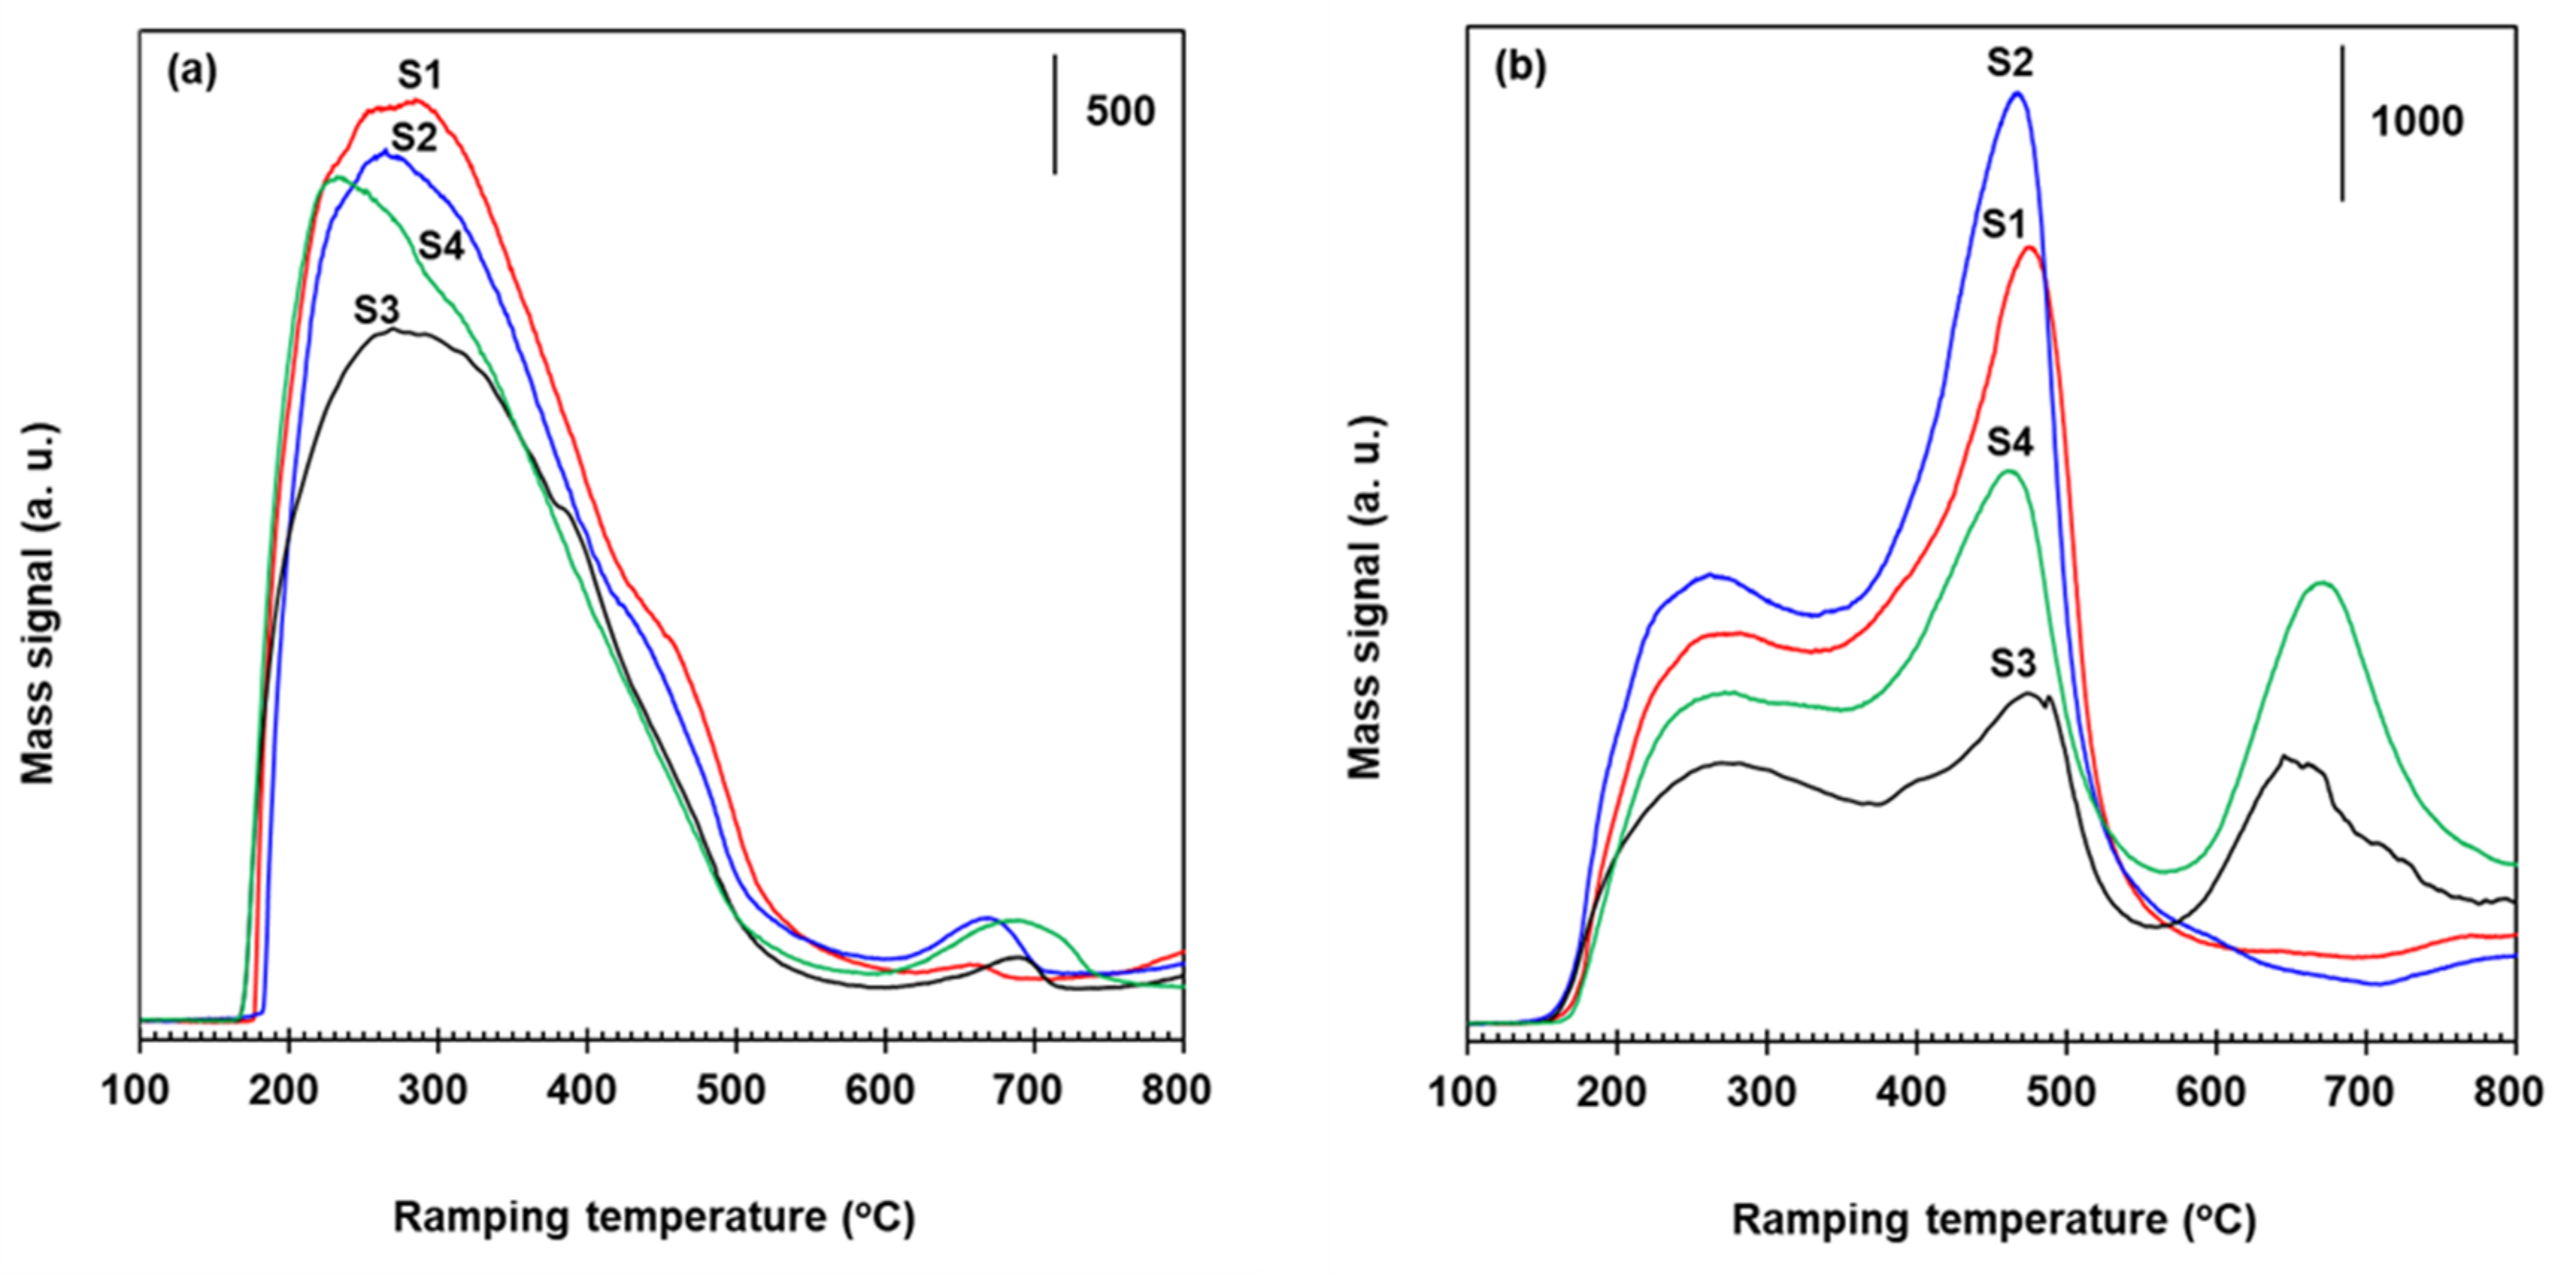
Figure 6.
Mass spectra for the production of (a) NO, (b) N2O, and (c) N2 in NH3 TPD runs with unpromoted and promoted VWT-based catalysts. In (a–c), S1: VWT; S2: 2.73% Fe2O3/VWT; S3: c-VWT; S4: 2.73% Fe2O3/c-VWT.
Figure 6.
Mass spectra for the production of (a) NO, (b) N2O, and (c) N2 in NH3 TPD runs with unpromoted and promoted VWT-based catalysts. In (a–c), S1: VWT; S2: 2.73% Fe2O3/VWT; S3: c-VWT; S4: 2.73% Fe2O3/c-VWT.
Figure 7.
Raman spectra for reference chemicals and a supported WO3-only sample: (a) V2O5; (b) WO3; (c) TiO2; (d) 10% WO3/TiO2 (WT).
Figure 7.
Raman spectra for reference chemicals and a supported WO3-only sample: (a) V2O5; (b) WO3; (c) TiO2; (d) 10% WO3/TiO2 (WT).

Figure 8.
Raman spectra for unpromoted and promoted V2O5/TiO2-based catalysts: (a) VWT; (b) 2.73% Fe2O3/VWT; (c) c-VWT; (d) 2.73% Fe2O3/c-VWT.
Figure 8.
Raman spectra for unpromoted and promoted V2O5/TiO2-based catalysts: (a) VWT; (b) 2.73% Fe2O3/VWT; (c) c-VWT; (d) 2.73% Fe2O3/c-VWT.

Table 1.
Chemical compositions and textural properties of V2O5/TiO2-based catalysts.
| Catalyst | Amount (%) | SBET (m2/g) | dm (Å) a | Vt (cm3/g) b | |
|---|---|---|---|---|---|
| V2O5 | WO3 | ||||
| WT | - | 10 | 91 | 127 | 0.30 |
| VWT | 1.6 | 10 | 67 | 142 | 0.26 |
| 2.73% Fe2O3/VWT | 1.6 | 10 | 60 | 139 | 0.23 |
| c-VWT | 1.44 | 9.42 | 70 | 144 | 0.27 |
| 2.73% Fe2O3/c-VWT | 1.44 | 9.42 | 89 | 126 | 0.31 |
Note. “-”: not applicable or measured; SBET: specific BET surface area; dm: mesopore size; Vt: total pore volume. a Using the Barrett-Joyner-Halenda (BJH) mesopore model. b Calculated using N2 sorption amounts at P/Po ≈ 0.994.
Table 2.
Surface density and surface coverages of the active ingredients in V2O5/TiO2-based catalysts.
Table 2.
Surface density and surface coverages of the active ingredients in V2O5/TiO2-based catalysts.
| Catalyst | Surface Density (μmol/m2) | Surface Coverage | |||||||
|---|---|---|---|---|---|---|---|---|---|
| VOx | WOx | FeOx | MeOx a | VOx b | WOx c | FeOx d | MeOx e | ||
| WT | - | 4.74 | - | 4.74 | - | 0.86 ± 0.17 | - | 0.86 ± 0.17 | |
| VWT | 2.63 | 6.44 | - | 9.07 | 0.22 ± 0.02 | 1.16 ± 0.24 | - | 1.38 ± 0.26 | |
| 2.73% Fe2O3/VWT | 2.93 | 7.19 | 5.69 | 15.81 | 0.24 ± 0.03 | 1.30 ± 0.26 | 0.87 | 1.54 ± 0.29 | |
| c-VWT | 2.26 | 5.80 | - | 8.06 | 0.19 ± 0.02 | 1.05 ± 0.21 | - | 1.24 ± 0.23 | |
| 2.73% Fe2O3/c-VWT | 1.78 | 4.57 | 3.84 | 10.19 | 0.15 ± 0.01 | 0.82 ± 0.17 | 0.59 | 0.97 ± 0.18 | |
Note. “-”: not applicable or measured. a Sum of the surface density values for VOx, WOx, and FeOx. b Based on monolayer coverage of 10.9–13.1 μmol VOx/m2 [60,61,62,63,64]. c Based on monolayer coverage of 4.6–7.0 μmol WOx/m2 [60,61,63,65,66]. d Based on monolayer coverage of ca. 6.5 μmol FeOx/m2 [61,63]. e Sum of the surface coverages of VOx, WOx, and FeOx.
© 2018 by the authors. Licensee MDPI, Basel, Switzerland. This article is an open access article distributed under the terms and conditions of the Creative Commons Attribution (CC BY) license (http://creativecommons.org/licenses/by/4.0/).
Share and Cite
MDPI and ACS Style
Kim, M.H.; Yang, K.H. The Role of Fe2O3 Species in Depressing the Formation of N2O in the Selective Reduction of NO by NH3 over V2O5/TiO2-Based Catalysts. Catalysts 2018, 8, 134. https://doi.org/10.3390/catal8040134
AMA Style
Kim MH, Yang KH. The Role of Fe2O3 Species in Depressing the Formation of N2O in the Selective Reduction of NO by NH3 over V2O5/TiO2-Based Catalysts. Catalysts. 2018; 8(4):134. https://doi.org/10.3390/catal8040134
Chicago/Turabian StyleKim, Moon Hyeon, and Ki Hyuck Yang. 2018. "The Role of Fe2O3 Species in Depressing the Formation of N2O in the Selective Reduction of NO by NH3 over V2O5/TiO2-Based Catalysts" Catalysts 8, no. 4: 134. https://doi.org/10.3390/catal8040134
Note that from the first issue of 2016, this journal uses article numbers instead of page numbers. See further details here.