1. Introduction
Cellulose is a water-insoluble polymer composed of glucose units linked by β-1,4-glycosidic bonds and with a robust structure as a consequence of the abundant inter- and intra-molecular hydrogen bonds. Such structural stability makes its degradation difficult, and both catalysts and relatively harsh conditions are required. Because of this, the development of efficient methods for the selective depolymerization of cellulose into C6 sugars is a key issue.
Great effort has been devoted to the degradation of cellulose with enzymes [
1,
2] and mineral acids [
1,
3], but these methods have drawbacks such as high price, corrosion, need of neutralization, difficulties of separation and reuse, etc. Besides, if the target products are the sugar alcohols, the mentioned degradation must be followed by a reducing catalytic treatment to transform ether (or aldehyde) groups to alcohol functionalities. In particular, sorbitol is a very interesting product, classified as one of the top ten versatile bio-based platform molecules. It has significant applications in several industries like those of foods, pharmaceuticals, and cosmetics; it is also used in the synthesis of L-ascorbic acid (vitamin C) and can be transformed into a series of chemicals and polymer precursors such as isosorbide, glycols, etc. [
4].
This is the frame of the one-pot hydrolytic hydrogenation of cellulose (HHC) with heterogeneous catalysts, a two-step process in which cellulose is hydrolyzed in a first stage and the hydrolysis products are further hydrogenated. Each of these two steps requires different catalytic active species (acidic functions for hydrolysis and metal particles for hydrogenation), and because of this, a solid bifunctional catalyst able to hydrolyze the cellulose and to hydrogenate the hydrolysis products would be an ideal option. Solid catalysts are preferred because their use includes easy recovery, potential reusability, and applicability in various reaction conditions [
5,
6,
7,
8]. In particular, supported metal catalysts are interesting solid catalysts because they can easily contain more than one catalytic function, and their catalytic properties are tunable by varying the components and the preparation methods.
From the early work of Fukuoka and Dhepe [
5], several research groups have put attention to the preparation of supported metal catalysts for the synthesis of sugar alcohols from cellulose [
9,
10,
11,
12,
13]. A perusal of the literature shows that Ru is one of the most active metals for this application. For example, Deng et al. tested Fe, Co, Ni, Pd, Pt, Rh, Ru, Ir, Ag, and Au supported on carbon nanotubes for the conversion of cellulose, and Ru was found to be the most effective catalyst for the formation of sorbitol [
14]. The work of Han and Lee also compared the behavior of supported Ni, Pd, Pt, and Ru catalysts and found that Ru leads to the best results [
15]. On the other hand, among the several solids that can be used as a catalyst support, carbon materials have been shown to be particularly suitable because they can be prepared with large surface area and appropriated pore size, and their surface chemistry can be tuned [
16,
17,
18,
19]. These properties enable a good dispersion of the active species and a proper diffusion of reactants and products. Besides this, they are stable in many reaction media, show mechanical resistance and thermal stability, and expensive supported noble metals can be easily recovered by support combustion [
16,
17,
18,
19].
There are some examples of the use of carbon materials to prepare catalysts for the HHC reaction. For example, Ru/CNT (1 wt % Ru, supported on carbon nanotubes (CNT)) showed a good performance, attributed to its stronger H
2 adsorption ability [
14], and Ru nanoparticles (10 wt % Ru) supported on sulfonated activated carbon was also a good-performing catalyst thanks to the dual-functionalized character arising from acidic groups and metal active sites [
15]. Other interesting examples are Ru and Pt catalysts supported on activated carbon treated with sulfuric acid [
20], mono- and bimetallic catalysts supported on carbon nanotubes and activated carbon [
13,
21], and several noble metals supported on different carbon materials [
22].
Carbon black is an interesting carbon material that has been only scarcely used for this application [
22]. Carbon blacks are composed essentially of nearly spherical carbon particles of colloidal size, coalesced into particle aggregates [
23]. Their porosity can be basically defined by the voids, of different dimensions and shapes, between aggregates, but an activation treatment can create narrower pores [
23,
24,
25].
In this work, Ru catalysts for the HHC reaction have been prepared using a commercial carbon black which acts as a support for Ru nanoparticles, but also as solid acid. The selected carbon black is an activated material which has a porous structure composed of both meso- and micropores. In order to create acidic surface sites, it has been modified by sulfonation and oxidation treatments with H
2SO
4 and (NH
4)S
2O
8, respectively. Thus, this supported system for bifunctional catalysts with appropriate textural properties contains hydrolysis and hydrogenation active sites. The correlation between the catalysts’ properties and catalytic activity has been addressed after detailed catalyst characterization. This study can be of interest to those looking to extend the use of the prepared catalysts to the transformation of lignocellulosic biomass, as reported, for example, by Li et al. [
26].
2. Results
2.2. Surface Chemistry and Acidity
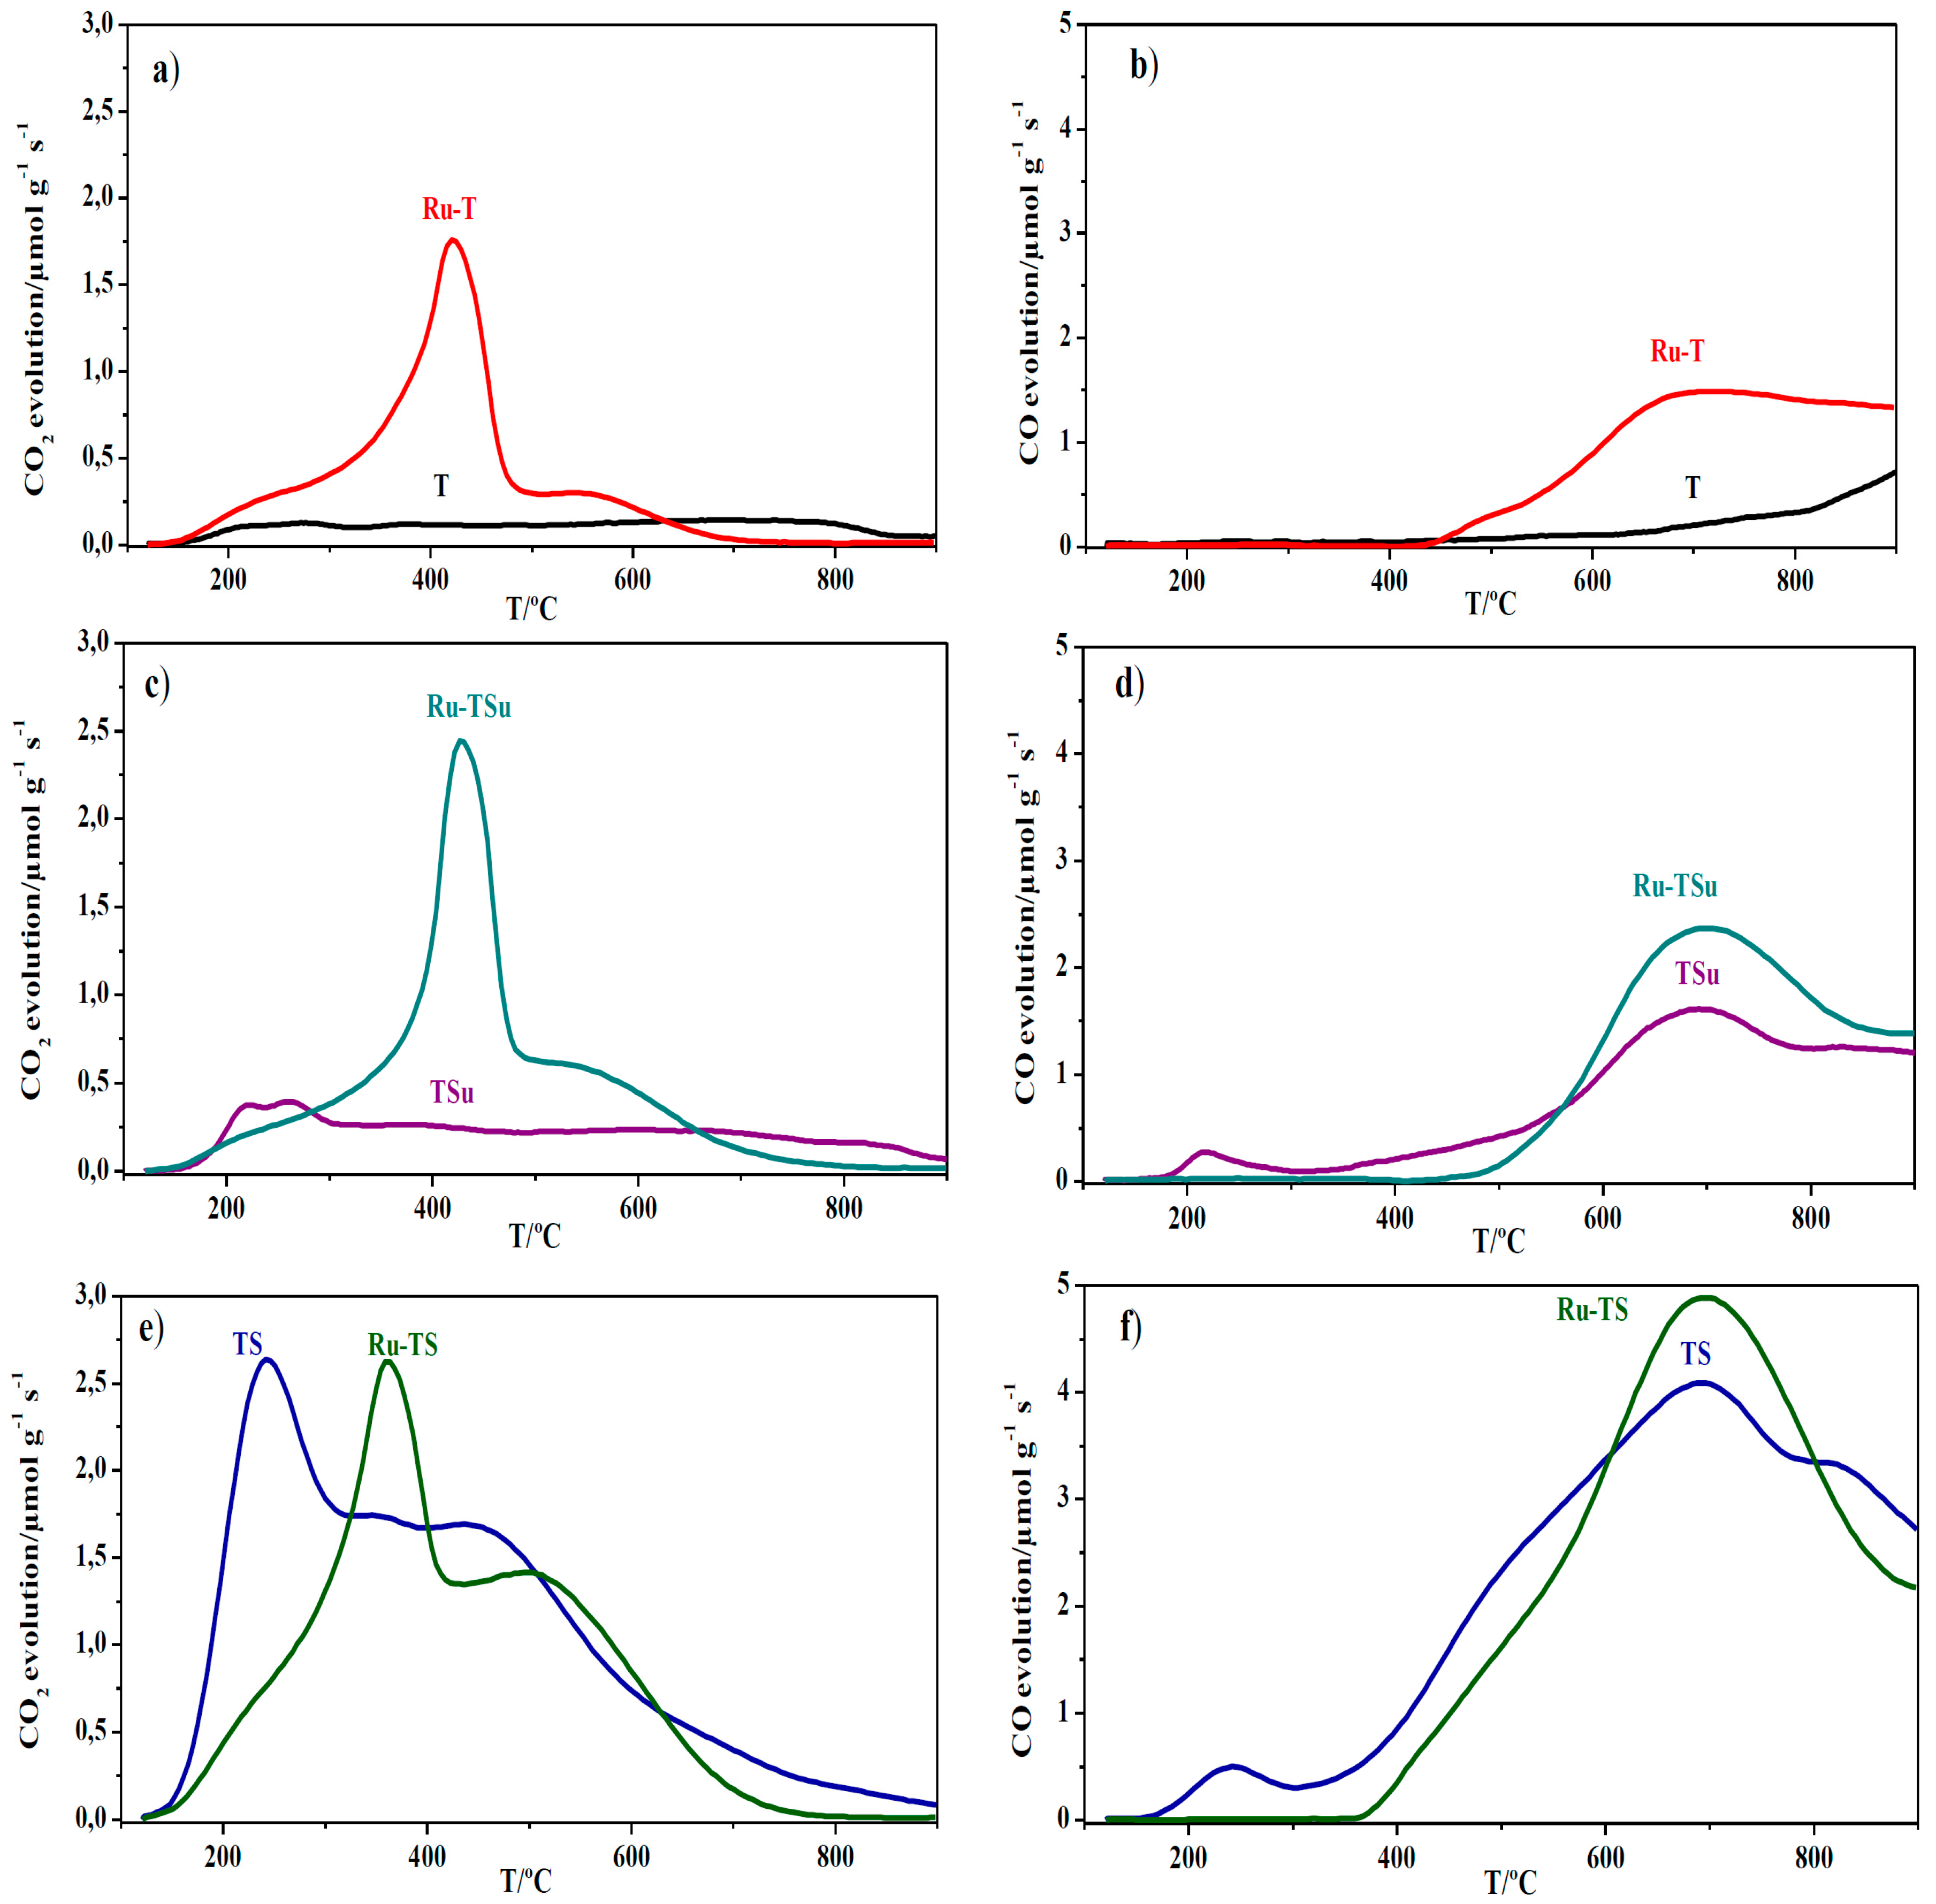
The quantification of the temperature programmed desorption (TPD) profiles of the carbon materials and the Ru catalysts, in terms of CO
2 and CO evolved (in µmol/g), is shown in
Table 2. The TPD profiles of samples T, TSu and TS are shown in
Figure S2 (Supplementary Information) and are also included in
Figure 1 (see the text later). The original carbon black T contains a moderate amount of oxygen functional groups (OFG) which are noticeably increased after treatment A (sample TSu) and particularly after treatment B (sample TS) (for description of treatments A and B, see the experimental part).
Figure 1 shows the TPD profiles of samples Ru-T, Ru-TSu and Ru-TS, including in each case the TPD profile of the corresponding carbon. The quantification of these TPD profiles, which show some remarkable features, is also included in
Table 2.
It seems that either the catalyst preparation steps (impregnation, drying, and reduction) lead to a significant transformation of the carbon surface chemistry or the presence of Ru strongly influences the decomposition of surface oxygen groups during the TPD measurements. On one hand, the increase in the amounts of CO
2 and CO evolved (in the case of samples Ru-T and Ru-TSu) compared with those of the TPD of the carbon materials reveals that particular surface oxygen groups have been formed or that the decomposition of stable groups is enhanced when Ru is present. On the other hand, the sharp CO
2 evolution peak located at about 450 °C (
Figure 1) is characteristic of a catalytic decomposition which supports the hypothesis that the presence of Ru is responsible of the changes in the TPD profiles. In the case of sample Ru-TS there is not a neat increase of the amount of OFG but the TPD profiles are significantly different from those of carbon TS, meaning that either the surface oxygen groups have been transformed, or part of the original groups have been removed and new ones have been created.
These results resemble those reported by Machado et al. [
27] for Ru supported on carbon nanotubes, and indicate that a surface reconstruction seems to take place involving the creation of new surface oxygen groups. Such a surface reconstruction reaction is proposed to lead to the formation of a Ru–acetate interface and epoxy OFG, and it could occur either at room temperature, during exposure of the reduced samples to air, or during the TPD experiment under He [
27]. The possibility of chemical transformations (mainly condensations) during TPD measurements has been also reported by Domingo-García et al. [
28]. In the present case, and as it will be explained later, the presence of oxidized Ru species formed by exposure to air and transformations of the OFG occurring during the TPD treatment are responsible for the observed features.
Acidity, determined by titration and expressed as mmol of acidic sites per gram of sample, is also included in
Table 2. In general, acidity increases as the amount of surface oxygen groups—in particular, those that decompose as CO
2—increases. The plot of the amount of acidic sites determined by titration versus the amount of surface oxygen groups that decompose as CO
2 (
Figure S3 in Supplementary Information) shows a quite linear relationship between both parameters, although the acidity of the Ru catalysts is above the straight line defined by the parameters of the carbon materials. This means on one side that the mentioned surface chemistry restructuration leads to a high acidity, and on the other side that the surface chemistry estimated by TPD can be affected by the reactions taking place during the programmed heating.
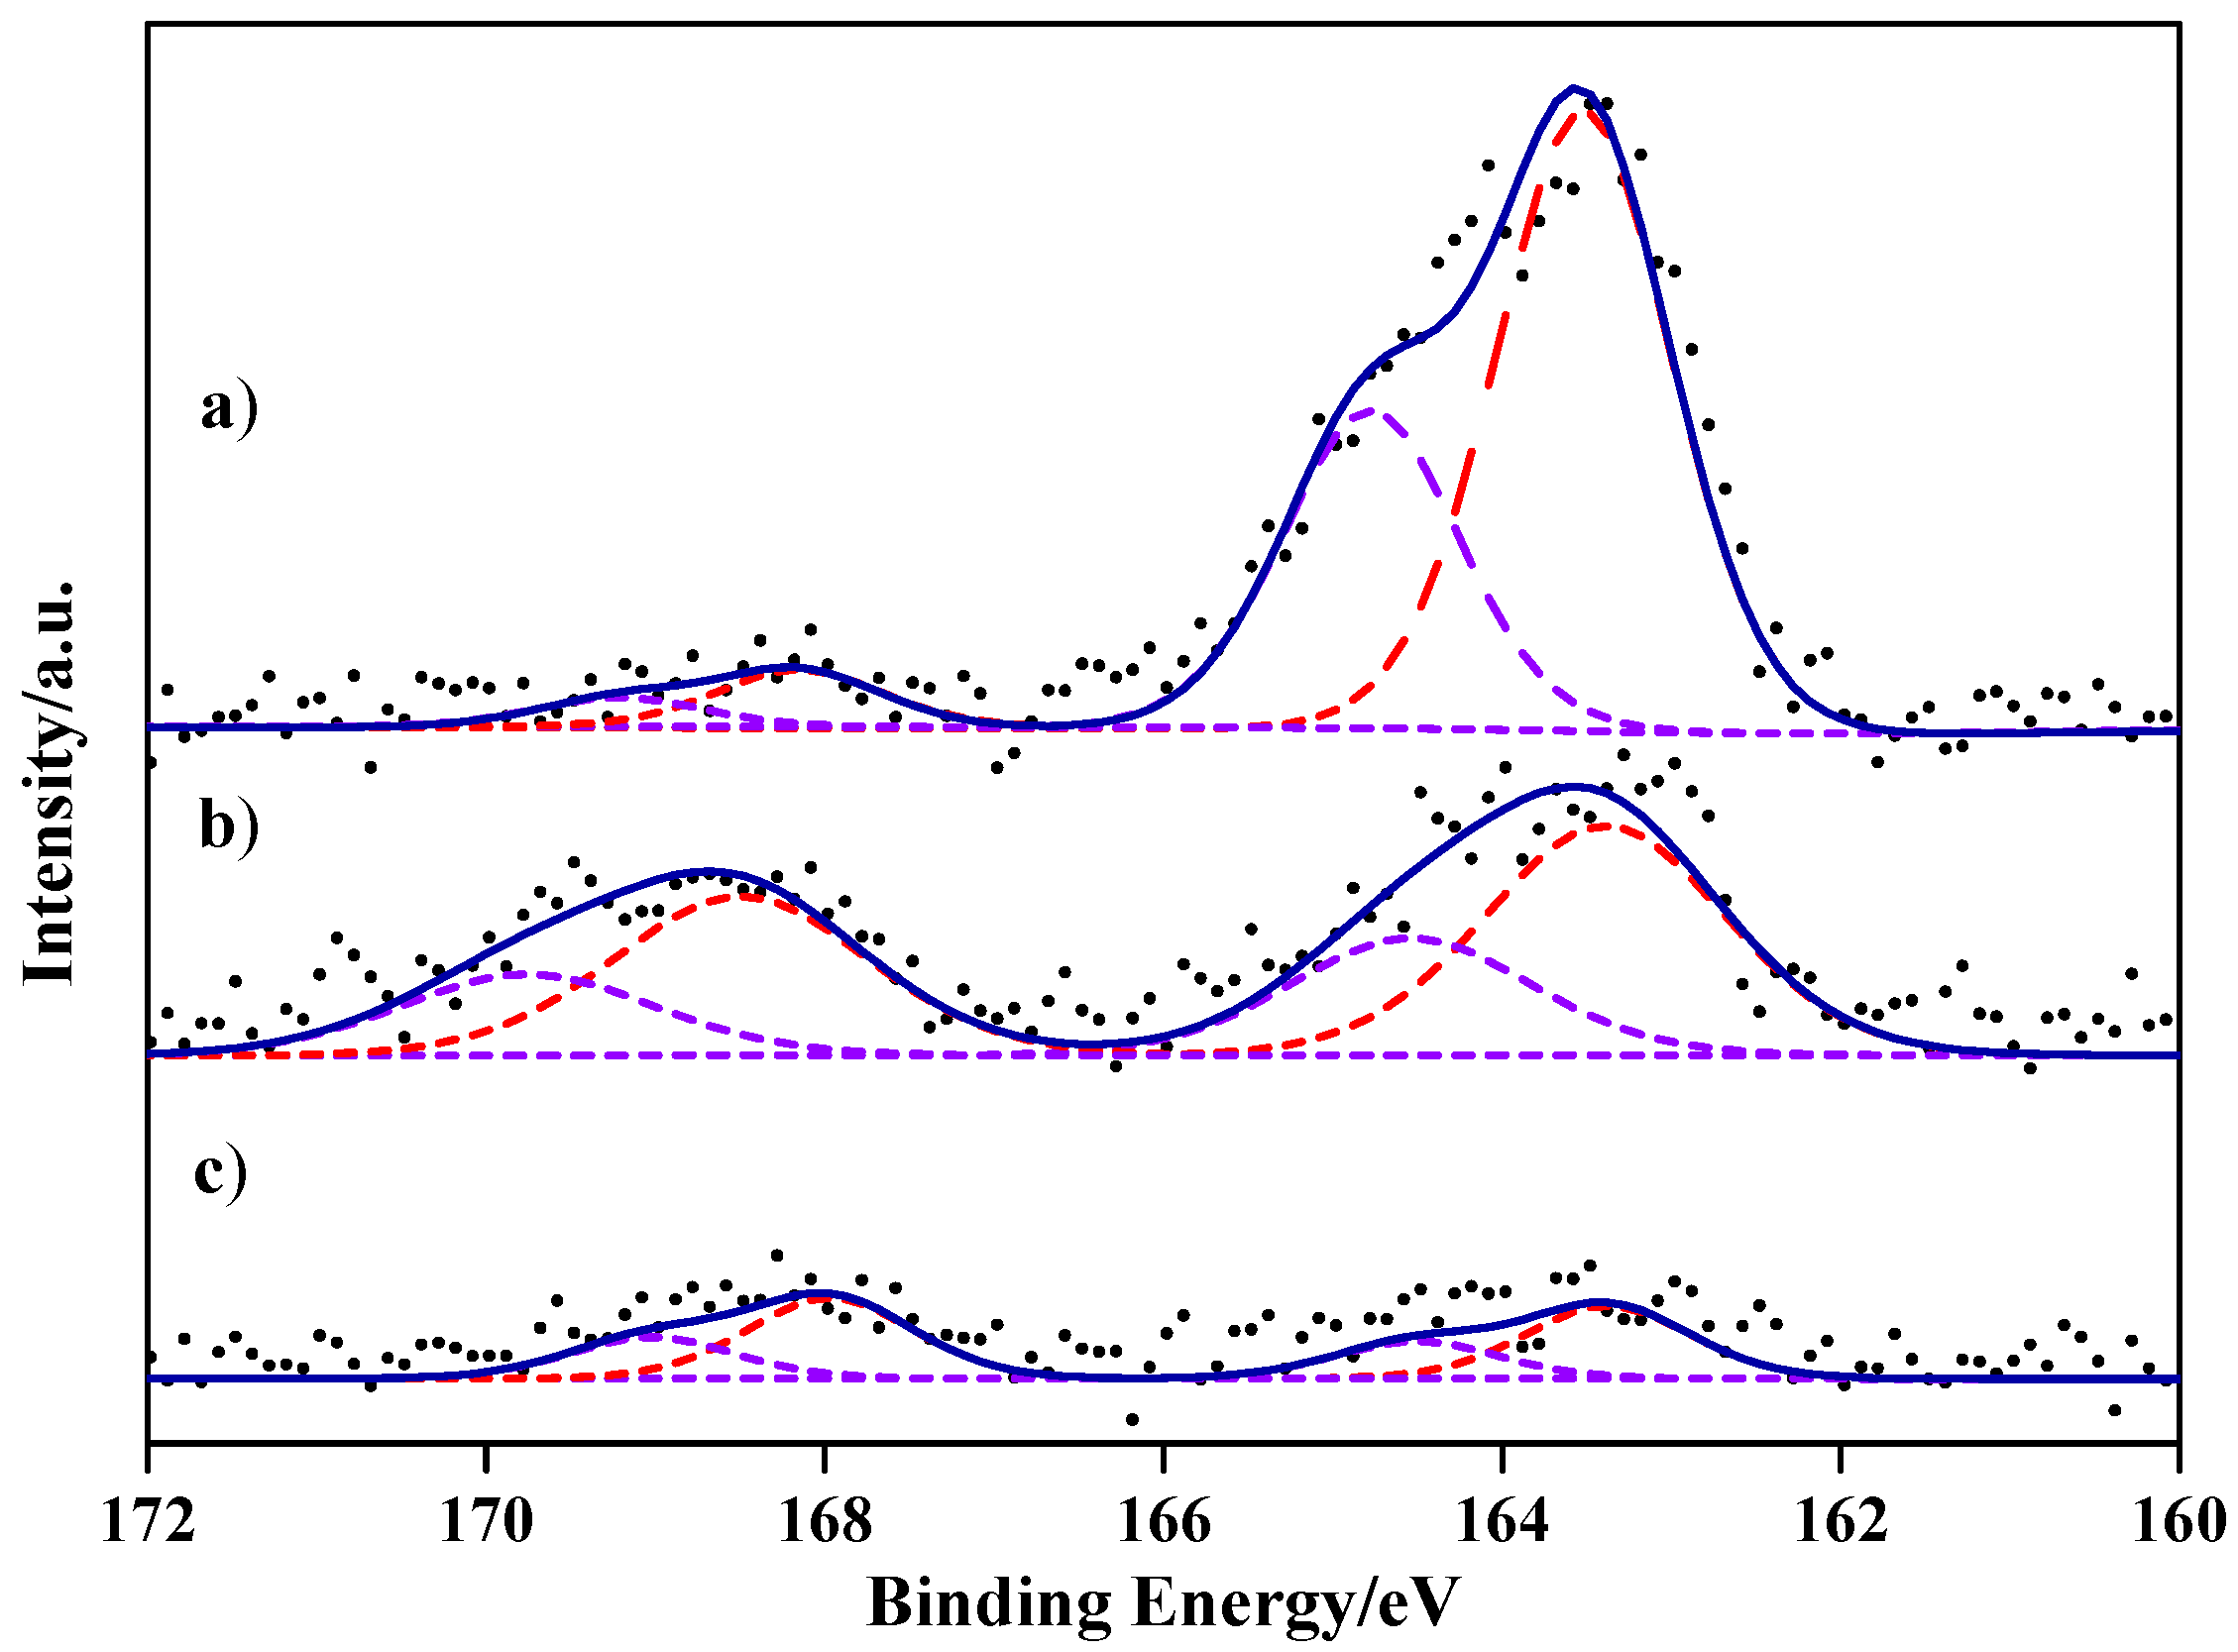
In order to study the potential presence of sulfur functional groups on the carbon materials, they were characterized by elemental analysis (EA) and X-ray photoelectron spectroscopy (XPS). EA data (
Table 3) show that the original carbon black T contains a certain amount of sulfur that noticeably increases upon treatment with sulfuric acid (sample TSu) and decreases after treatment with the (NH
4)S
2O
8 solution (sample TS).
Figure 2 shows the obtained S 2p XPS spectra which can be fitted to two separate peaks: one at about 168 eV that corresponds to S in −SO
3H groups [
15,
29] and another one at about 163 eV due to sulfur in C−S−C structures, as reported in [
29]. Binding energy values and the determined amount of S (in wt %) in each of the two mentioned states are presented in
Table 3. The obtained data show that in the original carbon black (sample T), sulfur appears mainly as C–S–C species; the treatment with sulfuric acid removes part of the C–S–C species and develops sulfonic groups [
30]; and the treatment with the ammonium peroxydisulfate solution is more effective in the removal of C–S–C and produces a slight increase in the amount of sulfonic groups. It can be mentioned that the carbon black T has been likely obtained from sulfur-containing feedstocks and that organic sulfur persists in the combustion synthesis process, appearing as stable polycyclic compounds [
31].
The sulphur species present in the Ru-containing samples are almost the same as those described for the carbon materials.
XPS also revealed the presence of residual chlorine species on the catalyst surface (
Figure S4 in Supplementary Information). They are mainly chloride and oxychloride species (B.E. ~198 eV) and also organic chlorine in C–Cl bonds (B.E. ~200 eV) [
32,
33,
34]. The amounts of residual chlorine determined by XPS were 0.8, 0.3, and 0.5 wt % in samples Ru-T, Ru-TSu, and Ru-TS, respectively.
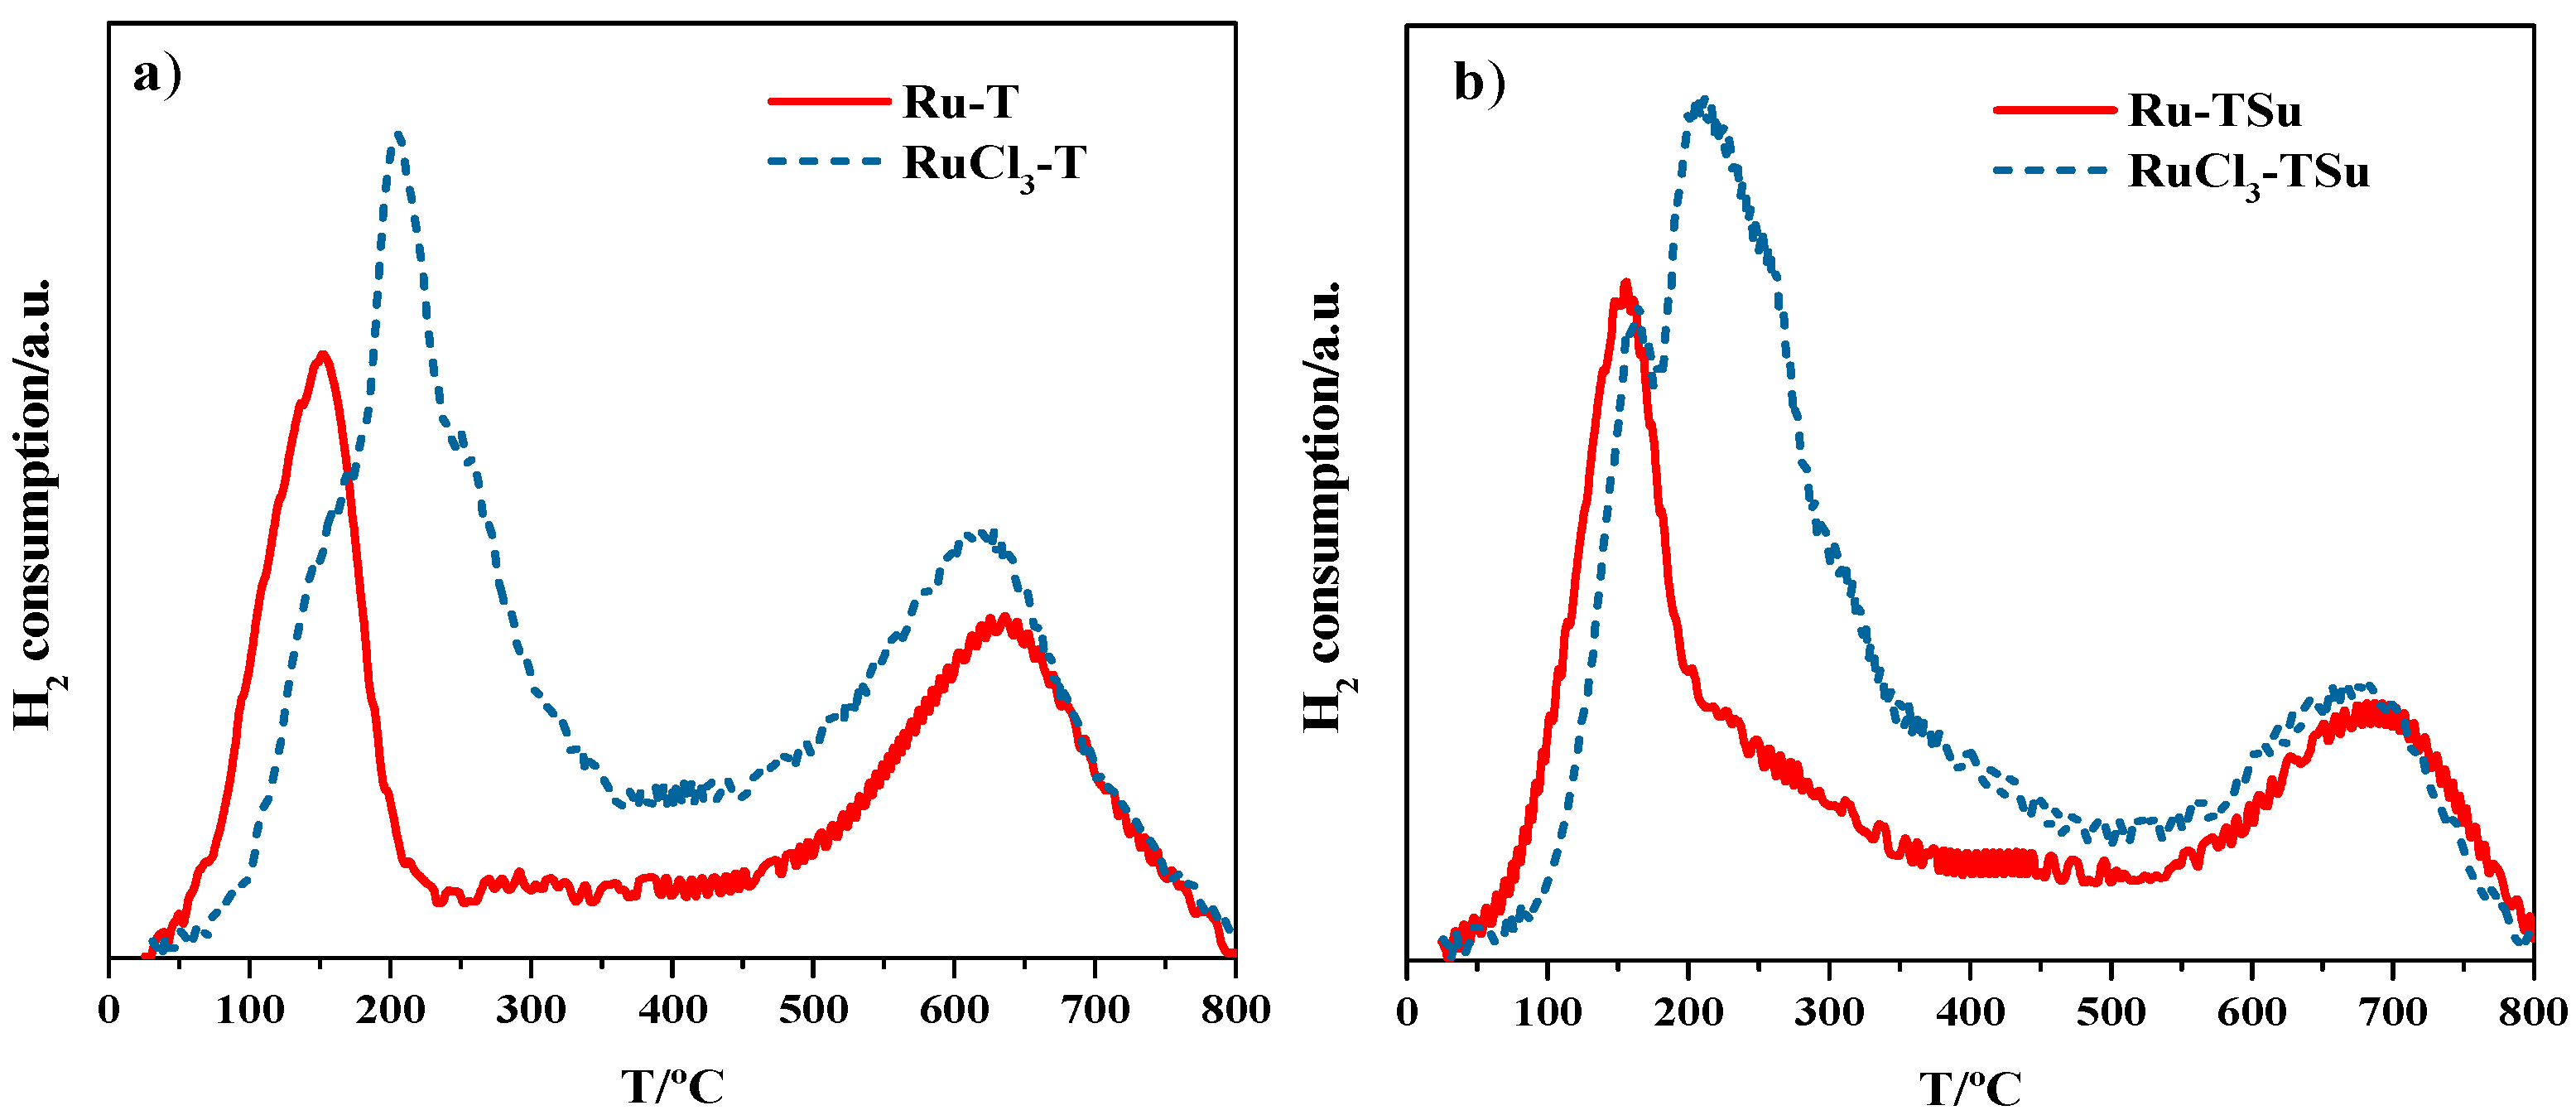
2.3. TPR Measurements
The temperature programmed reduction (TPR) profiles obtained for samples RuCl
3-T and RuCl
3-TSu (
Figure 3, dotted line) show two temperature intervals of hydrogen consumption: (i) from 100 to 300 °C, with a maximum located at 220 °C, and (ii) from about 400 °C to 800 °C. The lower-temperature hydrogen consumption is mainly attributed to the reduction of Ru
3+ to Ru
0 [
14,
27,
35] (or some other Ru
n+ species with intermediate oxidation states or different degrees of interaction with the carbon surface [
27]). The higher-temperature hydrogen consumption is due either to the interaction of hydrogen with the carbon surface upon OFG removal or to a methanation process assisted by hydrogen spillover. The interaction of H
2 with the carbon surface can also contribute to the hydrogen consumption in the lower-temperature region. In fact, the temperature interval of this hydrogen consumption coincides with the temperature interval of CO
2 evolution in the TPD of samples T and TSu.
TPR measurements of the sample RuCl3-TS show important interference between the hydrogen consumed due to Ru reduction and that due to interaction with OFG in the temperature interval from 100 to 300 °C, and because of that they have not been analyzed in this work.
Samples Ru-T and Ru-TSu (those submitted to the reduction treatment (250 °C, H
2 flow (80 mL/min), 4 h)) were also studied by TPR.
Figure 3 shows the TPR profiles obtained, superimposed onto those of samples RuCl
3-T and RuCl
3-TSu for the sake of comparison.
The TPR profiles of samples Ru-T and Ru-TSu also show hydrogen consumption but in a narrower and lower temperature interval than in the case of samples RuCl
3-T and RuCl
3-TSu. This means that the Ru particles are partially oxidized; probably surface and subsurface ruthenium oxides have been formed by interaction with atmospheric oxygen [
36]. The high-temperature hydrogen consumption due to the interaction with the carbon surface upon OFG removal or due to a methanation process is similar for both reduced and unreduced catalysts.
The quantification of the hydrogen consumed (in mmol/g) in the TPR experiments (
Figure 3) is presented in
Table 4. Columns 1 and 2 show, respectively, the total hydrogen consumed in the whole TPR experiment and in the first TPR peak (associated to the reduction of Ru species, but likely also influenced by the carbon surface chemistry). Columns 3 and 4 show, respectively, the calculated amount of reduced Ru in mmol/g and as wt %, using the data of column 2 and according to a H
2/Ru = 3/2 stoichiometry in samples RuCl
3-T and RuCl
3-TSu, and a H
2/Ru = 2 stoichiometry in samples Ru-T and Ru-TSu. That is, we assume that the consumed hydrogen only reacts with Ru(III) or Ru(IV) species (i.e., not considering the potential interaction with OFGs).
The calculated amounts of reduced Ru in samples RuCl3-T and RuCl3-TSu were 6.5 wt % and 5.3 wt %, respectively, which is close to the nominal Ru loading (5 wt %). The excess (with respect to the 5 wt % loading) is likely related with the difficulty of a very precise calculation of the H2 consumed for reduction due to the interaction of hydrogen with the surface oxygen groups that decompose at relatively low temperature.
The calculated amounts of Ru reduced in samples Ru-T and Ru-TSu were 3.8 and 3.0 wt %, respectively. Thus, the approximate amount of oxidized Ru, likely present as RuO2, on the Ru nanoparticle surface is above 50%.
It is interesting to mention that the sharp CO
2 peak centered at about 450 °C observed in the TPD spectra of the Ru-containing samples (
Figure 1) is not related to any H
2 consumption. This indicates that such CO
2 evolution must be a consequence of reactions between OFG taking place during the TPD treatment and also of a carbon gasification process coupled to the reduction of the RuO
x species mentioned above. Both processes are likely catalyzed by Ru.
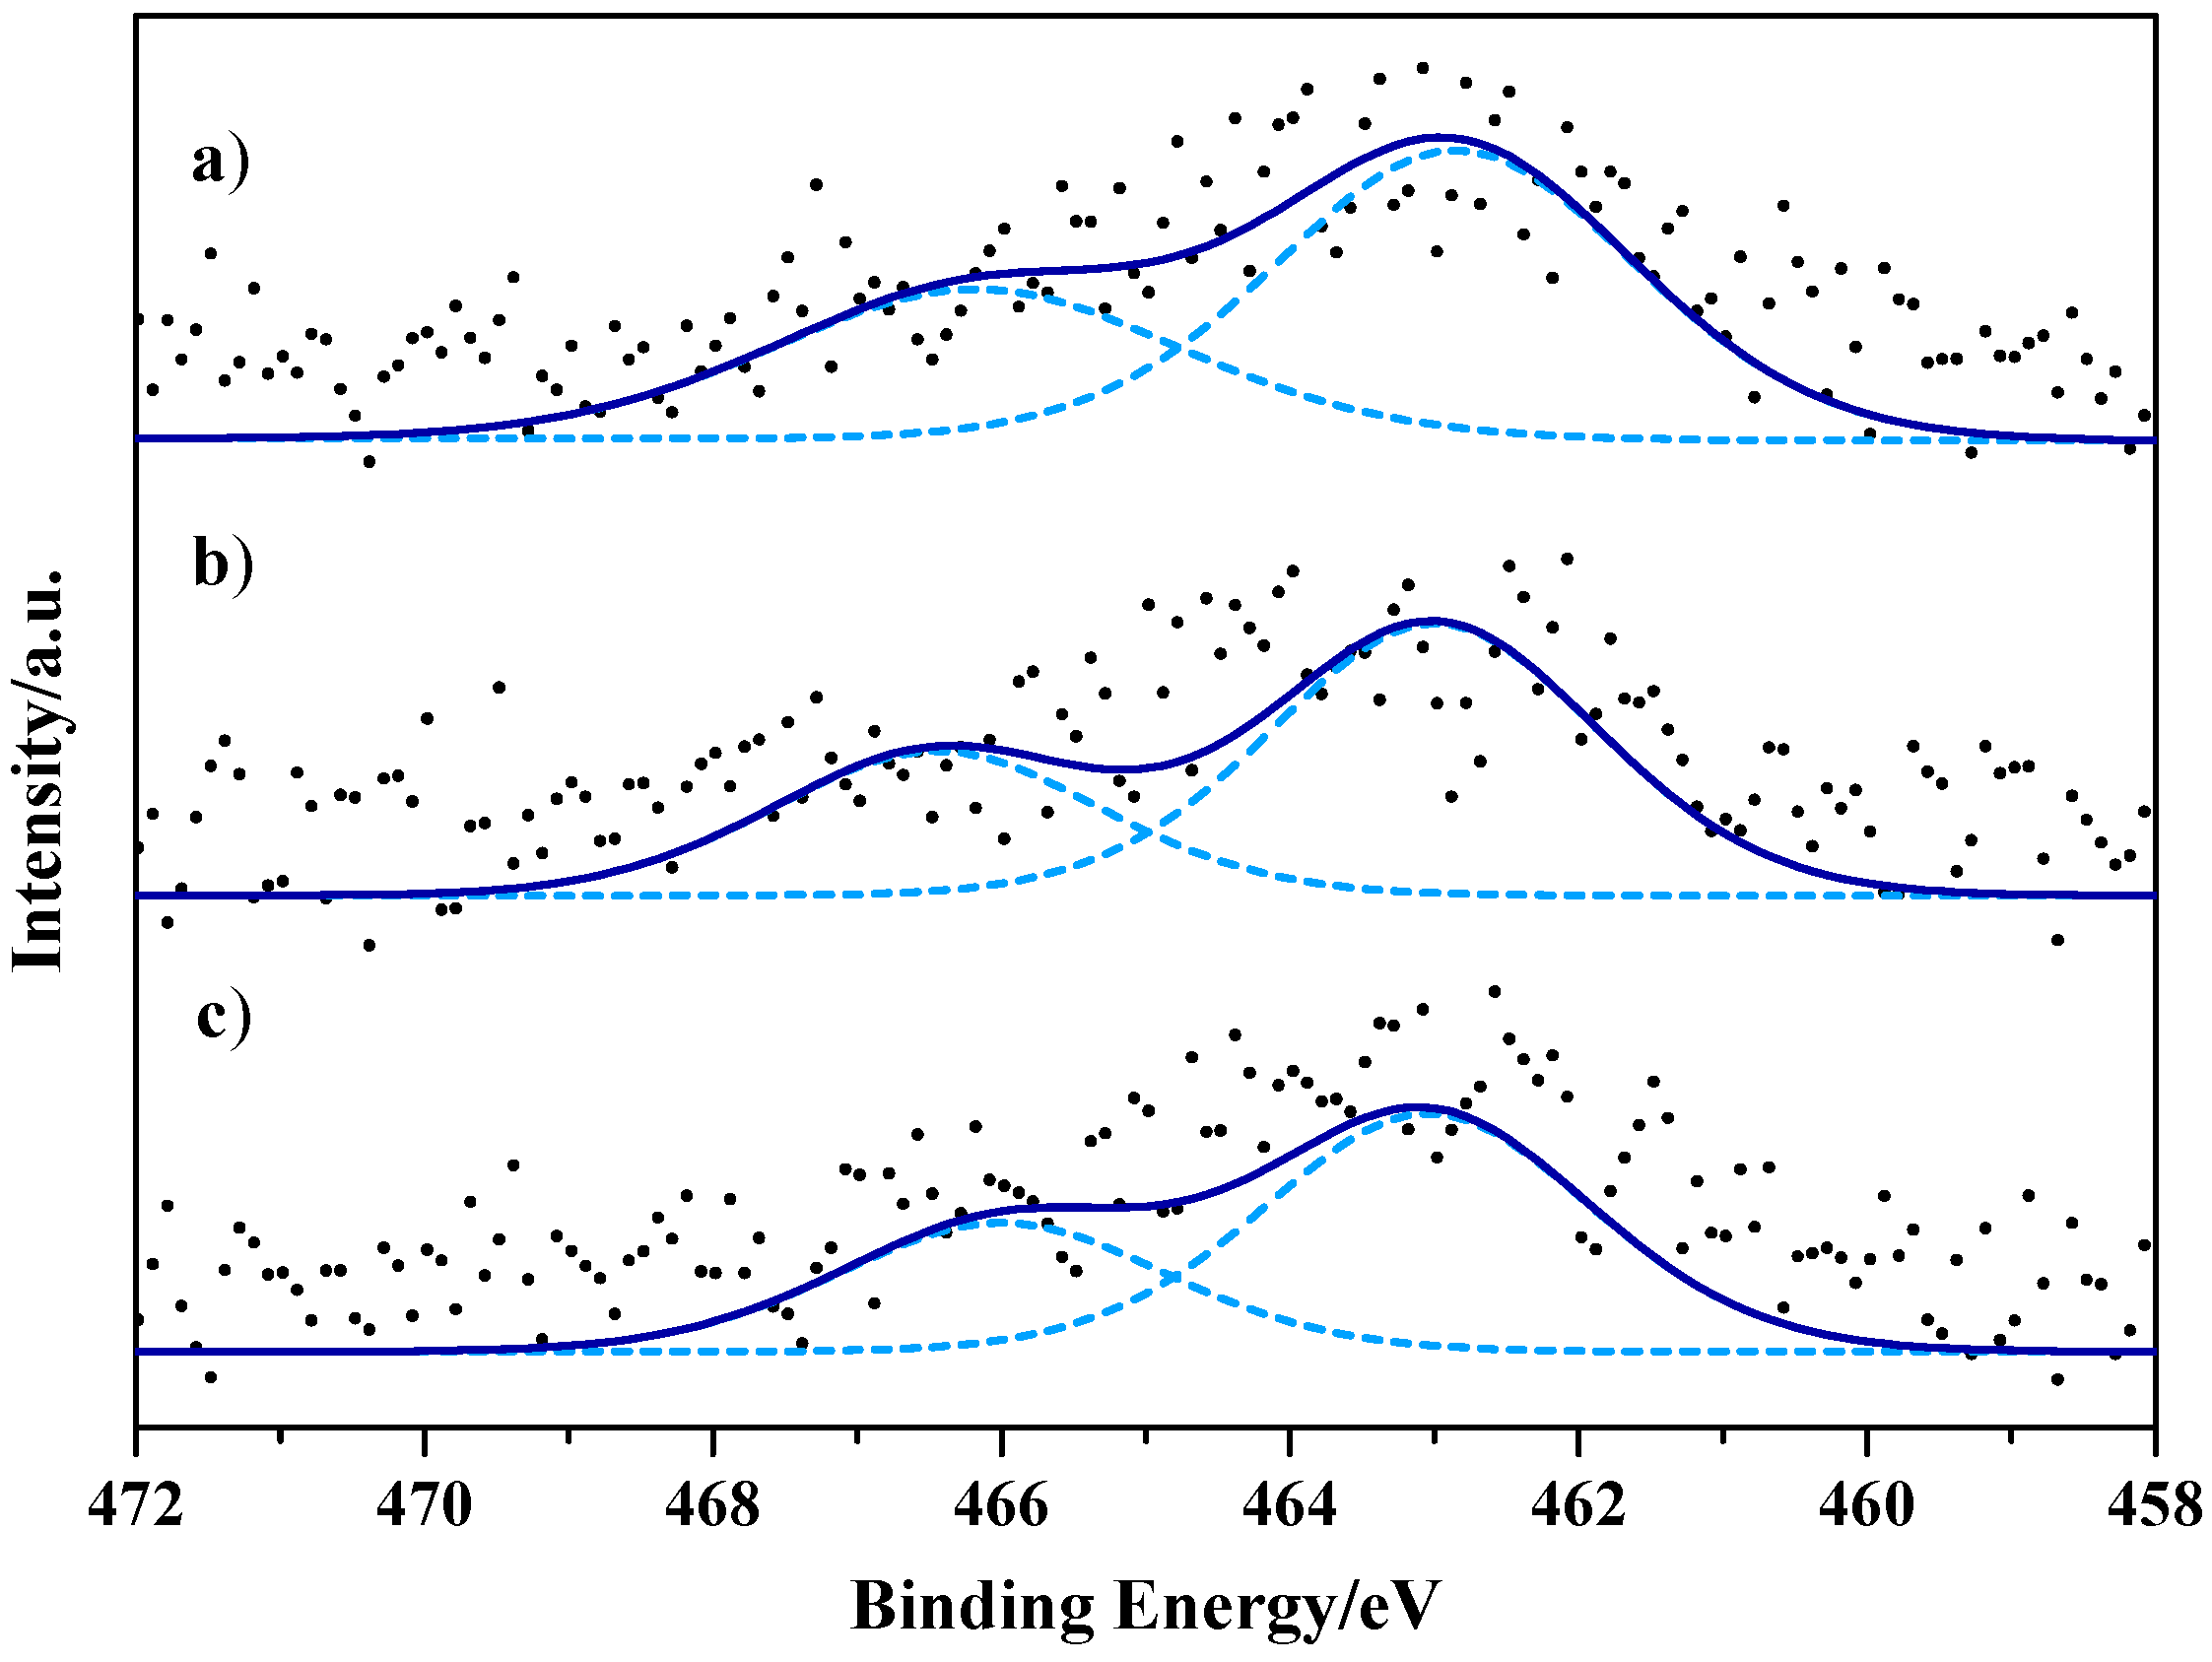
2.4. Analysis of Supported Ru by XPS and TEM
The XPS spectra of Ru 3p in samples Ru-T, Ru-TSu, and Ru-TS are shown in
Figure 4. The Ru 3p analysis was selected because of the overlapping of Ru 3d and C 1s core levels which precludes the identification of Ru species. The Ru 3p spectra obtained show two peaks located at about 463 eV and 466 eV, meaning, as expected, that Ru is present in two different oxidation states or electronic environments (exact binding energy values can be seen in
Table 5). The assignation of these binding energies is not straightforward as a relatively broad set of data has been found in the literature for the same or similar species [
15,
20,
37,
38,
39,
40,
41]. Thus, based on the literature data and on our own results from other characterization techniques, we consider that the B.E. of about 463 eV corresponds to either Ru or Ru/RuO
x species, while the higher B.E. value is due to oxidized (and probably hydrated) Ru species in which Ru is bonded to O.
These results indicate that the amount of oxidized Ru is close to 40%—similar in the three prepared samples and in acceptable agreement with the proportion of oxidized Ru determined by the TPR measurements. In any case, it should be mentioned that under reaction conditions (190 °C, 50 bar H2), Ru will be completely reduced.
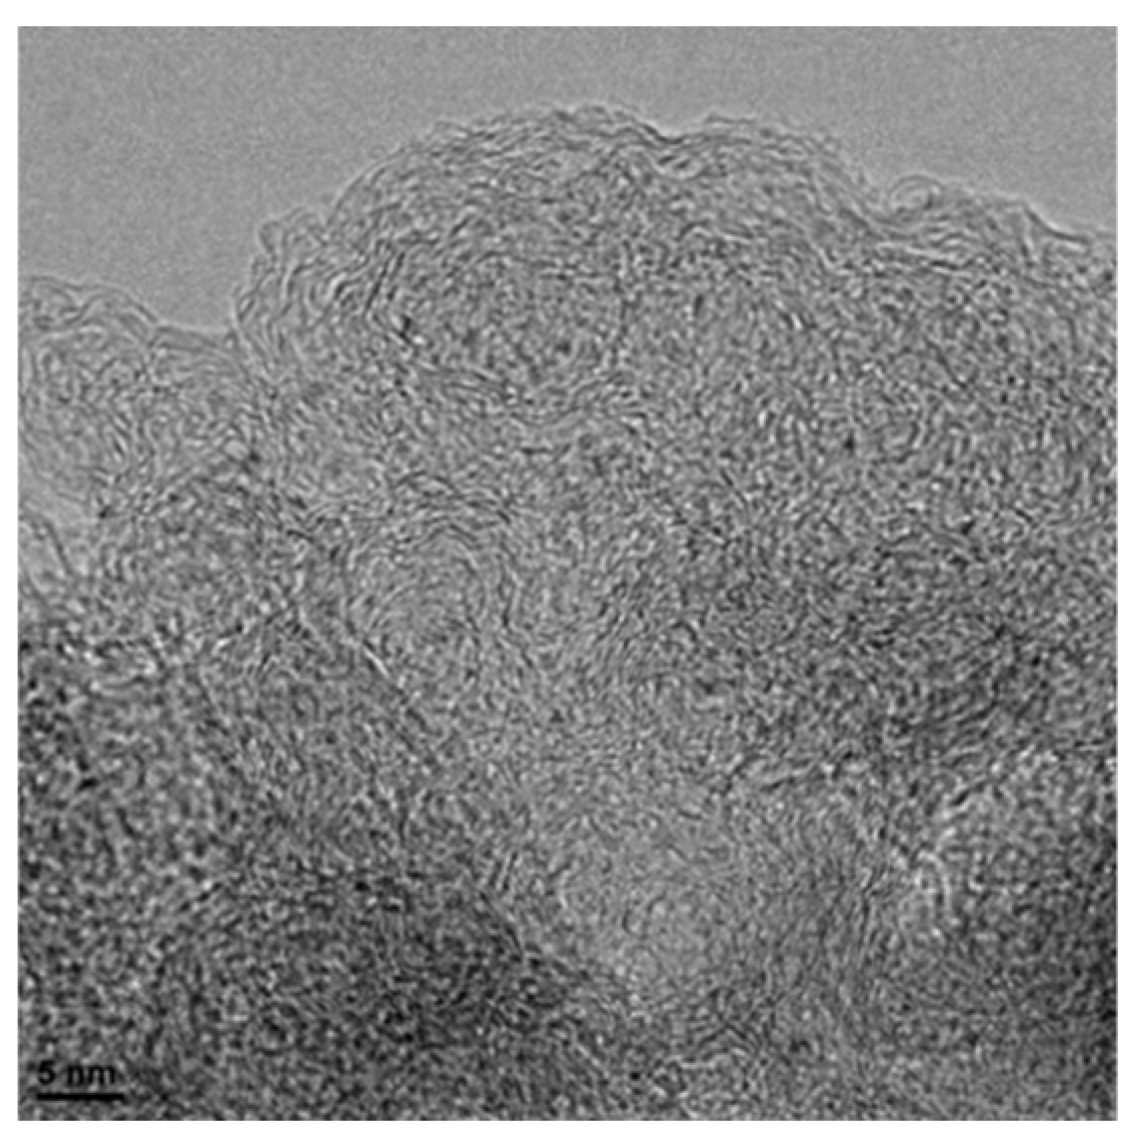
The transmission electron microscopy (TEM) analysis carried out shows that the Ru nanoparticles were well dispersed in the three catalysts. An example of the obtained TEM images can be seen in
Figure 5 (the complete TEM information (images and Ru particle size distribution graphs obtained for catalysts Ru-T, Ru-TSu, and Ru-TS) can be seen in the
supplementary information (Figure S5)). The particle size was estimated after image analysis and measurement of more than 150 particles (with the aid of the program Analysis (SIS Auto, No Acquisition)). In all cases, the Ru particles were quite small, with the average particle sizes being 1 nm, 1.2 nm, and 0.8 nm for catalysts Ru-T, Ru-TSu, and Ru-TS, respectively.
2.5. Hydrolytic Hydrogenation of Cellulose
Table 6 shows cellulose conversion values and selectivity to the different products obtained with catalysts Ru-T, Ru-TSu, and Ru-TS, and in a blank experiment. The catalytic activity tests were duplicated and a good reproducibility was obtained. A schematic representation of the main product molecules is shown in
Figure S6 of the supplementary material.
It can be observed that the three catalysts are active, leading to cellulose conversion above 60%—clearly higher than the 35.6% reached in a blank experiment. Regarding the product distribution, the blank experiment renders mainly glucose and hydroxymethylfurfural (HMF), while the Ru catalysts produce the sugar alcohols sorbitol and mannitol as main C
6 products. Catalysts Ru-T and Ru-TS also produce a significant amount of sorbitan formed by the cyclodehydration of sorbitol which can be related with the larger amount of residual Cl in these samples (as reported in the literature, the presence of Cl favors the reaction [
22]). In addition, other products that might be erythritol, ethylene glycol, levulinic acid, and formic acid are produced with the three catalysts.
Comparing the behavior of the three Ru catalysts, it can be observed that Ru-TSu shows the highest selectivity to sorbitol and also produces the lowest amounts of other products. The obtained results indicate that the yield of C6 compounds is 29%, 39%, and 24% for catalysts Ru-T, Ru-TSu, and Ru-T, respectively.
Due to its better performance, catalyst Ru-TSu was submitted to a reuse test. Once the first run was finished, the solid and liquid phases were separated by centrifugation and filtration; the solid, containing unreacted cellulose and the catalyst, was dried (110 °C, 12 h) and then introduced again into the reactor together with the required amount of cellulose to have a total amount of 0.500 g and with water (0.025 g). In the reuse test, catalyst Ru-TSu led to similar conversion and selectivity (see
Table 6), meaning that it had not been deactivated.
The Ru catalysts were also tested in the hydrogenation of glucose in order to independently study their hydrogenation ability (
Table 7). In a blank experiment, glucose conversion is about 43%, and it is mainly dehydrated to HMF or degraded to other products. With the Ru-containing catalysts, glucose conversion is complete, sorbitol and mannitol are formed, and catalysts Ru-T and Ru-TS also produce sorbitan. It seems that, as commented upon above, these two catalysts (with the higher chlorine content) favor the degradation of glucose and sorbitol, which is also revealed by the higher proportion of unidentified products. It is probable that a shorter reaction time would partially avoid the degradation reactions. Although the three Ru catalysts are very active for glucose hydrogenation, Ru-TSu is the one leading to the largest amount of sugar alcohols, meaning that it is the most selective hydrogenation catalyst; probably because of that, it has the best performance in the hydrolytic hydrogenation of cellulose.
The properties that confer to catalyst Ru-TSu the best catalytic performance (high cellulose conversion and high activity and selectivity to sorbitol) are likely the following: it has a high surface area with a large mesopore volume, has a relatively high acidity, and contains the largest amount of sulfonic groups and the lowest amount of residual Cl. This set of beneficial properties was achieved by selecting a carbon material with a suitable porous structure and also a functionalization treatment that produces acidic surface groups, among them a relatively large proportion of sulfonic groups, without diminishing the porosity.
Catalyst Ru-TSu leads to a high yield of sugar alcohols (39%) with a 69% cellulose conversion in 3 h, and it is reusable. The comparison with other reported results for similar catalysts [
14,
15,
20,
21,
22,
35,
42] is not straightforward because the reaction conditions are not the same, but catalyst Ru-TSu can be considered among the best-performing ones, considering that the high conversion and yield were obtained in only 3 h, and a relatively high cellulose/Ru weight ratio (80) was used.
3. Materials and Methods
3.1. Catalyst Preparation
The commercial carbon black used in this work was T-10157 from Columbian Chemical (Brunswick, OH, USA), named only T for simplicity. Two more samples were prepared by functionalization treatments of T aimed to develop acidic sites. Sample TSu was prepared by treatment A: carbon T was mixed with an H
2SO
4 solution (96%, 75 mL/g of carbon) and then kept under reflux at 150 °C and stirred for 24 h. Afterwards, the solid material was filtered and washed with distilled water until neutrality of the washing liquid. Sample TS was prepared by treatment B: a mixture of sample T and a saturated solution of (NH
4)S
2O
8 ()in H
2SO
4 1 M (10 mL/g of carbon) was stirred at room temperature (24 h); after filtration, the solid was washed with distilled water until the complete removal of sulphates [
43] (test carried out with BaCl
2 solution). In both cases, the solids were dried at 110 °C for 24 h.
Ru nanoparticles were supported on carbon materials T, TSu, and TS following the procedure described next [
44]. After degasification (150 °C, vacuum, 4 h), the solid was mixed with an aqueous solution of RuCl
3 (10 mL/g of carbon) of the appropriate concentration to obtain catalysts with 5 wt % Ru (that is, a 10.8 g/L aqueous solution of RuCl
3). The mixture was kept at room temperature under stirring (15 h), and then it was sonicated (3 h). Afterwards, the solvent was removed (60 °C, reduced pressure) and the solid was dried (110 °C, 15 h). The samples, named RuCl
3-T, RuCl
3-TSu, and RuCl
3-TS, were submitted to a reduction treatment (250 °C in H
2 flow (80 mL/min), 4 h); then, they were named Ru-T, Ru-TSu, and Ru-TS.
3.2. Catalyst Characterization
Surface area and porosity were determined by means of N
2 adsorption isotherms at −196 °C, measured in the automatic equipment Autosorb-6B (Quantachrome Instruments, Boynton Beach, FL, USA), after degasification (250 °C, 4 h). The Brunauer–Emmett–Teller (BET) equation was used to calculate the surface area (S
BET), while the Dubinin–Radushkevich equation was used to determine the volume of micropores (V
DR N
2) (these two equations can be seen in the
Supplementary Material, InfoS1). The volume of mesopores (V
meso) was calculated as the difference between the volumes of N
2 adsorbed at relative pressures P/P
0 = 0.9 and P/P
0 = 0.2, and the total pore volume (V
T) was determined from the volume of N
2 adsorbed at P/P
0 = 0.99 [
45,
46].
Temperature Programmed Desorption (TPD) measurements (10 °C/min up to 925 °C, He 100 mL/min) were carried out in a Thermobalance SDT Q600 (TA instruments) coupled to a Balzers MSC 200 Thermostar mass spectrometer (Pfeiffer Vacuum).
Acidity was determined by titration as follows: The solid material (0.040 g) was put in contact with a 0.01 M NaOH solution (20 mL), and the mixture was kept under stirring at room temperature for about 2 h. Afterwards, the solid was removed by filtration, and the remaining solution was titrated with HCl 0.01 M using phenolphthalein as an indicator [
47].
The catalysts were also characterized by Temperature Programmed Reduction (TPR) (5 vol % H2 in Ar (40 mL/min), 10 °C/min up to 800 °C) using a Micromeritics Pulse Chemisorb 2705, with a TCD (thermal conductivity detector, calibrated with a CuO standard sample; Transmission Electron Microscopy (TEM, JEOL JEM-2010); and X-ray Photoelectron Spectroscopy (XPS, K-Alpha from Thermo-Scientific). Elemental analysis was performed in samples T, TSu, and TS (“TruSpec CN” LECO analyser, LECO corporation).
3.3. Catalytic Activity Tests
In a typical experiment, the catalyst (0.125 g), cellulose (0.500 g), and distilled H2O (25 g) were introduced, inside a Teflon lining, into a 50 mL stainless steel Parr reactor (model 4792). After purging, the reaction conditions were fixed at 190 °C and 50 bar H2; then, the stirring was started (t = 0) and the reaction left to take place for 3 h. Afterwards, the reactor was cooled down, depressurized, and finally opened. The content was centrifuged to enhance the separation of the solid and liquid phases. After drying, the solid phase (catalyst and unreacted cellulose) was weighed to determine cellulose conversion. The liquid phase was analyzed by High Performance Liquid Chromatography, HPLC (1260 Infinity II LC System, Agilent Technologies) with a Agilent HiPLEX Ca DUO column and refraction index detector (RID6A); the other conditions were 80 °C oven temperature, isocratic regime (H2O, 0.4 mL/min), and 5µL injected sample.
Blank experiments, without catalyst, were also carried out.
The conversion of cellulose and the selectivity to a particular product (X) were determined as indicated in Equation (1) and Equation (2), respectively.
Similar experiments were performed using glucose (0.500 g) as substrate, with a reaction time of 1 h. Glucose conversion (Equation (3)) and selectivity (Equation (2)) were determined by HPLC analysis of the solution.


