2.1. Physico-Chemical Characterization of the Catalyst
A summary of chemical composition and textural properties of Ni/γ-Al
2O
3 catalysts is given in
Table 1, where wt % corresponds to Ni NPs on γ-Al
2O
3. Due to the fact that the same support was used, the specific surface areas (
SBET) and average pore volume (APV) of the Ni/γ-Al
2O
3 catalysts have similar values. A slight reduction in the average pore diameter (APD) was observed when Ni loading was increased, which might be directly related to the partial blockage of support pores [
15,
21]. The elemental composition of the Ni/γ-Al
2O
3 catalyst was determined using energy dispersive X-ray spectroscopy (EDS) and is shown in the same table. Quantified Ni loadings in catalysts agreed with the theoretical amount of Ni on γ-Al
2O
3 (3, 5, and 7 wt %). A slight variation in the experimental amount for Ni from the expected value was found because EDS is a punctual analysis technique [
8].
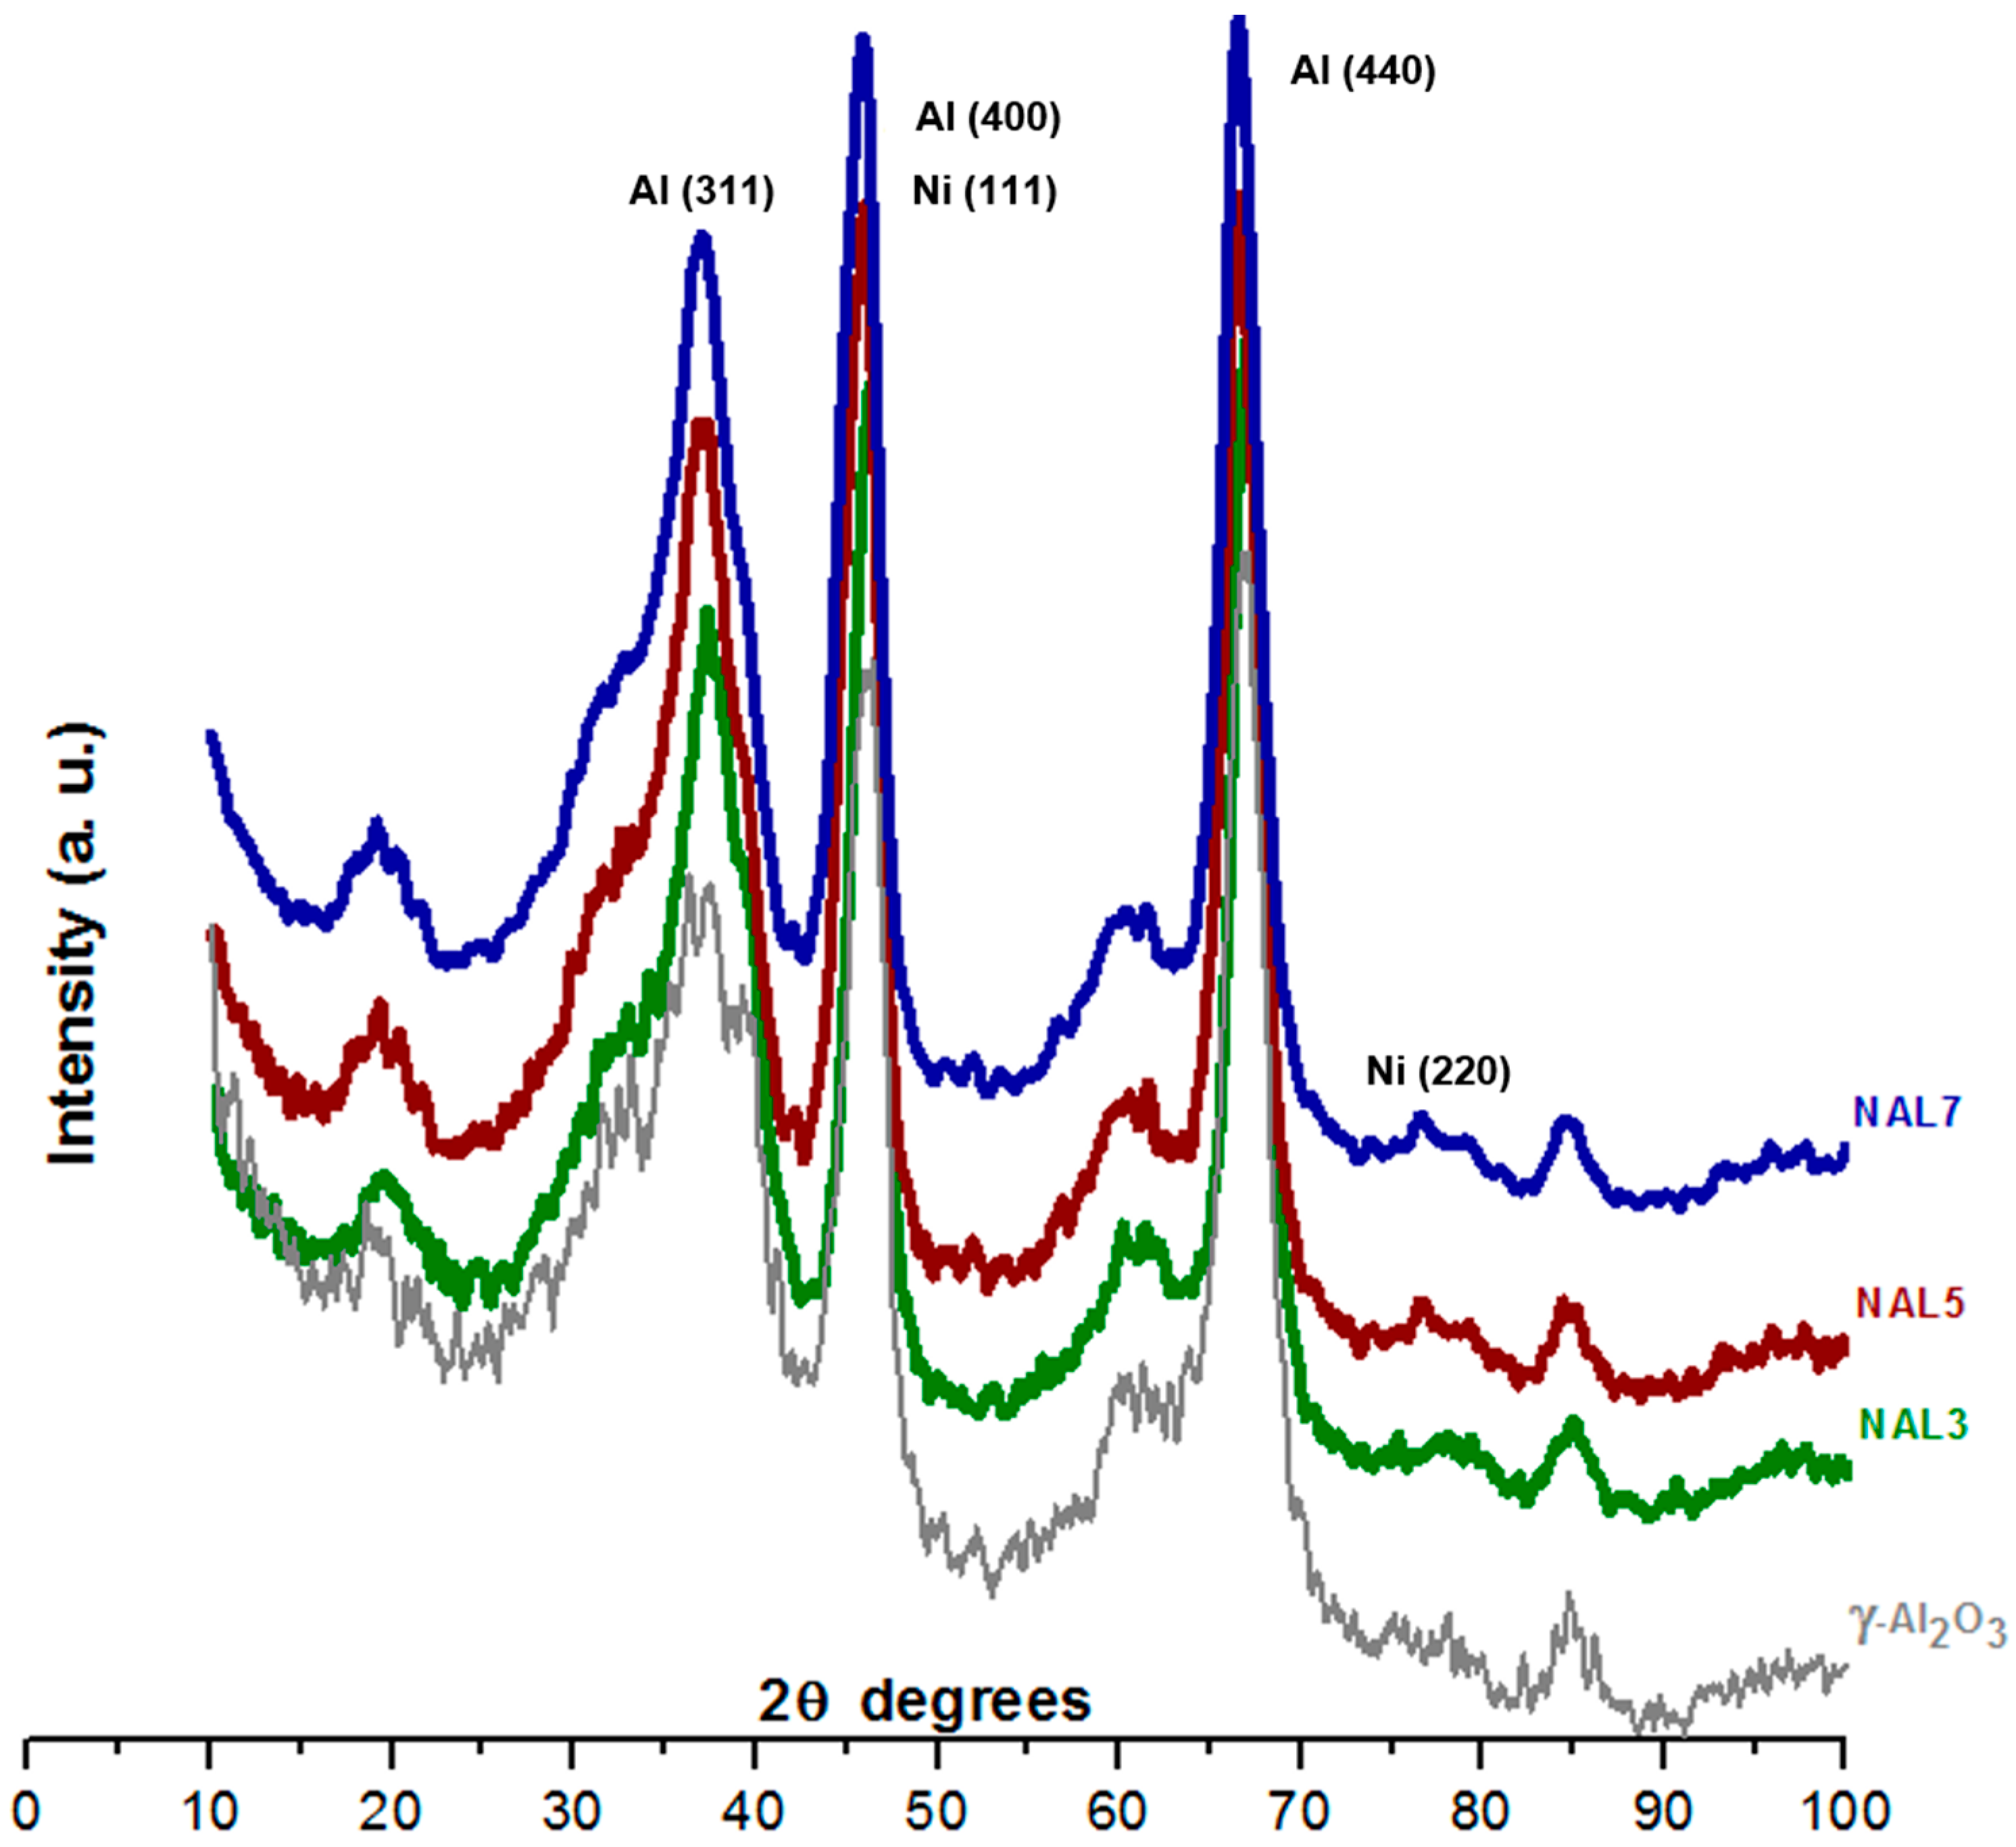
XRD patterns of Ni/γ-Al
2O
3 catalysts (
Figure 1) can determine the effect of active phase concentrations on the intensity of the reflections. The diffraction patterns of samples show reflections 2θ at 37.2°, 39.8°, 46.2°, 67.1°, 18°, and 60°; which are characteristic of the crystalline alumina phase [
21,
22].
XRD diffractograms of catalysts are similar to those of γ-Al
2O
3; this can be attributed to the small quantity of metal introduced. Its presence did not change the crystalline phase of γ-Al
2O
3. The main peaks corresponding to the probable introduction of NiO into the material at 37° and 43° [
23] were not recorded in the DRX pattern due to the overlap with the γ-Al
2O
3 intense peaks. Nevertheless, the presence of Ni was detected on the Ni/γ-Al
2O
3 catalysts since the weak peak at ~77° corresponds to the crystallites of Ni [
24], which is almost undetectable in the NAL-3 sample.
Figure 2a shows XPS spectra of Ni/γ-Al
2O
3 catalysts with different weight percentages of Ni (3, 5, and 7). The O1s spectrum characteristic of oxygen is clearly observed at a binding energy at 530 eV. Al2p can be observed with a typical binding energy of 74 eV [
25]; thus, it was determined that the Al atoms are in the oxide form, and can act as catalyst supports [
26].
Figure 2b shows the peaks in the range between 850 and 900 eV. The most intense peak was detected at 856.08 eV, and corresponds to the Ni 2p3/2 state. Two satellite peaks of Ni 2p3/2 were observed at 861.86 and 880.14 eV that are characteristic for Ni
2+ species [
27,
28,
29,
30]. On the other hand, the basic spectrum shows the Ni 2p1/2 state at 873.94 eV attributed to Ni
3+ species [
31]. This could be explained by the exposure of catalysts to the ambient promoting oxidation on the catalyst surface. However, during the HDO reaction, an in situ reduction of some oxide species on the surface of Ni catalyst is performed, resulting in only Ni/Al
2O
3 [
20]. The experimental composition calculated from XPS analysis was 2.6, 4.4, and 6.2 wt % compared to the theoretical composition of 3, 5, and 7 wt % of Ni, respectively. The weight percentage obtained through this analysis confirms that the method of preparation of the catalysts was adequate and in accordance with EDS.
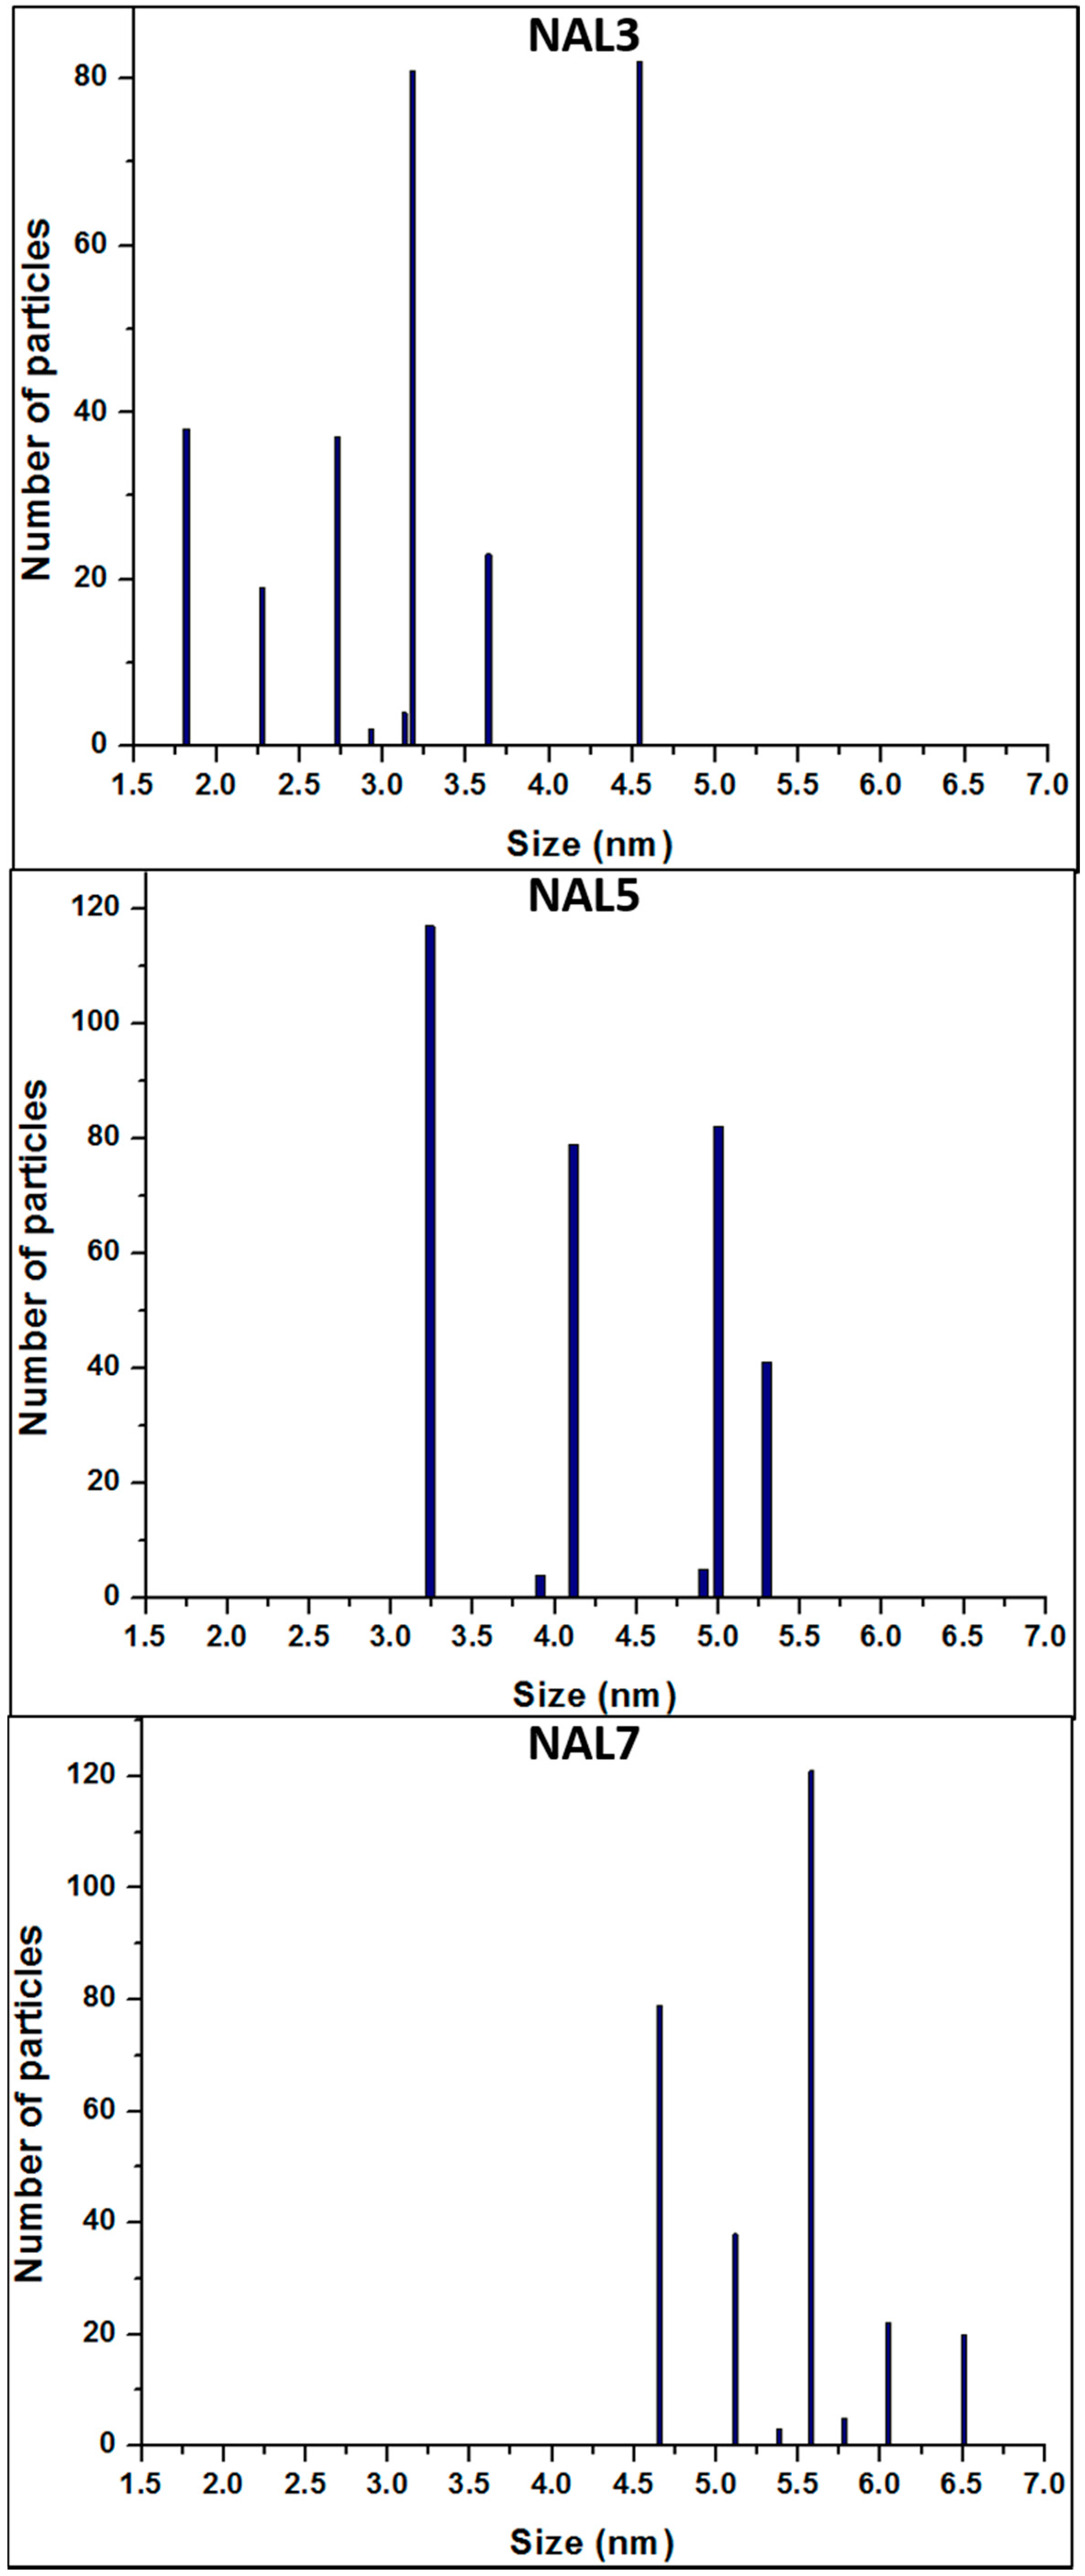
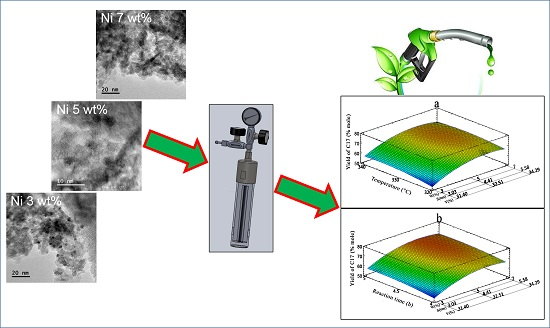
The influence of different Ni loadings in the nanoparticle morphology deposited on γ-Al
2O
3 was studied by high-resolution transmission microscopy (HR-TEM). According to
Figure 3, the particle size of the Ni phase slightly increases, while the Ni loading is increased over the support material. Histograms of Ni nanoparticles (
Figure 4) show an increase in the average size with respect to the weight percentage of metal loaded; over 1.8–4.6 nm, 3.2–5.3 nm, and 4.6–6.5 nm for NAL3, NAL5, and NAL7 samples, respectively. The wet impregnation technique followed by oxidation and reduction processes were adequate to deposit and disperse Ni NPs, where the role of HNO
3 enhanced the properties of the crystalline structure of γ-Al
2O
3 (mainly planes 100, 110, and 111), as reported by Digne et al. [
32]. The properties of γ-Al
2O
3 are determined by various surface conditions, mainly the increase in surface hydroxyl groups, which can produce Ni nanoparticles of smaller sizes.
Figure 3d shows the STEM image of 5 wt % of Ni NPs supported on γ-Al
2O
3, where lattice fringes of Ni atoms and a slightly oval shape of nanoparticles can be observed.
A multivariate analysis considering the size and amount of Ni nanoparticles deposited was performed using the Statgraphics software.
Table 2 shows a statistical analysis of Ni nanoparticles size, including central tendency and dispersion measurements. For all Ni/γ-Al
2O
3 catalysts (3, 5, and 7 wt % of metal) it can be observed that the standardized bias and standardized kurtosis indicate that the size of the Ni nanoparticles deposited is normally distributed, because these values are within the statistical range of −2 to +2. This study also found that the average nanoparticle size variation coefficient increases as the weight percentage of Ni increases. The coefficient of variation is of particular interest since it is a measurement of dispersion that is defined as the ratio between the average size and the variable range. It was noted that a higher coefficient of variation implies a greater dispersion of Ni nanoparticle size (
Table 2).
2.2. Conversion of Oleic Acid by Hydrodeoxygenation
Yields of n-C17 and n-C18 in the oleic acid HDO were compared for all Ni /γ-Al2O3 catalysts. It can be concluded that the density and size of Ni nanoparticles accelerate HDO reaction into the homemade reactor. As mentioned before, the reaction temperature varied from 320 to 340 °C; H2 pressure remained in 23 bar; stirring was kept steady at 120 rpm; and the reaction time was 4–5 h, with acid oleic conversion and product yield calculated by GC analysis.
NAL7 at 320 °C gave a conversion of 75.4% after 4 h reaction time; NAL5 and NAL3, after the same reaction time, showed conversions of 69.7% and 57.9%, respectively. Hence, a higher load of Ni on alumina gives higher conversion, according with reports in the current literature of catalytic activity on Pt /γ-Al
2O
3, Pd/γ-Al
2O
3 y Ni/γ-Al
2O
3 [
11]. After 5 h of reaction time at 340 °C, NAL7 again gave a higher oleic acid conversion (84.8%) in comparison with NAL5 and NAL3, which showed conversion rates of 79.4% and 70.1%, respectively. It can preliminarily be concluded that operation conditions, Ni NPs as catalytic phase, and a reactor with axial/radial stirring produce adequate conversion at short reaction times in similar experiments, as previously reported by Madsen et al. [
11].
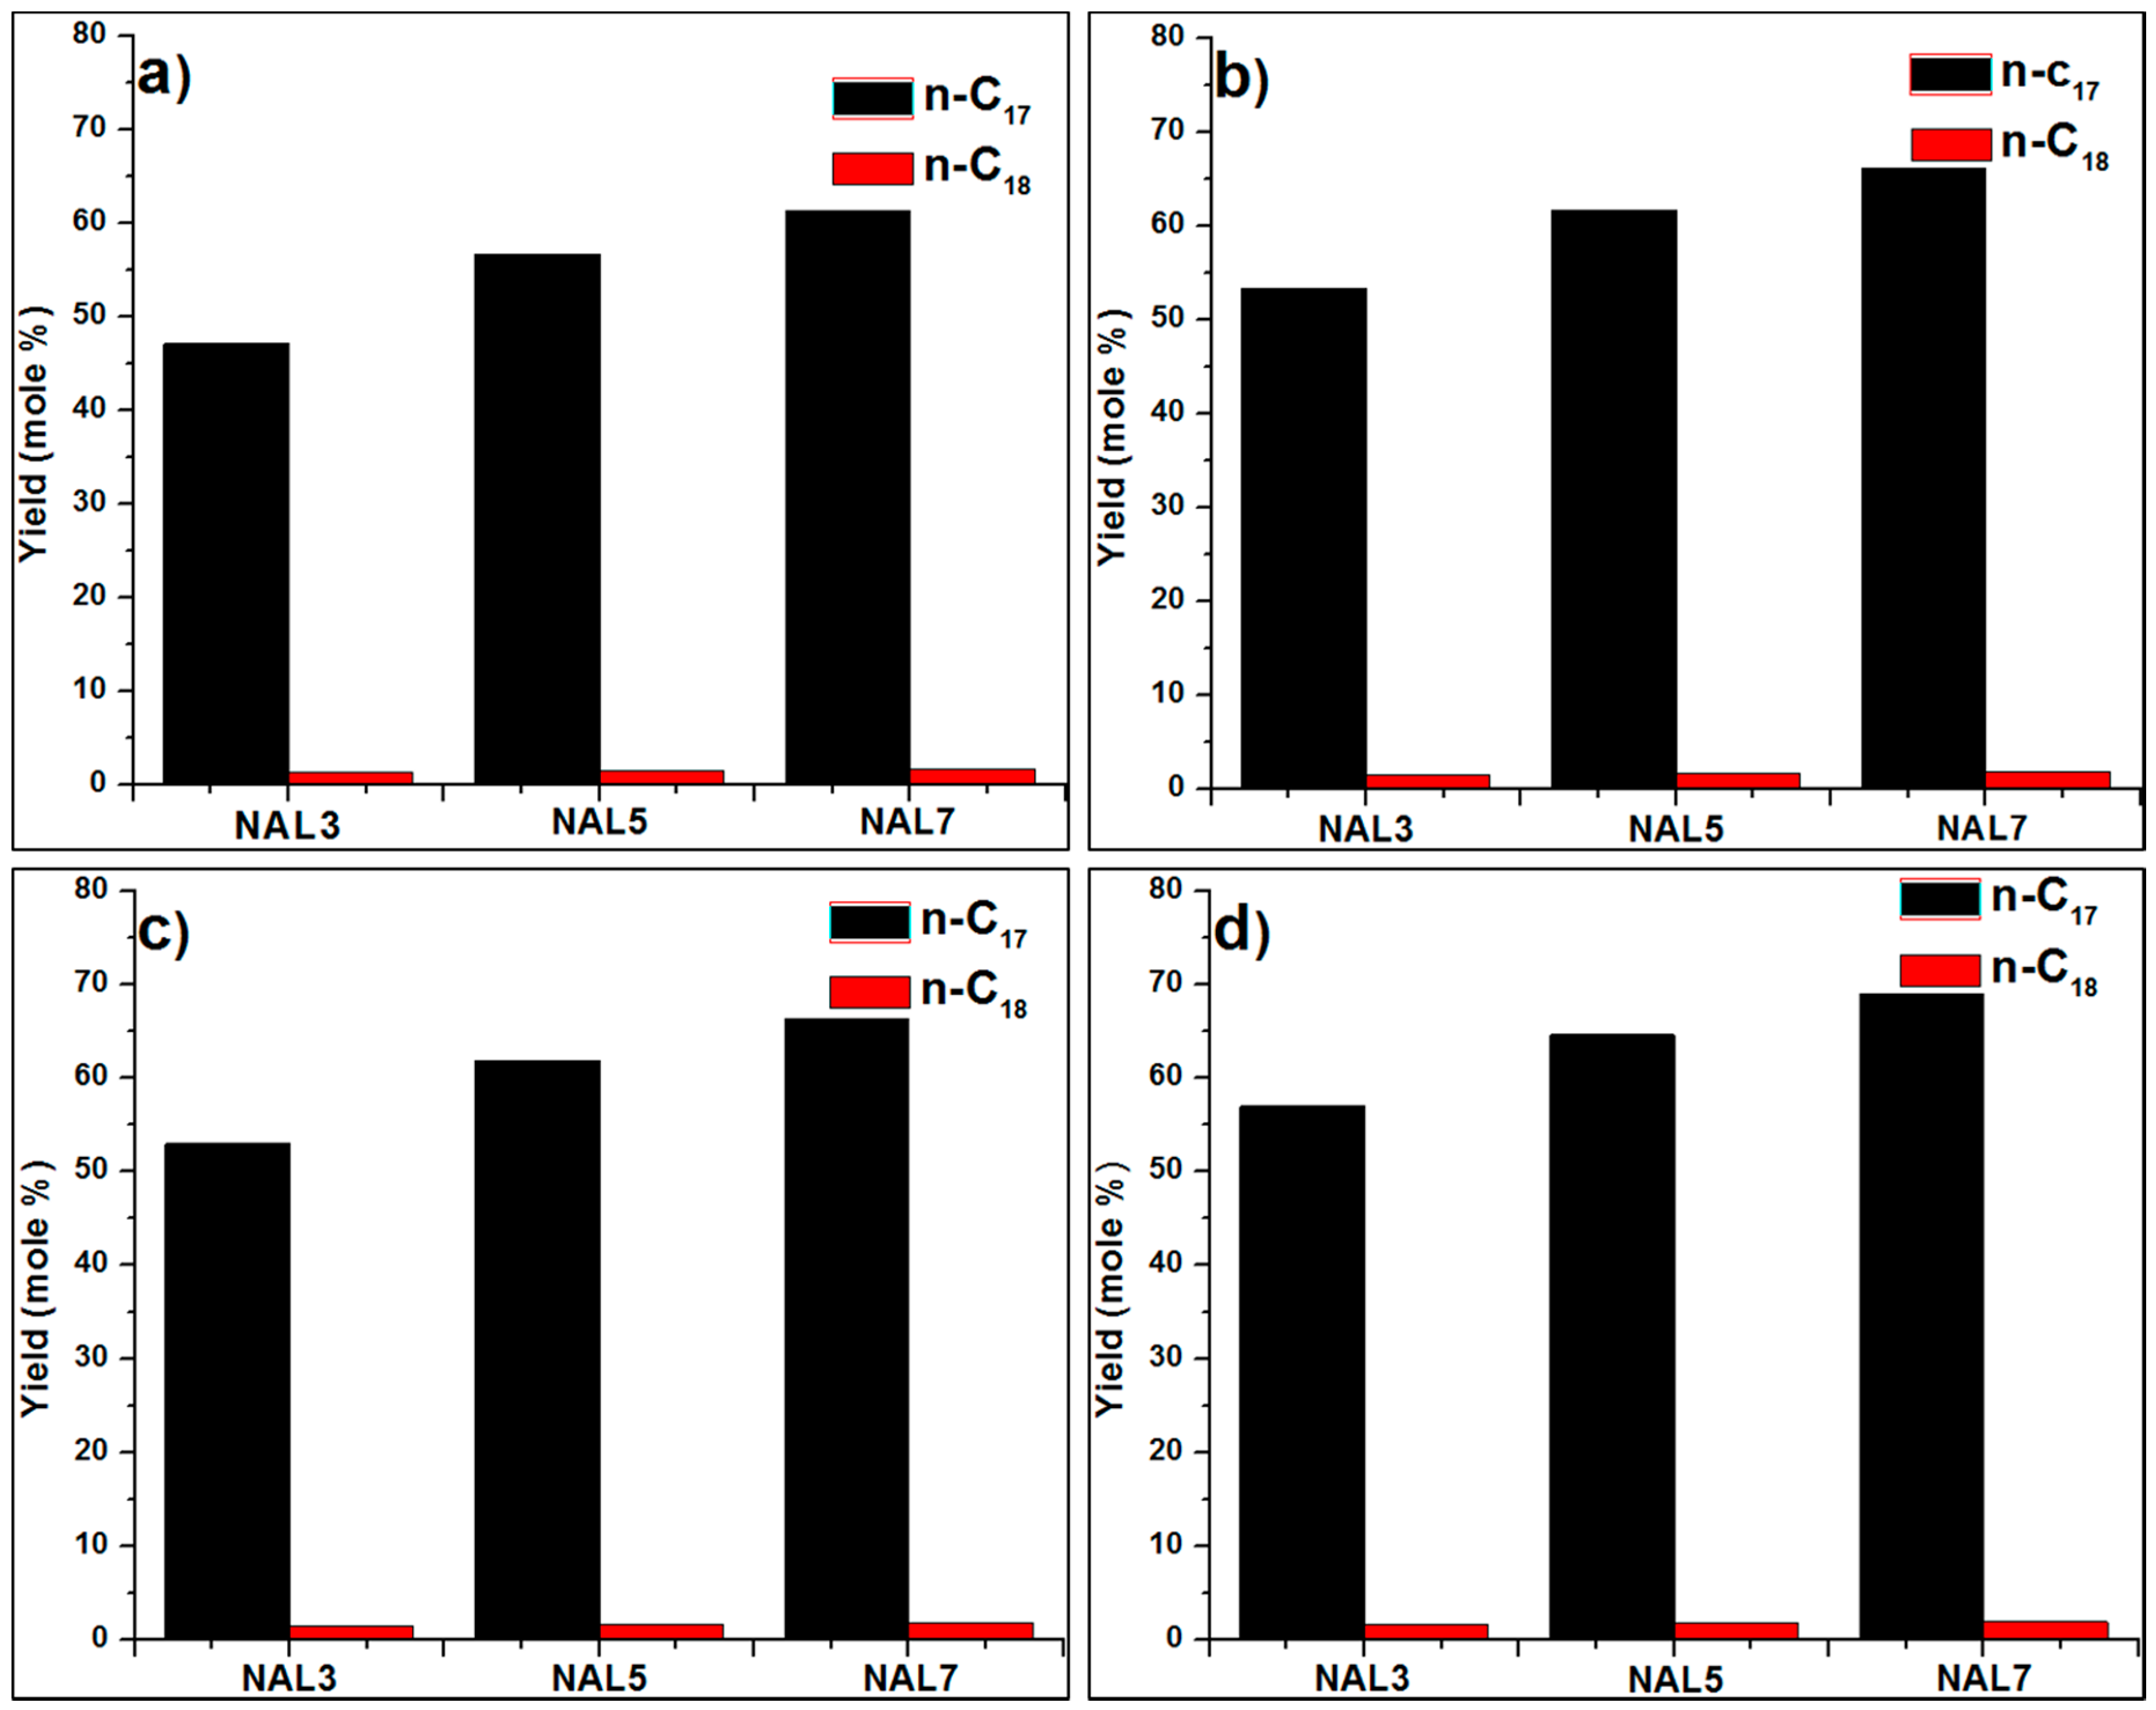
Yields of
n-C
17 and
n-C
18 from oleic acid decarbonylation and decarboxylation at 320/340 °C and 4–5 h reaction times are analyzed in
Figure 5. In all experiments the NAL7 catalyst showed a better yield of
n-C
17 (i.e., 68.94 mol % at 340 °C after 5 h). All catalysts showed higher yields of alkanes
n-C
17 and
n-C
18 after 5 h of reaction time. On the other hand, a higher temperature produces decarbonylation and decarboxylation reactions, mainly producing
n-C
17 [
33]. After 5 h, the
n-C
17 yield was higher at 340 °C, giving similar results using a catalytic material with 7 wt % of Ni, as reported by Kaewmeesri et al. [
34]. However, changes in the product yields are more notable in the NAL5 catalyst when experimental data are compared after 4 h of reaction time with those at 5 h.
Analyzing the experimental results, it may be observed that after 4 and 5 h of reaction time, the
n-C
17 yield is just a little higher for NAL7. However, 5 wt % of Ni loading seems to be a better catalyst from a cost-benefit point of view to assure high oleic acid conversion rates and a good
n-C
17 selectivity based on the active phase percentage used on industry [
11]. Our results are consistent with those of Kubicka et al., who reported higher conversion on hydrotreatment of vegetable oils when higher proportions of Ni/(Ni + Mo) to Al
2O
3 were used [
35]. Strobel and co-workers [
36] found that an increase in the quantity of Pt nanoparticles causes an increase in the catalyst intrinsic activity and yield during hydrogenation reactions; this behavior could also be applied to Ni and Pd, which along with Pt are metals capable of accelerating and conducting HDO reactions but with different efficiency. Our results infer that the increasing weight percentage of Ni NPS could produce higher
n-C
17 yield after a short reaction time.
A small portion of the spent catalyst was recovered by filtering and drying treatments. The appearance of the dry catalyst did not change significantly after the reaction and retains a pale blue color, the same as the original catalyst. Hence, these catalysts may have a high degree of resistance to deactivation in HDO reactions under the conditions used in this work.
Table 3 shows a comparison of the
n-C
17 obtained during the hydrodeoxygenation of oleic acid with different catalysts. It clearly shows an increase in the yield of
n-C
17 with the catalyst NAL5, when it was compared to the yield obtained with a similar catalyst [
15]. Additionally, the NAL7 catalyst showed a similar yield with that reported containing 10 wt % of Ni [
34]. These results are promising and confirm that the reaction conditions and the type of agitation of the reactor used in our reaction potentiate the catalytic properties of Ni/γ-Al
2O
3.
n-C
17 yields for NAL5 and NAL7 catalysts are slightly higher than yields shown by Pt (5 wt %), Co (5 wt %), and Ni (5 wt %) supported on γ-Al
2O
3. However, Pt/zeolite 5A beads (1 wt %) and Pd/γ-Al
2O
3 (5 wt %) exhibited higher yields of 81.5% and 72%. Nevertheless, the higher cost of noble metals hinders their use as catalytic phase for industrial-scale processes. A preliminary conclusion can be: NAL7 yield is close to that shown by the granulated activated carbon catalyst [
14], and shows a higher catalyst performance compared to 5 wt % Pt supported on small-pore zeolites [
13].
As an additional approach to analyze NPs’ characteristics and their effect on
n-C
17 production, a regression model was developed to measure the correlations among physical variables and process conditions. Three polynomial models were developed to predict the yield of
n-C
17 based on temperature (
T), reaction time (
t), and any of the three physical variables that complete this statistical study, i.e., Ni wt % (
W), average particle size (
S), and dispersion of Ni nanoparticles (
V), where S and V were calculated statistically from TEM images of the catalyst (
Figure 3). The comparison of these important catalytic parameters (
W,
S, and
V) related to catalytic performance is a major contribution of this paper. Statistical models are based on the polynomial regression methodology and consequently are used to obtain response surface plots. In this work three polynomial models were obtained with different independent variables including the three variables that represent the Ni NP parameters: Model 1A with
T,
t, and
W as variables; Model 1B with
T,
t, and
S as variables; and Model 1C with
T,
t, and
V as variables. Statistical coefficients, Fisher ratio (
F), and
p-value for molar yield of
n-C
17 are shown in
Table 4. Corresponding variables will be significant if the
p-value becomes smaller and the value of
F-ratio is higher than the statistical value of
F (1, 5, 0.05).
Table 4 shows that the values of statistical coefficients
F-ratio and
p-value are equal for the polynomial models, which confirms that the statistical analysis describes and relates an important application of the
W,
S, and
V variables (
Table 2). This statistical study defines a general polynomial regression model to predict the yield of
n-C
17 (see Equation (A.1)). Values of
F-ratio and
p-value as well as predicted equations are shown in the same table.
To get a more suitable regression model that predicts yields of n-C17, a Box–Behnken method has been used wherein independent variables are coded and replaced in Model 1. This encoding process presupposes that interception coefficients (βi), determination coefficients (R2), F-ratio values, and p-values for the three models are equal. To evaluate the goodness of the model fit, an Anova test was run, with the results of the quadratic polynomial model showing that the model adequately described the response surface within the selected range, according to the determination coefficient value of 99.31%.
We must highlight the fact that Ni nanoparticle parameters such as
W,
S, and
V have a high interaction impact with the rest of the other parameters on
n-C
17 yield due to the
p-value being lower than 0.05.
X is the variable representing the
W,
S, and
V, as established above; thus
X and
X2 are the factors representing the significant impact on the
n-C
17 yield. It is noted that while
T,
t, and
T2 are significant, the interaction between parameters
W-
T,
W-
t,
T-
t, and quadratic term t
2 are significant but less important. These results were verified by comparing the values of
F-ratio against the value of
F (1, 5, 0.05) = 6.608.
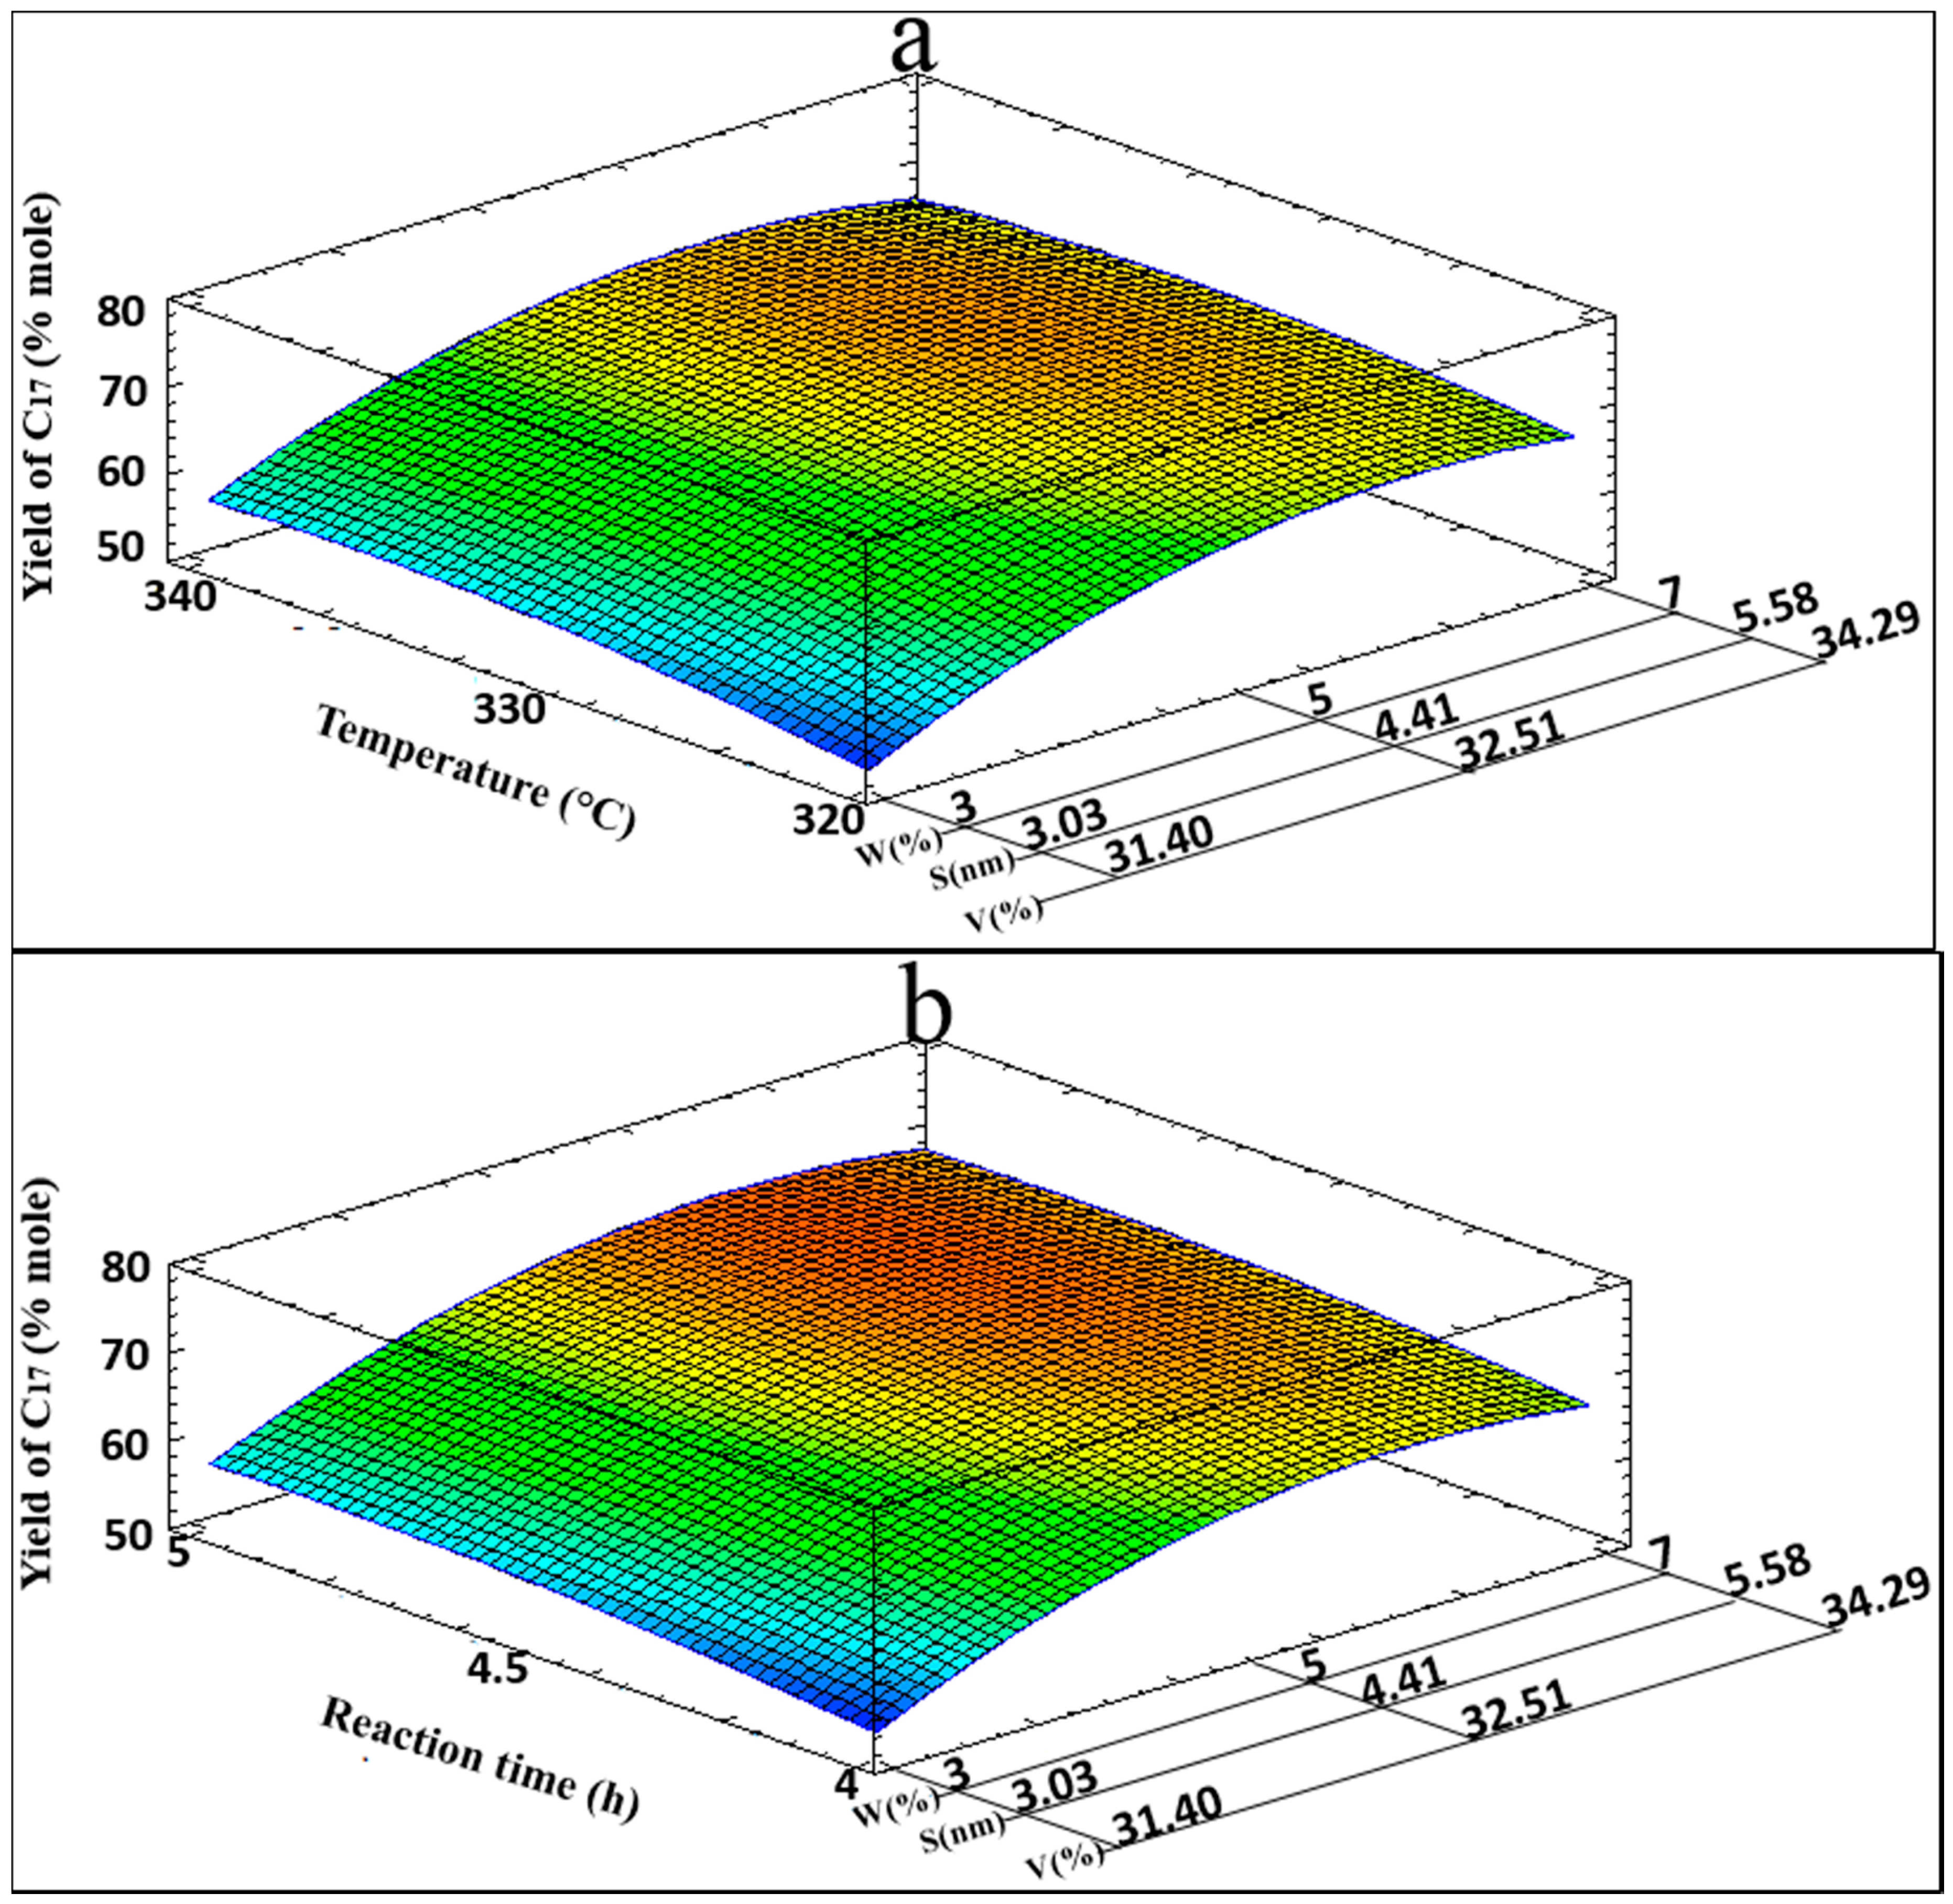
Table 5 shows the combination of factor levels, with a maximum yield of
n-C
17 of 70.89% in the specified region. The 3D response surface for the yield of
n-C
17 is shown in
Figure 6 for the
T,
W,
S, and
V variables (
Figure 6a), and for the
t,
W,
S, and
V variables (
Figure 6b), where optimization zones are visualized.
Table 6 shows the calculated coefficient, Fisher-
F, and
p-value for the yield of
n-C
18 (mol%). The criteria for determining the statistical significance are the same as those used for
n-C
17 yield. In all polynomial models it was observed that values of the determination coefficients
F-ratio and
p-value are equal. This statistical analysis defines the same general polynomial regression model (Equation (1)) used to predict yields of
n-C
18.
Likewise, for predicting n-C17 yield, predictions for n-C18 yields from this polynomial model need to use the coded levels of independent variables in Model 2. This encoding process also presupposes that the interception coefficients (βi), determination coefficients (R2), F-ratio values, and p-values for these three models are equal. From the Anova results of the quadratic polynomial model, we found that the model adequately described the response surface in the chosen range, according to the determination coefficient value of 99.14%.
Table 6 shows all
F-ratio and
p-values for each interaction parameter. Here,
α represents Ni nanoparticle parameters such as W, S ,or V. The values
α and
α2 had the greatest effect, while the effects observed for T-t and T
2-t
2 were less significant. These results are verified by comparing the
F-ratio against the statistical value of
F (1, 5, 0.05) = 6.608.
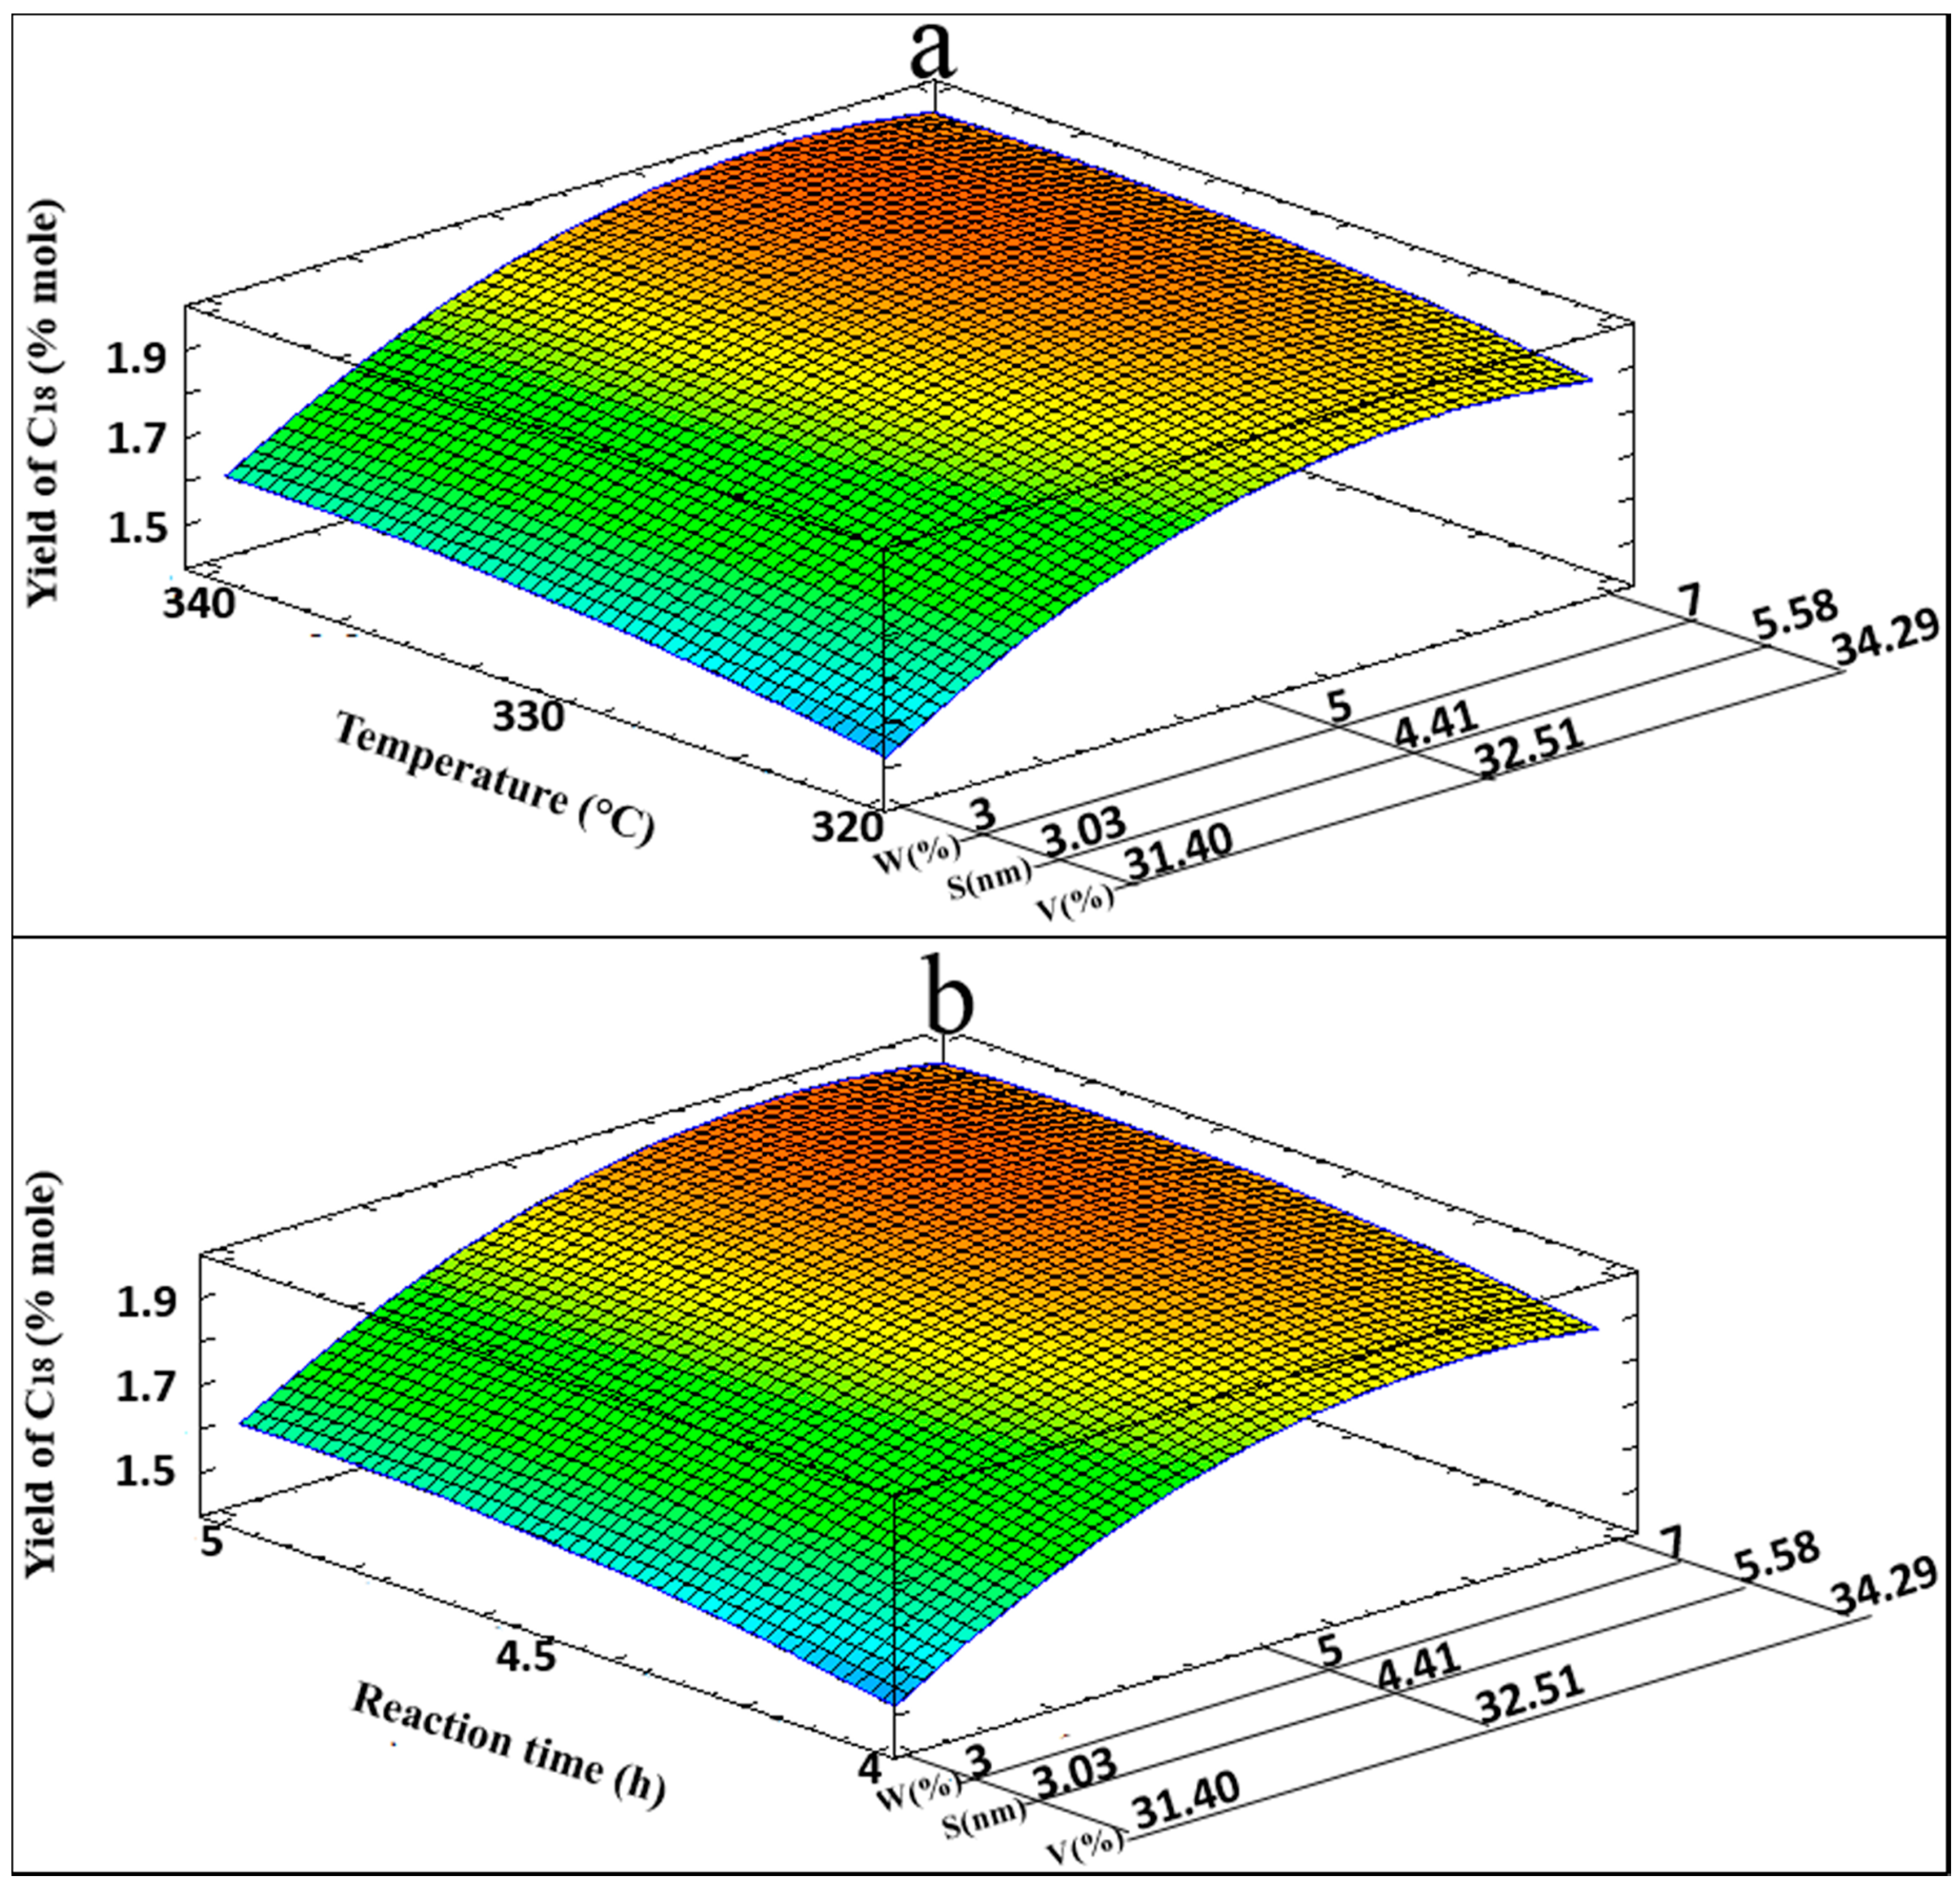
Table 5 shows the combination of factor levels, with the maximum yield of
n-C
18 being 2.002% in the indicated region.
Figure 7 shows the 3D response surface on yields of
n-C
18, for the T, W, S, and V variables (
Figure 7a), and for the t, W, S, and V variables (
Figure 7b), where optimization zones also are visualized.
From the Anova test applied to n-C17 and n-C18 yields, the F value was used to confirm the validity of the proposed models. In both cases values were higher than F (9, 5, 0.05) of 4.772, with F values of 80.29 for n-C17 and 64.26 for n-C18, and R2 values of 0.9931 and 0.9914, respectively. With a high statistical confidence level, the regression models can predict the maximum yields of n-C17 and n-C18. Every experiment was performed by running two replicates and taking the average of both results to develop theoretical models for yields of n-C17 and n-C18. The standard deviation of the experiments was computed to estimate the reproducibility of the catalytic process. Values for the standard deviation were 0.215 and 0.026, respectively. Hence, it may be concluded that the results reproducibility in this catalytic process is good enough.


 ,
, 


