Article

Effects of Catalyst Preparation on Hydrocarbon Product Distribution in Hydrocracking of the Fischer-Tropsch Product with Low Pt-Loaded Catalysts

1
Biomass Treatment Group, Research Institute for Sustainable Chemistry, Department of Materials and Chemistry, National Institute of Advanced Industrial Science and Technology (AIST), 3-11-32 Kagamiyama, Higashihiroshima, Hiroshima 739-0046, Japan
2
Planning Headquarters General Planning Office, National Institute of Advanced Industrial Science and Technology (AIST), 1-3-1 Kasumigaseki, Chiyoda-ku, Tokyo 100-8921, Japan
3
Advanced Heterogeneous Catalysis Team, Interdisciplinary Research Center for Catalytic Chemistry, Department of Materials and Chemistry, National Institute of Advanced Industrial Science and Technology (AIST), 1-1-1 Umezono, Tsukuba, Ibaraki 305-8568, Japan
4
National Institute of Advanced Industrial Science and Technology (AIST), Central 1, 1-1-1 Umezono, Tsukuba, Ibaraki 305-8560, Japan
*
Author to whom correspondence should be addressed.
Catalysts 2015, 5(4), 1983-2000; https://doi.org/10.3390/catal5041983
Submission received: 29 September 2015 / Accepted: 12 November 2015 / Published: 20 November 2015

Abstract

:
For the effective production of hydrocarbon liquid fuel in the hydrocracking of the Fischer-Tropsch (FT) product, the catalytic performance of Pt-loaded catalysts with low Pt content was investigated using an autoclave at 250 °C, an initial H2 pressure of 0.5 MPa, and a reaction time of 1 h. A screening study using Pt-loaded catalysts with a Pt content of 0.1 wt. % indicated that zeolite supports were more favorable for jet fuel (carbon numbers 9–15) production than amorphous oxide supports. The small particle size of the supported Pt particles and the high amount of medium acid sites for the supports led to higher performance of the Pt-loaded zeolite catalysts. In the hydrocracking reaction over Pt catalysts using the zeolite support with the high amount of medium acid sites, the yields of the corresponding jet fuel at 0.02 and 0.1 wt. % were almost the same. Pt-loaded catalysts with a Pt content of 0.02 wt. % were prepared using water-in-oil (w/o) microemulsions and their particle size was controlled between 1.0 and 2.6 nm. While the yield of the corresponding jet fuel was independent of Pt particle size, smaller Pt particles typically promoted the production of lighter hydrocarbons.

Graphical Abstract

1. Introduction

In Japan, the annual demand for transportable liquid fuels is approximately 90 billion liters. Taking the reserve amounts of fossil fuel into account, the utilization of liquid fuel derived from biomass would contribute towards decreasing the consumption of fossil fuels because biomass is the only source of renewable energy that can be converted into liquid fuels (e.g., gasoline, light oil, and jet fuel), and the utilization of biomass-based fuel does not substantially increase the level of CO2 emission.
Among conversion technologies from biomass to liquid fuels, the biomass-to-liquid (BTL) process generally consists of biomass gasification for producing syngas (CO + H2), gas cleaning, Fischer-Tropsch (FT) synthesis, hydrocracking, and distillation. The process has the advantage of utilizing a wider range of feedstocks compared to other conversion technologies since biomass feedstock can be converted into syngas in the gasification step [1]. However, there are no standardized BTL plants in commercial operation anywhere in the world owing to a lack of economic sustainability.
The simulation study of the BTL process by Fujimoto et al. showed that the production of steam as a gasifying agent in the gasification step, compression of cleaned gas, and distillation required the dominant amount of input energy [2]. Therefore, biomass gasification without steam, as well as the enhancement of catalyst performance for FT synthesis and hydrocracking, has been reported previously.
Hydrocracking is one of the most important unit operations responsible for increasing the yield of hydrocarbon liquid fuel. In a petrochemical process, Ni-Mo and Co-Mo catalysts are generally employed because the feedstock has to be hydrocracked in the presence of sulfur compounds. In contrast, for the hydrocracking of clean feedstock derived from woody biomass, noble metals provide suitable active sites for the dehydrogenation/hydrogenation reactions [3]. In the hydrocracking of n-alkanes over Pt catalysts using SiO2-Al2O3 [4,5], sulfated zirconia [6,7,8], tungsta-zirconia [8,9,10,11,12,13], and zeolite [14,15], higher product yields were obtained under mild conditions. Pt is a promising catalytic metal but is extremely costly. Therefore, the amount of Pt employed as a hydrocracking catalyst should be as low as possible in order to enhance the economics of the BTL process.
Leu et al. reported that in the isomerization of n-hexane over Pt/H-β catalysts, the catalytic activity and product selectivity were maximized at a Pt content of 0.3–0.5 wt. % [14]. However, in almost all cases, the catalytic activity and product selectivity decreased drastically when the Pt content was less than 0.5 wt. %. On the contrary, high activity and selectivity were obtained above 0.5 wt. % [6,11]. Thus, it is unclear whether the previously reported synergetic effect between Pt and its support materials is applicable for Pt-loaded catalysts having a lower Pt content.
In the isomerization of naphtha with carbon numbers of 5–10, some studies have reported the use of Pt-loaded catalysts with a Pt content of approximately 0.1 wt. % [16,17,18,19,20,21]. However, the performance of catalysts with low Pt content (i.e., less than 0.1 wt. %) in the hydrocracking of the FT product has not been fully discussed. The authors previously reported the preparation of Pt-loaded catalysts using water-in-oil (w/o) microemulsions and the effect of Pt particle size on hydrocracking reaction [22,23]. This preparation method is advantageous as the size of the supported Pt particles is well controlled, regardless of the Pt content.
In this study, a screening study of support materials was performed using Pt-loaded catalysts with low Pt content. The effects of Pt content, particle size, and ratio between Pt and acid sites were investigated. As products, hydrocarbons with carbon numbers less than 8, 9–15 (i.e., corresponding jet fuel), and greater than 16 were focused on, and the effect of structure of Pt-loaded catalysts with low content on product yield was discussed.

2. Results and Discussion

2.1. Characterization

In the present study, 20 catalysts were used, including 19 catalysts prepared by the impregnation method and the deposition method using w/o microemulsions. The Pt-loaded catalysts prepared by the impregnation method are denoted as I-Pt(X)/support. X (0.01–0.1) represents the Pt content. Those prepared by the deposition method are denoted as D-Pt(A)/support. A represents the Pt complex forming agent. In the latter method, the Pt content was 0.02 wt. %.
Table 1 shows the surface area, pore volume, and average pore diameter of Pt-loaded catalysts. When zeolite supports were used (Entries 6–20), the Brunauer-Emmett-Teller (BET) surface areas were similar to the micropore areas. In contrast, the BET surface areas were similar to the mesopore areas when other supports were used (Entries 1–5). For these catalysts, no reasonable values of micropore areas were obtained by the t method [24]. These results indicated that mesopores were dominant in Entries 1–5, while micropores were dominant in Entries 6–20.
Table 1. Surface area, pore volume, and pore diameter of Pt-loaded catalysts.
CatalystBET Surface Area (m2/g)Total Pore Volume (cm3/g)Average Pore Diameter (nm)Micropore Area (m2/g)Mesopore Area (m2/g)
EntryRemarks
1I-Pt(0.1)/SiAl8.73330.8310.0-368
2I-Pt(0.1)/SiAl(28.6)3990.848.4-453
3I-Pt(0.1)/SiAl(13)5150.675.2-523
4I-Pt(0.1)/SiAl5.54260.444.1-339
5I-Pt(0.1)/S-ZrO21080.197.1-123
6I-Pt(0.1)/FAU1107580.552.9918112
7I-Pt(0.1)/MOR184950.272.264533
8BEA287010.673.8849209
9I-Pt(0.01)/BEA287190.583.2876211
10I-Pt(0.02)/BEA287090.573.2864211
11I-Pt(0.04)/BEA287090.663.7862211
12I-Pt(0.06)/BEA287190.633.5871215
13I-Pt(0.1)/BEA287190.623.4874213
14I-Pt(0.1)/BEA406400.301.983659
15I-Pt(0.1)/BEA41.66030.312.078476
16I-Pt(0.1)/BEA5106080.392.678196
17D-Pt(CTAC)/BEA287230.653.6880211
18D-Pt(TPAB)/BEA287270.623.4884209
19D-Pt(TEAC)/BEA287310.734.0887213
20D-Pt(HTAB)/BEA287400.673.6894214
The surface area, pore volume, and pore diameter of catalysts prepared using w/o microemulsions (Entries 17–20) were similar to those of impregnated catalysts using BEA28 (Entries 8–13). These properties were independent of the catalyst preparation methods when the same support was employed. BEA28 (Entry 8) was obtained from a calcination process performed at 500 °C for 2 h. The preparation procedure of the Pt-loaded BEA28 catalysts, by either the impregnation or deposition methods, did not significantly affect the structure of the BEA28 support. The Pt-loaded zeolite catalysts in Entries 8–13, and 17–20 had larger average pore diameters and mesopore areas compared to other zeolite catalysts (Entries 6, 7, and 14–16).
Table 2 shows the results of temperature-programmed desorption of ammonia (NH3-TPD) of Pt-loaded catalysts. The NH3-TPD analysis is generally employed to estimate the strength and amount of acid sites. NH3 molecules are likely to be desorbed from acid sites at higher temperatures when the adsorbed NH3 molecules interact with acid sites more strongly. Therefore, the acid amount and acidity can be estimated from the amount of desorbed NH3 molecules and desorption temperature. In the present study, the acid sites from which the NH3 molecules were released, in the temperature range from 100 to 250 °C, were regarded as weak acid sites. Meanwhile, those from which the NH3 molecules were released, in the range of 250–450 °C and 450–800 °C, were regarded as medium and strong acid sites, respectively. The total amount of NH3 molecules desorbed from 100 to 800 °C was regarded as the acid amount.
Table 2. Acid amounts of Pt-loaded catalysts.
CatalystAcid Amount a (mmol/g)Weak b (mmol/g)Medium c (mmol/g)Strong d (mmol/g)
EntryRemarks
1I-Pt(0.1)/SiAl8.70.430.190.150.09
2I-Pt(0.1)/SiAl(28.6)0.800.300.220.28
3I-Pt(0.1)/SiAl(13)0.700.270.230.20
4I-Pt(0.1)/SiAl5.50.560.250.200.11
5I-Pt(0.1)/S-ZrO20.630.160.180.30
6I-Pt(0.1)/FAU1100.130.050.050.03
7I-Pt(0.1)/MOR181.180.680.220.28
8BEA281.370.650.670.04
9I-Pt(0.01)/BEA281.380.680.630.07
10I-Pt(0.02)/BEA281.350.700.610.05
11I-Pt(0.04)/BEA281.410.700.640.07
12I-Pt(0.06)/BEA281.360.660.640.06
13I-Pt(0.1)/BEA281.320.620.610.08
14I-Pt(0.1)/BEA401.080.520.500.06
15I-Pt(0.1)/BEA41.60.770.340.340.09
16I-Pt(0.1)/BEA5100.140.030.030.08
17D-Pt(CTAC)/BEA281.460.700.700.06
18D-Pt(TPAB)/BEA281.380.670.650.06
19D-Pt(TEAC)/BEA281.380.690.640.05
20D-Pt(HTAB)/BEA281.440.710.670.06
a Calculated by assuming 1:1 stoichiometry for the amounts of NH3 and acid; b The acid sites where NH3 desorbed from 100 to 250 °C; c The acid sites where NH3 desorbed from 250 to 450 °C; d The acid sites where NH3 desorbed from 450 to 800 °C.
The acid amount was largely dependent on the type of catalysts. When MOR18, BEA28, and BEA40 were employed as support materials (Entries 7–14 and 17–20), the acid amounts were more than 1.00 mmol/g, exceeding those of other support materials. In particular, the Pt-loaded BEA28 (Entries 8–13 and 17–20) had the highest acid amount. Similar to the pore structure for these catalysts in Table 1, the acid amount and acidity were independent of the Pt content and catalyst preparation methods.

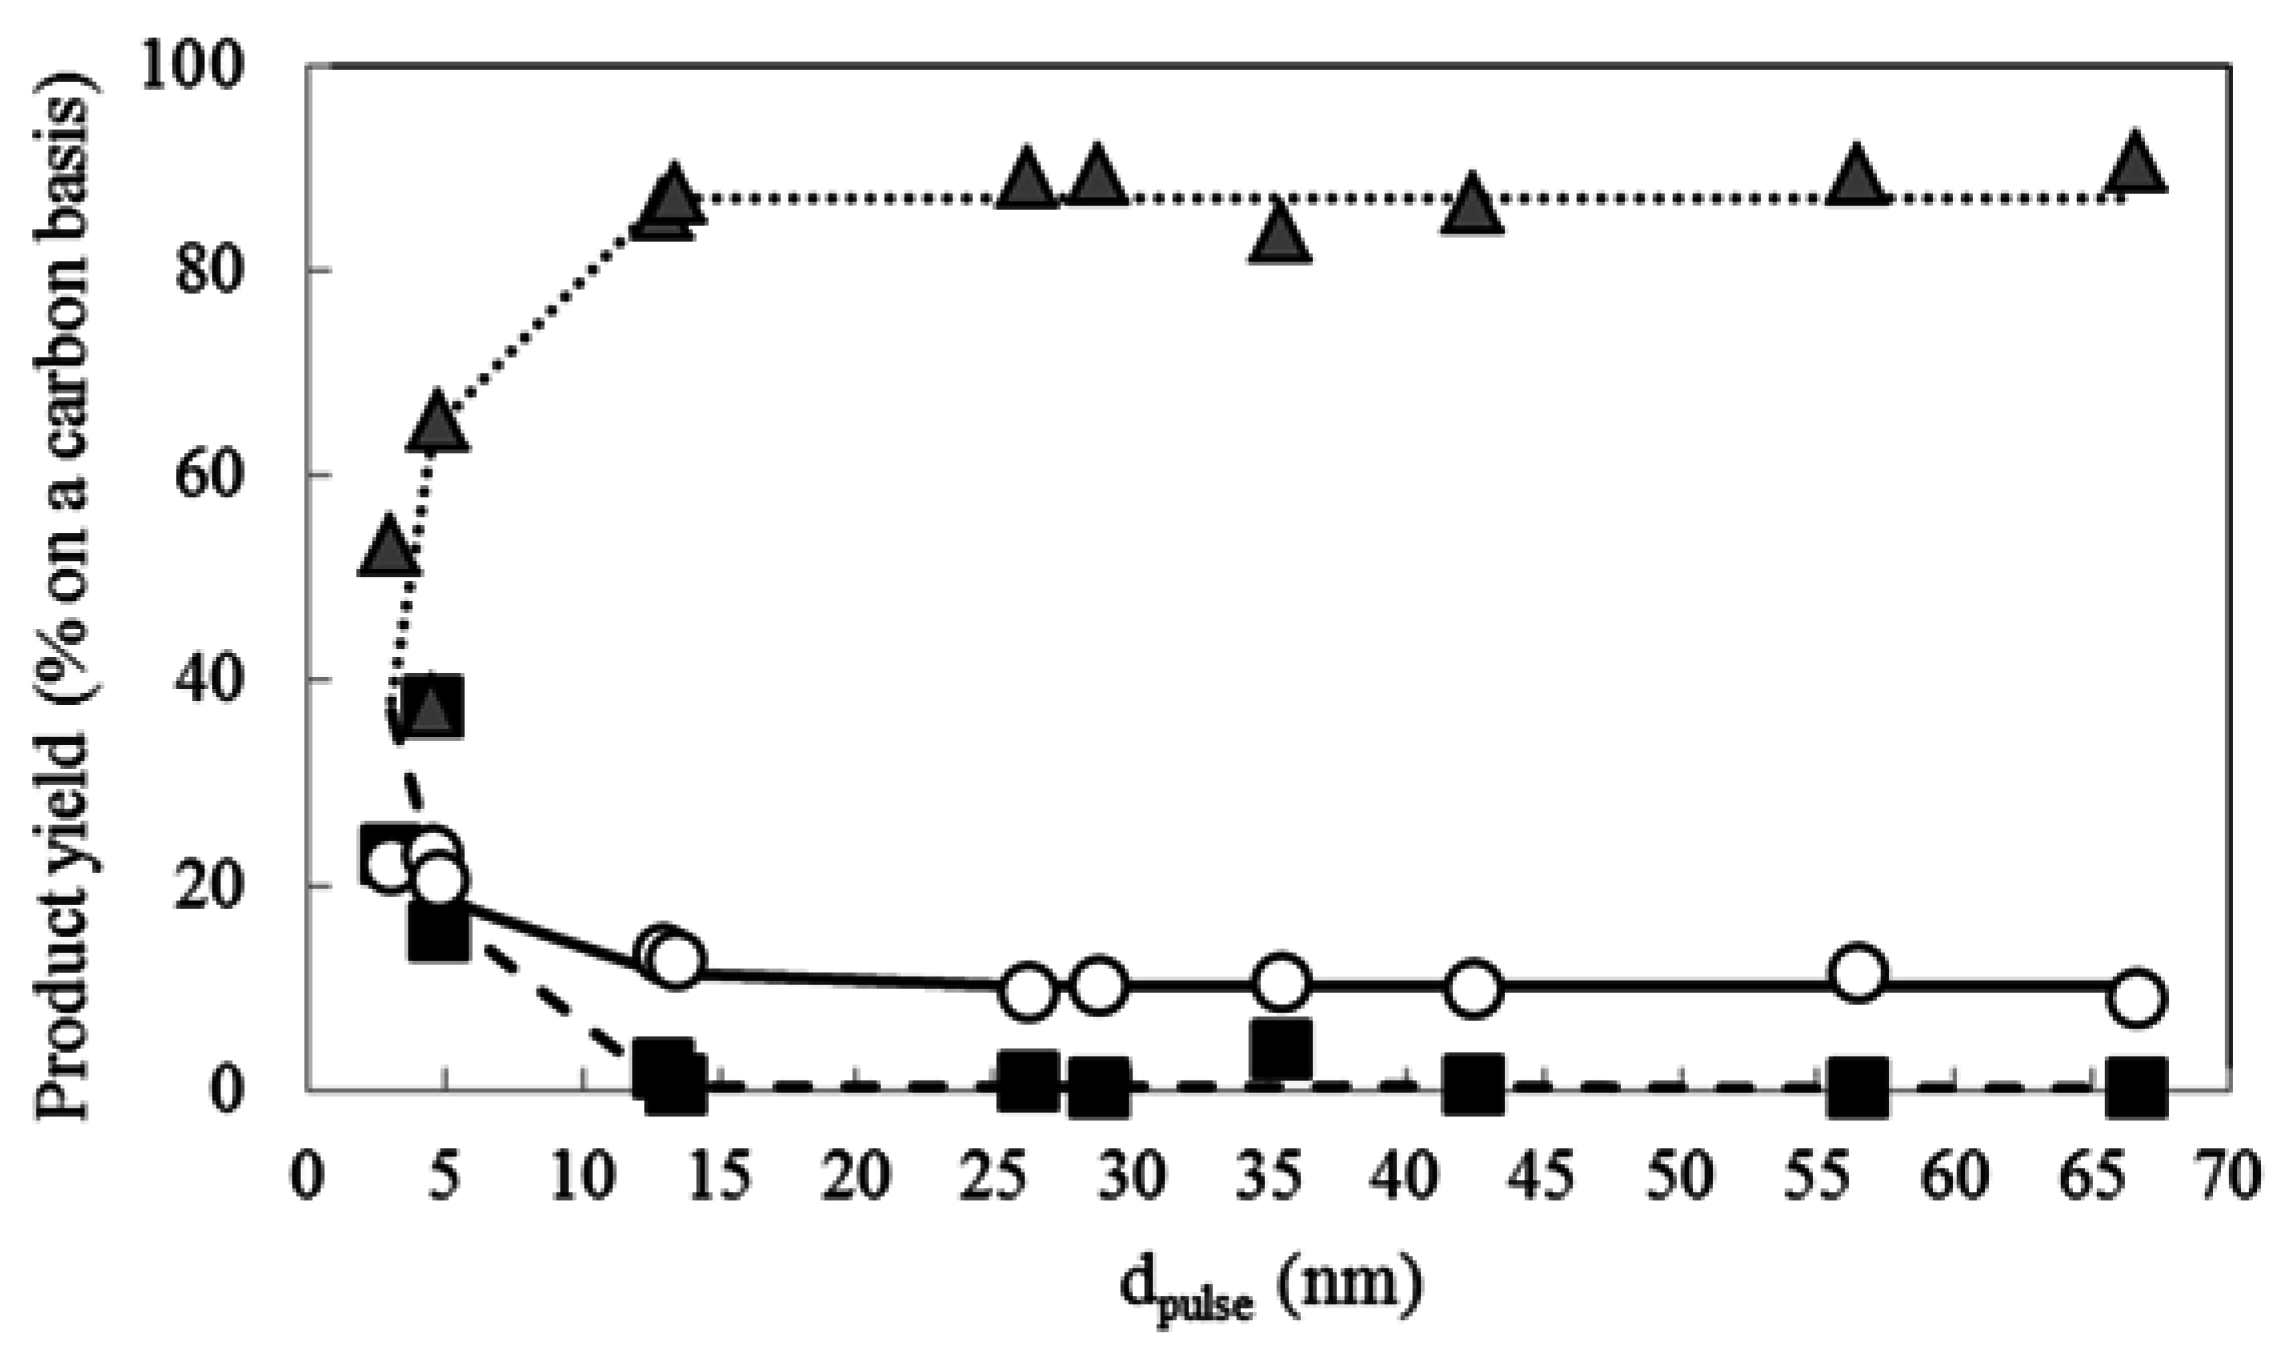
2.2. Screening of the Hydrocracking Reaction

Firstly, a screening study using Pt-loaded catalysts with the same content but different support materials was performed to investigate how different factors associated with Pt-loaded catalysts with low Pt content affect the product yield. Table 3 shows the analyses of the FT product as a feedstock of hydrocracking. The feedstock contained hydrocarbons with carbon numbers 5–56. Meanwhile, Table 4 shows the hydrocracking behavior of the FT product over Pt-loaded catalysts employed in this study. The product yields for hydrocarbons with carbon numbers 1–8, 9–15, and greater than 16 were denoted as YC1–C8, YC9–C15, and YC16+, respectively. The reaction temperature and initial H2 pressure were set at 250 °C and 0.5 MPa, respectively, with a reaction time of 1 h. The reactor temperature was maintained at 250 ± 6 °C in all experimental runs.
Table 3. Analyses of the FT product as a feedstock of hydrocracking.
Content/% on a Carbon BasisElemental Analysis/wt %
C5–C8C9–C15 aC16 bC17+CHNSO c
0.19.761.728.584.414.80.00.00.8
a Corresponding jet fuel; b Mixture of product obtained in the FT synthesis and solvent charged at the initial stage of the FT synthesis; c By difference.
Table 4. Hydrocracking reaction over Pt-loaded catalysts and Pt particle size by CO chemisorption.
CatalystProduct Yield/% on a Carbon Basisdpulse (nm)
EntryRemarksYC1–C8YC9–C15YC16+Loss
1I-Pt(0.1)/SiAl8.70.810.286.62.542.5
2I-Pt(0.1)/SiAl(28.6)0.311.589.2−1.056.5
3I-Pt(0.1)/SiAl(13)0.29.290.60.066.6
4I-Pt(0.1)/SiAl5.50.210.389.20.228.8
5I-Pt(0.1)/S-ZrO20.812.987.3−1.013.4
6I-Pt(0.1)/FAU1101.09.889.00.226.3
7I-Pt(0.1)/MOR182.313.385.8−1.413.0
8BEA2819.420.758.51.4-
9I-Pt(0.01)/BEA2824.122.454.2−0.71.8
10I-Pt(0.02)/BEA2826.523.947.91.71.9
11I-Pt(0.04)/BEA2828.024.044.33.72.3
12I-Pt(0.06)/BEA2830.924.742.22.23.5
13I-Pt(0.1)/BEA2837.423.137.52.04.6
14I-Pt(0.1)/BEA4023.122.153.21.63.1
15I-Pt(0.1)/BEA41.615.720.665.1−1.44.8
16I-Pt(0.1)/BEA5104.210.683.81.435.4
17D-Pt(CTAC)/BEA2829.221.546.52.82.6
18D-Pt(TPAB)/BEA2827.523.948.60.02.0
19D-Pt(TEAC)/BEA2825.122.647.94.42.3
20D-Pt(HTAB)/BEA2827.422.747.52.41.0
21None0.89.490.9−1.0-
In all experimental runs, the mass balance on a carbon basis was almost 100%; therefore, the loss was only −1.4%–4.4% (Table 4). The individual product yield was largely dependent on the type of Pt catalysts.
Firstly, the effect of the support material on the hydrocracking reaction was investigated using impregnated catalysts, which had a Pt content of 0.1 wt. % (Entries 1–7 and 13–16). I-Pt(0.1)/BEA28, I-Pt(0.1)/BEA40, and I-Pt(0.1)/BEA41.6 (Entries 13–15) exhibited higher YC9–C15 values (20.6%–23.1%) compared to those of other catalysts. In contrast, the product yields obtained in Entries 1–6 were almost the same as the run without a catalyst (Entry 21) and the feedstock composition, as shown in Table 3. Accordingly, the zeolite supports were promising for jet fuel production while the amorphous oxide supports hardly contributed to the hydrocracking of the FT product.
Figure 1 shows the effect of the amount of medium acid site on the individual product yield in the hydrocracking reaction (Entries 1–7 and 13–16 in Table 2 and Table 4, respectively). Increasing the amount of medium acid site led to an increase in YC1–C8 and YC9–C15 but a decrease of YC16+. The correlation factors associated with YC1–C8, YC9–C15, and YC16+ (denoted as R) were 0.898, 0.895, and −0.903, respectively. The R values linked to the acid, weak acid, and strong acid amounts are not shown; but the R values associated with YC1–C8 and YC9–C15 in Figure 1 were closer to 1, while the value with YC16+ was closer to −1, when compared to other values. These results indicated that there was a strong positive correlation between the amount of medium acid site and product yields for YC1–C8 and YC9–C15, but a strong negative correlation for YC16+. Moreover, the observations also suggested that other factors, in addition to the medium acid amount, influence the product yield.
Figure 1. Relationship between acid amount and product yield in the hydrocracking reaction over Pt-loaded catalysts. Entries 1–7 and 13–16 in Table 4, Pt content: 0.1 wt. %, ■: YC1–C8; ○: YC9–C15; ▲: YC16+.
Catalysts 05 01983 g001
Table 4 also shows the Pt particle size by CO chemisorption (denoted as dpulse) and Figure 2 shows the effect of the dpulse value on the product yield. The Pt catalysts shown in the figure were prepared by the impregnation method. Therefore, the size distribution of the supported Pt particles would not be narrow. However, the dpulse value could be regarded as the average particle size. When the dpulse value increased to approximately 13 nm, YC1–C8 and YC9–C15 decreased while YC16+ increased. These product yields remained almost constant at dpulse values of more than 13 nm. The dpulse values of I-Pt(0.1)/BEA28, I-Pt(0.1)/BEA40, and I-Pt(0.1)/BEA41.6 were 4.6, 3.1, and 4.8 nm, respectively, and they were smaller compared to other catalysts (Table 4). I-Pt(0.1)/MOR18, I-Pt(0.1)/BEA28, and I-Pt(0.1)/BEA40 had higher acid amounts (>1.08 mmol/g, Table 2) and the dpulse value of I-Pt(0.1)/MOR18 (13.0 nm, Table 4) was relatively large compared to the other two catalysts. Although the support materials were largely different, these results are consistent with the trends shown in Figure 1 and Figure 2. Based on the hydrocracking results afforded by I-Pt(0.1)/BEA28, a small Pt particle size and high medium acid amount would be conducive toward improving the catalyst performance.
Figure 2. Effect of dpulse on product yield in the hydrocracking reaction over Pt-loaded catalysts. Entries 1–7 and 13–16 in Table 4, Pt content: 0.1 wt. %, ■: YC1–C8; ○: YC9–C15; ▲: YC16+.
Catalysts 05 01983 g002

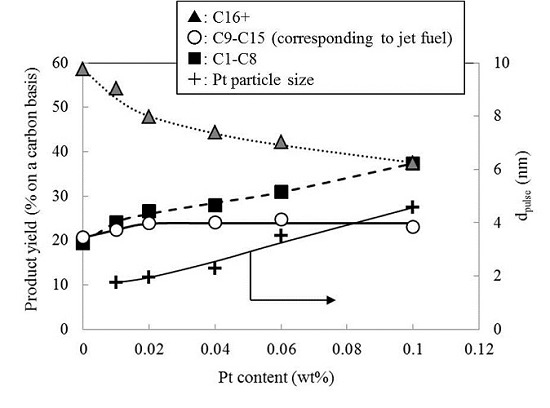
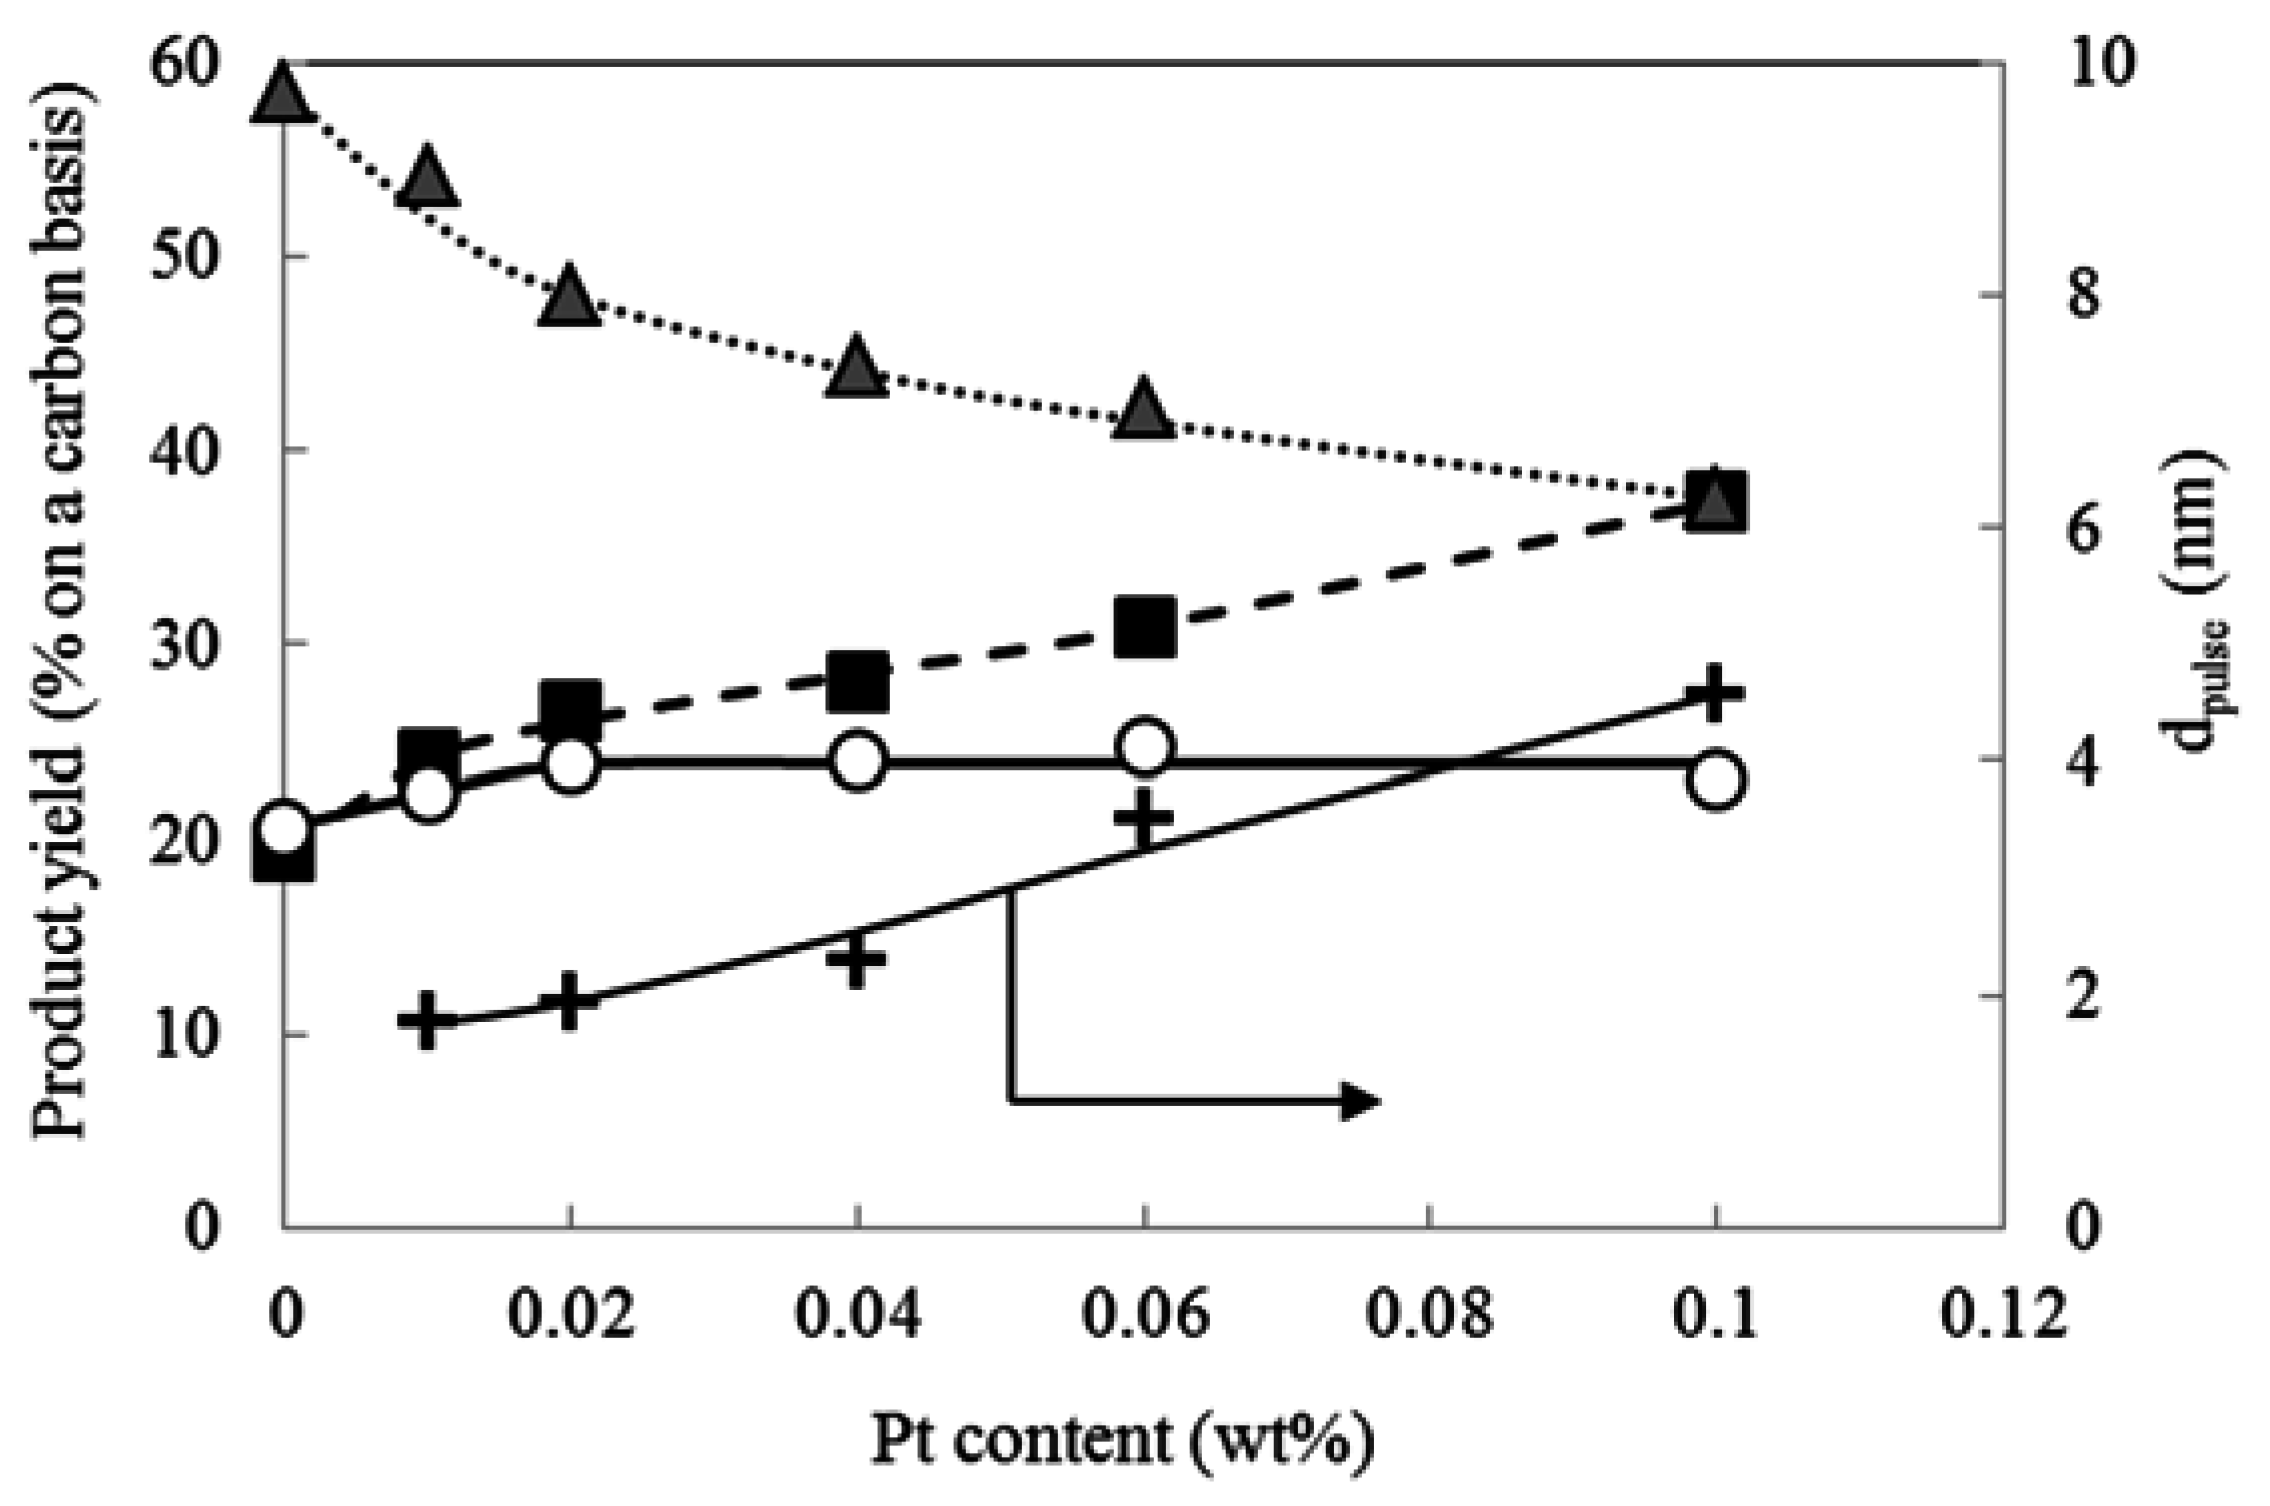
2.3. Effect of Pt Content on the Hydrocracking Reaction over Pt-Loaded BEA28 Catalysts

In the previous section, BEA28 was established as a promising support. Therefore, it was used to study the catalytic performance of Pt-loaded catalysts with low Pt content. Figure 3 shows the effect of Pt content (0–0.1 wt. %) on the hydrocracking reaction over impregnated Pt-loaded BEA28 catalysts (Entries 8–13 in Table 4). The dpulse values are also shown in Figure 3.
Figure 3. Effect of Pt content on the hydrocracking reaction over Pt-loaded BEA28 catalysts prepared by the impregnation method. Entries 8–13 in Table 4, Pt content: 0–0.1 wt. %, ■: YC1–C8; ○: YC9–C15; ▲: YC16+; +: dpulse.
Catalysts 05 01983 g003
The dpulse value steadily increased to 4.6 nm as the Pt content reached 0.1 wt. %. This is a general trend for impregnated catalysts. With an increase of the Pt content (i.e., with increasing Pt particle size), YC1–C8 increased from 19.4% to 37.4%, whereas YC16+ decreased from 58.5% to 37.5%. In contrast, YC9–C15 increased to 23.9% against a Pt content of 0.02 wt. % and remained almost constant thereafter. At a Pt content of 0.02 wt. %, the yield of the corresponding jet fuel was almost the same as that for 0.1 wt. % Pt content.
Batalha et al. have previously reported a quantified understanding of metal-acid balance involving hydrocracking catalysts. The turn over frequency increased with the ratio of accessible Pt sites (CPt) to acid sites (CA), i.e., up to 0.03 and the value remained constant in the range of 0.03 to 0.1 [25]. In the present study, the amount of medium acid site affected the product yield (Figure 1). Figure 5 shows the effect of the ratio of accessible Pt sites to the amount of medium acid site (denoted by CPt/CMA) on the hydrocracking reaction. The relationship between dpulse and CPt is as follows [23]:
d pulse = 5.808 × 10 5 × W C Pt
where W (wt. %) is Pt content and CPt (mol/g) is the amount of adsorbed CO per gram of catalyst. The CMA (mol/g) was used in Table 2.
The trend in Figure 4 is similar to that in Figure 3. The correlation factors associated with YC1–C8 and YC16+ were 0.891 and 0.976, respectively, while that with YC9–C15 was 0.419. These results indicated that there was a strong positive correlation between the CPt/CMA and product yields for YC1–C8 and YC16+, but a weak correlation for YC9–C15. In a study about acid-metal balance of a hydrocracking catalyst by Thybaut et al., non-ideal cracking would be favored for higher carbon numbers of feedstock in the range of 8 to 16 [26]. In this case, the kinetic effect became larger than the thermodynamic effect. The feedstock in the present study contained hydrocarbons with carbon numbers of 5 to 56. Therefore, the kinetic effect would affect the product yield.
Figure 4. Effect of CPt/CMA on the hydrocracking reaction over Pt-loaded BEA28 catalysts prepared by the impregnation method. Entries 9–13 in Table 4, Pt content: 0.01–0.1 wt. %, ■: YC1–C8; ○: YC9–C15; ▲: YC16+.
Catalysts 05 01983 g004
Here, the CPt/CMA values (0.0005–0.002) were much smaller compared to those (i.e., 0.03–0.1) listed in Ref. [25], indicating that a high jet fuel yield needed a larger CPt/CMA ratio. To obtain a desirable cracking of longer chains, the enhancement of the cracking rate was required. The higher yield of the corresponding jet fuel was obtained at such a high CPt/CMA ratio because the turn over frequency of the cracking rate associated with the medium acid sites would increase.
Hydrocarbons with carbon numbers of 9–15 are intermediates during the hydrocracking of longer chain hydrocarbons. With a large CPt/CMA value, the production of lighter hydrocarbons was favored because of a higher cracking rate. As shown in Figure 3, at more than 0.02 wt. %, an increase in Pt sites would promote hydrogenation/dehydrogenation reactions, followed by a decrease in YC16+, and an increase in YC1–C8. In this case, increasing the Pt content had a positive effect on both the Pt particle size as well as the amount of Pt particles. Therefore, these results suggested that there were distinct optimum values of Pt content and particle size for producing the corresponding jet fuel in the hydrocracking reaction over Pt-loaded catalysts. Moreover, an optimum Pt particle density was also anticipated, as reported in a previous study [27]. Therefore, the effect of Pt particle size on the individual product yield was investigated using Pt-loaded BEA28 catalysts with a Pt content of 0.02 wt. %.

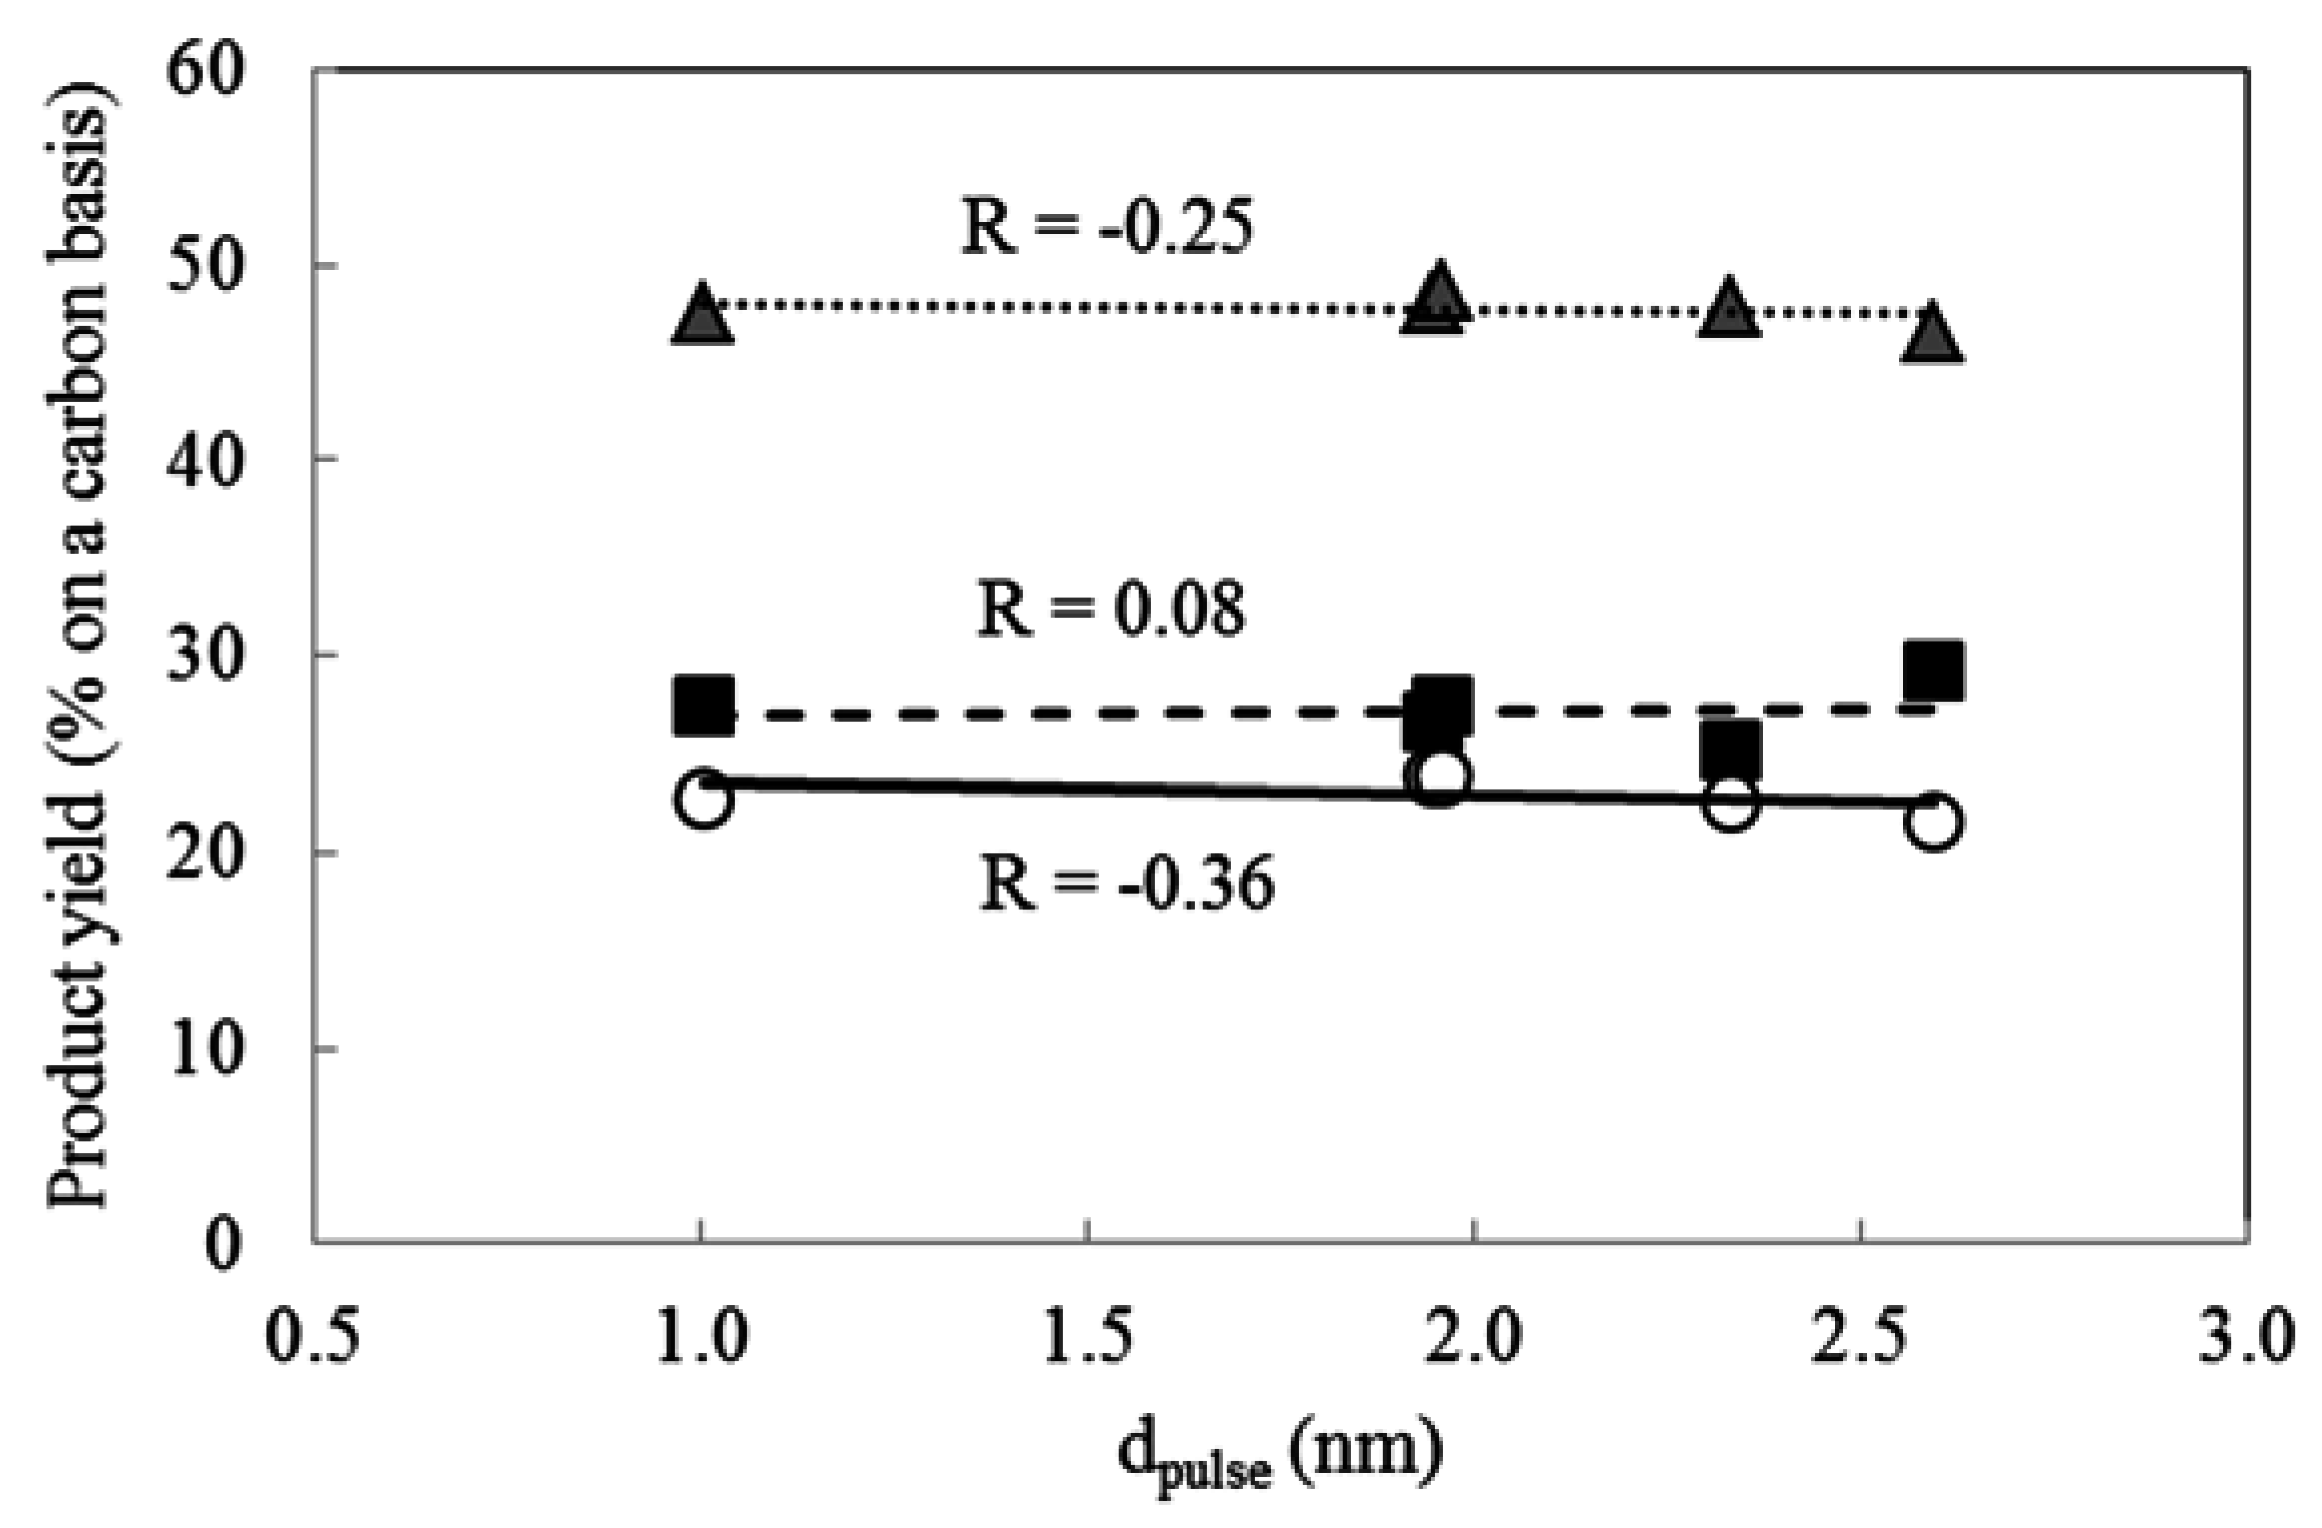
2.4. Effect of Pt Particle Size on the Hydrocracking Reaction over Pt-Loaded Catalysts with Low Pt Content

Table 5 shows the dpulse values of Pt-loaded BEA28 catalysts prepared using w/o microemulsions. The Pt-complex forming agent and the type of Pt complex synthesized in microemulsion [28] are also shown. The dpulse value was dependent on the type of Pt complex forming agents and varied in the range of 1.0–2.6 nm. The value increased in the order of tetraethylammonium chloride (denoted as TEAC) < tetrapropylammonium bromide (denoted as TPAB) < hexyltrimethylammonium bromide (denoted as HTAB) < cetyltrimethylammonium chloride (denoted as CTAC), as forming agents. Results in Table 1 indicated that Pt-loaded BEA28 catalysts (Entries 8–13 and 17–20) had larger average pore diameters and mesopore areas compared to those of the Pt-loaded BEA41.6 (Entry 15). This suggested that the smaller size of the Pt complex particles synthesized in the liquid phase promotes particle diffusion into the mesopore of the BEA28 support.
Table 5. Pt particles synthesized in w/o microemulsions and their dpulse values.
CatalystPt Complex Forming AgentPt Particle Typedpulse (nm)
NameRational FormulaNameRational Formula
D-Pt(CATC)/BEA28CTACC16H33(CH3)3N+Cl(CTA)2PtCl6[C16H33(CH3)3N]2PtCl62.6
D-Pt(TPAB)/BEA28HTABC6H13(CH3)3N+Cl(HTA)2PtCl6[C6H13(CH3)3N]2PtCl62.0
D-Pt(TEAC)/BEA28TPAB(C3H7)4N+Br(TPA)2PtCl6[(C3H7)4N]2PtCl62.3
D-Pt(HTAB)/BEA28TEAC(C2H5)4N+Cl(TEA)2PtCl6[(C2H5)4N]2PtCl61.0
The CTAC molecule has a larger hydrophobic volume (C16H33– and (CH3)3–) compared to the TEAC molecule ((C2H5)4–). Therefore, the occupied volume of (TEA)2PtCl6 would be smaller compared to (CTA)2PtCl6. In addition, the HTAB molecule has a longer hydrophobic group (C6H13–) than the TPAB molecule. The carbon numbers associated with the hydrophobic group of HTAB (=9) are smaller than that of TPAB (=12). However, the chain of the hydrophobic group (C6H13–) might fold up to form a smaller occupied volume of (HTA)2PtCl6 particles compared to the (TPA)2PtCl6 particles. When the forming agents had a smaller hydrophobic occupied volume, smaller complex particles were more likely to diffuse into the mesopores of the support. As a result, the aggregation of complex particles was inhibited owing to the deposition of the smaller particles on the BEA28 support after calcination and reduction.
Figure 5 shows the effect of dpulse value on product yield in the hydrocracking reaction over Pt-loaded BEA28 catalysts with a Pt content of 0.02 wt. %. The product yields of the impregnated catalyst (Entry 10) are also shown in Figure 5. I-Pt(0.02)/BEA28 and D-Pt(TPAB)/BEA28 had a similar particle size (Table 4), resulting in comparable product yields. With a Pt content of 0.2 wt. %, the size distribution of Pt particles obtained by the impregnation method was broader compared to that afforded by the deposition method using w/o microemulsions [27]. In the present study, the Pt content was 0.02 wt. %. For the impregnation method, the dried precursor was calcined to aggregate the Pt oxide particles. With a very low Pt content, the distance between the Pt oxide particles would be further apart. Therefore, the inhibition of particle aggregation during the calcination process would lead to the formation of small particles, with a relatively narrow size distribution.
The correlation coefficient between the dpulse value and the respective product yield was −0.36–0.08, indicating a lack of correlation between the two variables. In the dpulse range of 1.0–2.6 nm, YC1–C8 was higher than YC9–C15. These results were similar to those of the Pt-loaded catalysts with a size of less than 4.6 nm (Table 4 and Figure 2). The product yield was independent of the CPt/CMA value in the range of 0.0005 to 0.0018 (not shown in figure). These results suggested that the cracking reaction was dominant compared to the dehydrogenation/hydrogenation reaction on the Pt sites (within the specified particle range), leading to an excessive cracking reaction.
Figure 5. Effect of dpulse on product yield in the hydrocracking reaction over Pt-loaded BEA28 catalysts. Entries 10 and 17–20, Pt content: 0.02 wt. %, ■ YC1–C8; ○: YC9–C15; ▲: YC16+.
Catalysts 05 01983 g005
We previously reported that a high jet fuel yield was obtained using a Pt particle size of 7.6 nm; in contrast, decreasing the Pt particle size to 2.3 nm increased YC1–C8, whose values exceeded those of YC9–C15 [22]. Supported Pt particles consist of atoms at different positions, namely the plane, edge, and corner. The ratio of the number of Pt atoms contributing to each position to those contributing only to the surface of a Pt particle was dependent on the particle size [29]. For the hydrocracking of 2-methylpentane, it was suggested that the Pt(111) terrace was the least reactive while the Pt(119) site was the most active cracking surface among the four types of Pt single-crystal surfaces ((111), (557), (119), and (311)) [30]. Increasing the Pt particle size to 6 nm, the ratio of Pt atoms for plane to those for surface increased rapidly, with the effect gradually leveling off as Pt particle size exceeds 6 nm [22]. In this study, when the particle size was less than 2.6 nm, the ratio of Pt atoms consisting of planes to the total Pt atoms was very low. Increasing the Pt particle size to 2.6 nm, the excess cracking reaction was inhibited by a decrease in the Pt sites, which contributes to the edge position such as Pt(119). Therefore, YC9–C15 was lower than YC1–C8.
However, it was unclear as to why the product yield was independent of the dpulse value. The critical size above which the band structure appears is about 2 nm [31]. In the present study, the Pt-Pt bond responsible for the formation of the supported Pt particles might be affected by the interaction between particle defects and the surface of the zeolite support, followed by an inhibition of the Pt bulk’s catalytic activity. Alternatively, the small particles would be likely to be sintered. Therefore, the product yields were independent of the initial Pt particle sizes because the sintering would proceed to form Pt particles with a similar size during the reaction.
In this study, the utilization of support material with a high amount of medium acid sites contributed to an increase in the yield of the corresponding jet fuel by 14% when the Pt content was very low, compared to Pt-loaded amorphous support materials and feedstock. The screening study suggested that a smaller Pt particle size would increase the yield. The dpulse value was controlled in the range of 1.0–2.6 nm, with a Pt content of 0.02 wt. %. Controlling the size within this range led to an increase of YC9–C15 by only 3%, while it favored the increase in the yield of lighter hydrocarbons, as shown in Table 4 and Figure 3. This suggests that it is very important to control the supported Pt particle size and we believe that the precise control of the Pt particle size (i.e., more than 2.6 nm) contributes to the enhancement of corresponding jet fuel yield.

3. Experimental Section

3.1. Catalyst Preparation

Pt-loaded catalysts employed in the present study were prepared by the impregnation method and the deposition method using w/o microemulsions. A total of 11 types of supports were employed. Four types of silica-alumina: SiO2-Al2O3 308 (Si/Al = 8.7, Fuji Silysia Chemical, Aichi, Japan, denoted as SiAl8.7), JRC-SAH-1 (28.6% Al2O3, JGC Catalysts and Chemicals, Kanagawa, Japan, denoted as SiAl(28.6)), JRC-SAL-3 (13% Al2O3, JGC Catalysts and Chemicals, Kanagawa, Japan, denoted as SiAl(13)), and JRC-SAL-4 (Si/Al = 5.5, JGC Catalysts and Chemicals, Kanagawa, Japan, denoted as SiAl5.5); an amorphous metal oxide: sulfated zirconia (Wako Pure Chemical Industries, Osaka, Japan, denoted as S-ZrO2); four β-type zeolites: HSZ-930NHA (SiO2/Al2O3 = 28, Tosoh, Tokyo, Japan, denoted as BEA28), HSZ-940NHA (SiO2/Al2O3=40, Tosoh, Tokyo, Japan, denoted as BEA40), HSZ-940HOA (SiO2/Al2O3 = 41.6, Tosoh, Tokyo, Japan, denoted as BEA41.6), and HSZ-980HOA (SiO2/Al2O3 = 510, Tosoh, Tokyo, Japan, denoted as BEA510); a mordenite-type zeolite: HSZ-640HOA (SiO2/Al2O3 = 18, Tosoh, Tokyo, Japan, denoted as MOR18); and a Y-type zeolite: HSZ-385HUA (SiO2/Al2O3 = 110, Tosoh, Tokyo, Japan, denoted as FAU110).
The impregnation method is described as follows. The support powder was first immersed in an aqueous solution of H2PtCl6·6H2O (Kishida Chemical Co., Osaka, Japan) and then dried at 105 °C overnight in an oven. The dried precursors were calcined in air at 500 °C for 2 h in a muffle furnace, and subsequently reduced with H2 (99.999%, 50 mL/min) at 400 °C for 30 min to obtain the impregnated catalysts (I-Pt(X)/support, where X is the Pt content in wt. %). The Pt content was in the range of 0.01–0.1 wt. %.
The deposition method, carried out according to literature procedures, is described as follows [22,23]. The Pt complex particles were synthesized in the liquid phase and then immobilized onto support materials. The complex particle synthesis and immobilization were performed at 45 °C. Polyoxyethylene (n = 5.5) cetyl ether (Union 67-55R; New Japan Chemical Co., Osaka, Japan, denoted as CE-5.5) was used as a surfactant, whereas the solvent of choice was n-hexadecane (Tokyo Chemical Industry Co., Tokyo, Japan). A microemulsion consisting of CE-5.5/n-hexadecane/aqueous solution of H2PtCl6 (0.019 mol/L) was denoted as ME-A (50 mL), whereas ME-B (50 mL) referred to a microemulsion consisting of CE-5.5/n-hexadecane/aqueous solution of a Pt complex-forming agent (0.32 mol/L).
Four types of Pt complex-forming agents were used: tetraethylammonium chloride (Wako Pure Chemical Industries, Osaka, Japan), tetrapropylammonium bromide (Wako Pure Chemical Industries, Osaka, Japan), hexyltrimethylammonium bromide (Tokyo Chemical Industry Co., Tokyo, Japan), and hexadecyltrimethylammonium chloride (Wako Pure Chemical Industries, Osaka, Japan).
The Pt complex particles were synthesized in the liquid phase by mixing ME-A and ME-B. The molar ratio of water to surfactant was six, and the molar ratio of the Pt complex-forming agent to Pt was 10. The particles were synthesized with stirring for 10 min. An ammonia solution (28%, Nacalai Tesque Inc., Kyoto, Japan, 2 mL), ethanol (10 mL), and BEA28 powder (39 g) were added to the solution, and the Pt complex particles were gradually deposited onto the zeolite support with vigorous stirring for 10 min. Next, the liquid-solid mixture was centrifuged at 3000 rpm for 10 min, followed by a separation of the precipitate from the transparent liquid. The precipitate was dried at 105 °C in an oven. The dried precursors were calcined in the muffle furnace at 500 °C for 1 h. After cooling down to room temperature, the calcined precursors were stirred to obtain uniformity, and re-calcined at 500 °C for an additional 1 h. The calcined precursors were reduced with H2 (99.999%, 50 mL/min) at 400 °C for 30 min to obtain the deposited catalysts (D-Pt(A)/BEA28, where A is the Pt-complex forming agent). The Pt content of the catalysts was 0.02 wt. %.

3.2. Characterization

The specific surface area, pore volume, and average pore diameter were estimated by an automatic specific area/pore size distribution measurement system (BELSORP-mini; MicrotracBEL Co., Osaka, Japan). The N2 adsorption-desorption isotherm at −196 °C was measured under the relative pressures of 0.01 to 0.99. The total specific surface area, pore volume, and average pore diameter were calculated by the BET method [32]. The specific surface area and pore volume of the micropores were obtained by the t method [24]. The parameters for the mesopores were obtained by the Barrett-Joyner-Halenda (BJH) method [33].
The NH3-TPD analysis was performed using a chemisorption catalyst analyzer (BELCAT-B; MicrotracBEL Co., Osaka, Japan). The catalyst samples (approximately 0.05 g) were prepared at 400 °C for 1 h under a He flow of 50 mL/min. After decreasing the temperature to 100 °C, ammonia was adsorbed onto the sample surface by passing NH3/He (5/95% (v/v), 50 mL/min) through the sample for 30 min, followed by an evacuation step for 1 h at 100 °C to eliminate the weakly adsorbed ammonia. The NH3-TPD analysis was then carried out from 100 to 800 °C at a heating rate of 10 °C/min.
The dpulse value was calculated based on the amount of CO molecules adsorbed on the catalyst surface and measured using the chemisorption catalyst analyzer (BELCAT-B; MicrotracBEL Co., Osaka, Japan). The catalyst samples (approximately 0.2 g) were charged into a sample holder and oxidized at 400 °C for 15 min under an O2 flow (99.999%) of 50 mL/min, and subsequently reduced at 400 °C for 30 min under a H2 flow of 50 mL/min. The samples were then cooled down to 50 °C under a He flow of 50 mL/min. CO/He (10/90% (v/v)) was intermittently injected into the holder at 50 °C until the amount of CO leaving the holder became constant. The calculation method has been reported in detail previously [23]. The CO pulse analysis was performed three times, and the average value from these replicates was taken as the dpulse value.

3.3. Hydrocracking Tests

Hydrocracking tests were performed using an autoclave made of the Inconel alloy (inner volume: 75 mL). The FT product produced by a bench-scale BTL plant (AIST Chugoku, Hiroshima, Japan) was employed as feedstock. The woody biomass gasification was performed with oxygen-enriched air and CO2 as the gasifying agents to obtain the syngas. Subsequently, the FT synthesis was conducted over a (Co-Mn-Zr)/SiO2 catalyst prepared by the impregnation method [34,35]. The Co content was 20 wt. %. During the FT synthesis, n-hexadecane (Tokyo Chemical Industry Co., Tokyo, Japan, 4 L) was initially charged into the reactor to give a slurry phase reactor. The reaction was performed for 8 h. Table 3 shows the elemental and chemical analyses of the biomass-derived FT product. The FT product comprised of hydrocarbons, with the largest fraction being those with a carbon number of 16. Generally, the product distribution of the FT synthesis reaction follows the Anderson-Schulz-Flory (ASF) distribution. Based on the product distribution, the FT product mixture still contained n-hexadecane, which was initially charged into the reactor, because the FT reaction did not go to completion. The target product in the hydrocracking reaction was hydrocarbons with carbon numbers of 9–15. Table 3 lists the content of hydrocarbons with carbon numbers of 9–15, which serve as the feedstock. Therefore, we believe that it is worthwhile to discuss the results of the hydrocracking tests using the FT product.
The FT product exists as a solid at room temperature. A uniform feedstock was obtained by heating the FT product at 50 °C with stirring. The Pt-loaded catalyst (0.2 g) and heated feedstock (5 g) were charged into the autoclave. The gas in the reactor was replaced with hydrogen (99.999%) and the inner pressure was set at 0.5 MPa. The autoclave was heated by an electric furnace, stirring at 300 rpm. The temperatures of the reactor and furnace were recorded with a data acquisition system (NR-250; Keyence Co., Osaka, Japan) The reaction time of the hydrocracking reaction was regarded as 0 min when the reactor temperature reached 245 °C. The reaction temperature and time were set at 250 °C and 1 h, respectively. After the hydrocracking reaction, the furnace was removed and the reactor was cooled to room temperature with a fan. The gas in the autoclave was purged with N2 (99.9998%) and collected into a gas collection bag using a wet gas meter (W-NKA-0.5A; Shinagawa Co., Tokyo, Japan). The reaction mixture in the reactor was collected after opening the autoclave.
The inorganic gas and gaseous hydrocarbons with carbon numbers of 1–9 in the collected gas were analyzed using gas chromatographs equipped with a thermal conductivity detector (GC323; GL Science Inc., Tokyo, Japan, Column: Molecular Sieve 5A) and a flame ionization detector (GC353B; GL Sciences Inc., Tokyo, Japan, Column: RT-QPLOT). The products collected from the reactor were analyzed using a chromatograph with a flame ionization detector (GC353B; GL Sciences Inc., Tokyo, Japan, Column: Ultra Alloy-DX30) using 2-methyl naphthalene (Tokyo Chemical Industry Co., Tokyo, Japan) as the internal standard. Carbon tetrachloride (Sigma-Aldrich Co., Tokyo, Japan) and n-hexadecane (Tokyo Chemical Industry Co., Tokyo, Japan) were used as solvents.
The yield of the products, i, on a carbon basis (Yi: i = C1–C8, C9–C15, and C16+, respectively) and loss are defined as follows:
Y C 1 C 8   ( % ) = n = 1 8 C j C i n × 100
Y C 9 C 15   ( % ) = n = 9 15 C j C i n × 100
Y C 16 +   ( % ) = n = 16 56 C j C i n × 100
Loss  ( % ) = 100 Y C 1 C 8 Y C 9 C 15 Y C 16 +
where Cj (mol) is the total carbon number of the hydrocarbon product, with a carbon number of j, and Cin (mol) is the total carbon number contained in the feedstock that was charged into the reactor.

4. Conclusions

A screening study using Pt-loaded catalysts with a Pt content of 0.1 wt. % was performed to investigate the effective production of hydrocarbon liquid fuel in the hydrocracking of FT product. Zeolite supports were more favorable for jet fuel production compared to amorphous oxide supports. The small Pt particle size of the supported Pt particles and the high amount of medium acid sites for zeolite supports led to a higher performance of Pt-loaded zeolite catalyst with low Pt content. For the Pt-loaded BEA28 catalysts, the yields of the corresponding jet fuel at 0.02 and 0.1 wt. % were almost the same. The Pt particle size was controlled in the range of 1.0–2.6 nm by preparing Pt-loaded BEA28 catalysts with a Pt content of 0.02 wt. % using w/o microemulsions. There was no correlation between the Pt particle size and product yield. Small Pt particles were beneficial for the production of lighter hydrocarbons such as gasoline.

Acknowledgments

The authors thank Hideyuki Yokoyama, Chitose Tokifuji, and Maiko Nishida for their assistance with the experiments.

Author Contributions

Toshiaki Hanaoka synthesized the catalyst, performed the hydrocracking behavior studies, and drafted the manuscript. Tomohisa Miyazawa, Katsuya Shimura, and Satoshi Hirata participated in the design of the study and helped to draft the manuscript. The authors have all read and approved the final manuscript.

Conflicts of Interest

The authors declare no conflict of interest.

References

  1. Sunde, K.; Brekke, A.; Solberg, B. Environment impacts and costs of woody Biomass-To-Liquid (BTL) production and use—A review. For. Policy Econ. 2011, 13, 591–602. [Google Scholar] [CrossRef]
  2. Fujimoto, S.; Yanagita, T.; Ogata, M.; Minowa, T. Evaluation of CO2 mitigation by BTL biofuels from woody biomass through simulated case studies. Int. Energy J. 2008, 9, 73–80. [Google Scholar]
  3. Calemma, V.; Peratello, S.; Perego, C. Hydroisomerization and hydrocracking of long chain n-alkanes on Pt/amorphous SiO2-Al2O3 catalyst. Appl. Catal. A 2000, 190, 207–218. [Google Scholar] [CrossRef]
  4. Kang, J.; Ma, W.; Keogh, R.A.; Shafer, W.D.; Jacobs, G.; Davis, B.H. Hydrocracking and hydroisomerization of n-hexadecane, n-octacosane and Fischer-Tropsch wax over a Pt/SiO2-Al2O3 catalyst. Catal. Lett. 2012, 142, 1295–1305. [Google Scholar] [CrossRef]
  5. Kim, M.Y.; Kim, Y.A.; Jeong, K.E.; Chae, H.J.; Kim, C.U.; Jeong, S.Y.; Han, J.; Park, E.D. Effect of Al content on hydrocracking of n-paraffin over Pt/SiO2-Al2O3. Catal. Commun. 2012, 26, 78–82. [Google Scholar] [CrossRef]
  6. Keogh, R.A.; Srinivasan, R.; Davis, B.H. The effect of Pt concentration on the activity and selectivity of SO42−-ZrO2 catalysts for the hydrocracking and hydroisomerization of n-hexadecane. Appl. Catal. A 1996, 140, 47–57. [Google Scholar] [CrossRef]
  7. Busto, M.; Vera, C.R.; Grau, J.M. Optimal process conditions for the isomerization-cracking of long-chain n-paraffins to high octane isomerizate gasoline over Pt/SO42−-ZrO2 catalysts. Fuel Process. Technol. 2011, 92, 1675–1684. [Google Scholar] [CrossRef]
  8. Grau, J.M.; Yori, J.C.; Parera, J.M. Hydroisomerization-cracking of n-octane on Pt/WO42−-ZrO2 and Pt/SO42−-ZrO2. Effect of Pt load on catalyst performance. Appl. Catal. A 2001, 213, 247–257. [Google Scholar] [CrossRef]
  9. Busto, M.; Lovato, M.E.; Vera, C.R.; Shimizu, K.; Grau, J.M. Silica supported tungsta-zirconia catalysts for hydroisomerization—Cracking of long alkenes. Appl. Catal. A 2009, 335, 123–131. [Google Scholar] [CrossRef]
  10. Busto, M.; Benitez, V.M.; Vera, C.R.; Grau, J.M.; Yori, J.C. Pt-Pd/WO3-ZrO2 catalysts for isomerization-cracking of long paraffins. Appl. Catal. A 2008, 347, 117–125. [Google Scholar] [CrossRef]
  11. Zhang, S.; Zhang, Y.; Tierney, J.W.; Wender, I. Anion-modified zirconia: Effect of metal promotion and hydrogen reduction on hydroisomerization of n-hexadecane and Fischer-Tropsch waxes. Fuel Process. Technol. 2001, 69, 59–71. [Google Scholar] [CrossRef]
  12. Zhang, S.; Zhang, Y.; Tierney, J.W.; Wender, I. Hydroisomerization of normal hexadecane with platinum-promoted tungstate-modified zirconia catalysts. Appl. Catal. A 2000, 193, 155–171. [Google Scholar] [CrossRef]
  13. Zhou, Z.; Zhang, Y.; Tienery, J.W.; Wender, I. Hybrid zirconia catalysts for conversion of Fischer-Tropsch waxy products to transportation fuels. Fuel Process. Technol. 2003, 83, 67–80. [Google Scholar] [CrossRef]
  14. Leu, L.J.; Hou, L.Y.; Kang, B.C.; Li, C.; Wu, S.T.; Wu, J.C. Synthesis of zeolite β and catalytic isomerization of n-hexane over Pt/H-β catalysts. Appl. Catal. 1991, 69, 49–63. [Google Scholar] [CrossRef]
  15. Hanaoka, T.; Miyazawa, T.; Shimura, K.; Hirata, S. Jet fuel synthesis from Fischer-Tropsch product under mild hydrocracking conditions using Pt-loaded catalysts. Chem. Eng. J. 2015, 263, 178–185. [Google Scholar] [CrossRef]
  16. Iliopoulou, E.F.; Heracleous, E.; Delimitis, E.; Lappas, A.A. Producing high quality biofuel: Pt-based hydroisomerization catalysts evaluated using BtL-naphtha surrogates. Appl. Catal. B 2014, 145, 177–186. [Google Scholar] [CrossRef]
  17. Heracleous, E.; Iliopoulou, E.F.; Lappas, A.A. Microporous/mesoporous Pt/ZSM-5 catalysts for hydroisomerization of BTL-naphtha. Ind. Eng. Chem. Res. 2013, 52, 14567–14573. [Google Scholar] [CrossRef]
  18. Alvarez, F.; Ribeiro, F.R.; Giannetto, G.; Chevalier, F.; Perot, G.; Guisnet, M. Hydroisomerization and hydrocracking of alkanes. 5. Hydroisomerization and hydrocracking of n-hexane and n-heptane on PtHY catalysts. Effect of the distribution of metallic and acid sites. Stud. Surf. Sci. Catal. 1989, 49, 1339–1348. [Google Scholar]
  19. Alvarez, F.; Giannetto, G.; Guisnet, M.; Perot, G. Hydroisomerization and hydrocracking of n-alkanes. 2. n-Heptane transformation on a Pt-dealuminated Y zeolite—Comparison with a Pt-Y zeolite. Appl. Catal. 1987, 34, 353–365. [Google Scholar] [CrossRef]
  20. Guisnet, M.; Alvarez, F.; Giannetto, G.; Perot, G. Hydroisomerization and hydrocracking of n-heptane on PtH zeolites. Effect of the porosity and of the distribution of metallic and acid sites. Catal. Today 1987, 1, 415–433. [Google Scholar] [CrossRef]
  21. Alvarez, F.; Ribeiro, F.R.; Perot, G.; Thomazeau, C.; Guisnet, M. Hydroisomerization and hydrocracking of alkanes. 7. Influence of the balance between acid and hydrogenating functions on the transformation of n-decane on PtHY catalysts. J. Catal. 1996, 162, 179–189. [Google Scholar] [CrossRef]
  22. Hanaoka, T.; Miyazawa, T.; Shimura, K.; Hirata, S. Jet fuel synthesis in hydrocracking of Fischer-Tropsch product over Pt-loaded zeolite catalysts prepared using microemulsions. Fuel Process. Technol. 2015, 129, 139–146. [Google Scholar] [CrossRef]
  23. Hanaoka, T.; Miyazawa, T.; Shimura, K.; Hirata, S. Preparation for Pt-loaded zeolite catalysts using w/o microemulsion and their hydrocracking behaviors on Fischer-Tropsch product. Catalysts 2015, 5, 88–105. [Google Scholar] [CrossRef]
  24. Lippens, B.C.; Boer, J.H. Studies on pore systems in catalysts. V. The t method. J. Catal. 1965, 4, 319–323. [Google Scholar] [CrossRef]
  25. Batalha, N.; Pinard, L.; Pouilloux, Y.; Guisnet, M. Bifunctional hydrogenating/acid catalysis: Quantification of the intimacy criterion. Catal. Lett. 2013, 143, 587–591. [Google Scholar] [CrossRef]
  26. Thybaut, J.W.; Narasimhan, C.S.L.; Denayer, J.F.; Baron, G.V.; Jacobs, P.A.; Martens, J.A.; Marin, G.B. Acid-metal balance of a hydrocracking catalyst: Ideal versus nonideal behavior. Ind. Eng. Chem. Res. 2005, 44, 5159–5169. [Google Scholar] [CrossRef]
  27. Hanaoka, T.; Miyazawa, T.; Shimura, K.; Hirata, S. Effect of Pt particle density on the hydrocracking of Fischer-Tropsch products over Pt-loaded zeolite catalysts prepared using water-in-oil microemulsions. Chem. Eng. J. 2015, 274, 256–264. [Google Scholar] [CrossRef]
  28. Ikeda, M.; Takeshima, S.; Tago, T.; Kishida, M.; Wakabayashi, K. Preparation of size-controlled Pt catalysts supported alumina. Catal. Lett. 1999, 58, 195–197. [Google Scholar] [CrossRef]
  29. Hardeveld, R.; Hartog, F. The statistics of surface atoms and surface sites on metal crystals. Surface Sci. 1969, 15, 189–230. [Google Scholar] [CrossRef]
  30. Dauscher, A.; Garin, F.; Maire, G. Correlations between the surface structure of platinum single crystals and hydrocarbon skeletal rearrangement mechanisms: Approach to the nature of the active sites. J. Catal. 1987, 105, 233–244. [Google Scholar] [CrossRef]
  31. Stace, T. How small is a solid? Nature 1988, 331, 116–117. [Google Scholar] [CrossRef]
  32. Brunauer, S.; Emmett, P.H.; Teller, E. Adsorption of gases in multimolecular layers. J. Am. Chem. Soc. 1938, 60, 309–319. [Google Scholar] [CrossRef]
  33. Barrett, E.P.; Joyner, L.G.; Halenda, P.P. The determination of pore volume and area distributions in porous substances. Computations from nitrogen isotherms. J. Am. Chem. Soc. 1951, 73, 373–380. [Google Scholar] [CrossRef]
  34. Hanaoka, T.; Miyazawa, T.; Nurunnabi, M.; Hirata, S.; Sakanishi, K. Liquid fuel production from woody biomass via oxygen-enriched air/CO2 gasification on a bench scale. J. Jpn. Inst. Energy 2011, 90, 1072–1080. [Google Scholar] [CrossRef]
  35. Miyazawa, T.; Hanaoka, T.; Shimura, K.; Hirata, S. Mn and Zr modified Co/SiO2 catalysts development in slurry-phase Fischer-Tropsch synthesis. Appl. Catal. A 2013, 467, 47–54. [Google Scholar] [CrossRef]

