
Effect of Particle Size and Operating Conditions on Pt3Co PEMFC Cathode Catalyst Durability

Abstract
:1. Introduction
2. Results and Discussion

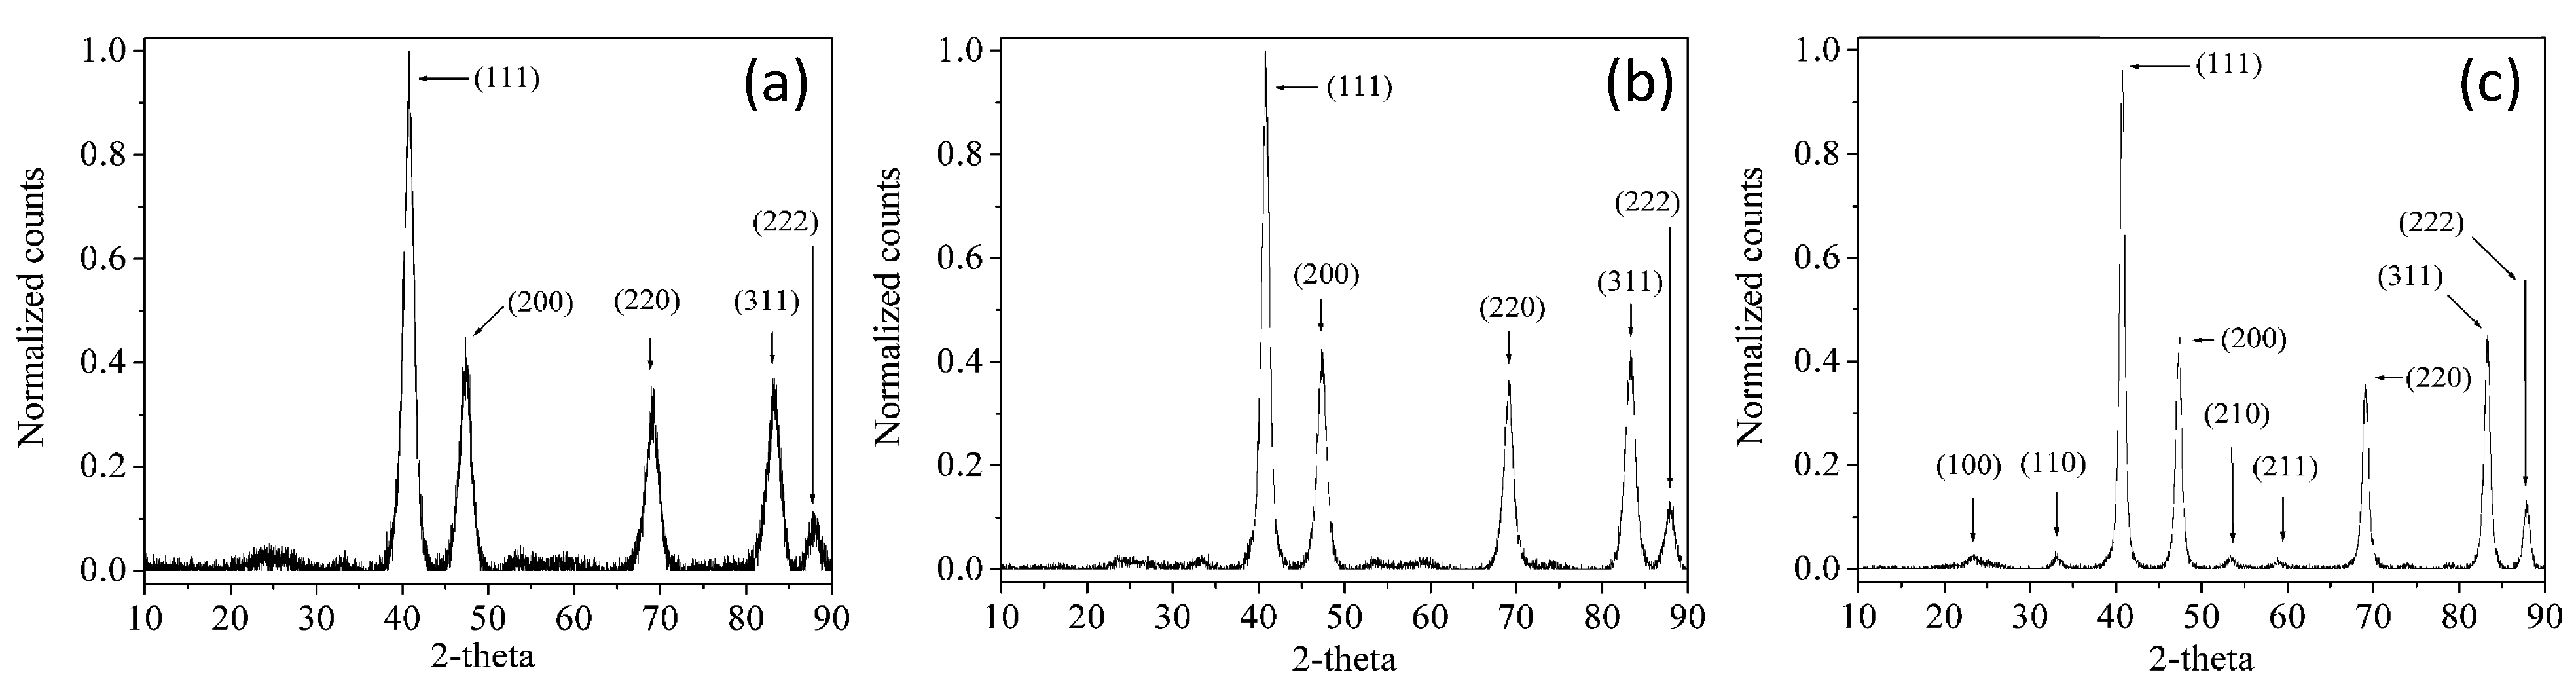
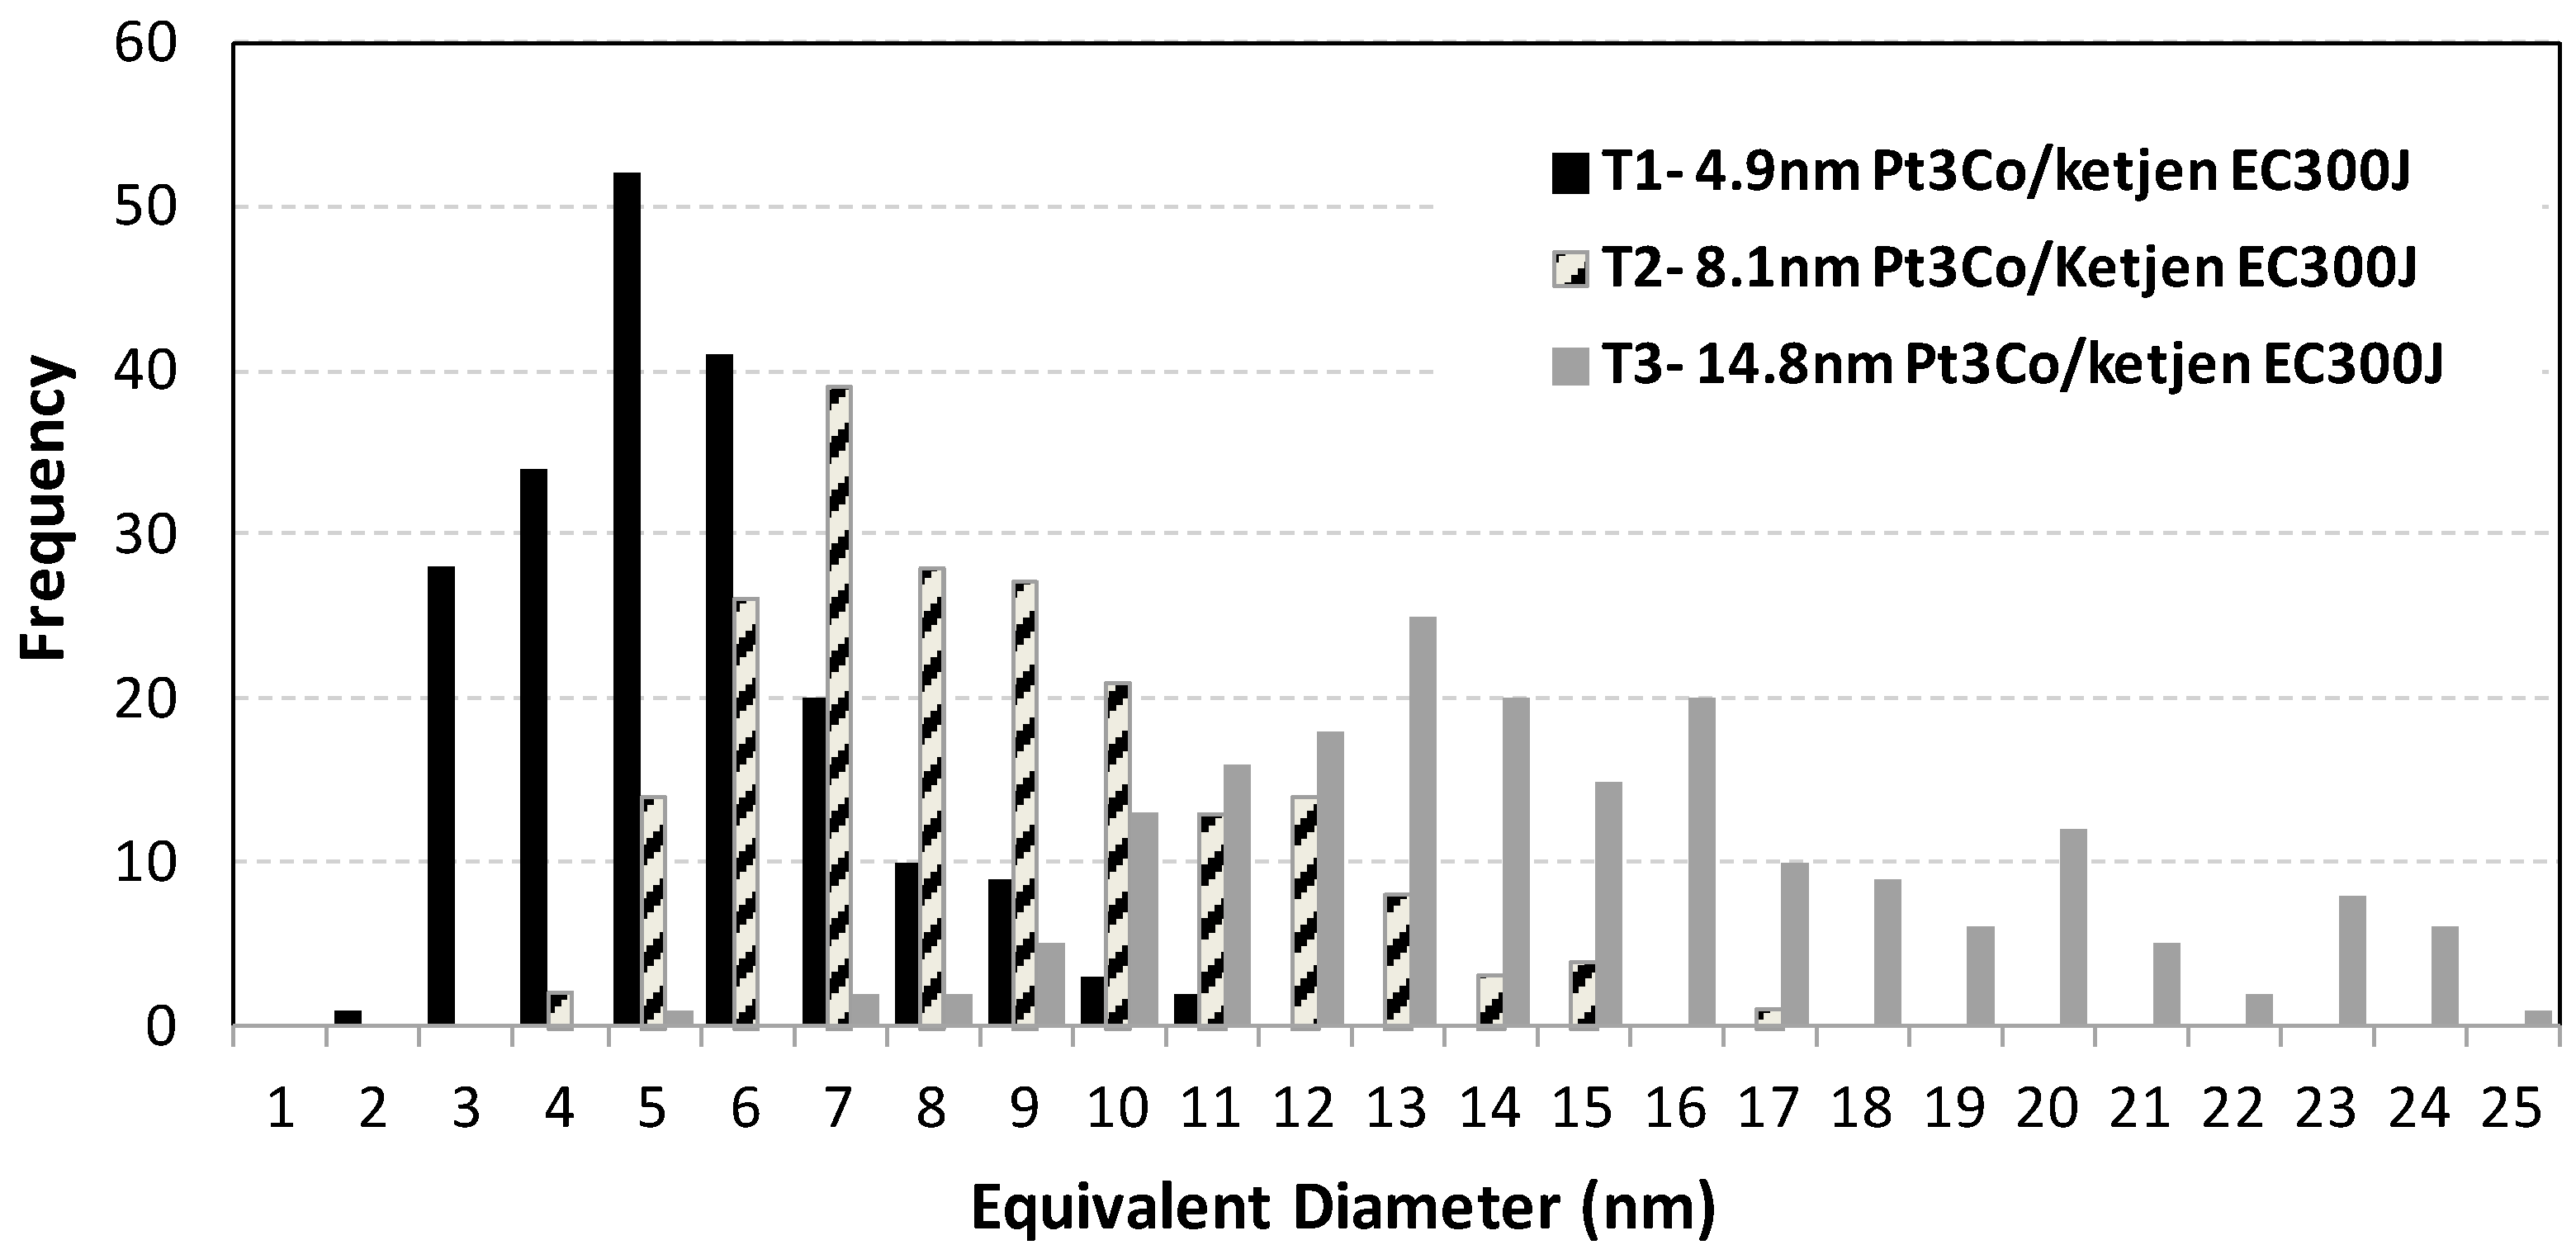
| Sample | wt.% Pt | wt.% Co | XRD crystallite Size (nm) | XRD L.P (Å) | CO area (m2/g-Pt) | TEM mean diameter (nm) | St error | N |
|---|---|---|---|---|---|---|---|---|
| 1 | 37.9 | 3.88 | 3.9 | 3.848 | 35 | 4.9 | 0.2 | 200 |
| 2 | 38.5 | 3.94 | 5.6 | 3.850 | 23 | 8.1 | 0.3 | 200 |
| 3 | 38.4 | 3.93 | 9.5 | 3.850 | 11.3 | 14.8 | 0.6 | 200 |

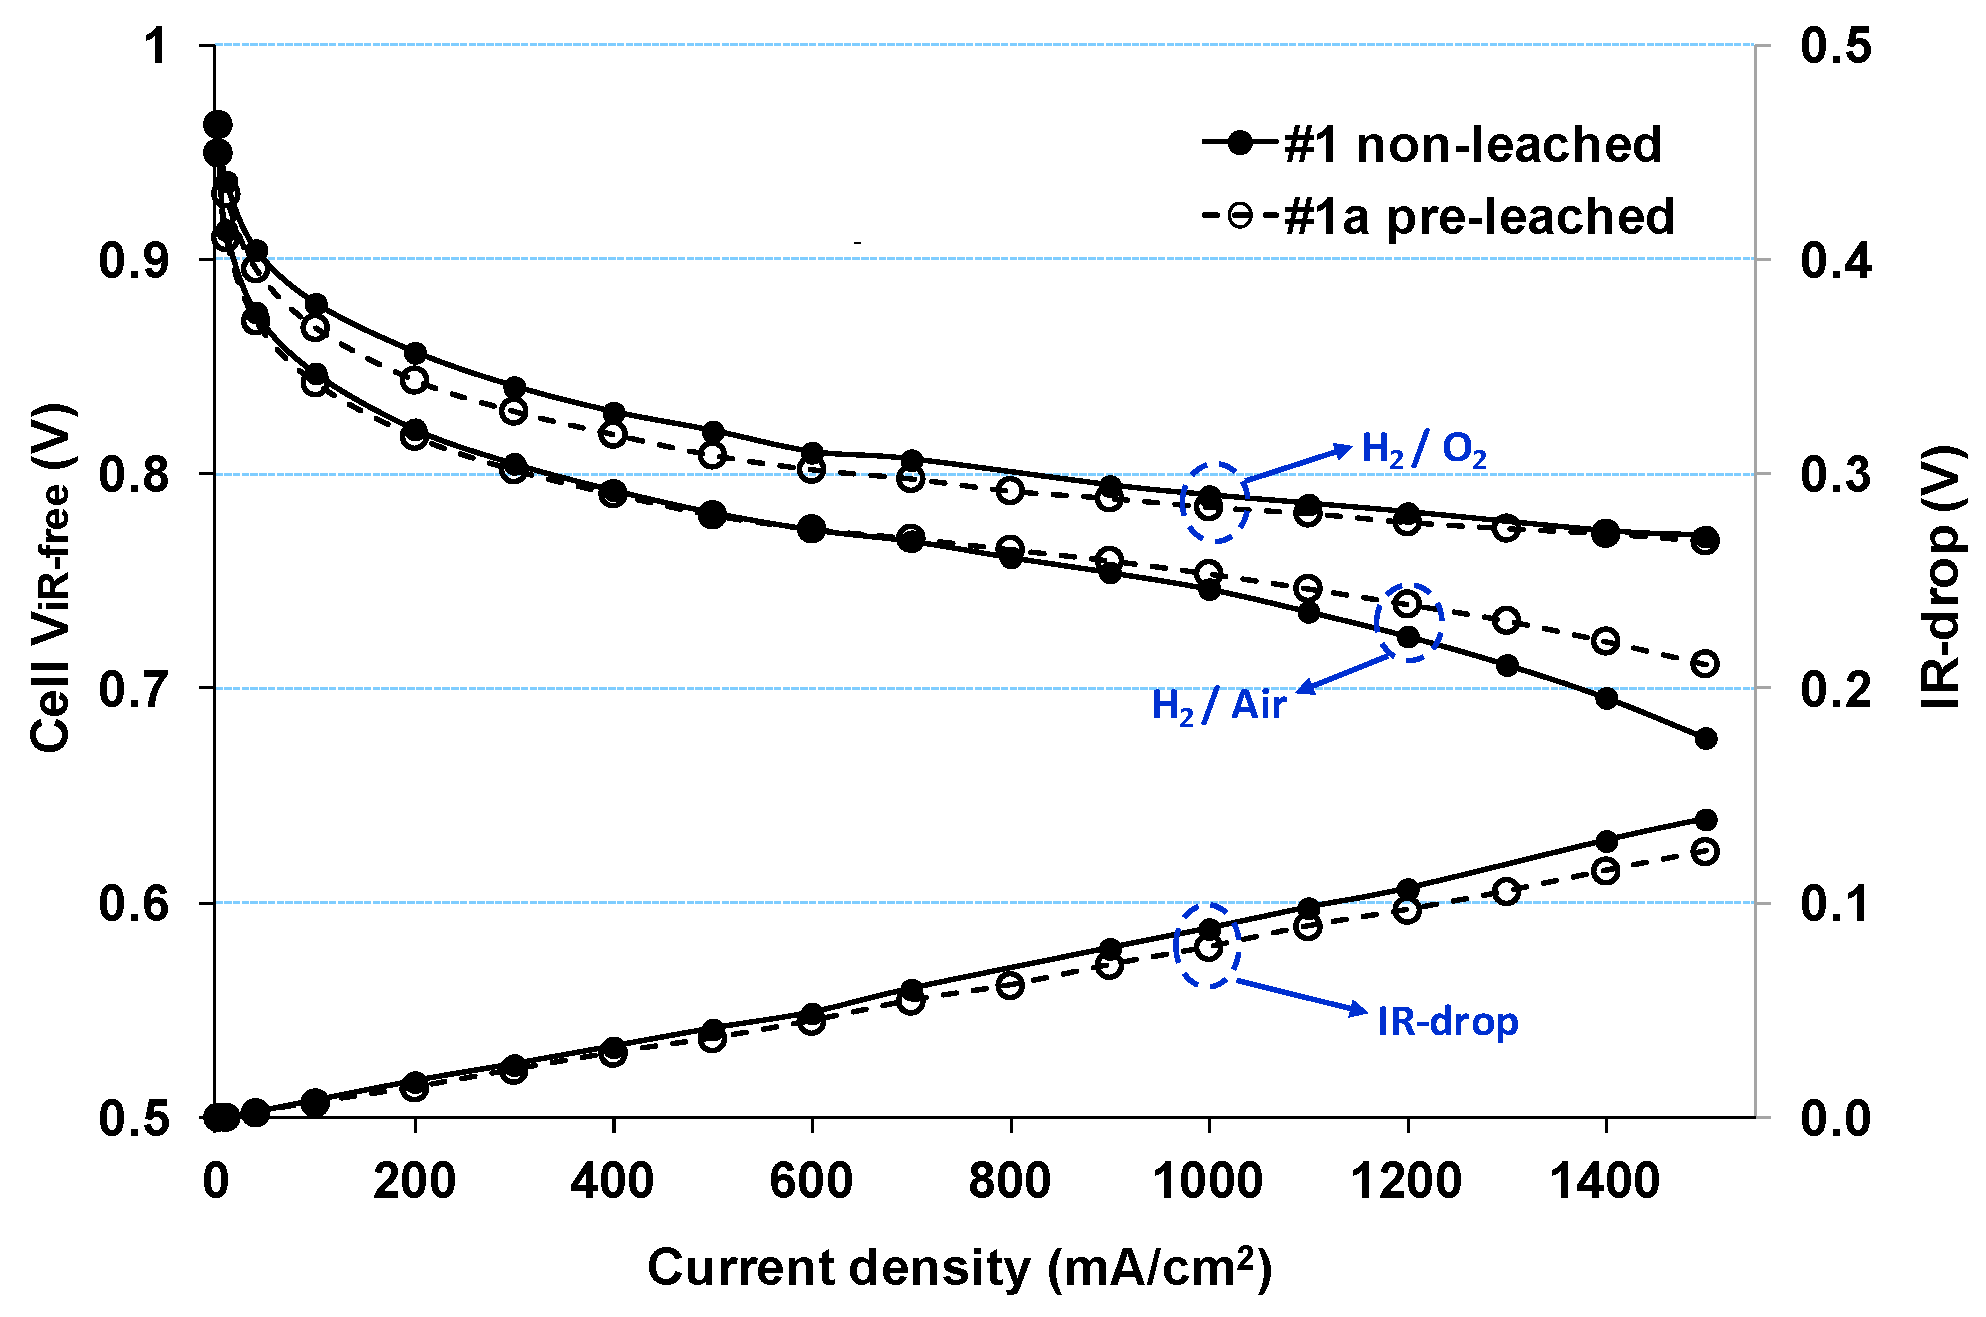
| Cell # | Mean diameter (nm) (ECA, m2/g-Pt) | Aonde/cathode Pt loading mg-Pt/cm2 | Potential cycling conditions |
|---|---|---|---|
| 1 | 4.9 (37) | 0.19/0.23 | Triangle wave potential cycle: 0.6 V to 1.0 V (50 mV/s ramp rate) Cell Temperature: 80 °C Humidity: Anode = Cathode = 100% RH Fuel/Oxidant: H2 at 100 sccm/N2 at 50 sccm Pressure: Atmospheric pressure |
| 1a * | 4.9 (40) | 0.22/0.18 | |
| 2 | 8.1 (27) | 0.20/0.22 | |
| 3 | 14.8 (23) | 0.20/0.22 |
| Cell # | Description | Potential cycling conditions |
|---|---|---|
| 4 | Baseline | Square wave potential cycle: 10 s at 0.4 V, 10 s at 0.95 V (20 s/cycle) |
| Cell Temperature: 80 °C | ||
| Humidity: Anode = Cathode = 100% RH | ||
| Fuel/Oxidant: 0.5 SPLM 4% H2/0.5 SPLM N2 | ||
| Pressure: Atmospheric pressure | ||
| 5 | Lower RH | Humidity: Anode = Cathode = 30% RH |
| All other parameters were same as 4 # | ||
| 6 | Higher Upper Potential | Square wave potential cycle: 10 s at 0.4 V, 10 s at 1.05 V (20 s/cycle) |
| All other parameters were same as 4 # | ||
| 7 | Higher Temperature | Cell Temperature: 90 °C |
| All other parameters were same as 4 # |
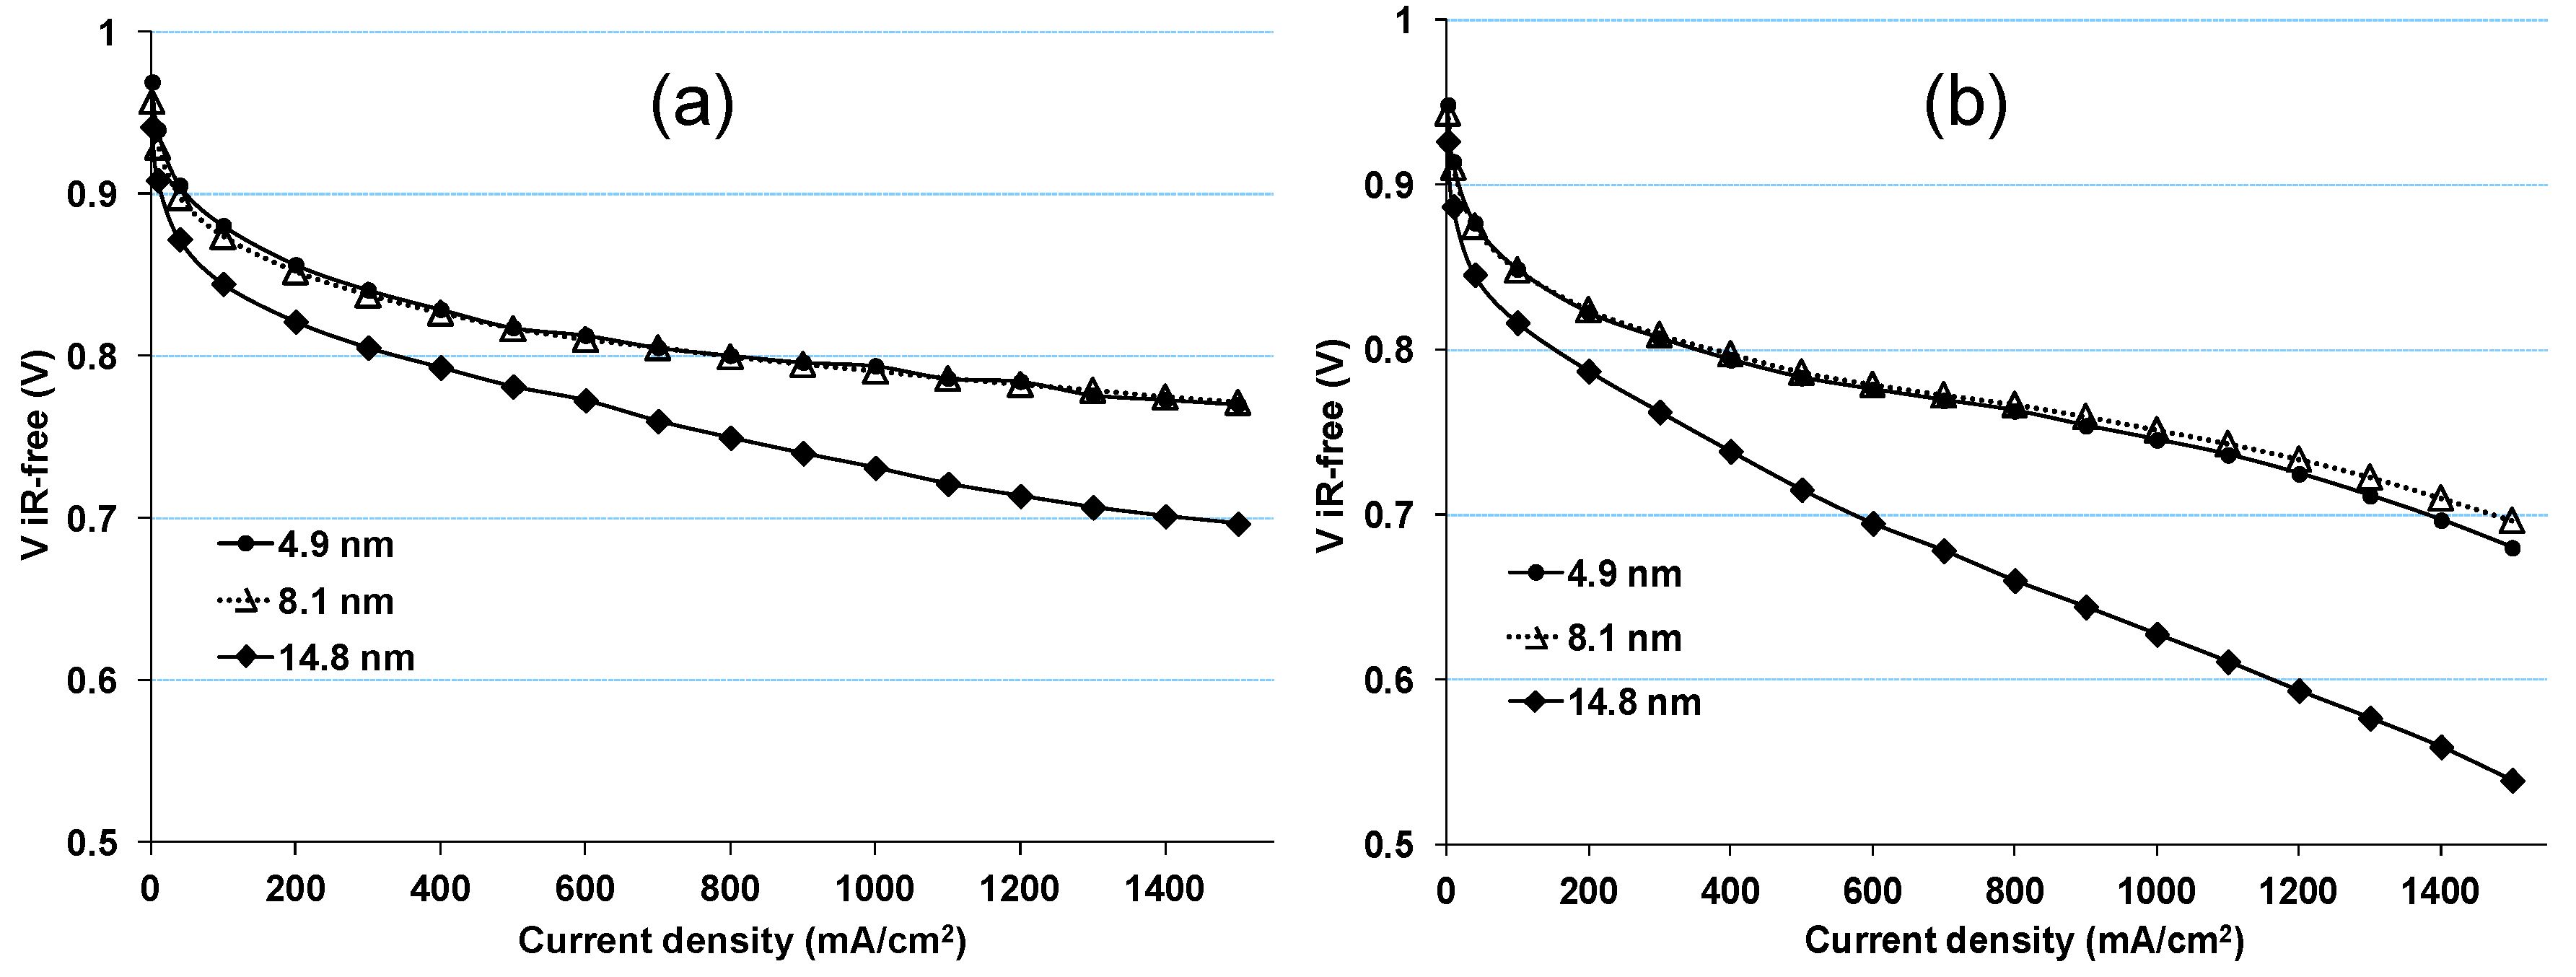
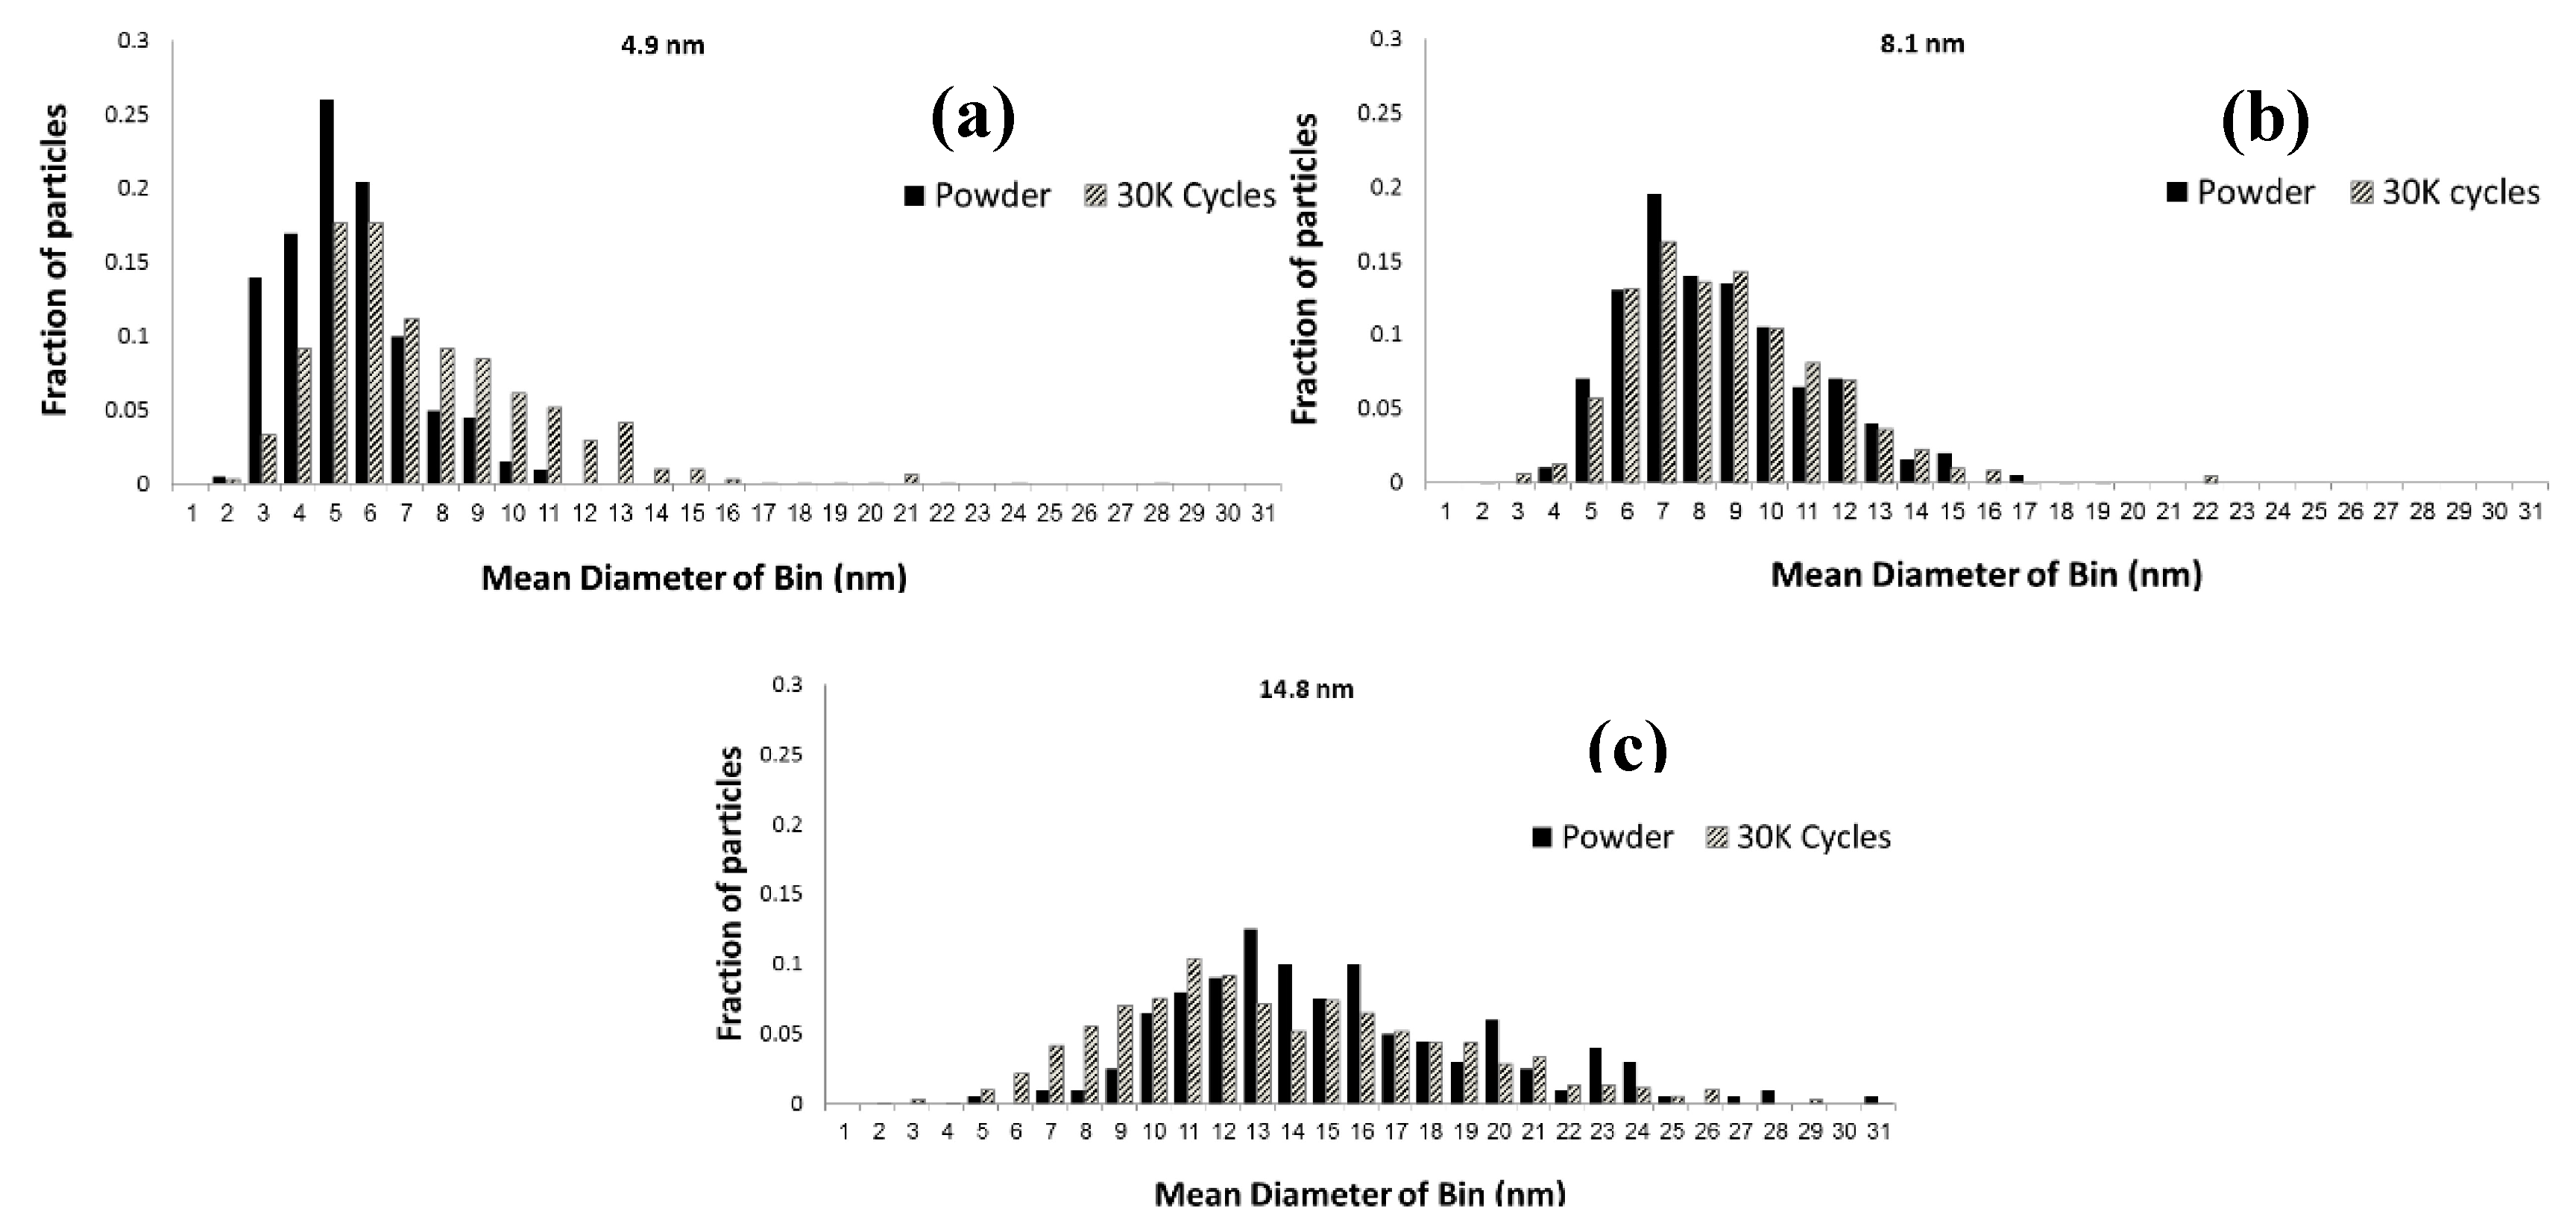
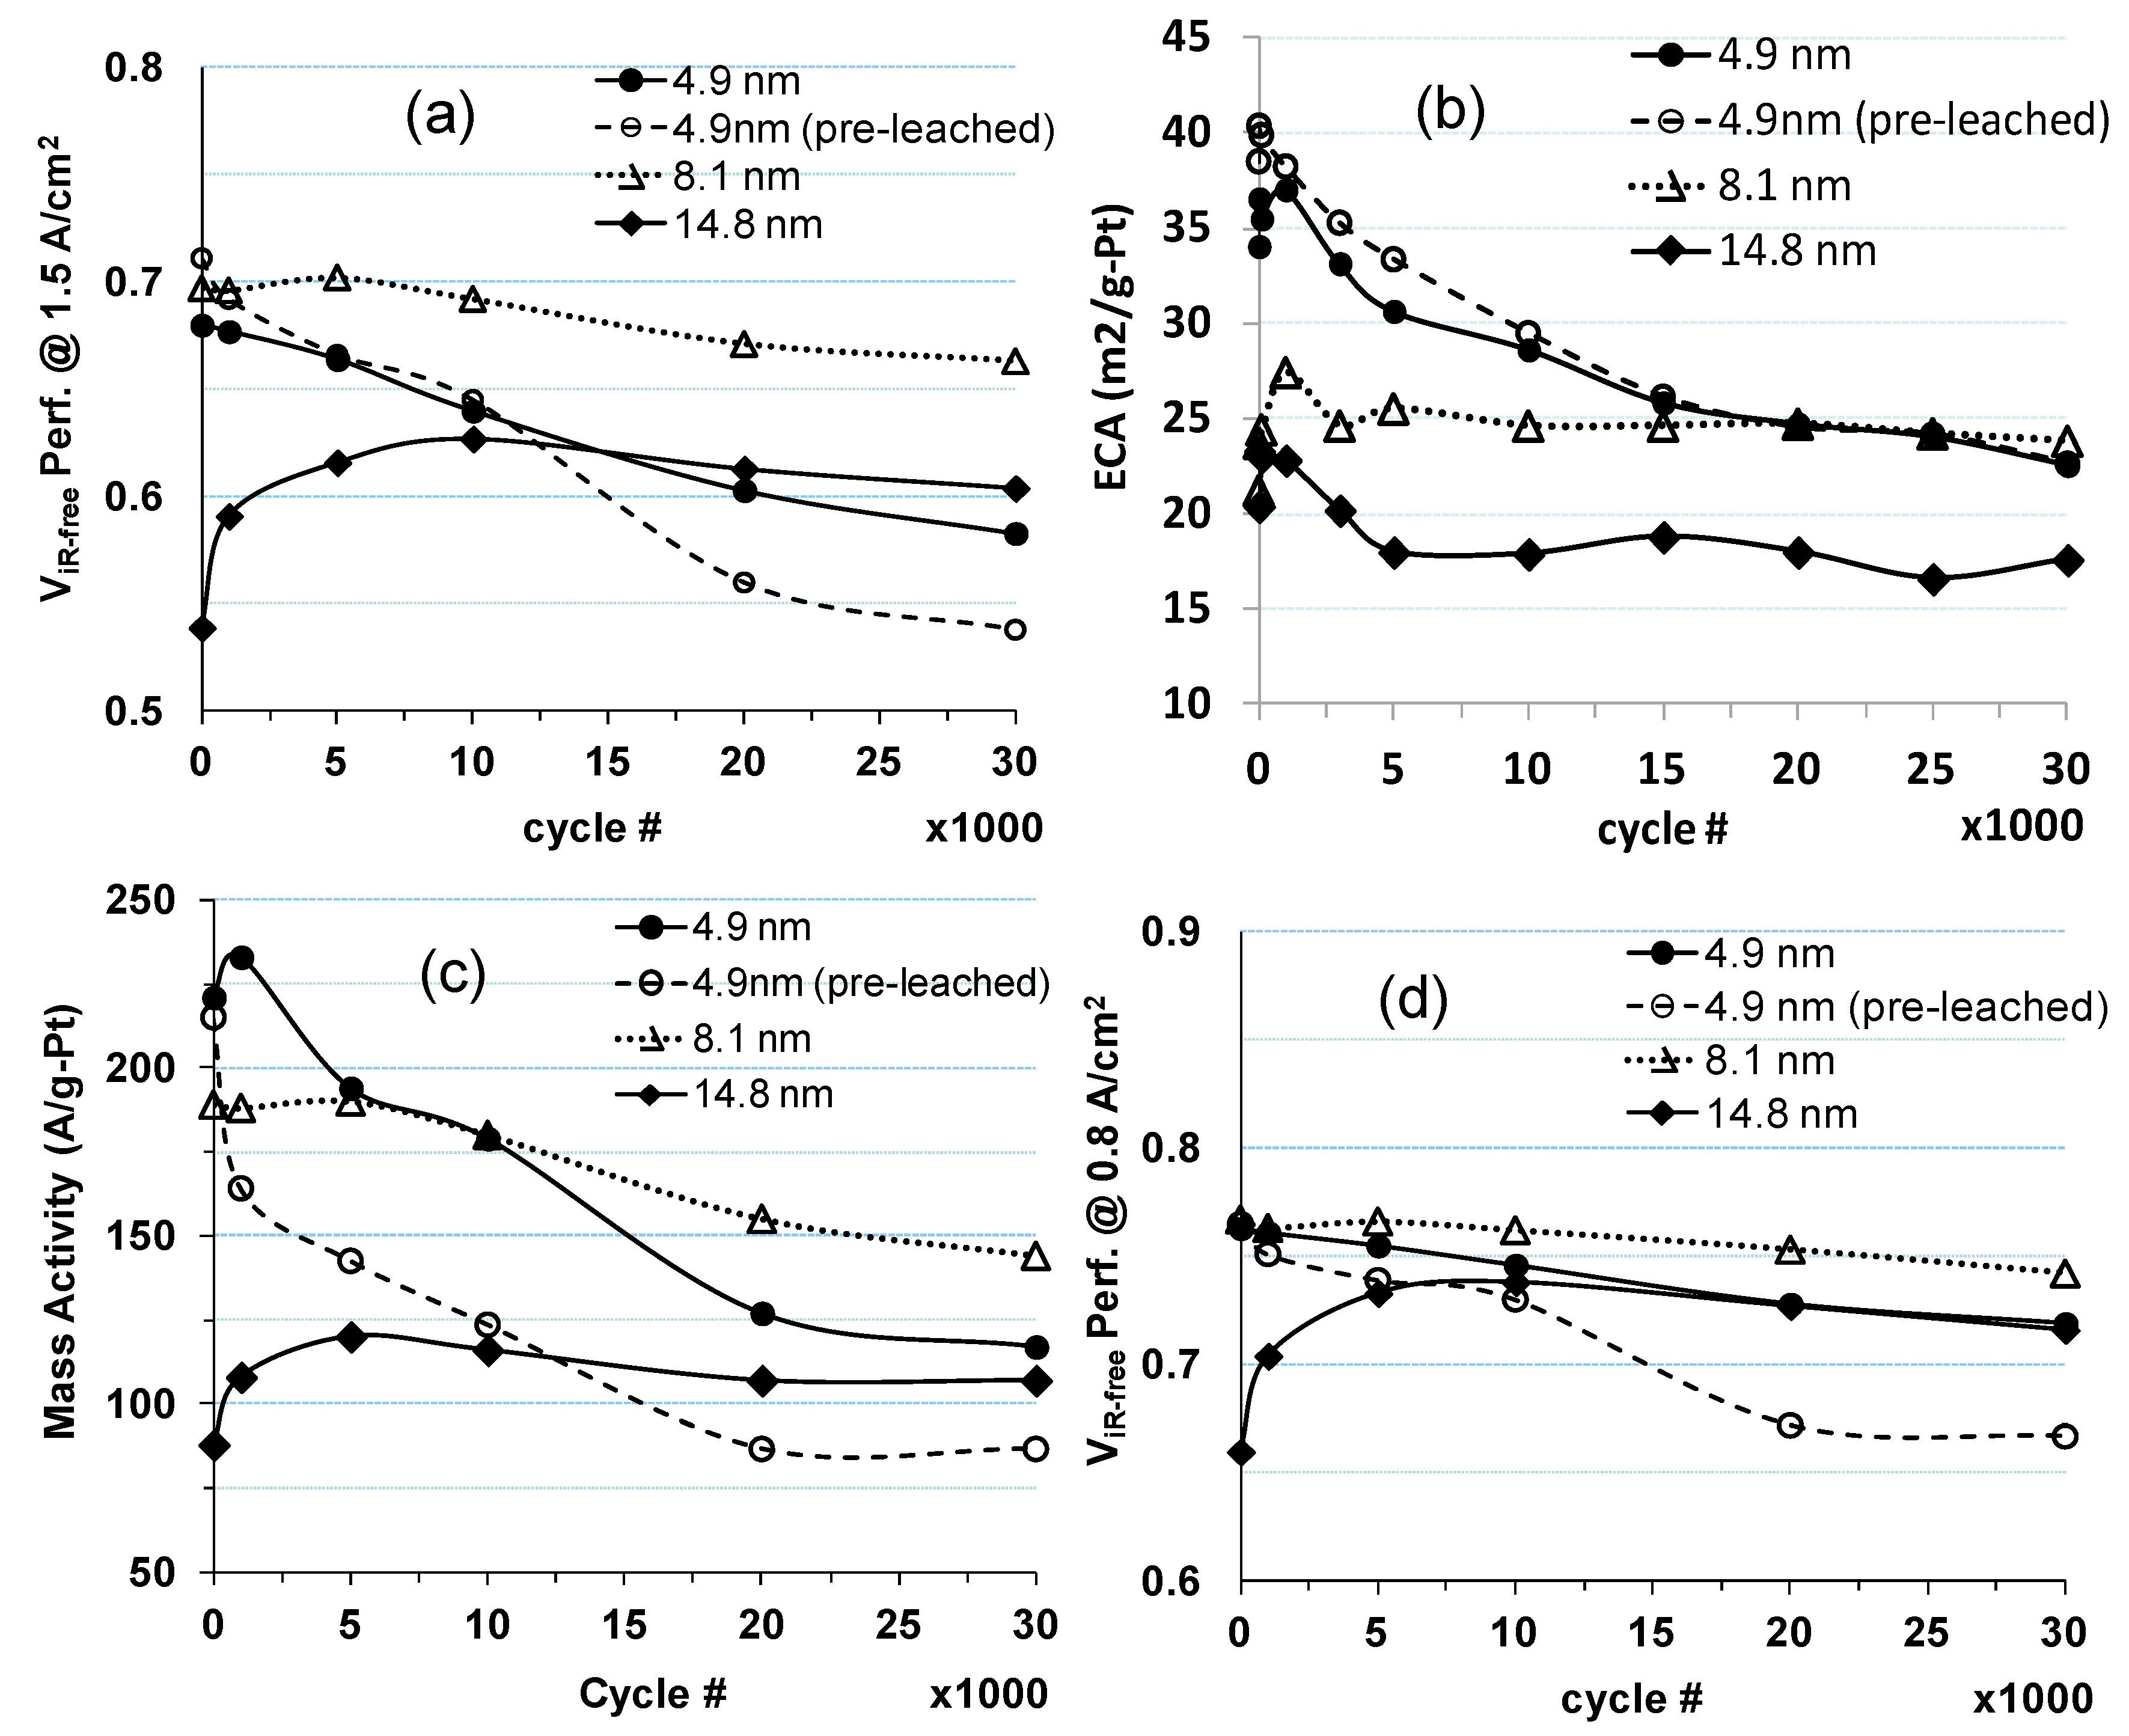
2.1. Impact of Catalyst Particle Size on Cell Performance Degradation

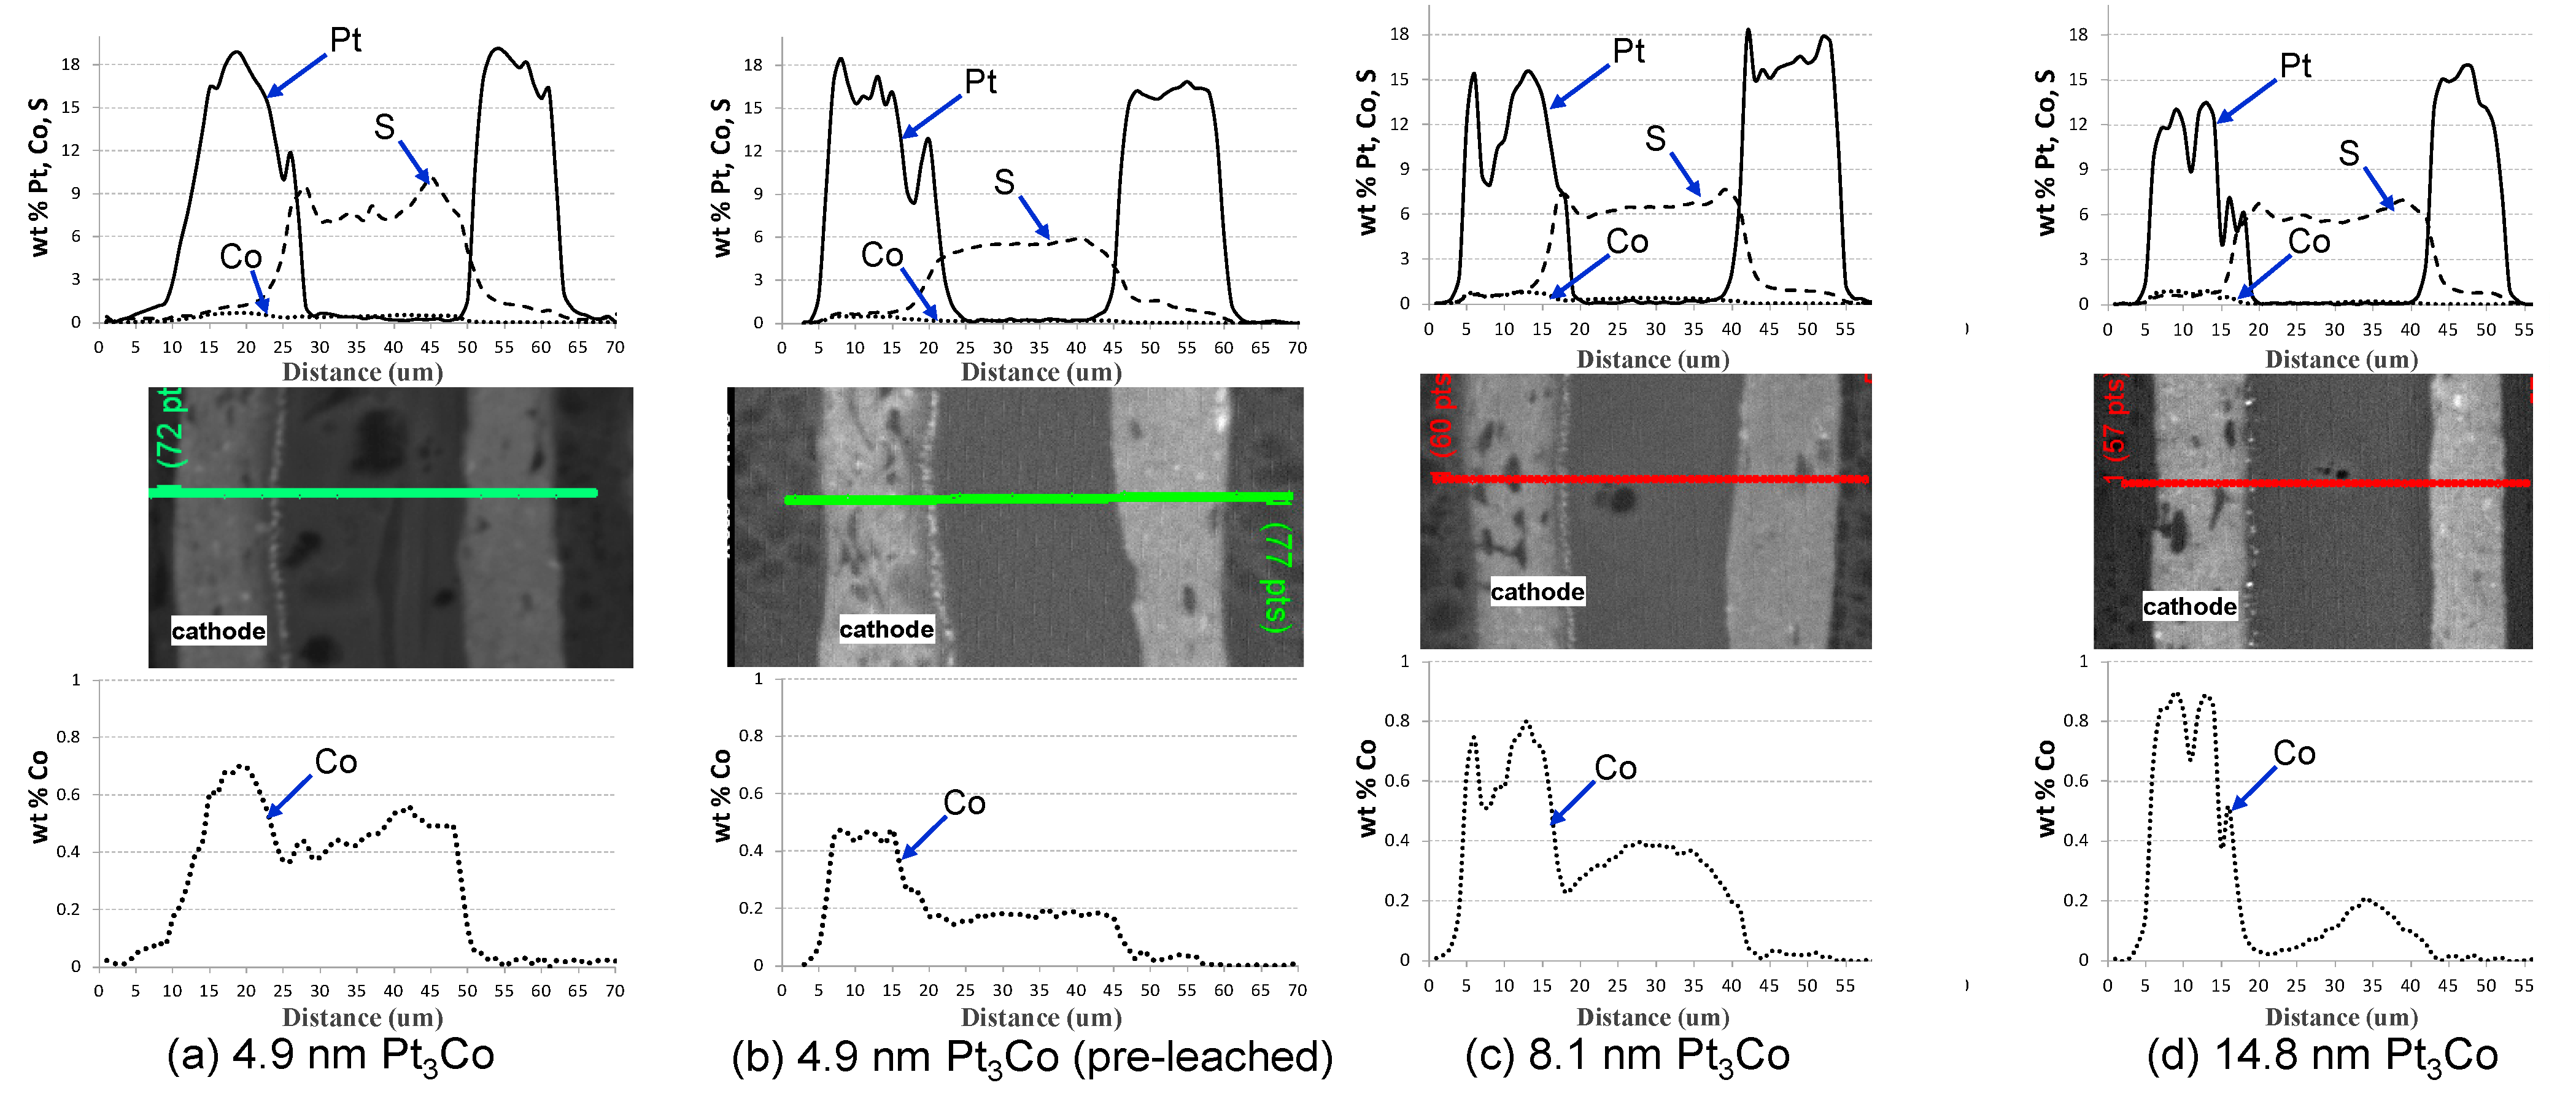
| Cell # | Mean diameter (nm) (ECA, m2/g-Pt) | % of Pt lost into membrane | % Co most from electrode | Pt/Co ratio |
|---|---|---|---|---|
| 1 | 4.9 (37) | 14.3 ± 2% | 63 | 8.4 |
| 2 | 8.1 (27) | 3.7 ± 2% | 45 | 5.5 |
| 3 | 14.8 (23) | 3.0 ± 1% | 30 | 4.2 |


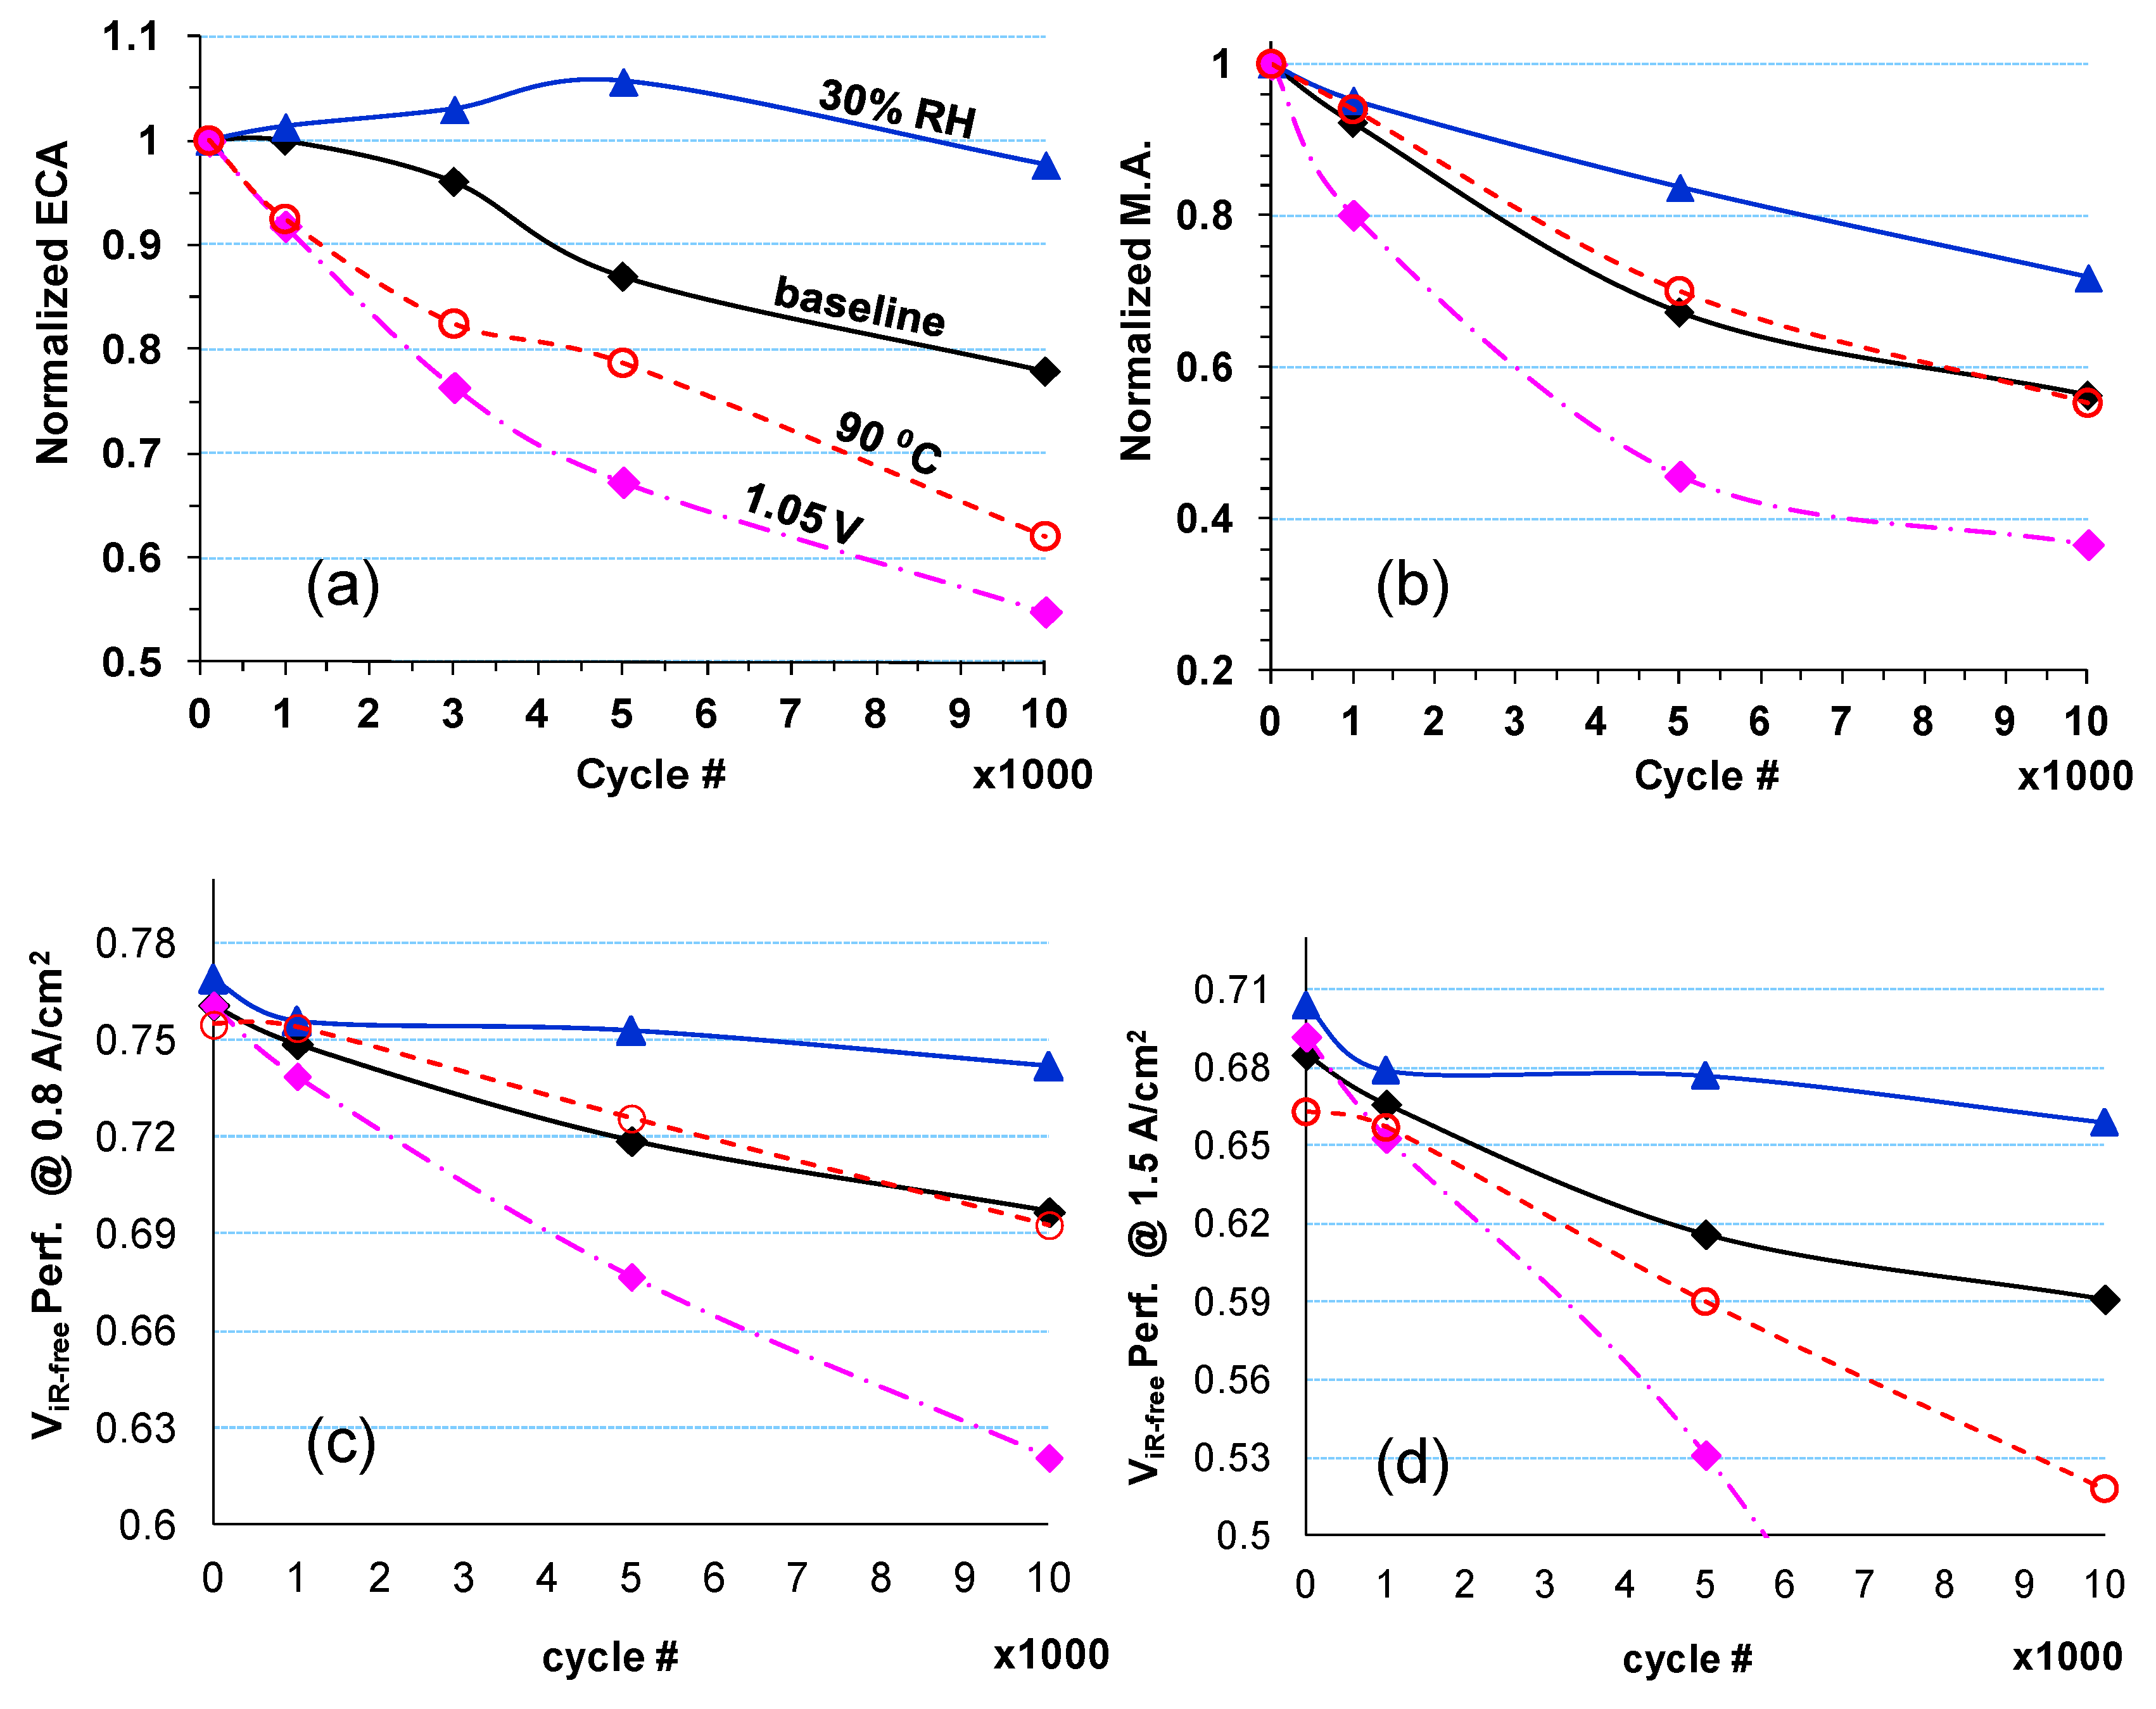
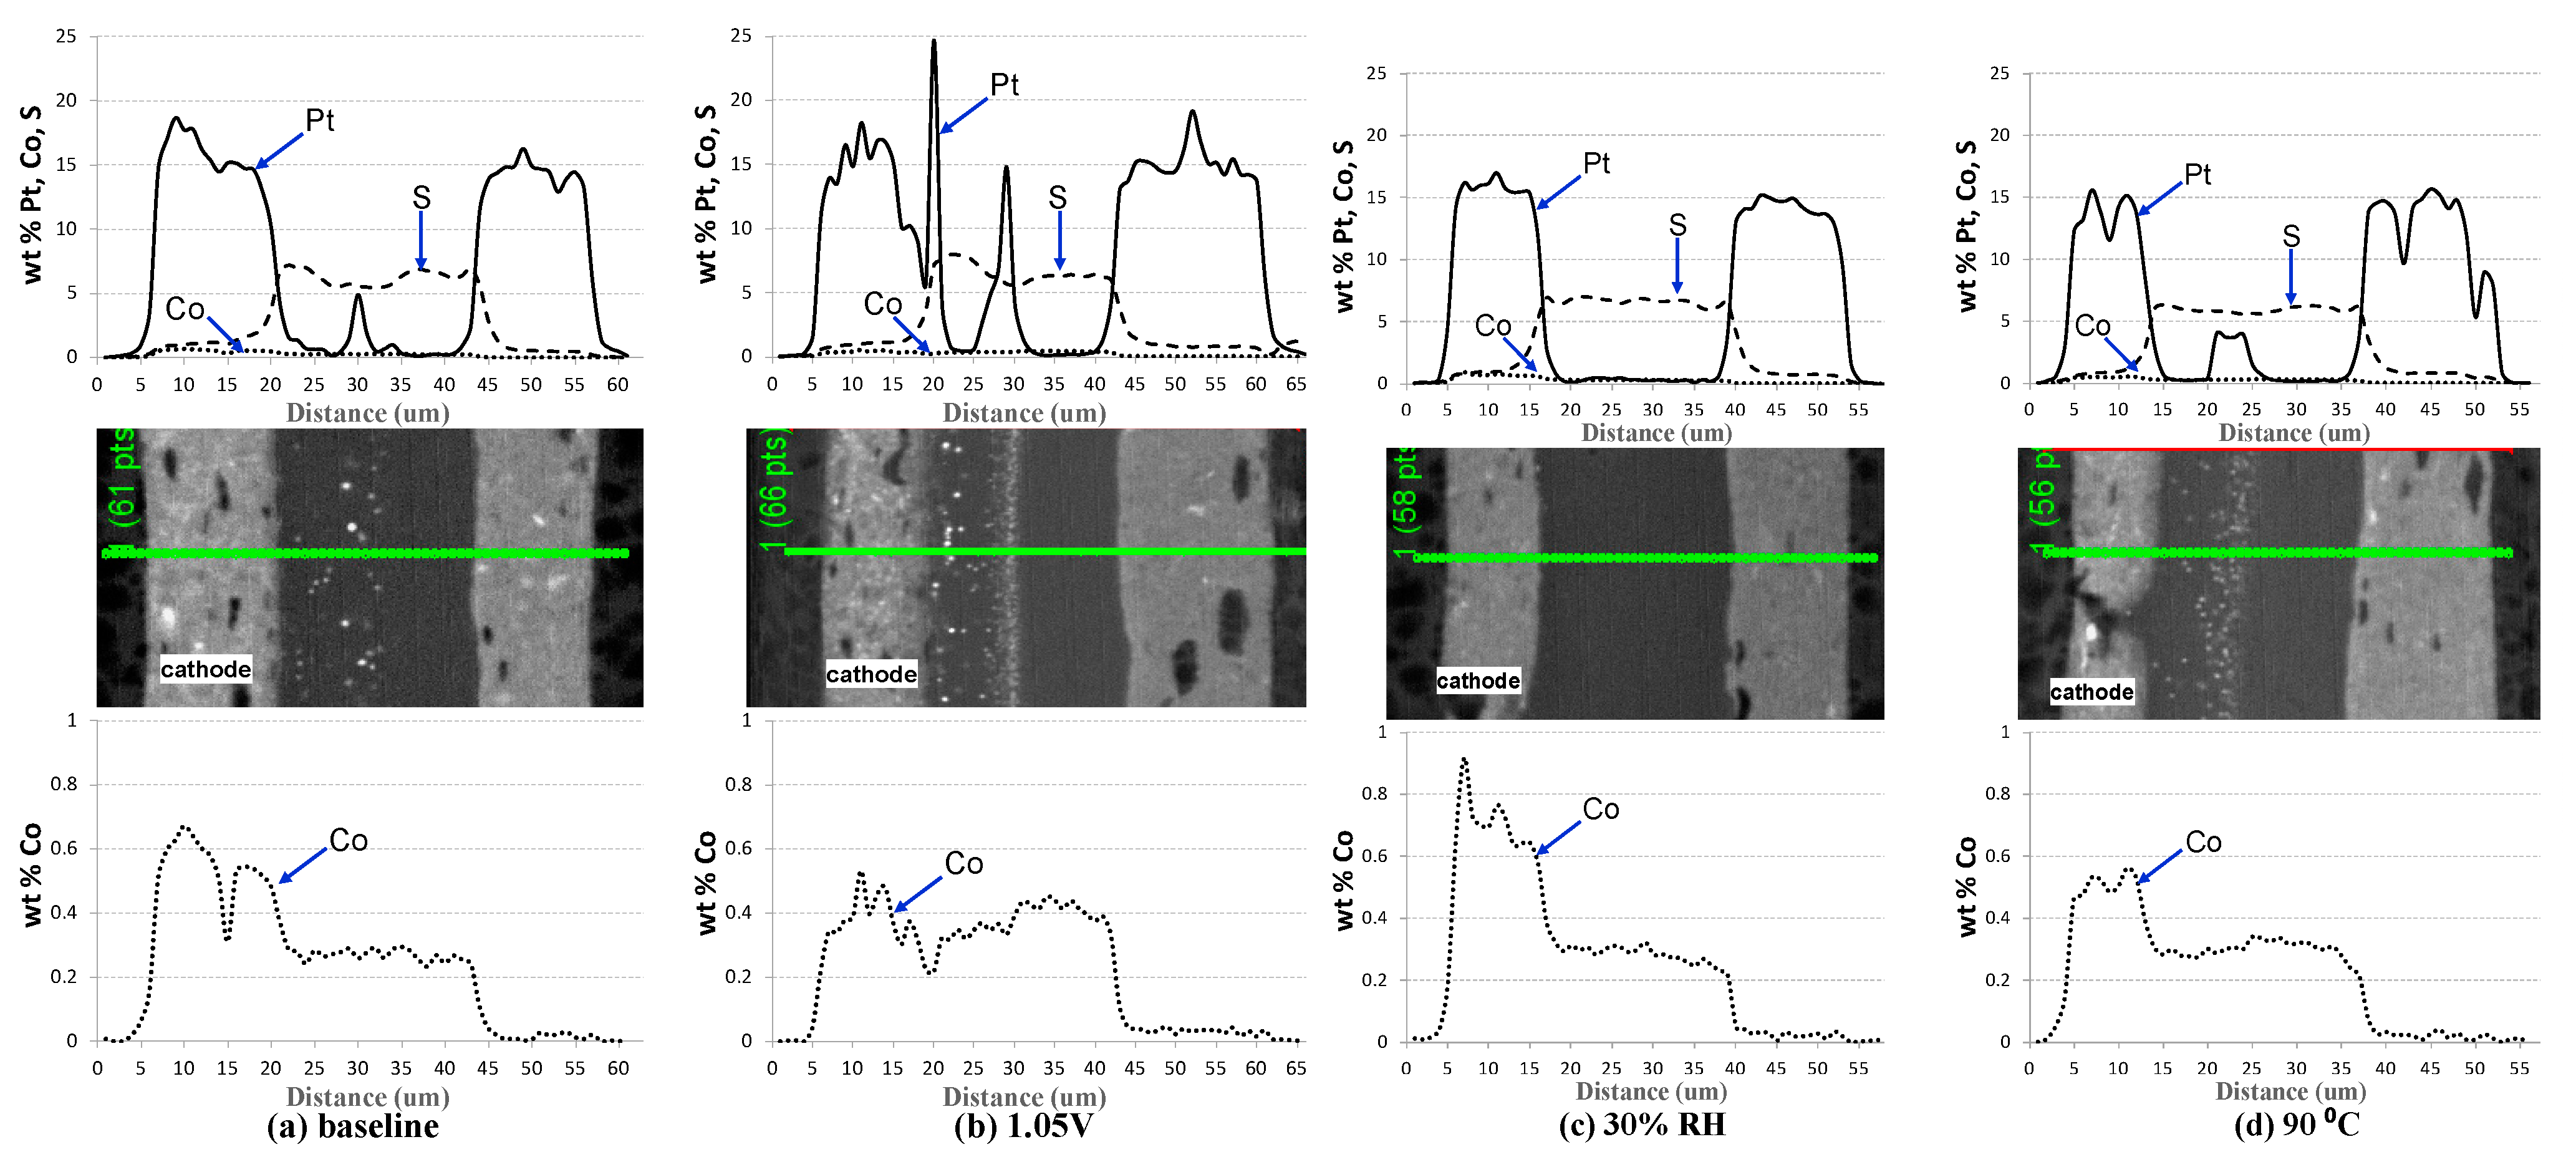
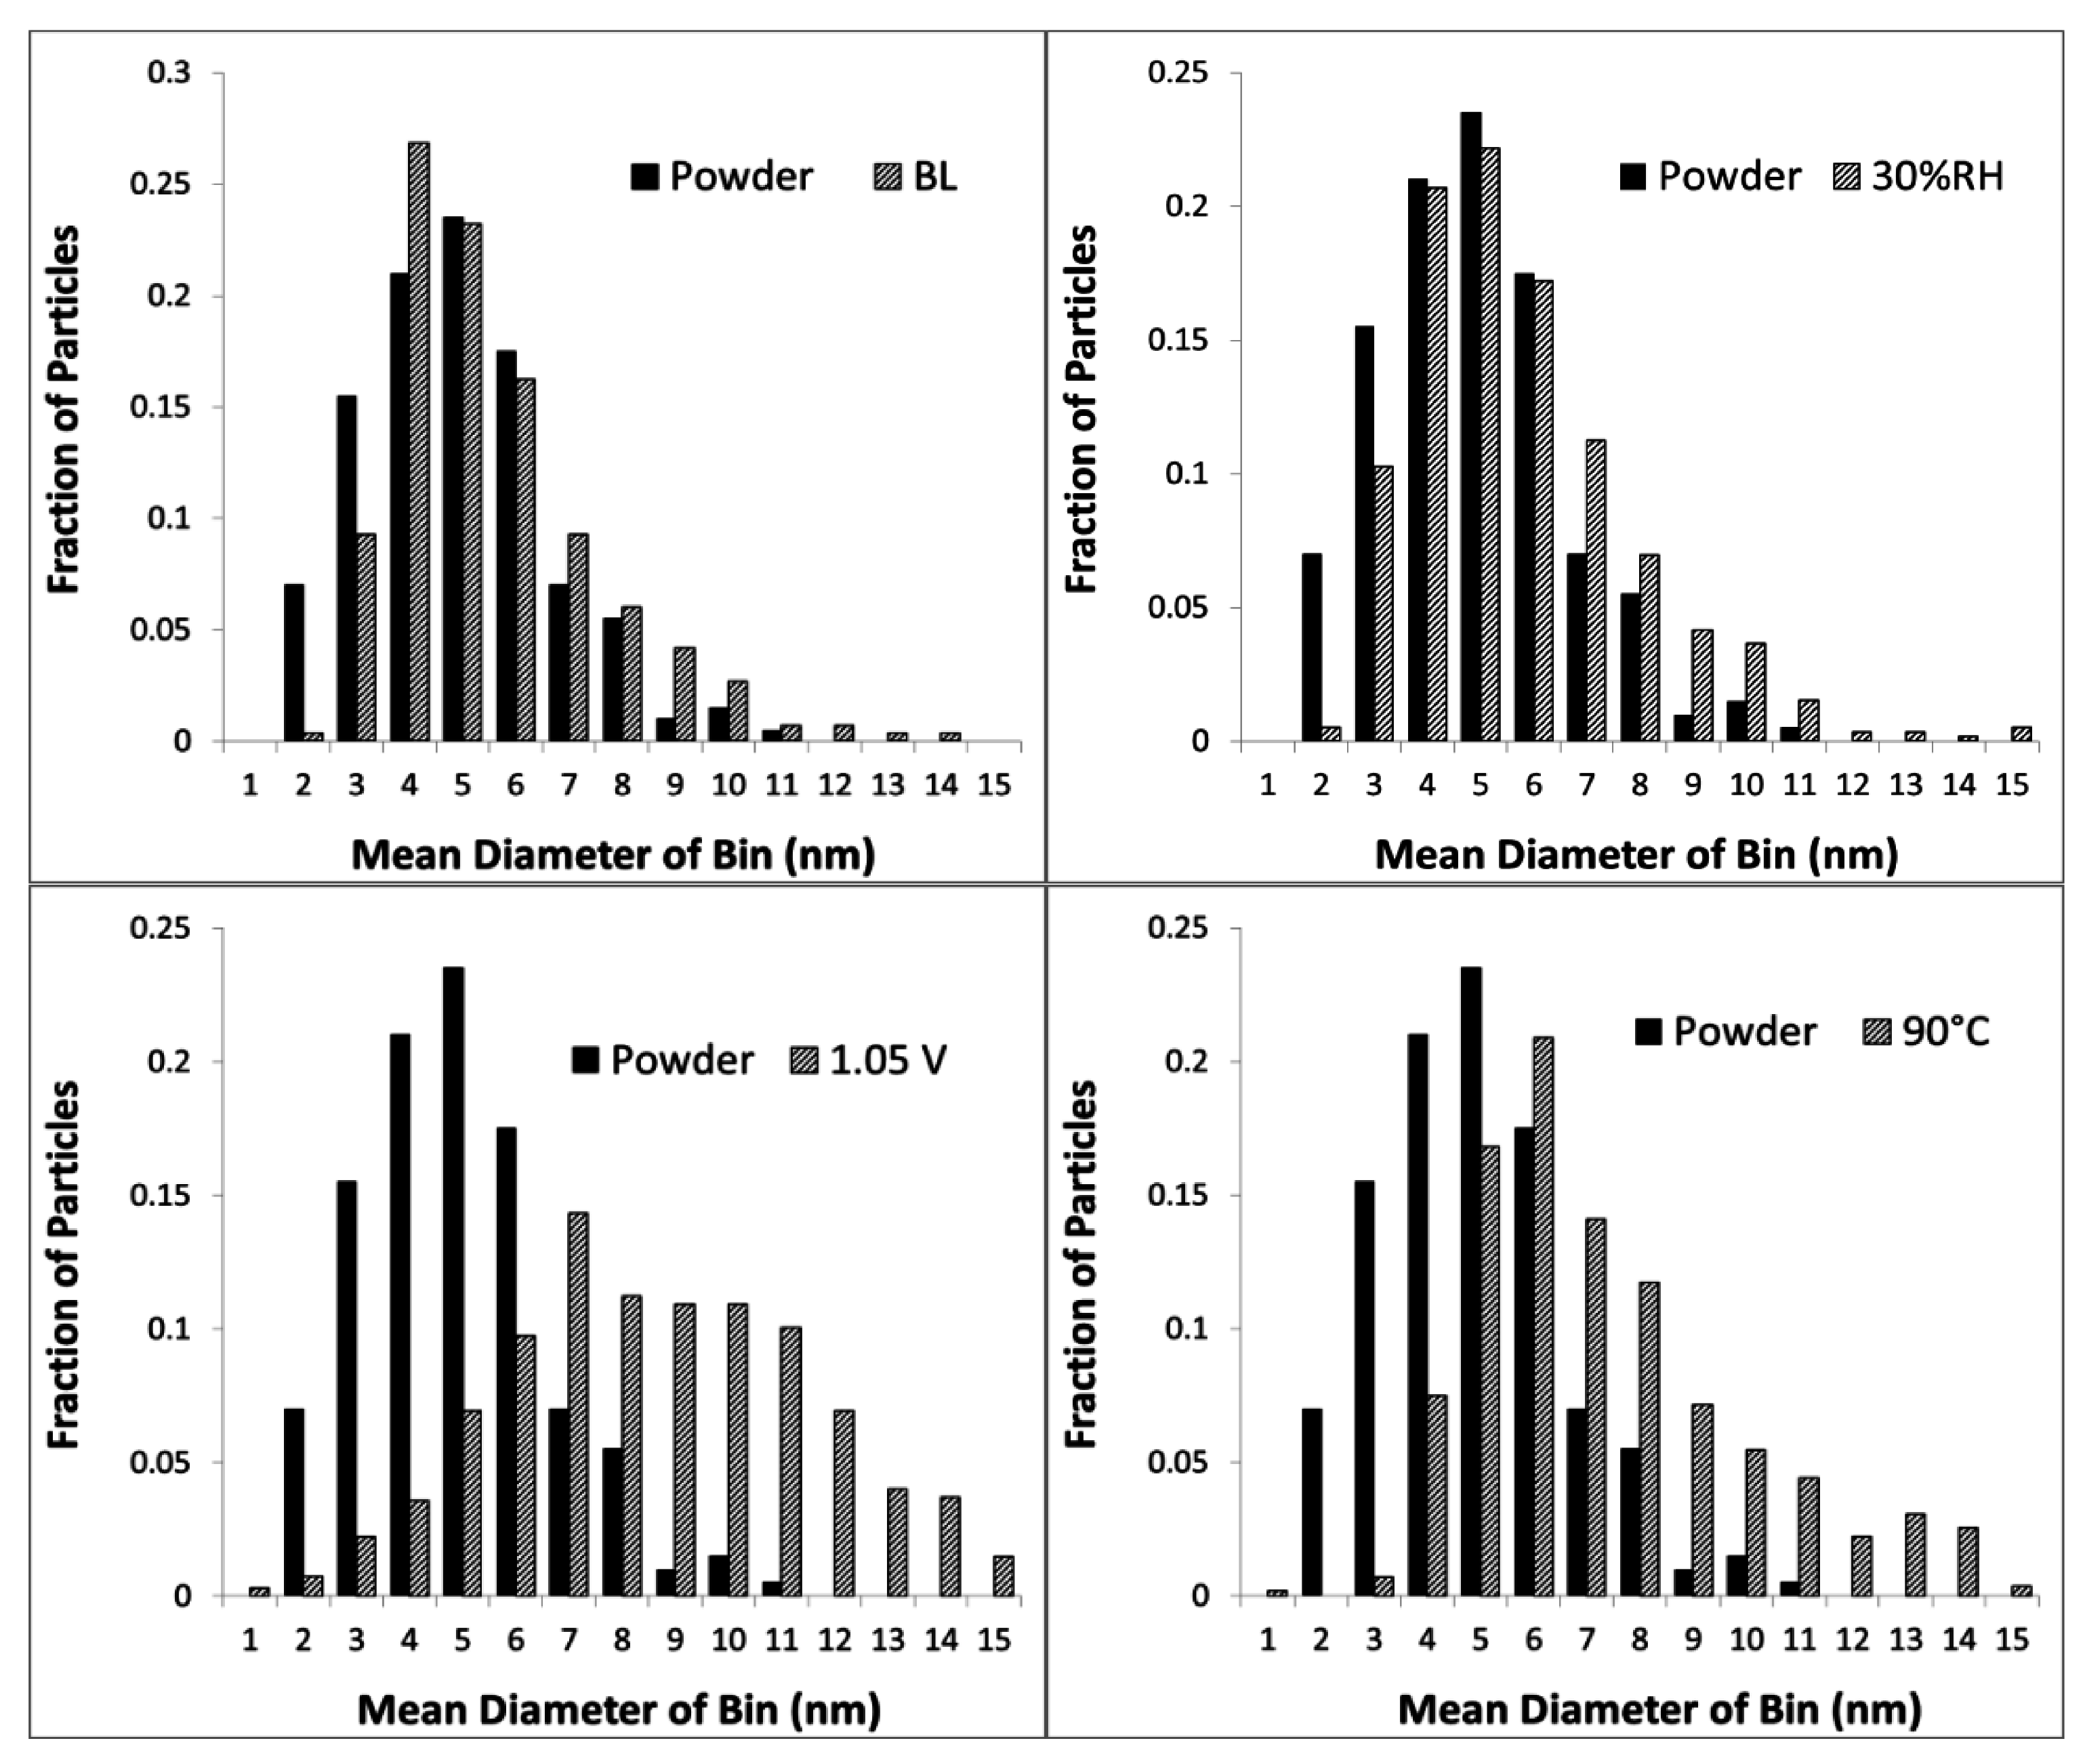
2.2. Impact of Operating Conditions on Cell Performance Degradation


| Cell # | Description | Pt/Co Ratio |
|---|---|---|
| 4 | Baseline (BL) | 7.8 |
| 5 | Lower RH (30% RH) | 6.6 |
| 6 | Higher Upper Potential (1.05 V) | 10.2 |
| 7 | Higher Temperature (90 °C) | 7.9 |
3. Experimental Section
3.1. Catalyst Preparation
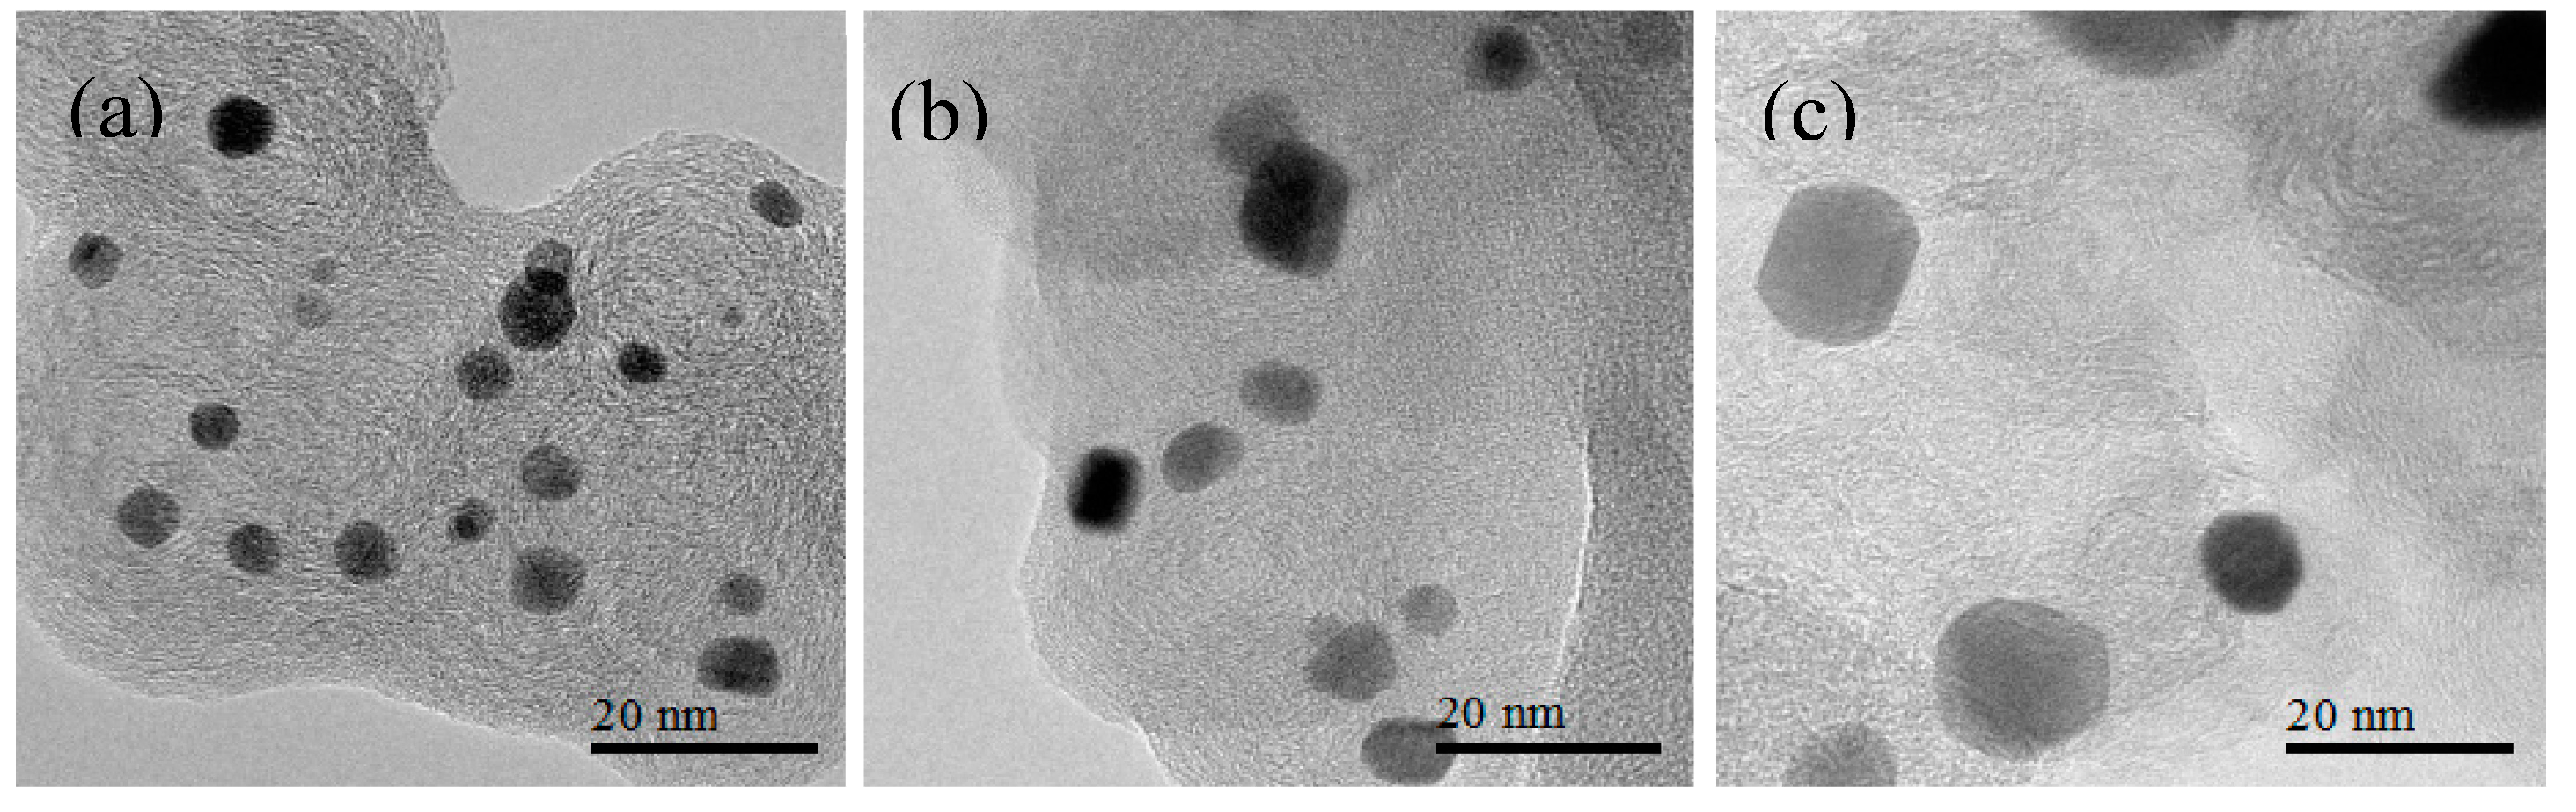
3.2. Transmission Electron Microscopy (TEM) Characterization of Pt3Co/C Catalysts Annealed to Various Particle Sizes
3.3. Membrane Electrode Assembly (MEA)
3.4. Fuel Cell Construction
3.5. Diagnostics and V-I Performance
3.6. Hydrogen Crossover
3.7. Electrochemically-Active Surface Area (ECA)
3.8. Cell Performance
3.9. Decay Protocol for Particle Size Studies
3.10. Decay Protocol for Parametric Studies
3.11. Electron MicroProbe Analysis (EMPA)
3.12. X-ray Fluorescence Analysis (XRF)
4. Conclusions
Acknowledgments
Author Contributions
Conflicts of Interest
References
- Ball, S.C.; Hudson, S.L.; Theobald, B.R.C.; Thompsett, D. PtCo, a Durable Catalyst for Automotive PEMFC. ECS Trans. 2007, 11, 1267–1278. [Google Scholar]
- Stamenkovic, V.R.; Mun, B.S.; Arenz, M.; Mayrhofer, K.J.J.; Lucas, C.A.; Wang, G.; Ross, P.N.; Markovic, N.M. Trends in Electrocatalysis on Extended and Nanoscale Pt-Bimetallic Alloy Surfaces. Nat. Mater. 2007, 6, 241–247. [Google Scholar] [CrossRef] [PubMed]
- Colón-Mercado, H.R.; Popov, B.N. Stability of Platinum Based Alloy Cathode Catalysts in PEM Fuel Cells. J. Power Sources 2006, 155, 253–263. [Google Scholar] [CrossRef]
- Stamenkovic, V.R.; Fowler, B.; Mun, B.S.; Wang, G.; Ross, P.N.; Lucas, C.A.; Markovic, N.M. Improved Oxygen Reduction Activity on Pt3Ni(111) via Increased Surface Site Availability. Science 2007, 315, 493–497. [Google Scholar] [CrossRef] [PubMed]
- Van der Vliet, D.F.; Wang, C.; Tripkovic, D.; Strmcnik, D.; Zhang, X.; Debe, M.K.; Atanasoski, R.T.; Markovic, N.M.; Stamenkovic, V.R. Mesostructured Thin Films as Electrocatalysts with Tunable Composition and Surface Morphology. Nat. Mater. 2012, 11, 1051–1058. [Google Scholar] [CrossRef] [PubMed]
- Wang, C.; van der Vliet, D.; Chang, K.; You, H.; Strmcnik, D.; Schlueter, J.A.; Markovic, N.M.; Stamenkovic, V.R. Monodisperse Pt3Co Nanoparticles as a Catalyst for the Oxygen Reduction Reaction: Size-Dependent Activity. J. Phys. Chem. 2009, 113, 19365–19368. [Google Scholar] [CrossRef]
- Paulusa, U.A.; Wokauna, A.; Scherera, G.G.; Schmidtb, T.J.; Stamenkovicb, V.; Markovicb, N.M.; Rossb, P.N. Oxygen Reduction on High Surface Area Pt-Based Alloy Catalysts in Comparison to Well Defined Smooth Bulk Alloy Electrodes. Electrochem. Acta 2002, 47, 3787–3798. [Google Scholar] [CrossRef]
- Huang, Y.; Zhang, J.; Kongkanand, A.; Wagner, F.T.; Li, J.C.M.; Jorné, J. Transient Platinum Oxide Formation and Oxygen Reduction on Carbon-Supported Platinum and Platinum-Cobalt Alloy Electrocatalysts. J. Electrochem. Soc. 2014, 161, F10–F15. [Google Scholar] [CrossRef]
- Stamenkovic, V.R.; Mun, B.S.; Mayrhofer, K.J.J.; Ross, P.N.; Markovic, N.M.; Rossmeisl, J.; Greeley, J.; Nørskov, J.K. Changing the Activity of Electrocatalysts for Oxygen Reduction by Tuning the Surface Electronic Structure. Angew. Chem. 2006, 45, 2897–2901. [Google Scholar] [CrossRef] [PubMed]
- Stamenkovic, V.R.; Mun, B.S.; Mayrhofer, K.J.J.; Ross, P.N.; Markovic, N.M. Effect of Surface Composition on Electronic Structure, Stability, and Electrocatalytic Properties of Pt-Transition Metal Alloys: Pt-Skin versus Pt-Skeleton Surfaces. J. Am. Chem. Soc. 2006, 128, 8813–8819. [Google Scholar] [CrossRef] [PubMed]
- Jalan, V.; Taylor, E.J. Importance of Interatomic Spacing in Catalytic Reduction of Oxygen in Phosphoric Acid. J. Electrochem. Soc. 1983, 130, 2299–2302. [Google Scholar] [CrossRef]
- Toda, T.; Igarashi, H.; Uchida, H.; Watanabe, M. Enhancement of the Electroreduction of Oxygen on Pt Alloys with Fe, Ni, and Co. J. Electrochem. Soc. 1999, 146, 3750–3756. [Google Scholar] [CrossRef]
- Min, M.K.; Cho, J.; Cho, K.; Kim, H. Particle size and Alloying Effects of Pt-Based Alloy Catalysts for Fuel Cell Applications. Electrochem. Acta 2000, 45, 4211–4217. [Google Scholar] [CrossRef]
- Mukerjee, S.; Srinivasan, S.; Soriaga, M.; McBreen, J. Role of Structural and Electronic Properties of Pt and Pt Alloys on Electrocatalysis of Oxygen Reduction an in situ XANES and EXAFS Investigation. J. Electrochem. Soc. 1995, 142, 1409–1422. [Google Scholar] [CrossRef]
- Roques, J.; Anderson, A.B.; Murthi, V.S.; Mukerjee, S. Potential Shift for OHads Formation on the Pt Skin on Pt3Co ( 111 ) Electrodes in Acid. J. Electrochem. Soc. 2005, 152, E193–E199. [Google Scholar] [CrossRef]
- Dubau, L.; Maillard, F.; Chatenet, M.; Guetaz, L.; André, J.; Rossinot, E. Durability of Pt3Co / C Cathodes in a 16 Cell PEMFC Stack: Macro/Microstructural Changes and Degradation Mechanisms. J. Electrochem. Soc. 2010, 157, B1887–B1895. [Google Scholar] [CrossRef]
- Dubaua, L.; Lopez-Haroa, M.; Castanheiraa, L.; Dursta, J.; Chateneta, M.; Bayle-Guillemaudb, P.; Guétazc, L.; Caquéd, N.; Rossinotd, E.; Maillard, F. Probing the Structure, the Composition and the ORR Activity of Pt3Co/C nanocrystallites during a 3422 h PEMFC Ageing Test. Appl. Catal. B 2013, 142–143, 801–808. [Google Scholar] [CrossRef]
- Chen, S.; Gasteiger, H.A.; Hayakawa, K.; Tada, T.; Yang, S. Platinum-Alloy Cathode Catalyst Degradation in Proton Exchange Membrane Fuel Cells: Nanometer-Scale Compositional and Morphological Changes. J. Electrochem. Soc. 2010, 157, A82–A97. [Google Scholar] [CrossRef]
- Shao, M.; Peles, A.; Shoemaker, K. Electrocatalysis on Platinum Nanoparticles: Particle Size Effect on Oxygen Reduction Reaction Activity. Nano Letters 2011, 11, 3714–3719. [Google Scholar] [CrossRef] [PubMed]
- Kinoshita, K. Particle Size Effects for Oxygen Reduction on Highly Dispersed Platinum in Acid Electrolytes. J. Electrochem. Soc. 1990, 137, 845–848. [Google Scholar] [CrossRef]
- Han, B.C.; Miranda, C.R.; Ceder, G. Effect of Particle Size and Surface Structure on Adsorption of O and OH on Platinum Nanoparticles: A First-Principles Study. Phys. Rev. 2008, B77, 075410. [Google Scholar] [CrossRef]
- Tritsaris, G.A.; Greeley, J.; Rossmeisl, J.; Nørskov, J.K. Atomic-Scale Modeling of Particle Size Effects for the Oxygen Reduction Reaction on Pt. Catal. Lett. 2011, 141, 909–913. [Google Scholar] [CrossRef]
- Wang, D.; Xin, H.L.; Hovden, R.; Wang, H.; Yu, Y.; Muller, D.A.; DiSalvo1, F.J.; Abruña, H.D. Structurally Ordered Intermetallic Platinum-Cobalt Core-Shell Nanoparticles with Enhanced Activity and Stability as Oxygen Reduction Electrocatalysts. Nat. Mater. 2013, 12, 81–87. [Google Scholar] [CrossRef] [PubMed]
- Chen, S.; Sheng, W.; Yabuuchi, N.; Ferreira, P.J.; Allard, L.F.; Yang, S. Origin of Oxygen Reduction Reaction Activity on “Pt3Co” Nanoparticles: Atomically Resolved Chemical Compositions and Structures. J. Phys. Chem. C 2009, 113, 1109–1125. [Google Scholar] [CrossRef]
- Gasteiger, H.A.; Kocha, S.S.; Sompalli, B.; Wagner, F.T. Activity Benchmarks and Requirements for Pt, Pt-Alloy, and Non-Pt Oxygen Reduction Catalysts for PEMFCs. Appl. Catal. B 2005, 56, 9–35. [Google Scholar] [CrossRef]
- Nesselberger, M.; Ashton, S.; Meier, J.C.; Katsounaros, I.; Mayrhofer, K.J.J.; Arenz, M. The Particle Size Effect on the Oxygen Reduction Rreaction Activity of Pt Catalysts: Influence of Electrolyte and Relation to Single Crystal Models. J. Am. Chem. Soc. 2011, 133, 17428–17433. [Google Scholar] [CrossRef] [PubMed]
- Mayrhofer, K.J.J.; Blizanac, B.B.; Arenz, M.; Stamenkovic, V.R.; Ross, P.N.; Markovic, N.M. The Impact of Geometric and Surface Electronic Properties of Pt-Catalysts on the Particle Size Effect in Electrocatalysis. J. Phys. Chem. B 2005, 109, 14433–14440. [Google Scholar] [CrossRef] [PubMed]
- Aindow, T.T.; Bi, W.; Izzo, E.; Motupally, S.; Murthi, V.S.; Perez-Acosta, C. Structure-Activity-Durability relationship of Pt and Pt based Alloy Electrocatalysts. In Proceedings of 215th Meeting of the Electrochemical Society, San Francisco, CA, USA, 24–29 May 2009.
- Bi, W.; Izzo, E.; Murthi, V.S.; Perez-Acosta, C.; Lisitano, J.; Protsailo, L.V. Durability of Low Temperature Hydrogen PEM Fuel Cells with Pt and Pt Alloy ORR Catalysts. In Proceedings of 218th Meeting of the Electrochemical Society, Las Vegas, NV, USA, 10–15 October 2010.
- Matsutani, K.; Hayakawa, K.; Tada, T. Effect of Particle Size of Platinum and Platinum-Cobalt Catalysts on Stability against Load Cycling. Platin. Met. Rev. 2010, 54, 223–232. [Google Scholar] [CrossRef]
- Strasser, P.; Koh, S.; Anniyev, T.; Greeley, J.; More, K.; Yu, C.; Liu, Z.; Kaya, S.; Nordlund, D.; Ogasawara, H.; Toney, M.F.; Nilsson, A. Lattice-Strain Control of the Activity in Dealloyed Core-Shell Fuel Cell Catalysts. Nat. Chem. 2010, 2, 454–460. [Google Scholar] [CrossRef] [PubMed]
- Adzic, R.R.; Zhang, J.; Sasaki, K.; Vukmirovic, M.B.; Shao, M.; Wang, J.X.; Nilekar, A.U.; Mavrikakis, M.; Valerio, J.A.; Uribe, F. Platinum Monolayer Fuel Cell Electrocatalysts. Top. Catal. 2007, 46, 249–262. [Google Scholar] [CrossRef]
- Vukmirovic, M.B.; Zhang, J.; Sasaki, K.; Uribe, F.; Mavrikakis, M.; Adzic, R.R. Platinum Monolayer Electrocatalysts for Oxygen Reduction. Electrochem. Acta 2007, 52, 2257–2263. [Google Scholar] [CrossRef]
- Sasaki, K.; Wang, J.X.; Naohara, H.; Marinkovic, N.; More, K.; Inada, H.; Adzic, R.R. Recent Advances in Platinum Monolayer Electrocatalysts for Oxygen Reduction Reaction: Scale-up Synthesis, Structure and Activity of Pt Shells on Pd Cores. Electrochem. Acta 2010, 55, 2645–2652. [Google Scholar] [CrossRef]
- Yang, Z.; Ball, S.C.; Condit, D.A.; Gummalla, M. Systematic Study on the Impact of Pt Particle Size and Operating Conditions on PEMFC Cathode Catalyst Durability. J. Electrochem. Soc. 2011, 158, B1439–B1445. [Google Scholar] [CrossRef]
- Carter, R.N.; Kocha, S.S.; Wagner, F.; Fay, M.; Gasteiger, H.A. Artifacts in Measuring Electrode Catalyst Area of Fuel Cells through Cyclic Voltammetry. ECS Trans. 2007, 11, 403–410. [Google Scholar]
- Shao, M.; Odell, J.H.; Choi, S.; Xia, Y. Electrochemical Surface Area Measurements of Platinum- and Palladium-Based Nanoparticles. Electrochem. Commun. 2013, 31, 46–48. [Google Scholar] [CrossRef]
- Van der Vliet, D.F.; Wang, C.; Li, D.; Paulikas, A.P.; Greeley, J.; Rankin, R.B.; Strmcnik, D.; Tripkovic, D.; Markovic, N.M.; Stamenkovic, V.R. Unique Electrochemical Adsorption Properties of Pt-Skin Surfaces. Angew. Chem. 2012, 51, 3139–3142. [Google Scholar] [CrossRef] [PubMed]
- Yan, Q.; Wu, J. Modeling of Single Catalyst Particle in Cathode of PEM Fuel Cells. Energy Convers. Manage. 2008, 49, 2425–2433. [Google Scholar] [CrossRef]
- Greszler, T.A.; Moylan, T.E.; Gasteiger, H.A. Modeling the Impact of Cation Contamination in a Polymer Electrolyte Membrane Fuel Cell. In Handbook of Fuel Cells—Fundamentals, Technology and Applications; John Wiley & Sons Ltd.: Chichester, UK, 2009. [Google Scholar]
- Chen, S.; Ferreira, P.J.; Sheng, W.; Yabuuchi, N.; Allard, L.; Yang, S. Enhanced Activity for Oxygen Reduction Reaction on “Pt3Co” Nanoparticles: Direct Evidence of Percolated and Sandwich-Segregation Structures. J. Am. Chem. Soc. 2008, 130, 13818–13819. [Google Scholar] [CrossRef] [PubMed]
- Carlton, C.E.; Chen, S.; Ferreira, P.J.; Allard, L.F.; Yang, S. Sub-Nanometer-Resolution Elemental Mapping of “Pt3Co” Nanoparticle Catalyst Degradation in Proton-Exchange Membrane Fuel Cells. J. Phys. Chem. Lett. 2012, 3, 161–166. [Google Scholar] [CrossRef]
- Yang, S.; Sheng, W.C.; Chen, S.; Ferreira, P.J.; Holby, E.F.; Morgan, D. Instability of Supported Platinum Nanoparticles in Low-Temperature Fuel Cells. Top. Catal. 2007, 46, 285–305. [Google Scholar]
- Kinoshita, K.; Lundquist, J.T.; Stonehart, P.J. Potential Cycling Effects on Platinum Electrocatalyst Surfaces. J. Electroanal. Chem. Interfacial Electrochem. 1973, 48, 157–166. [Google Scholar] [CrossRef]
- Rand, D.A.J.; Woods, R.J. A Study of the Dissolution of Platinum, Palladium, Rhodium and Gold Electrodes in 1 m Sulphuric Acid by Cyclic Voltammetry. J. Electroanal. Chem. Interfacial Electrochem. 1972, 35, 209–218. [Google Scholar] [CrossRef]
- Wang, X.; Myers, D.J.; Kariuki, N.; Kumar, R. Dissolution of Platinum and Platinum Alloy PEFC Cathode Electrocatalysts. In Proceedings of 211th Meeting of the Electrochemical Society, Chicago, Illinois, USA, 6–10 May 2007.
- Wang, X.; Myers, D.J.; Smith, M.C.; Mawdsley, J.; Kumar, R. Dissolution of Platinum-based PEFC Cathode Electrocatalysts. In Proceedings of 214th Meeting of the Electrochemical Society, Honolulu, HI, USA, 12–17 October 2008.
- Teliska, M.; O’Grady, W.E.; Ramaker, D.E. Determination of O and OH Adsorption Sites and Coverage in situ on Pt Electrodes from PtL23 X-ray Absorption Spectroscopy. J. Phys. Chem. B 2005, 109, 8076–8084. [Google Scholar] [PubMed]
- Imai, H.; Izumi, K.; Matsumoto, M.; Kubo, Y.; Kato, K.; Imai, Y. In situ and Real-Time Monitoring of Oxide Growth in a Few Monolayers at Surfaces of Platinum Nanoparticles in Aqueous Media. J. Am. Chem. Soc. 2009, 131, 6293–6300. [Google Scholar] [CrossRef] [PubMed]
- Groom, D.J. The Effect of Nanocatalyst Size on Performance and Degradation in the Cathode of Proton Exchange Membrane Fuel Cells. M.S. Thesis, University of Texas at Austin, December 2011. [Google Scholar]
© 2015 by the authors; licensee MDPI, Basel, Switzerland. This article is an open access article distributed under the terms and conditions of the Creative Commons Attribution license (http://creativecommons.org/licenses/by/4.0/).
Share and Cite
Gummalla, M.; Ball, S.C.; Condit, D.A.; Rasouli, S.; Yu, K.; Ferreira, P.J.; Myers, D.J.; Yang, Z. Effect of Particle Size and Operating Conditions on Pt3Co PEMFC Cathode Catalyst Durability. Catalysts 2015, 5, 926-948. https://doi.org/10.3390/catal5020926
Gummalla M, Ball SC, Condit DA, Rasouli S, Yu K, Ferreira PJ, Myers DJ, Yang Z. Effect of Particle Size and Operating Conditions on Pt3Co PEMFC Cathode Catalyst Durability. Catalysts. 2015; 5(2):926-948. https://doi.org/10.3390/catal5020926
Chicago/Turabian StyleGummalla, Mallika, Sarah C. Ball, David A. Condit, Somaye Rasouli, Kang Yu, Paulo J. Ferreira, Deborah J. Myers, and Zhiwei Yang. 2015. "Effect of Particle Size and Operating Conditions on Pt3Co PEMFC Cathode Catalyst Durability" Catalysts 5, no. 2: 926-948. https://doi.org/10.3390/catal5020926