
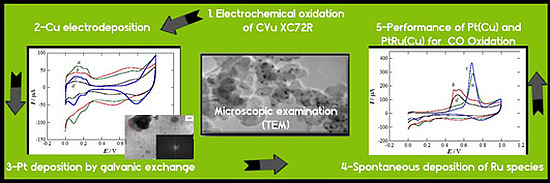
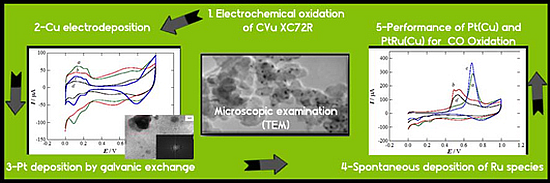
Electrochemical Oxidation of the Carbon Support to Synthesize Pt(Cu) and Pt-Ru(Cu) Core-Shell Electrocatalysts for Low-Temperature Fuel Cells

Abstract
:
1. Introduction

2. Results and Discussion
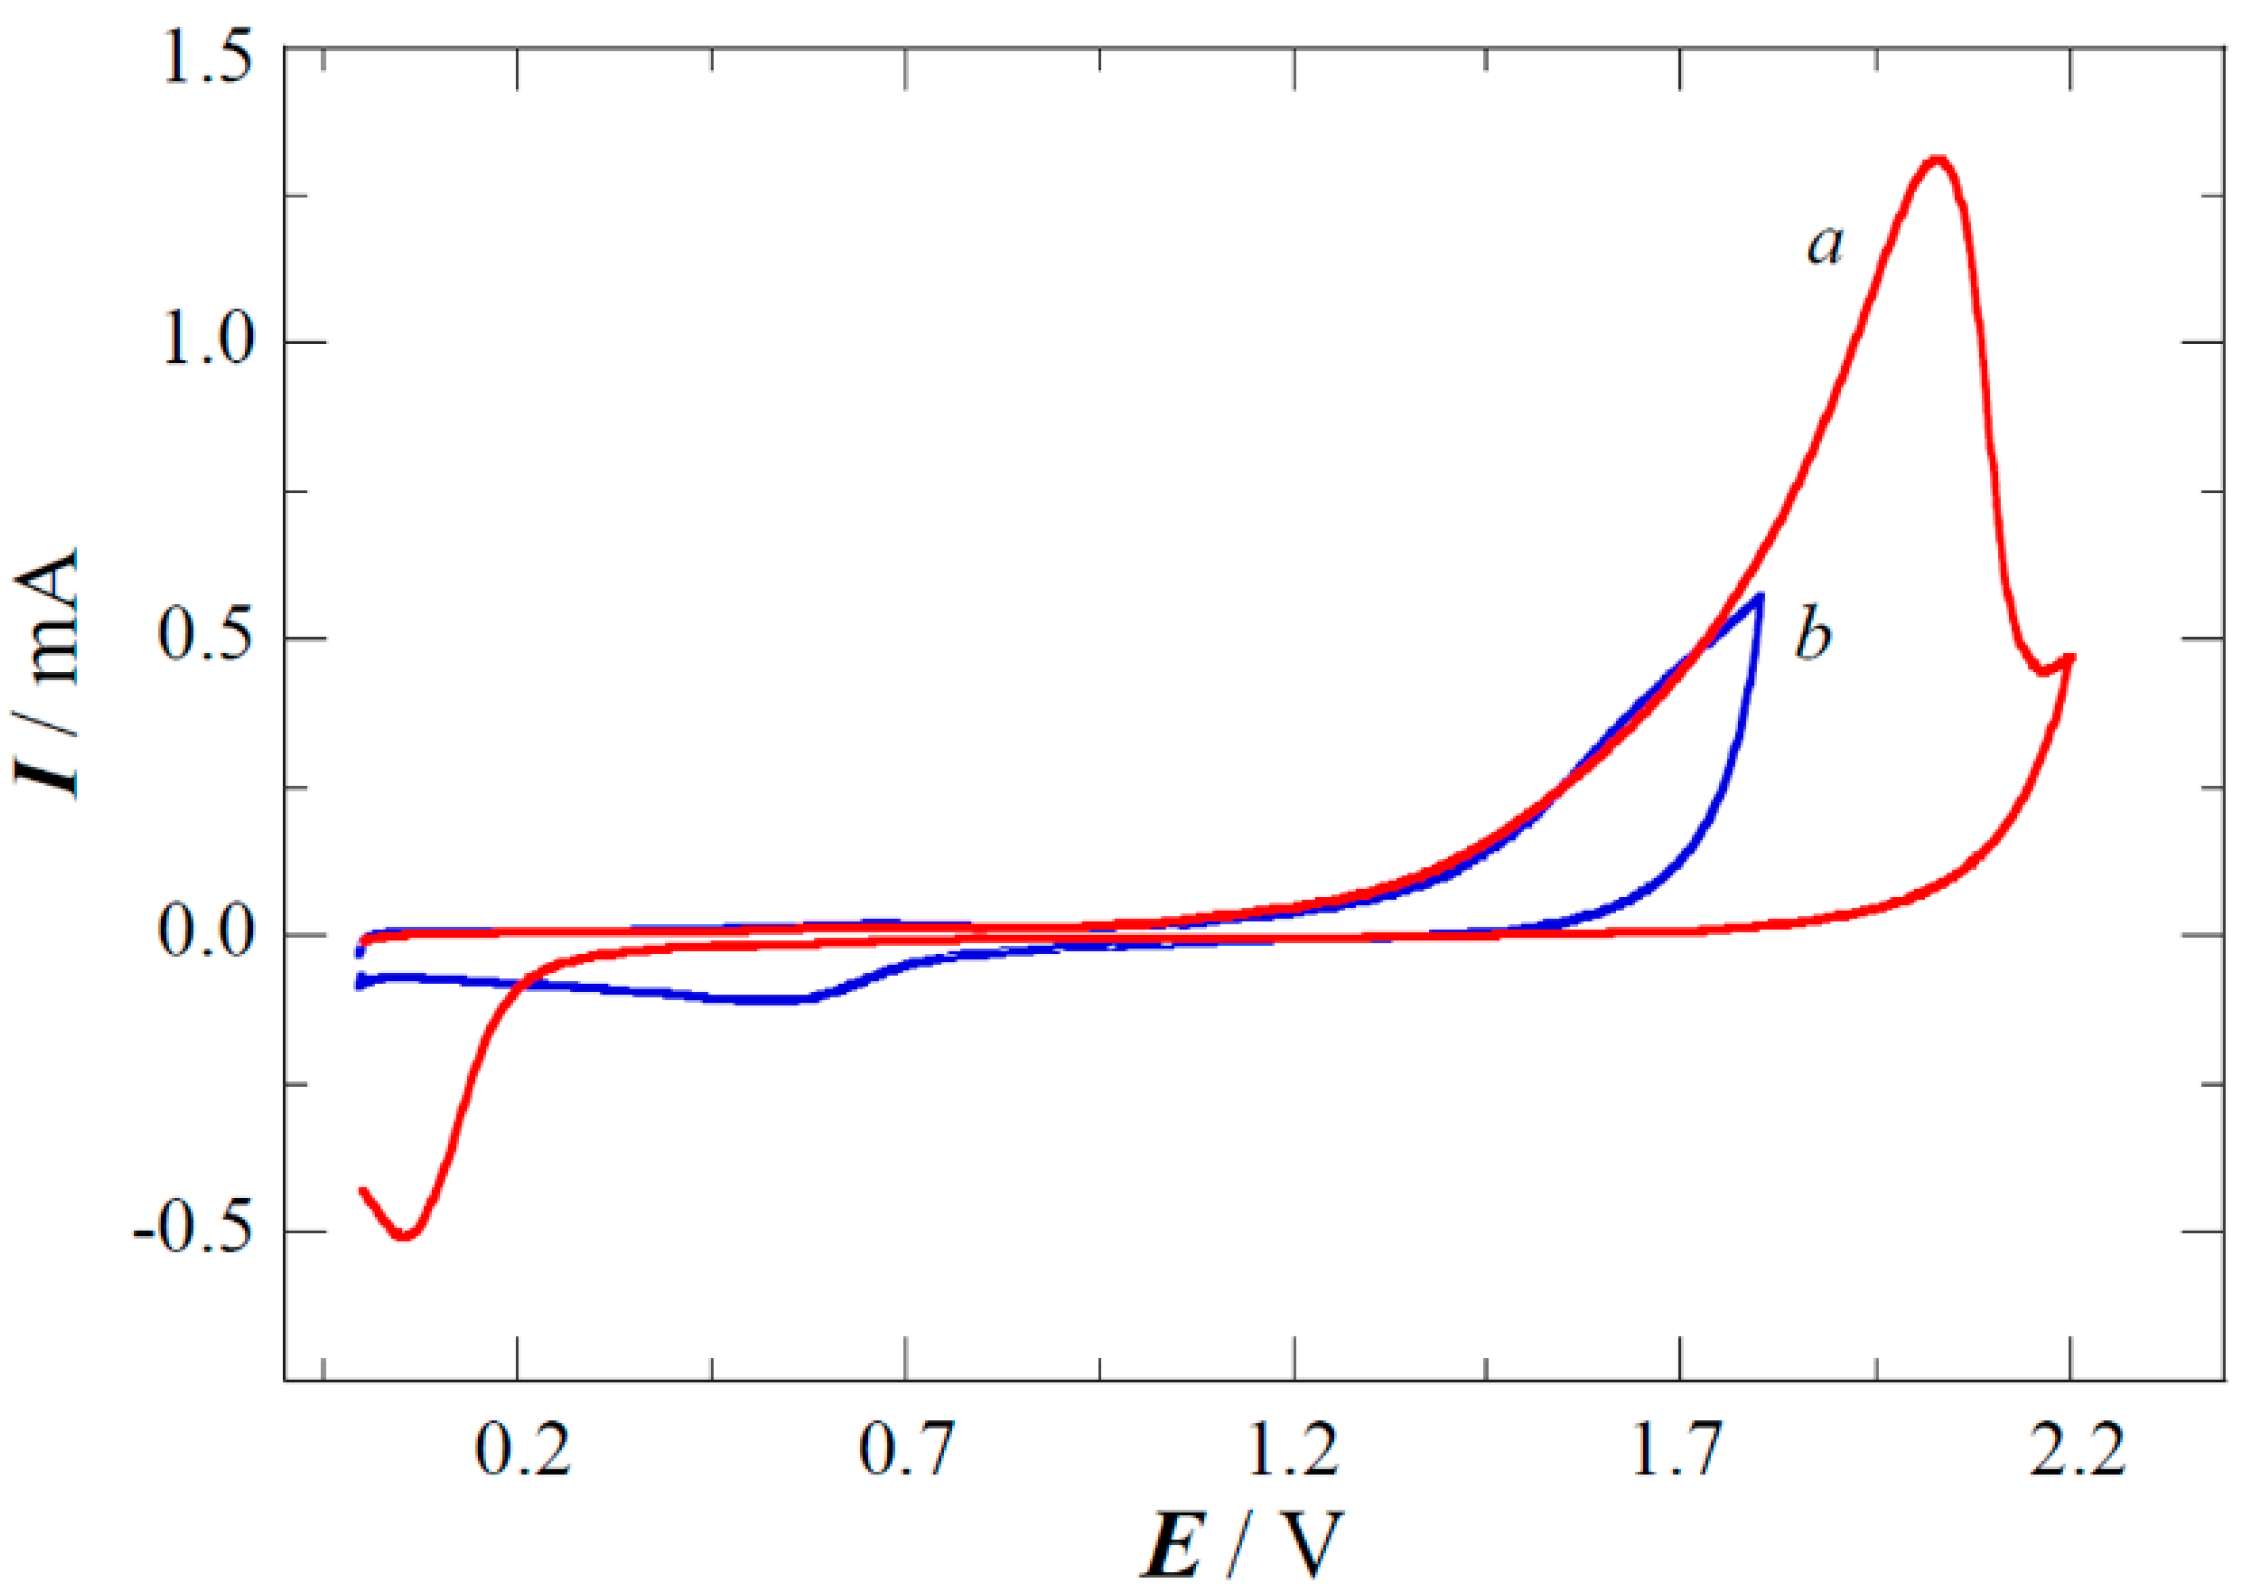
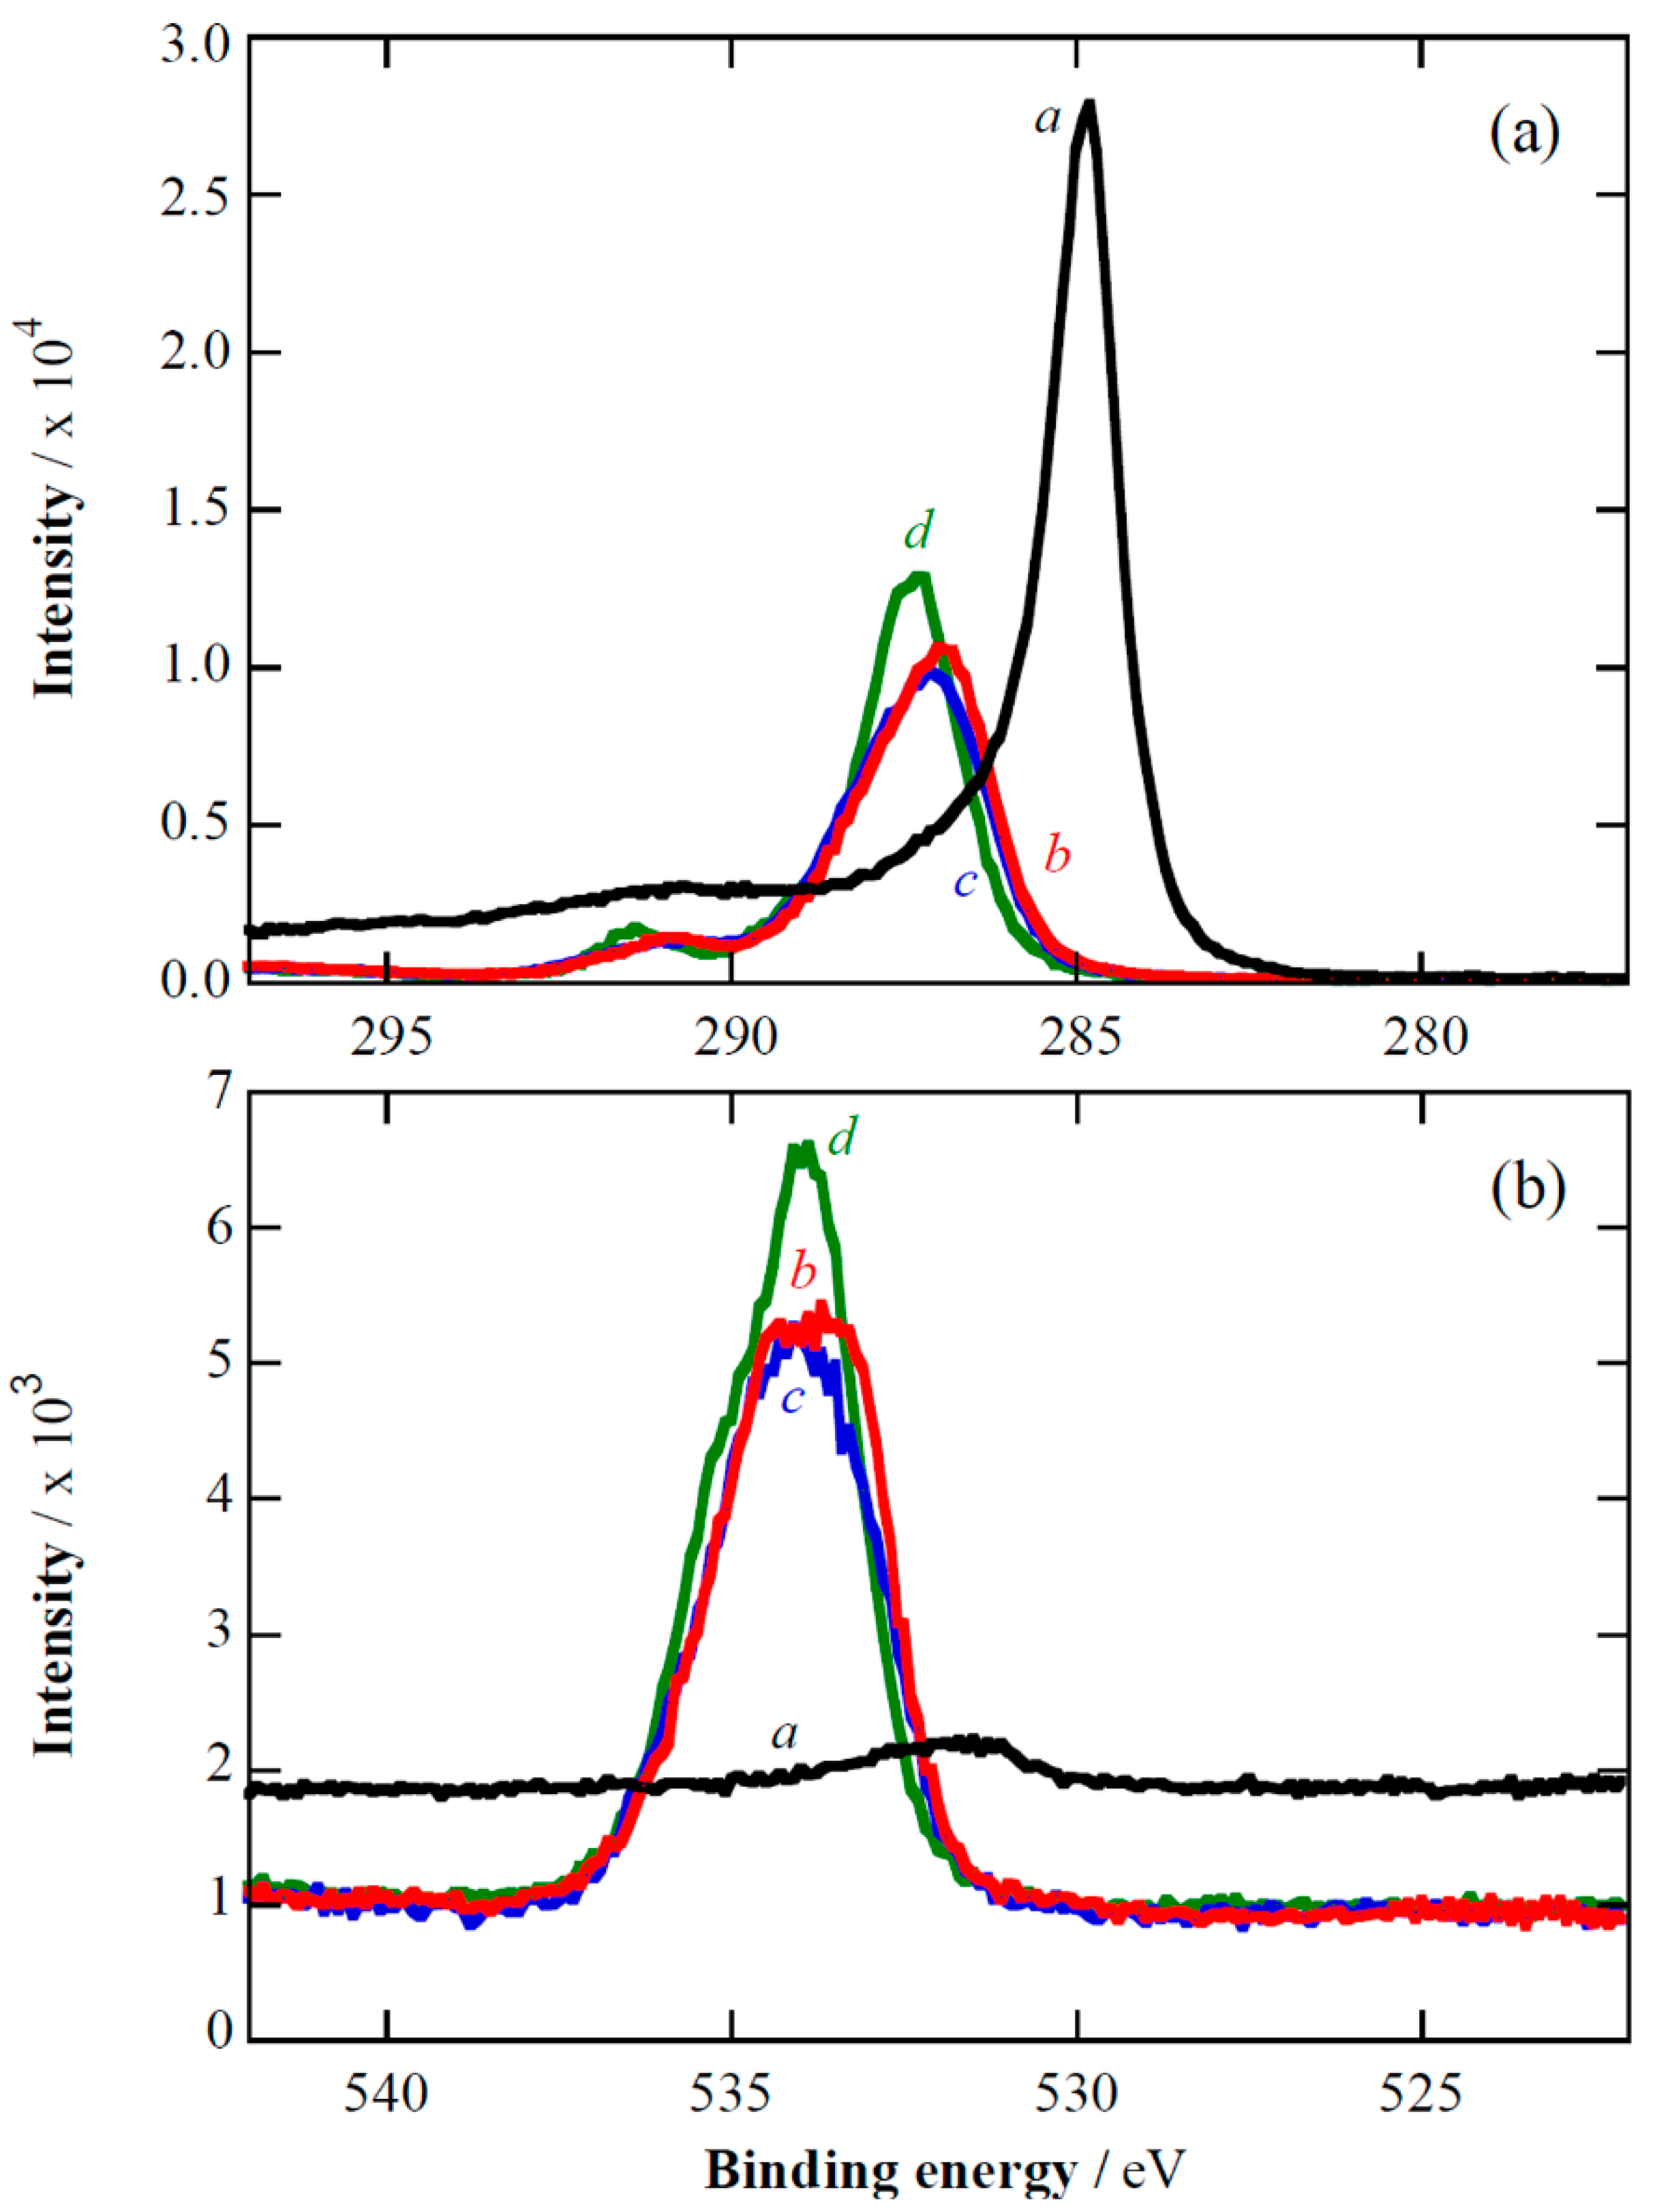
2.1. XPS Analyses and Electrochemical Testing of Carbon Oxidation


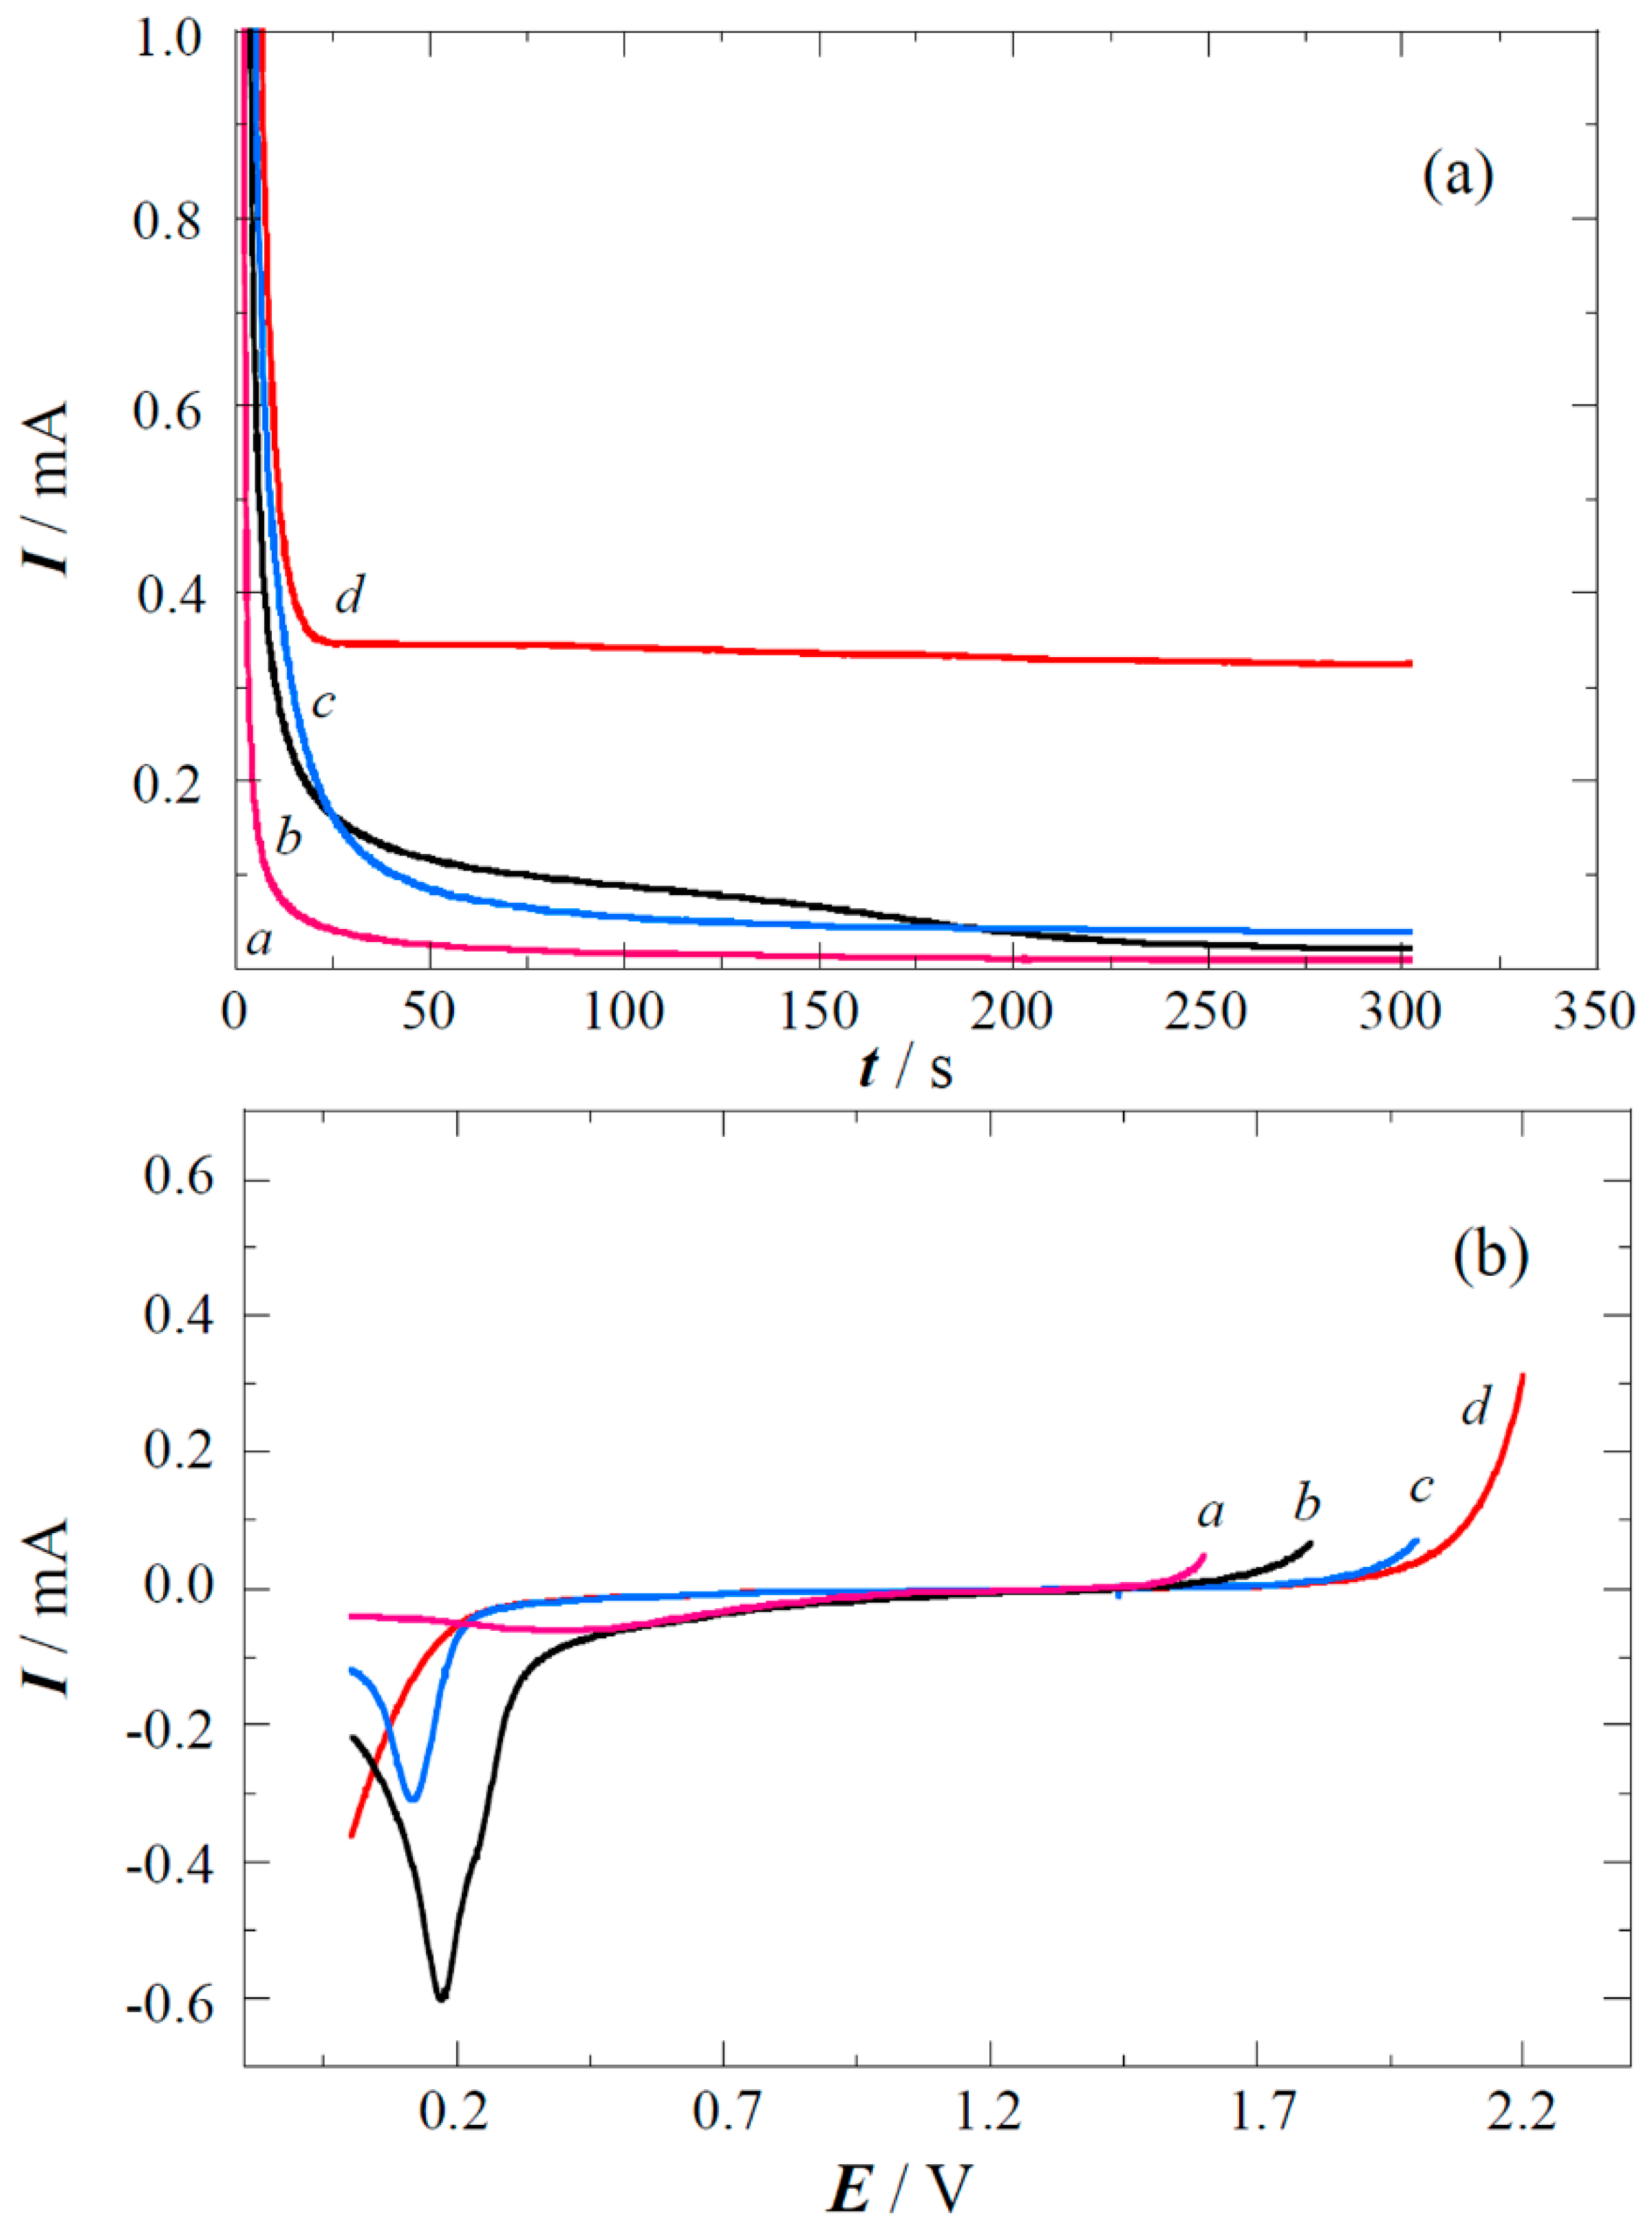
2.2. Copper Electrodeposition on the Oxidized Carbon
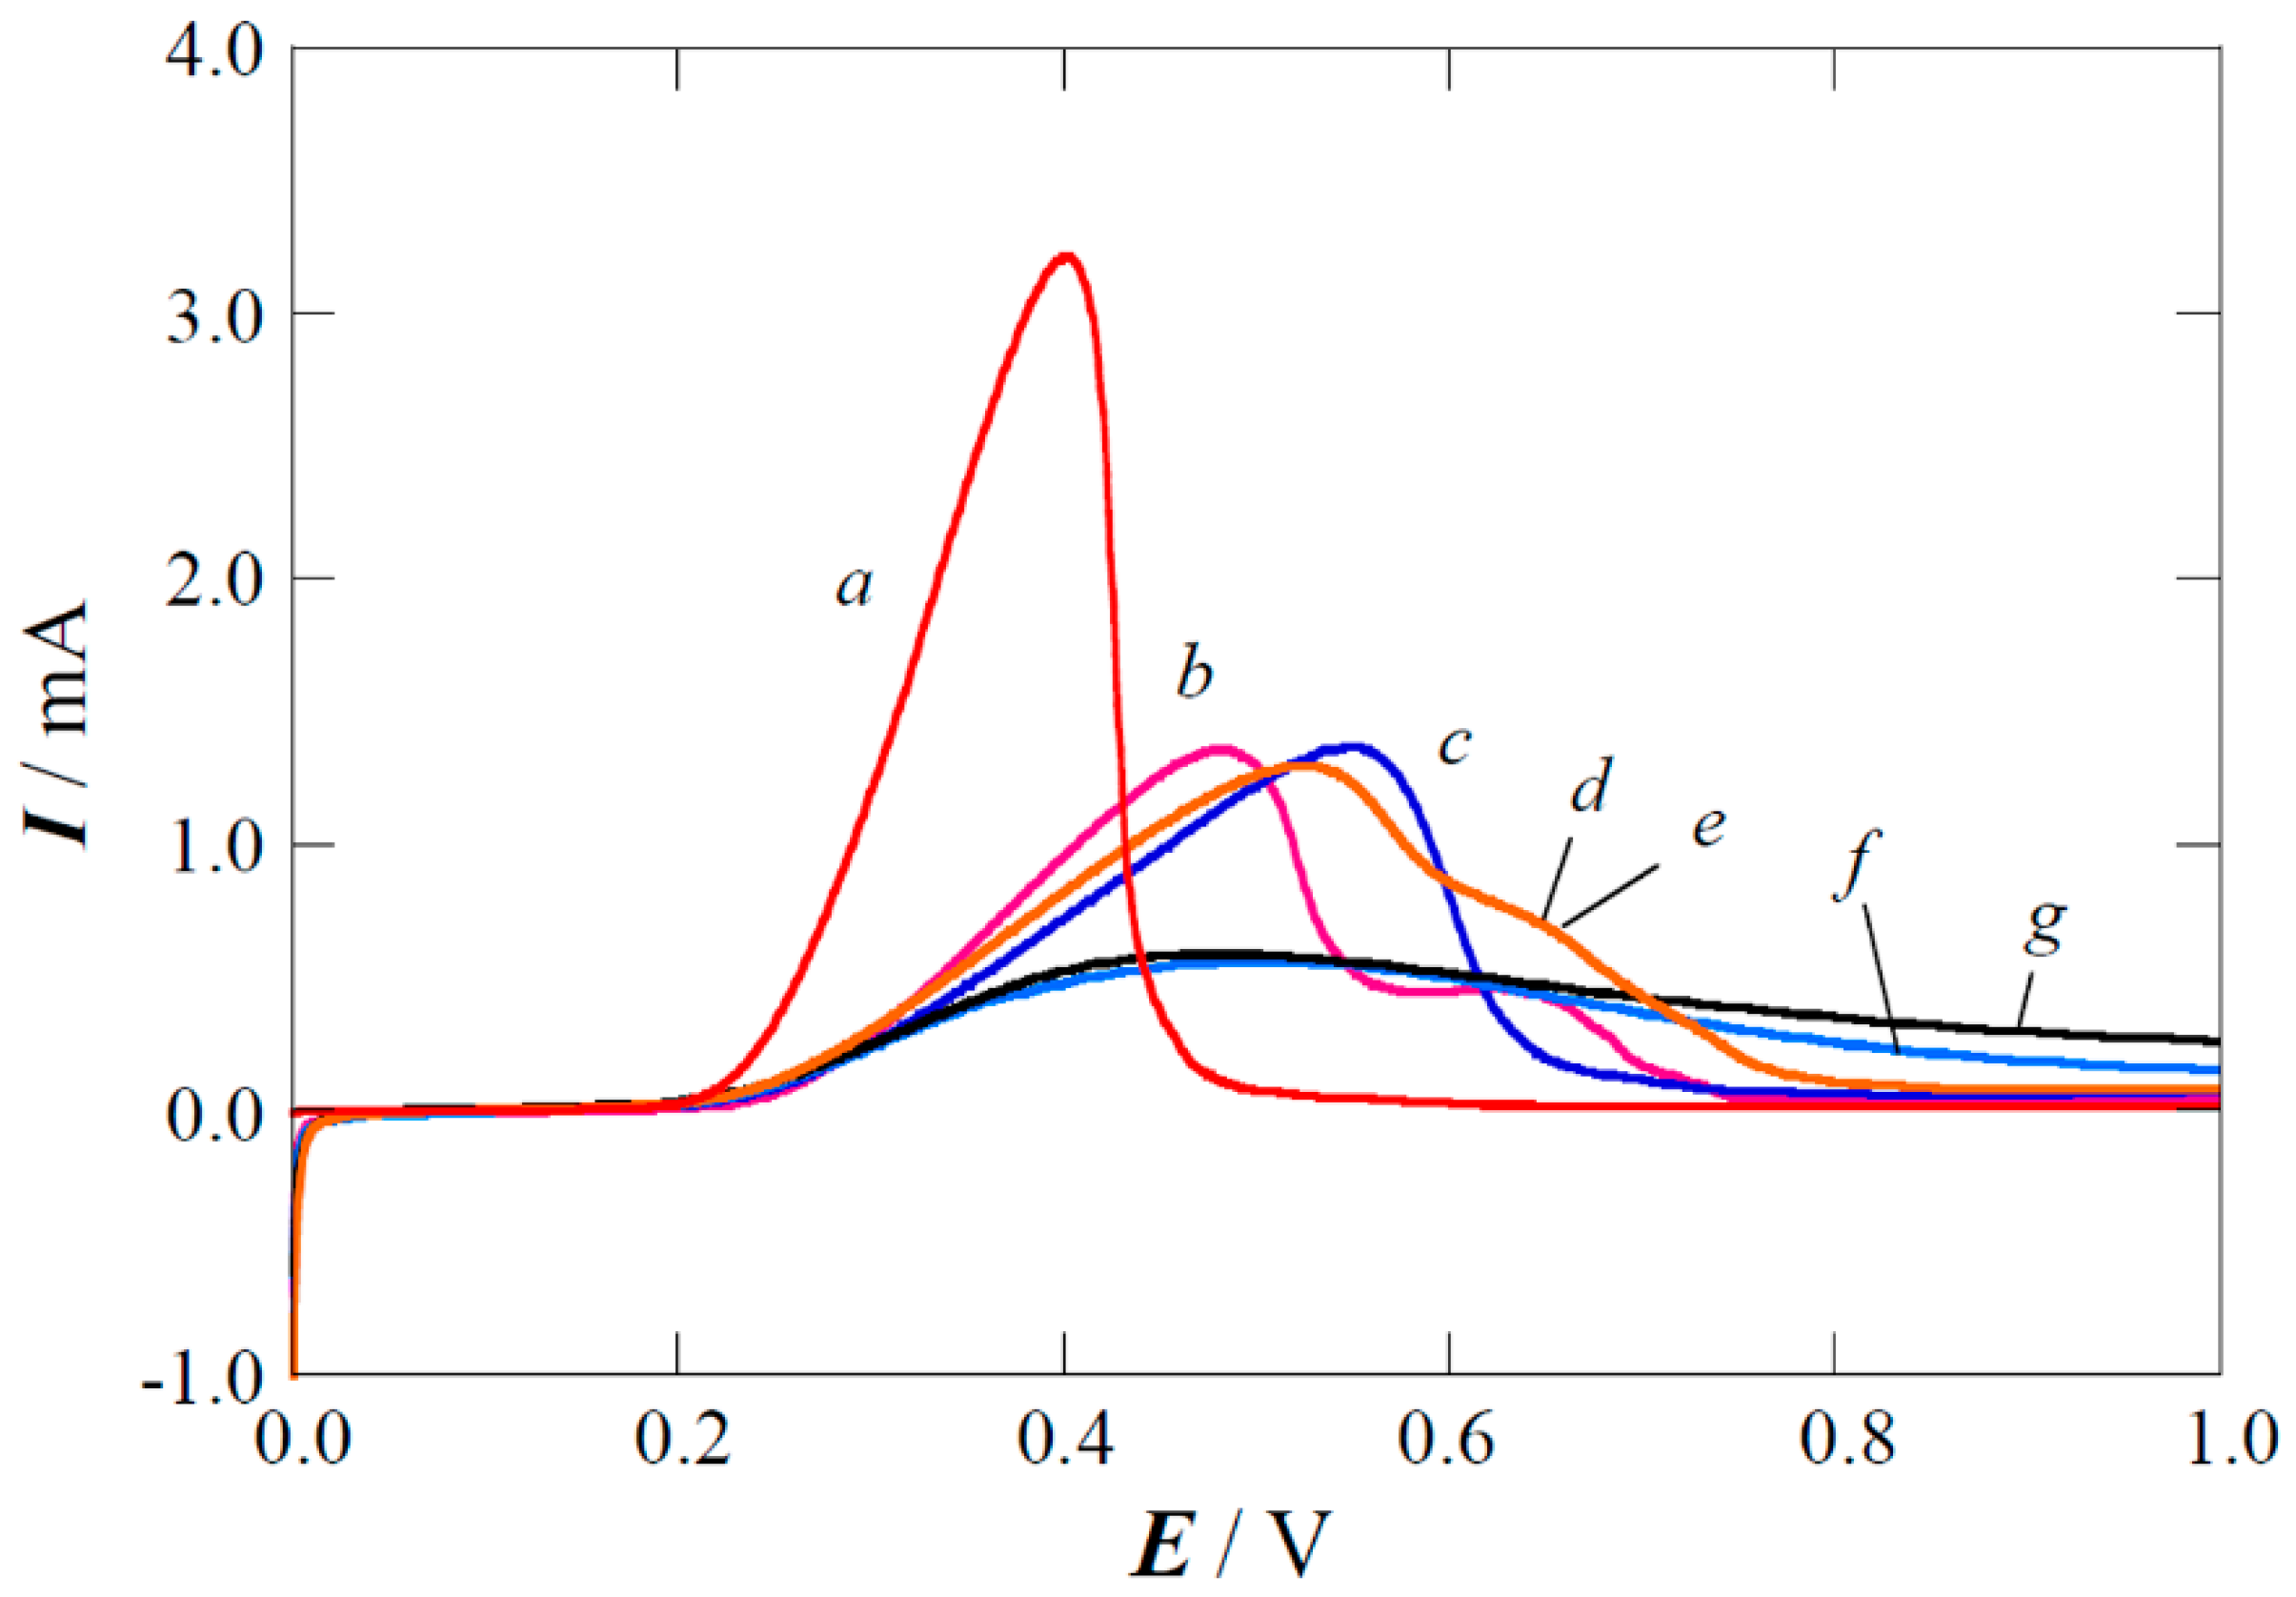
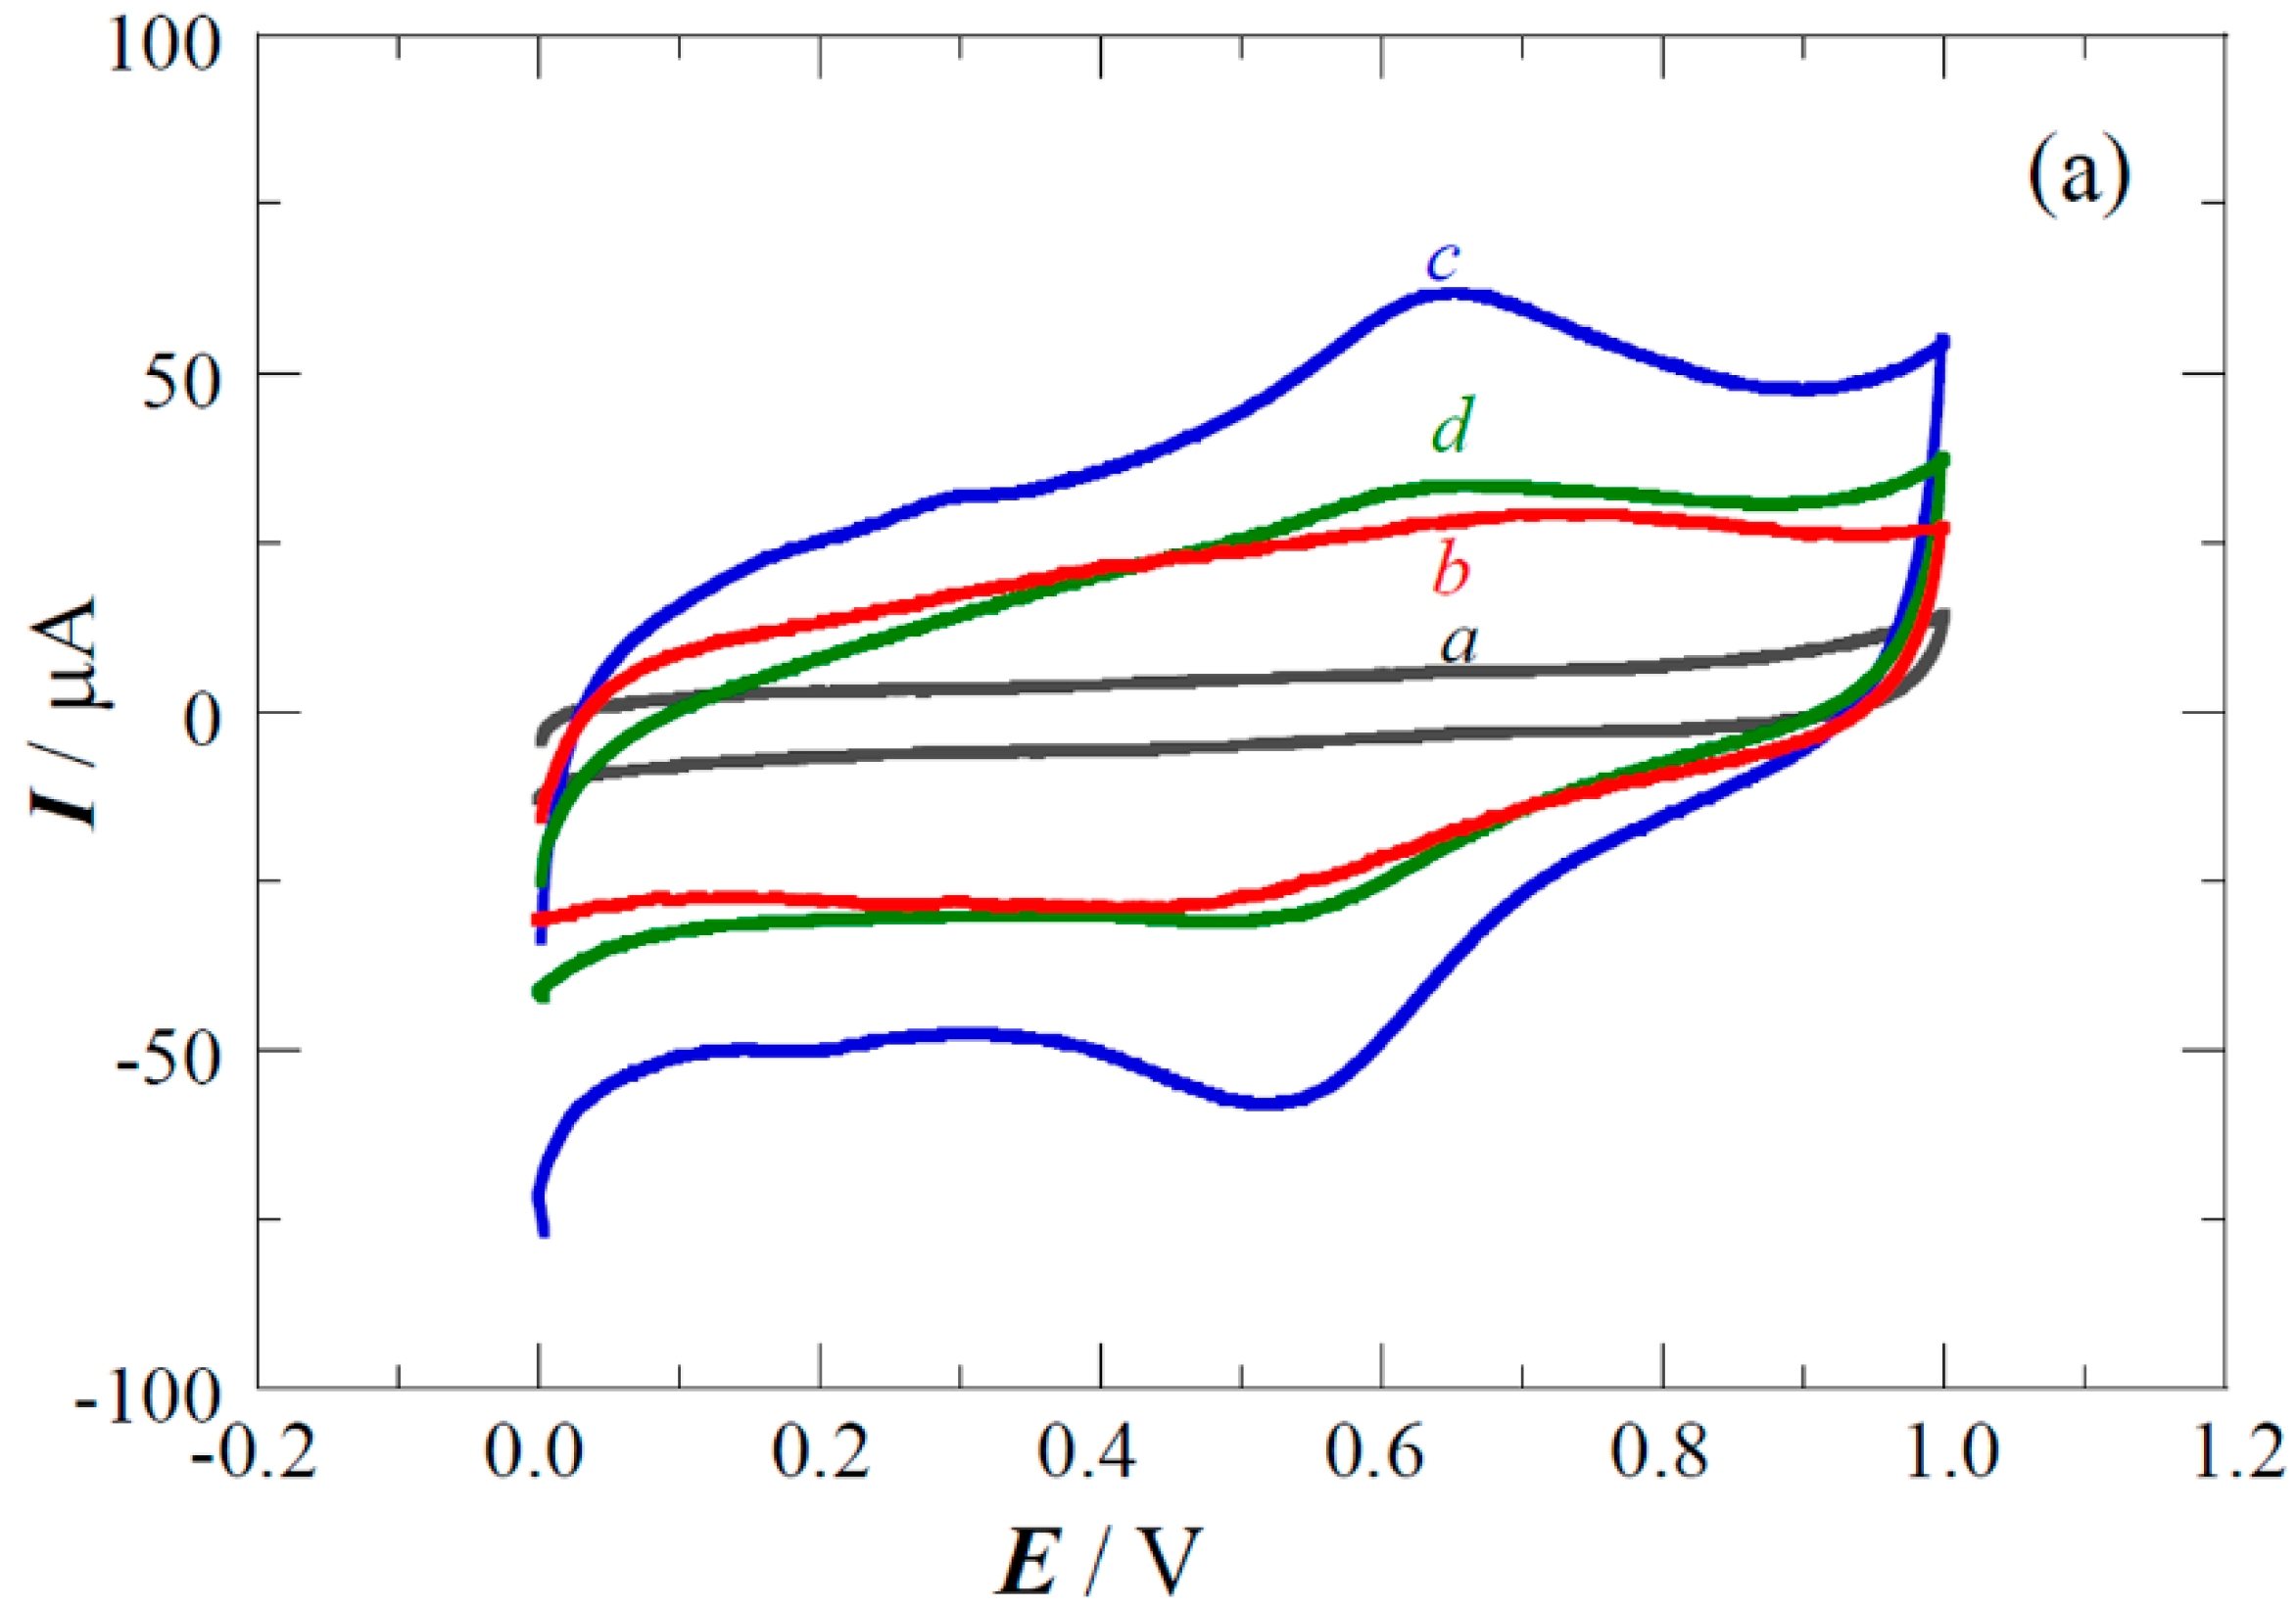
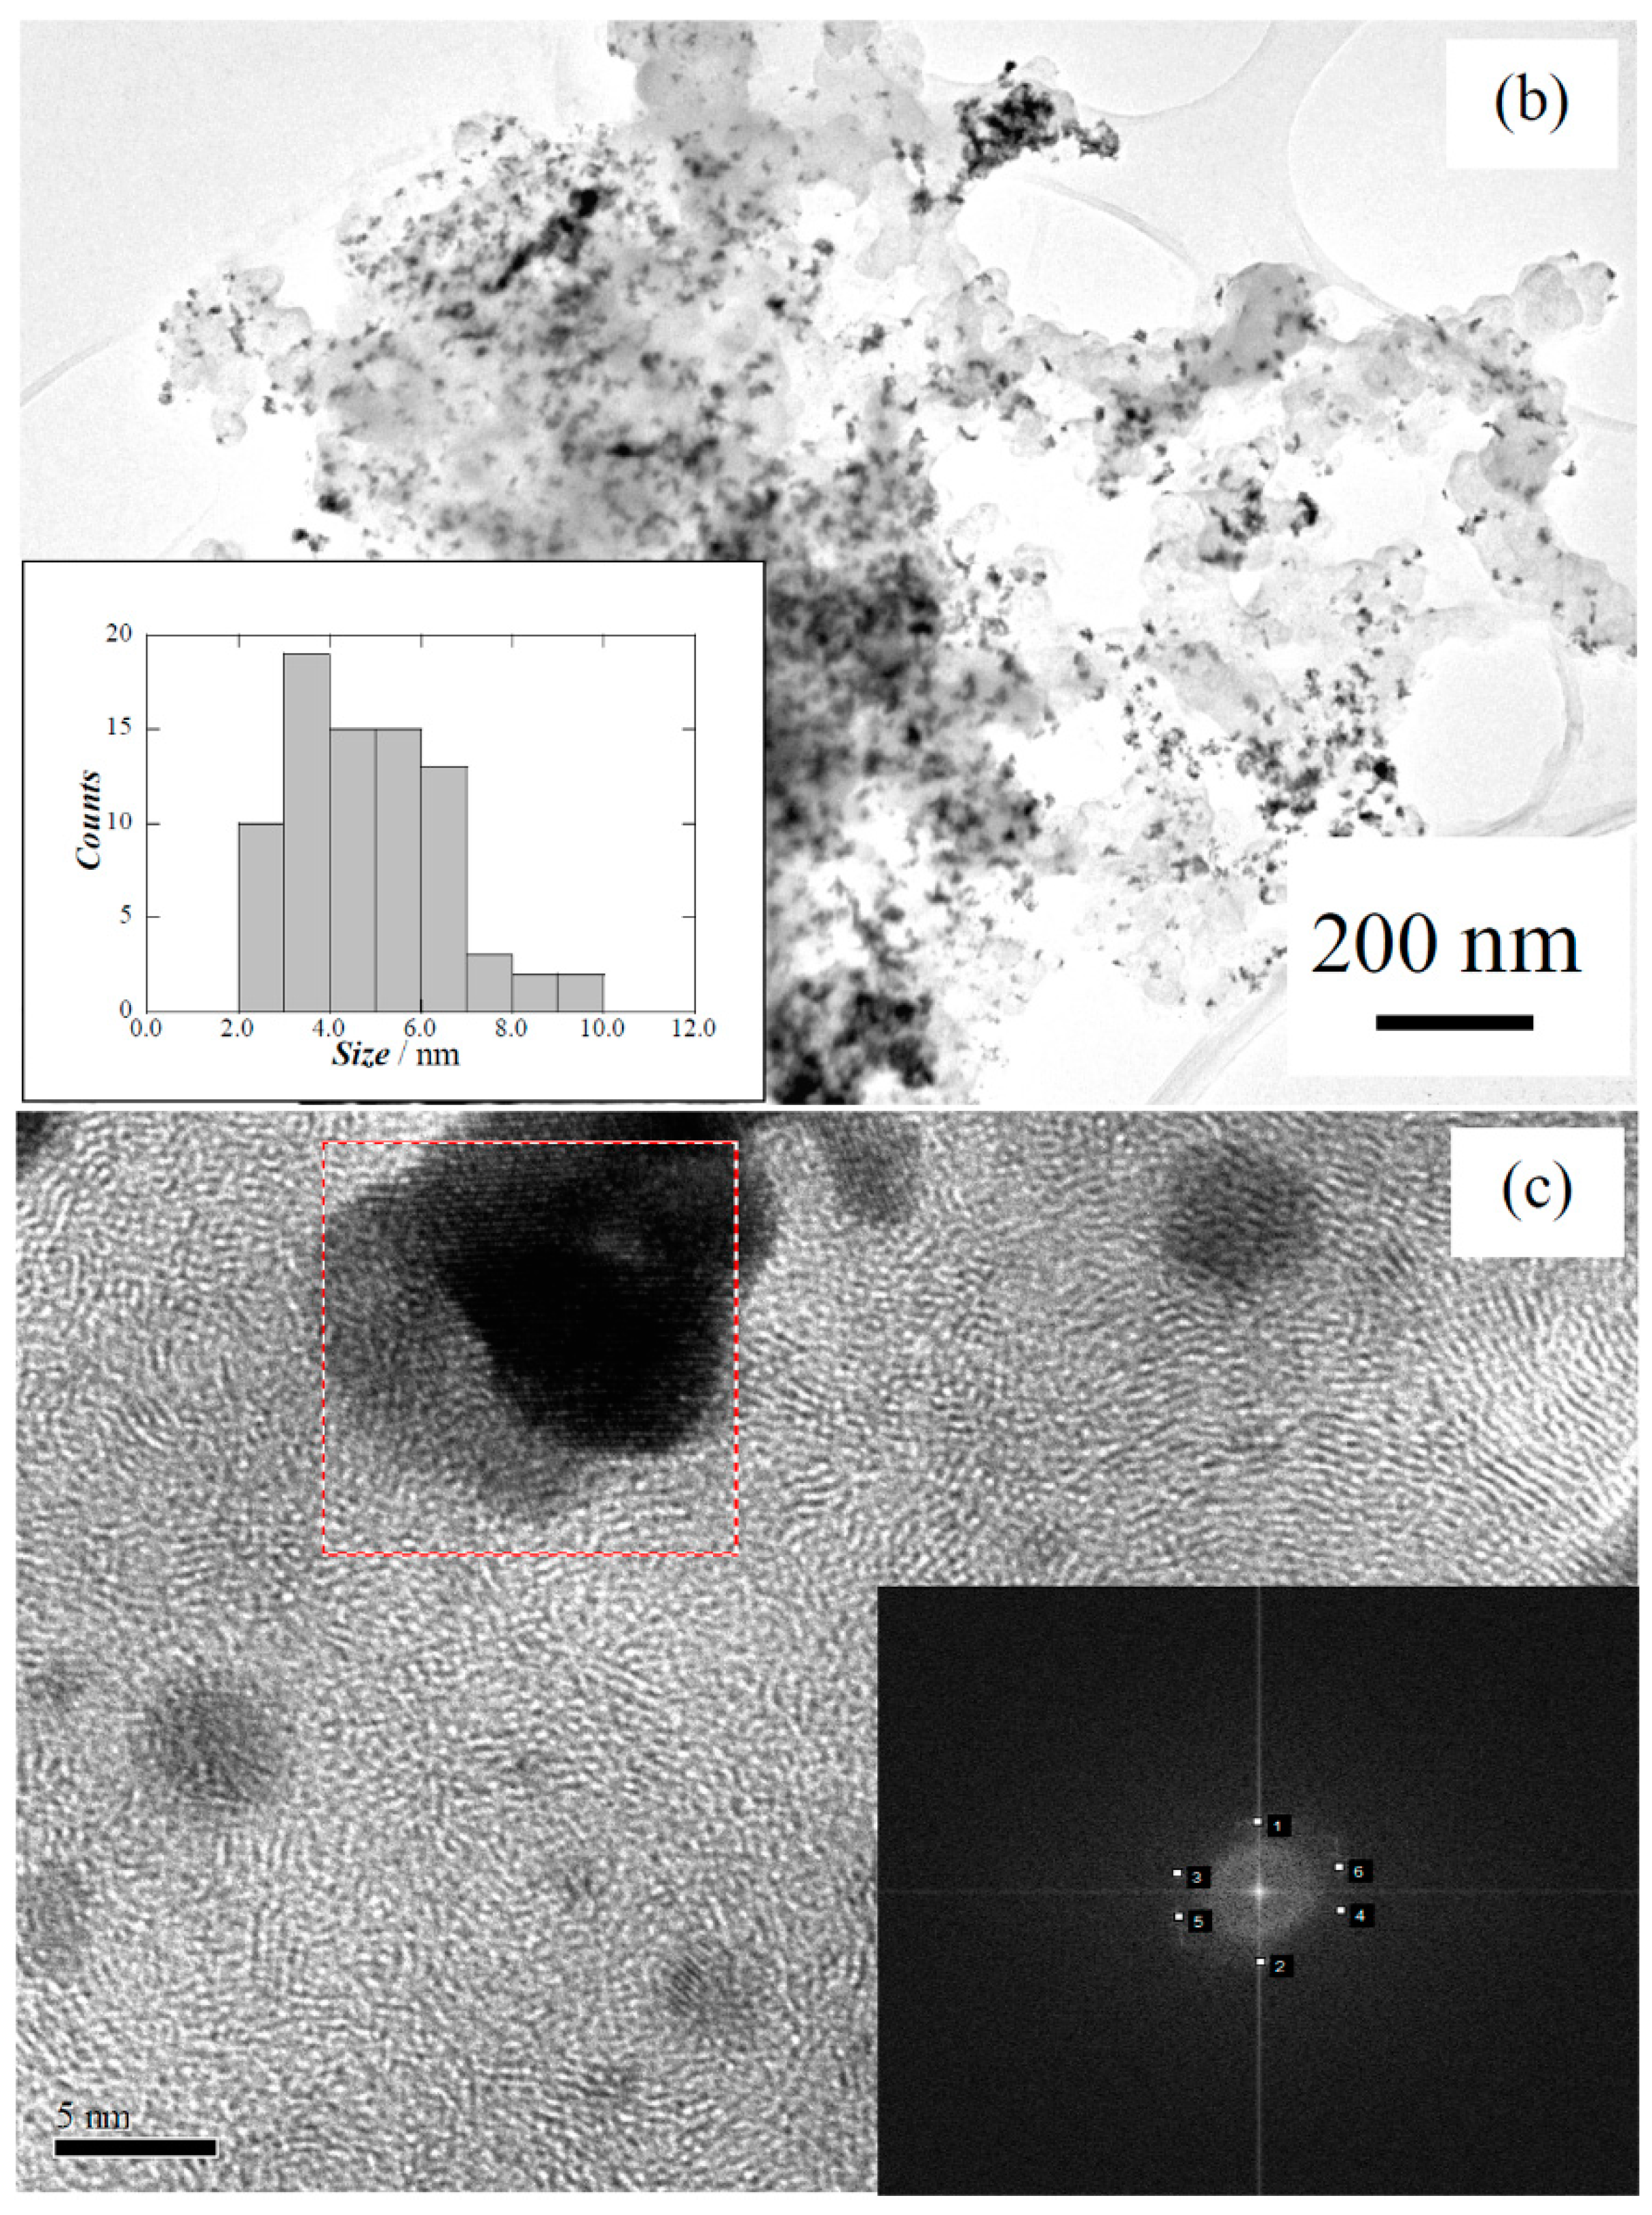
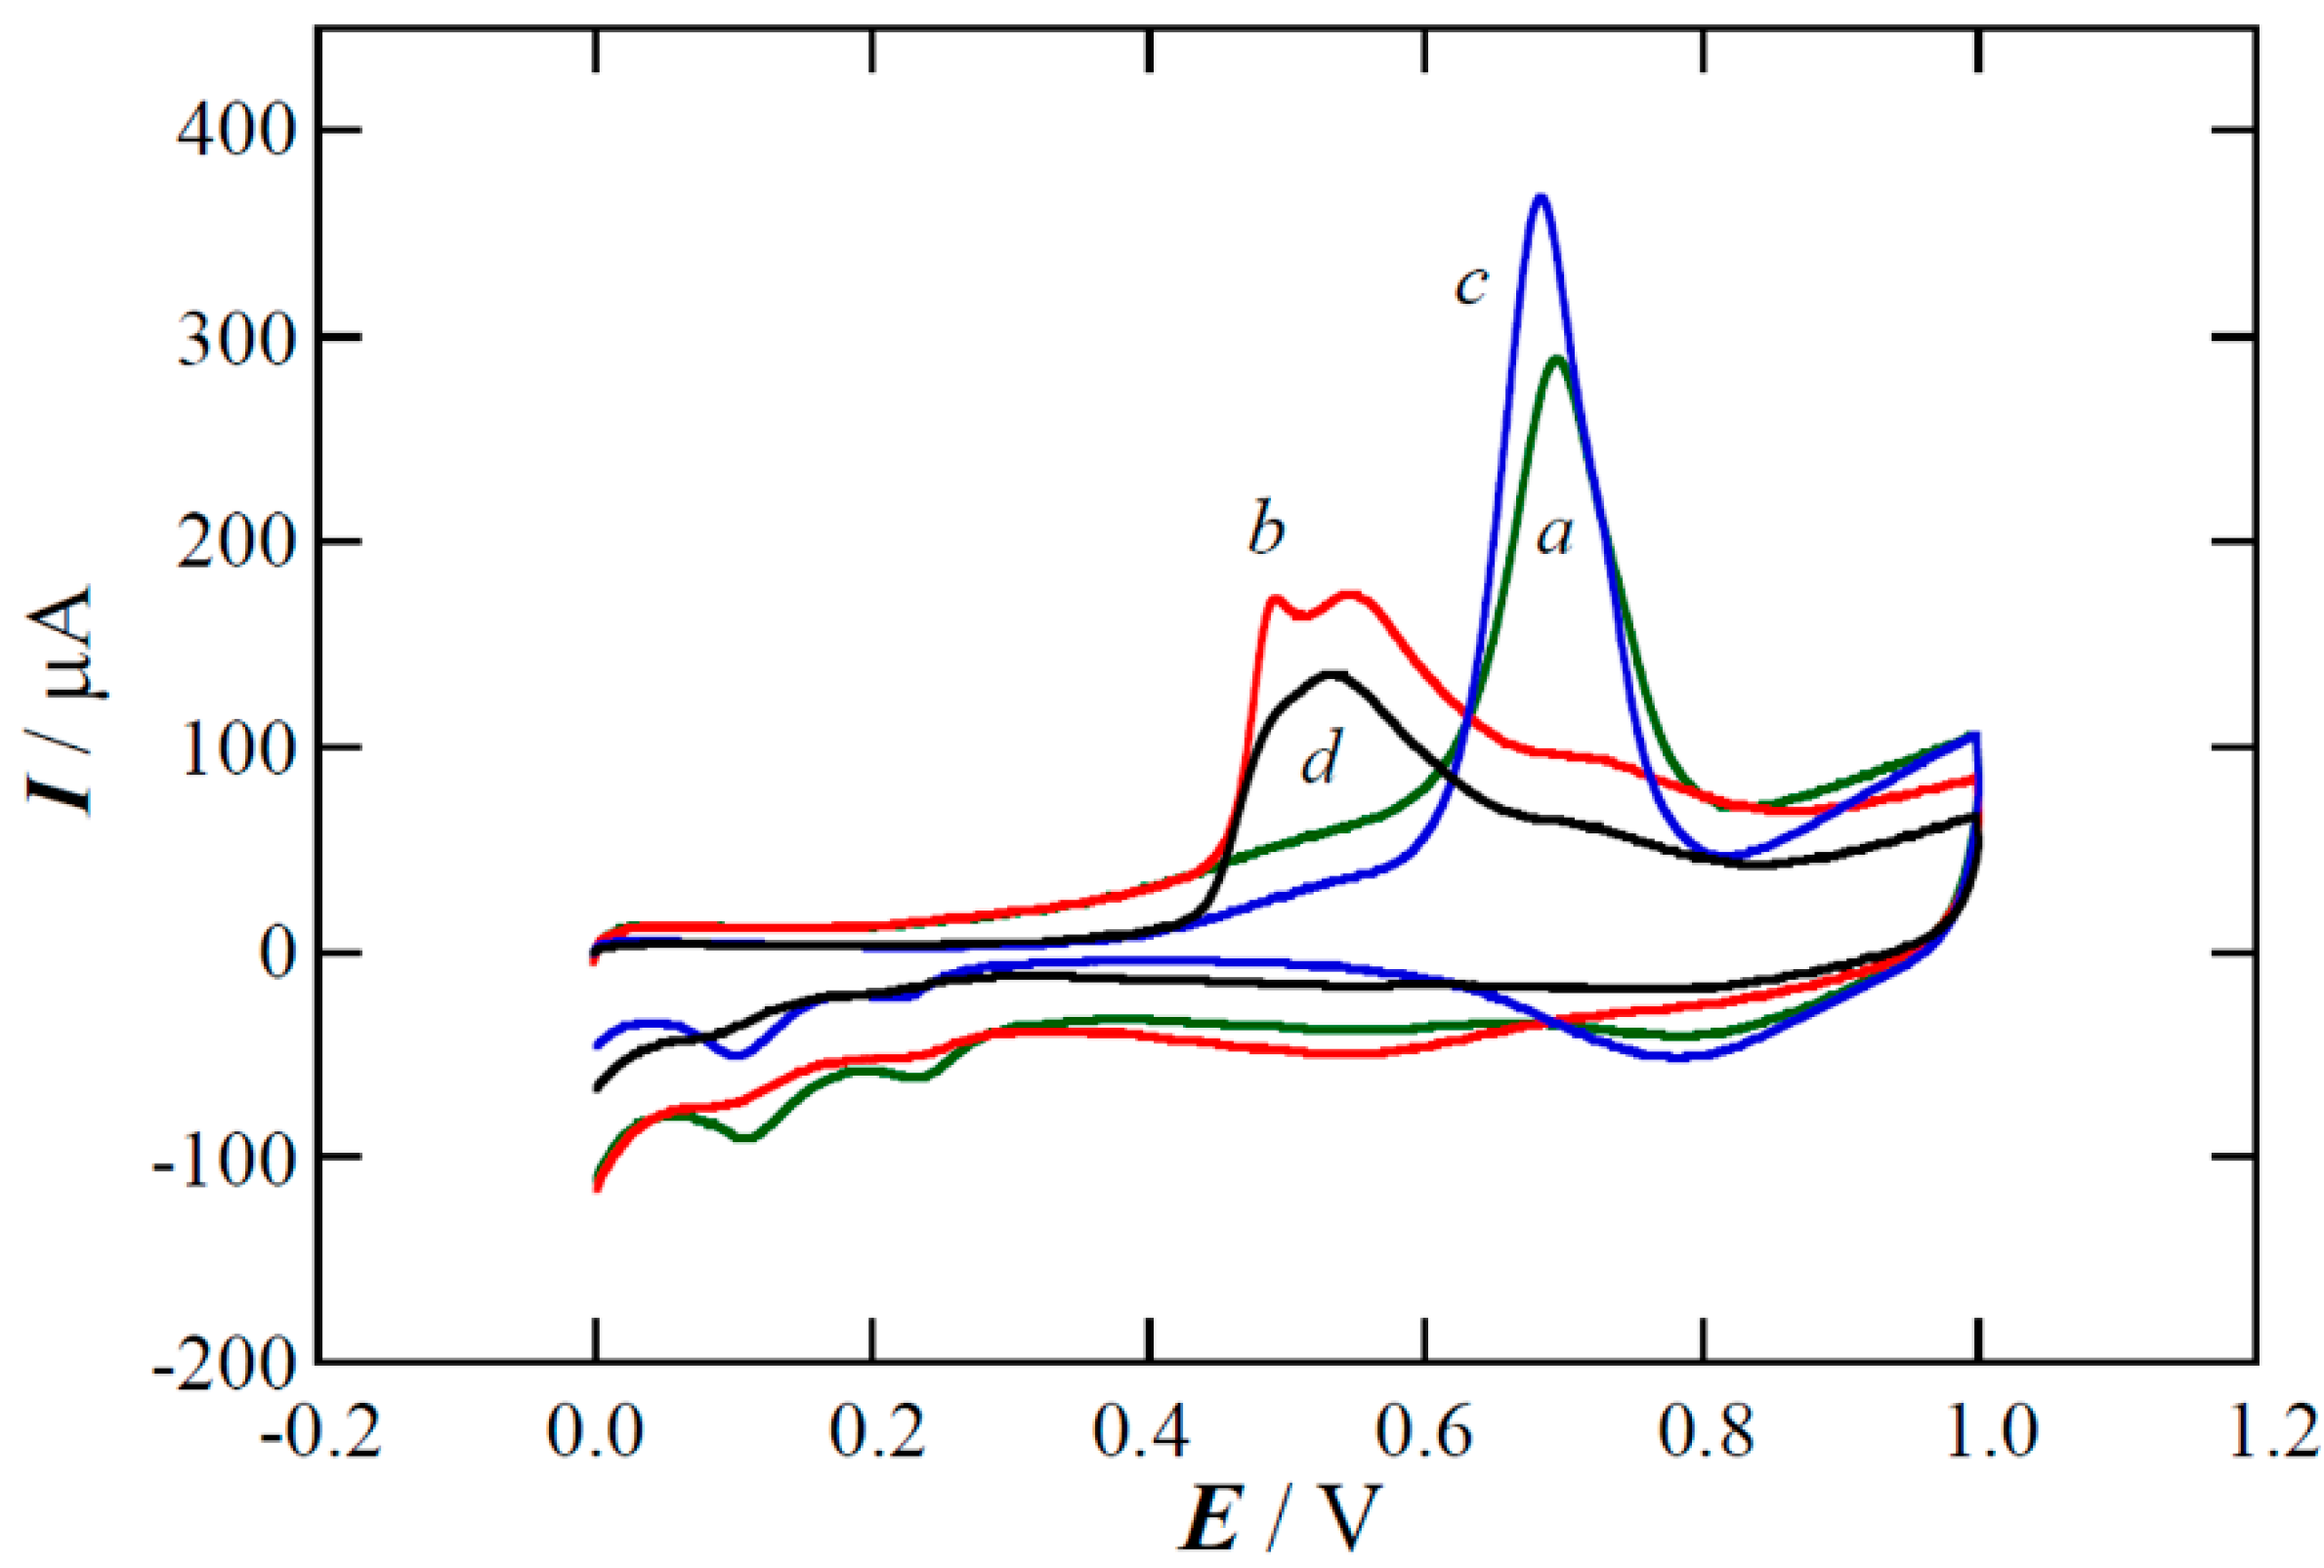
2.3. Performance of the Pt(Cu) and Pt-Ru(Cu) Catalysts


| Carbon treatment | Catalyst | ECSAHads/des/103 m2 molCu−1 | ECSACO/103 m2 molCu−1 |
|---|---|---|---|
| no oxidation | Pt(Cu) | 0.66 | 1.79 |
| (i) 1.6 V, 100 s | 1.56 | 1.55 | |
| (i) 1.6 V, 200 s | 1.58 | 1.77 | |
| (iii) 1.6 V, 200 s | 1.33 | 1.47 | |
| (i) 1.8 V, 300 s | 1.27 | 1.50 | |
| (i) 2.0 V, 300 s | 1.19 | 1.64 | |
| (iii) 2.0 V, 300 s | 1.11 | 1.04 | |
| (i) 2.2 V, 300 s | 1.05 | 1.16 | |
| (iii) 2.2 V, 300 s | 1.05 | 1.18 | |
| no oxidation | Pt-Ru(Cu) | 0.24 | 1.74 |
| (i) 1.6 V, 200 s | 0.62 | 1.73 | |
| (i) 2.2 V, 300 s | 0.57 | 1.32 |
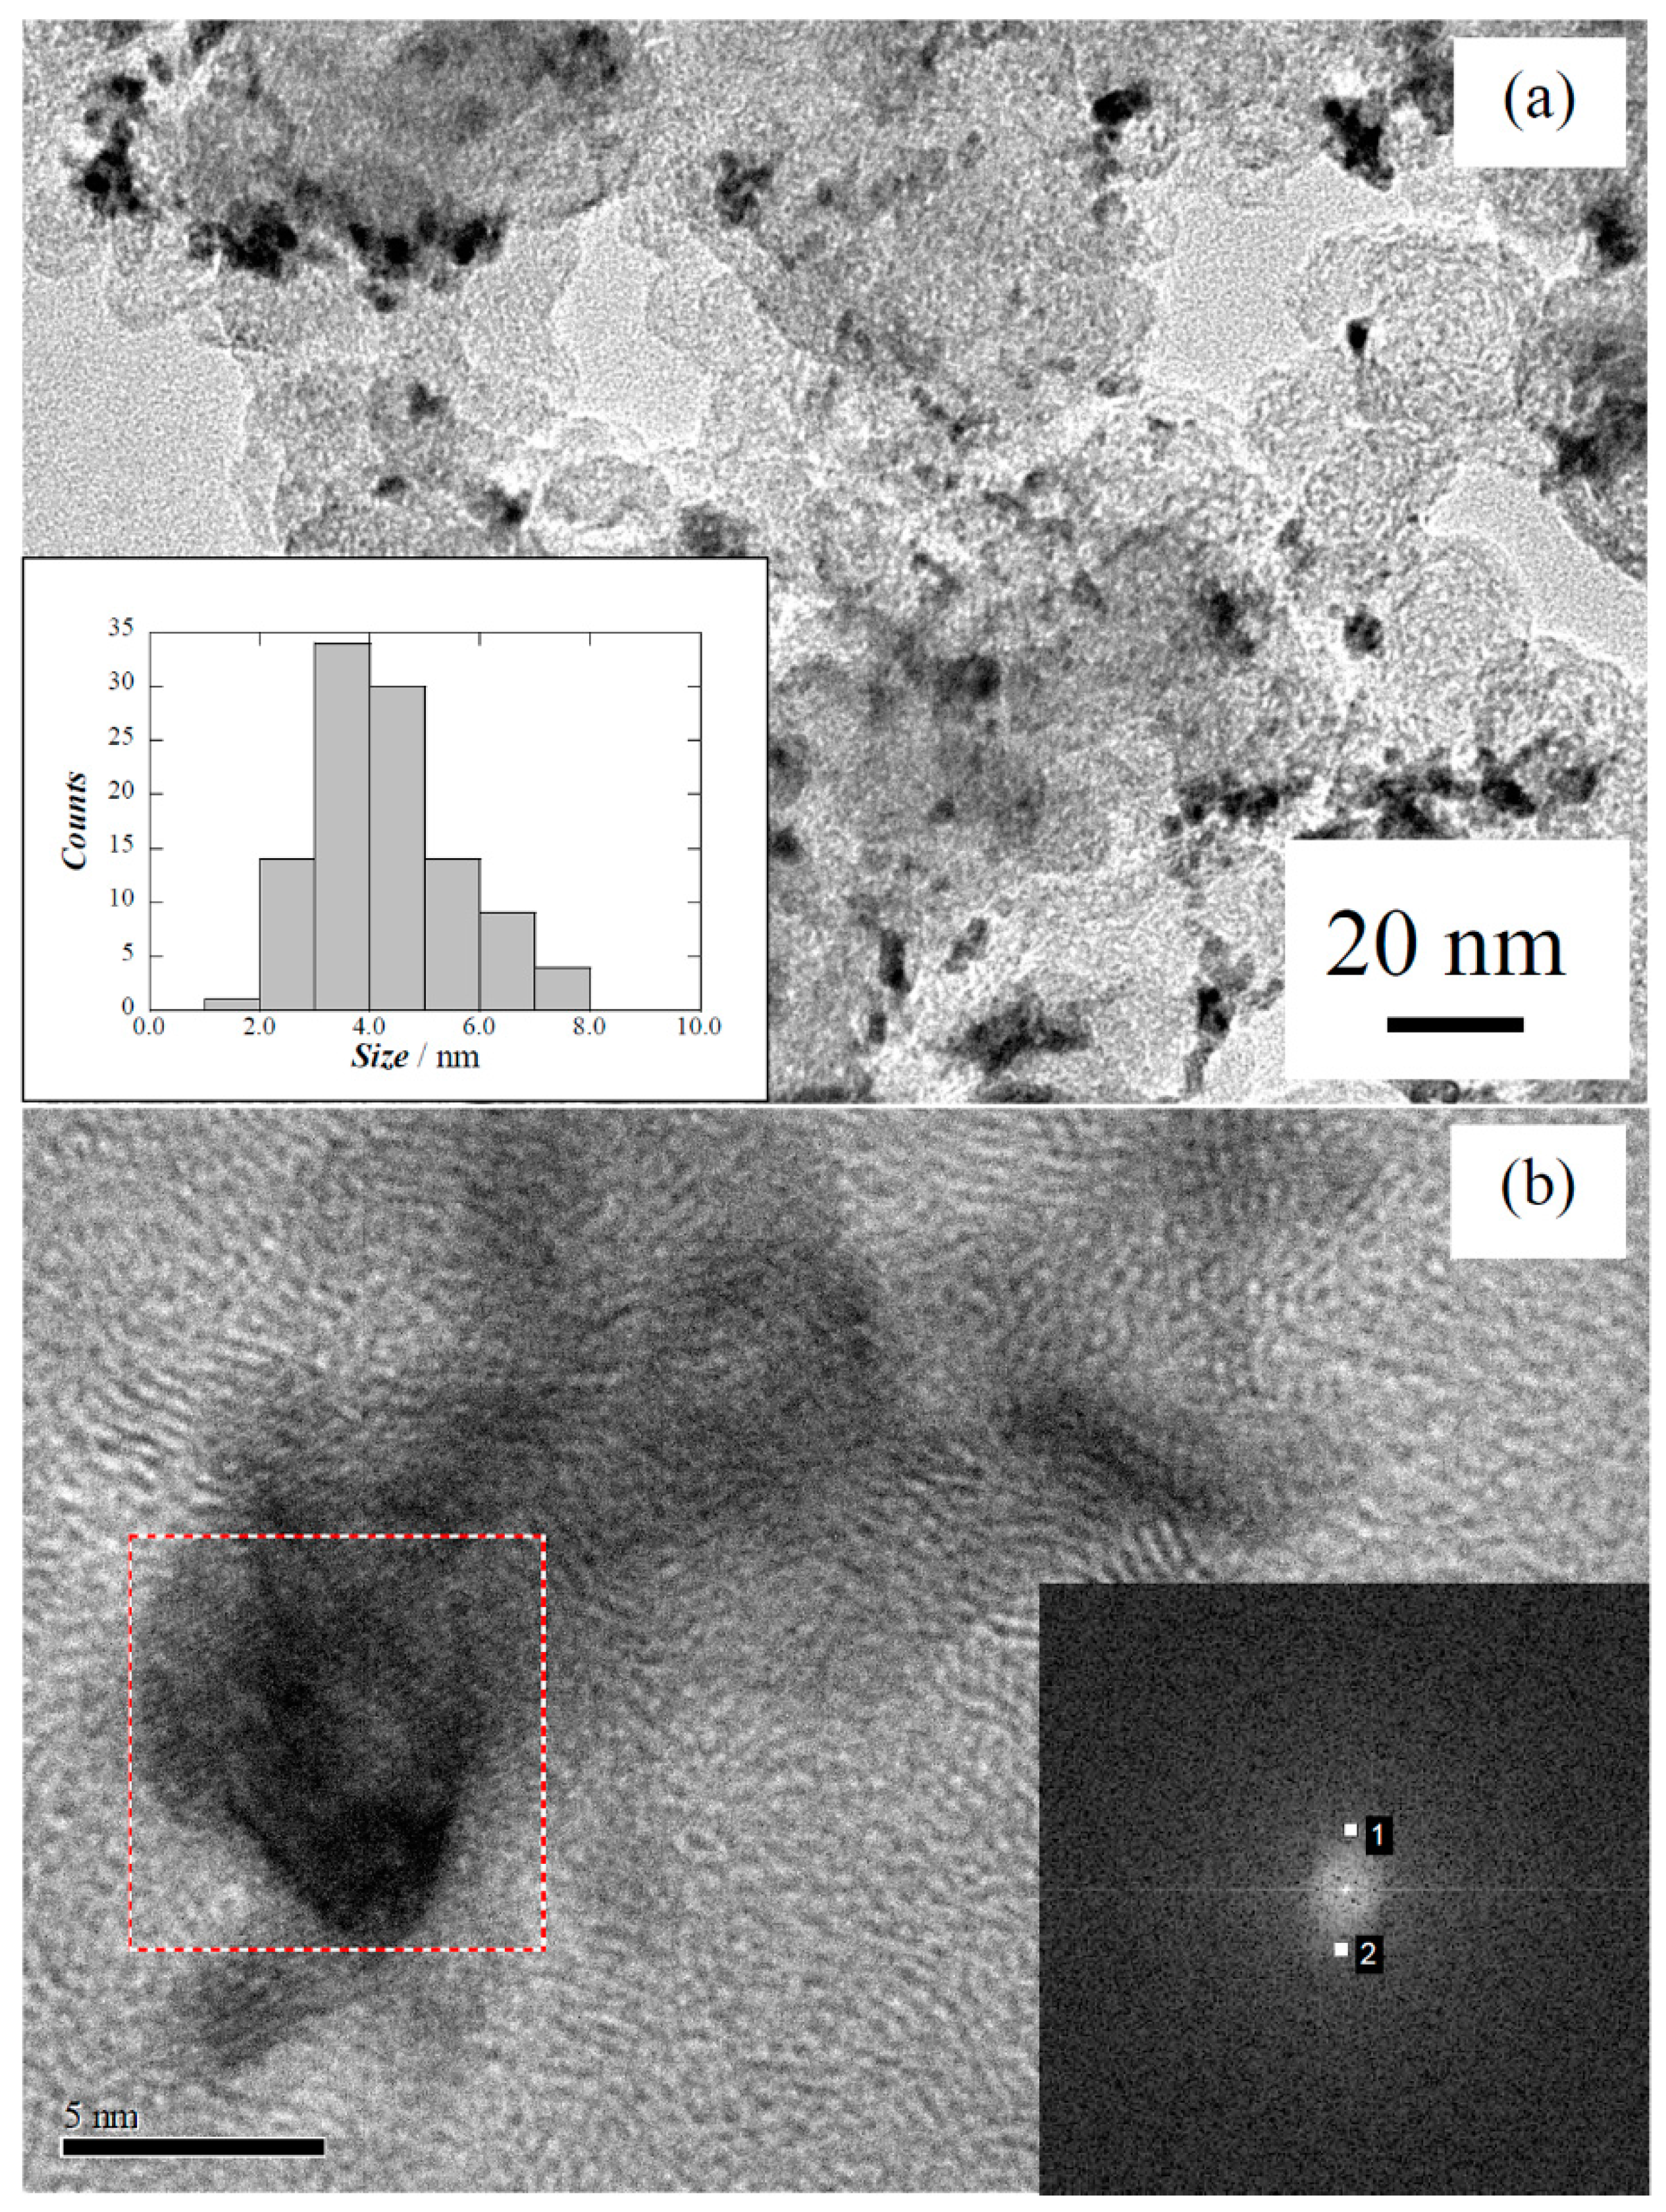


| Carbon treatment | Particle size/nm | Pt:Ru:Cu/at% |
|---|---|---|
| no oxidation | 3.6 | 61.2:0.3:38.5 |
| 1.6 V, 200 s | 3.3 ± 1.0 | 63.2:4.3:32.5 |
| 2.2 V, 300 s | 4.8 ± 1.7 | 49.4:7.4:43.2 |
3. Materials and Methods
3.1. Materials and Reagents
3.2. Working Electrodes and Electrochemical Testing
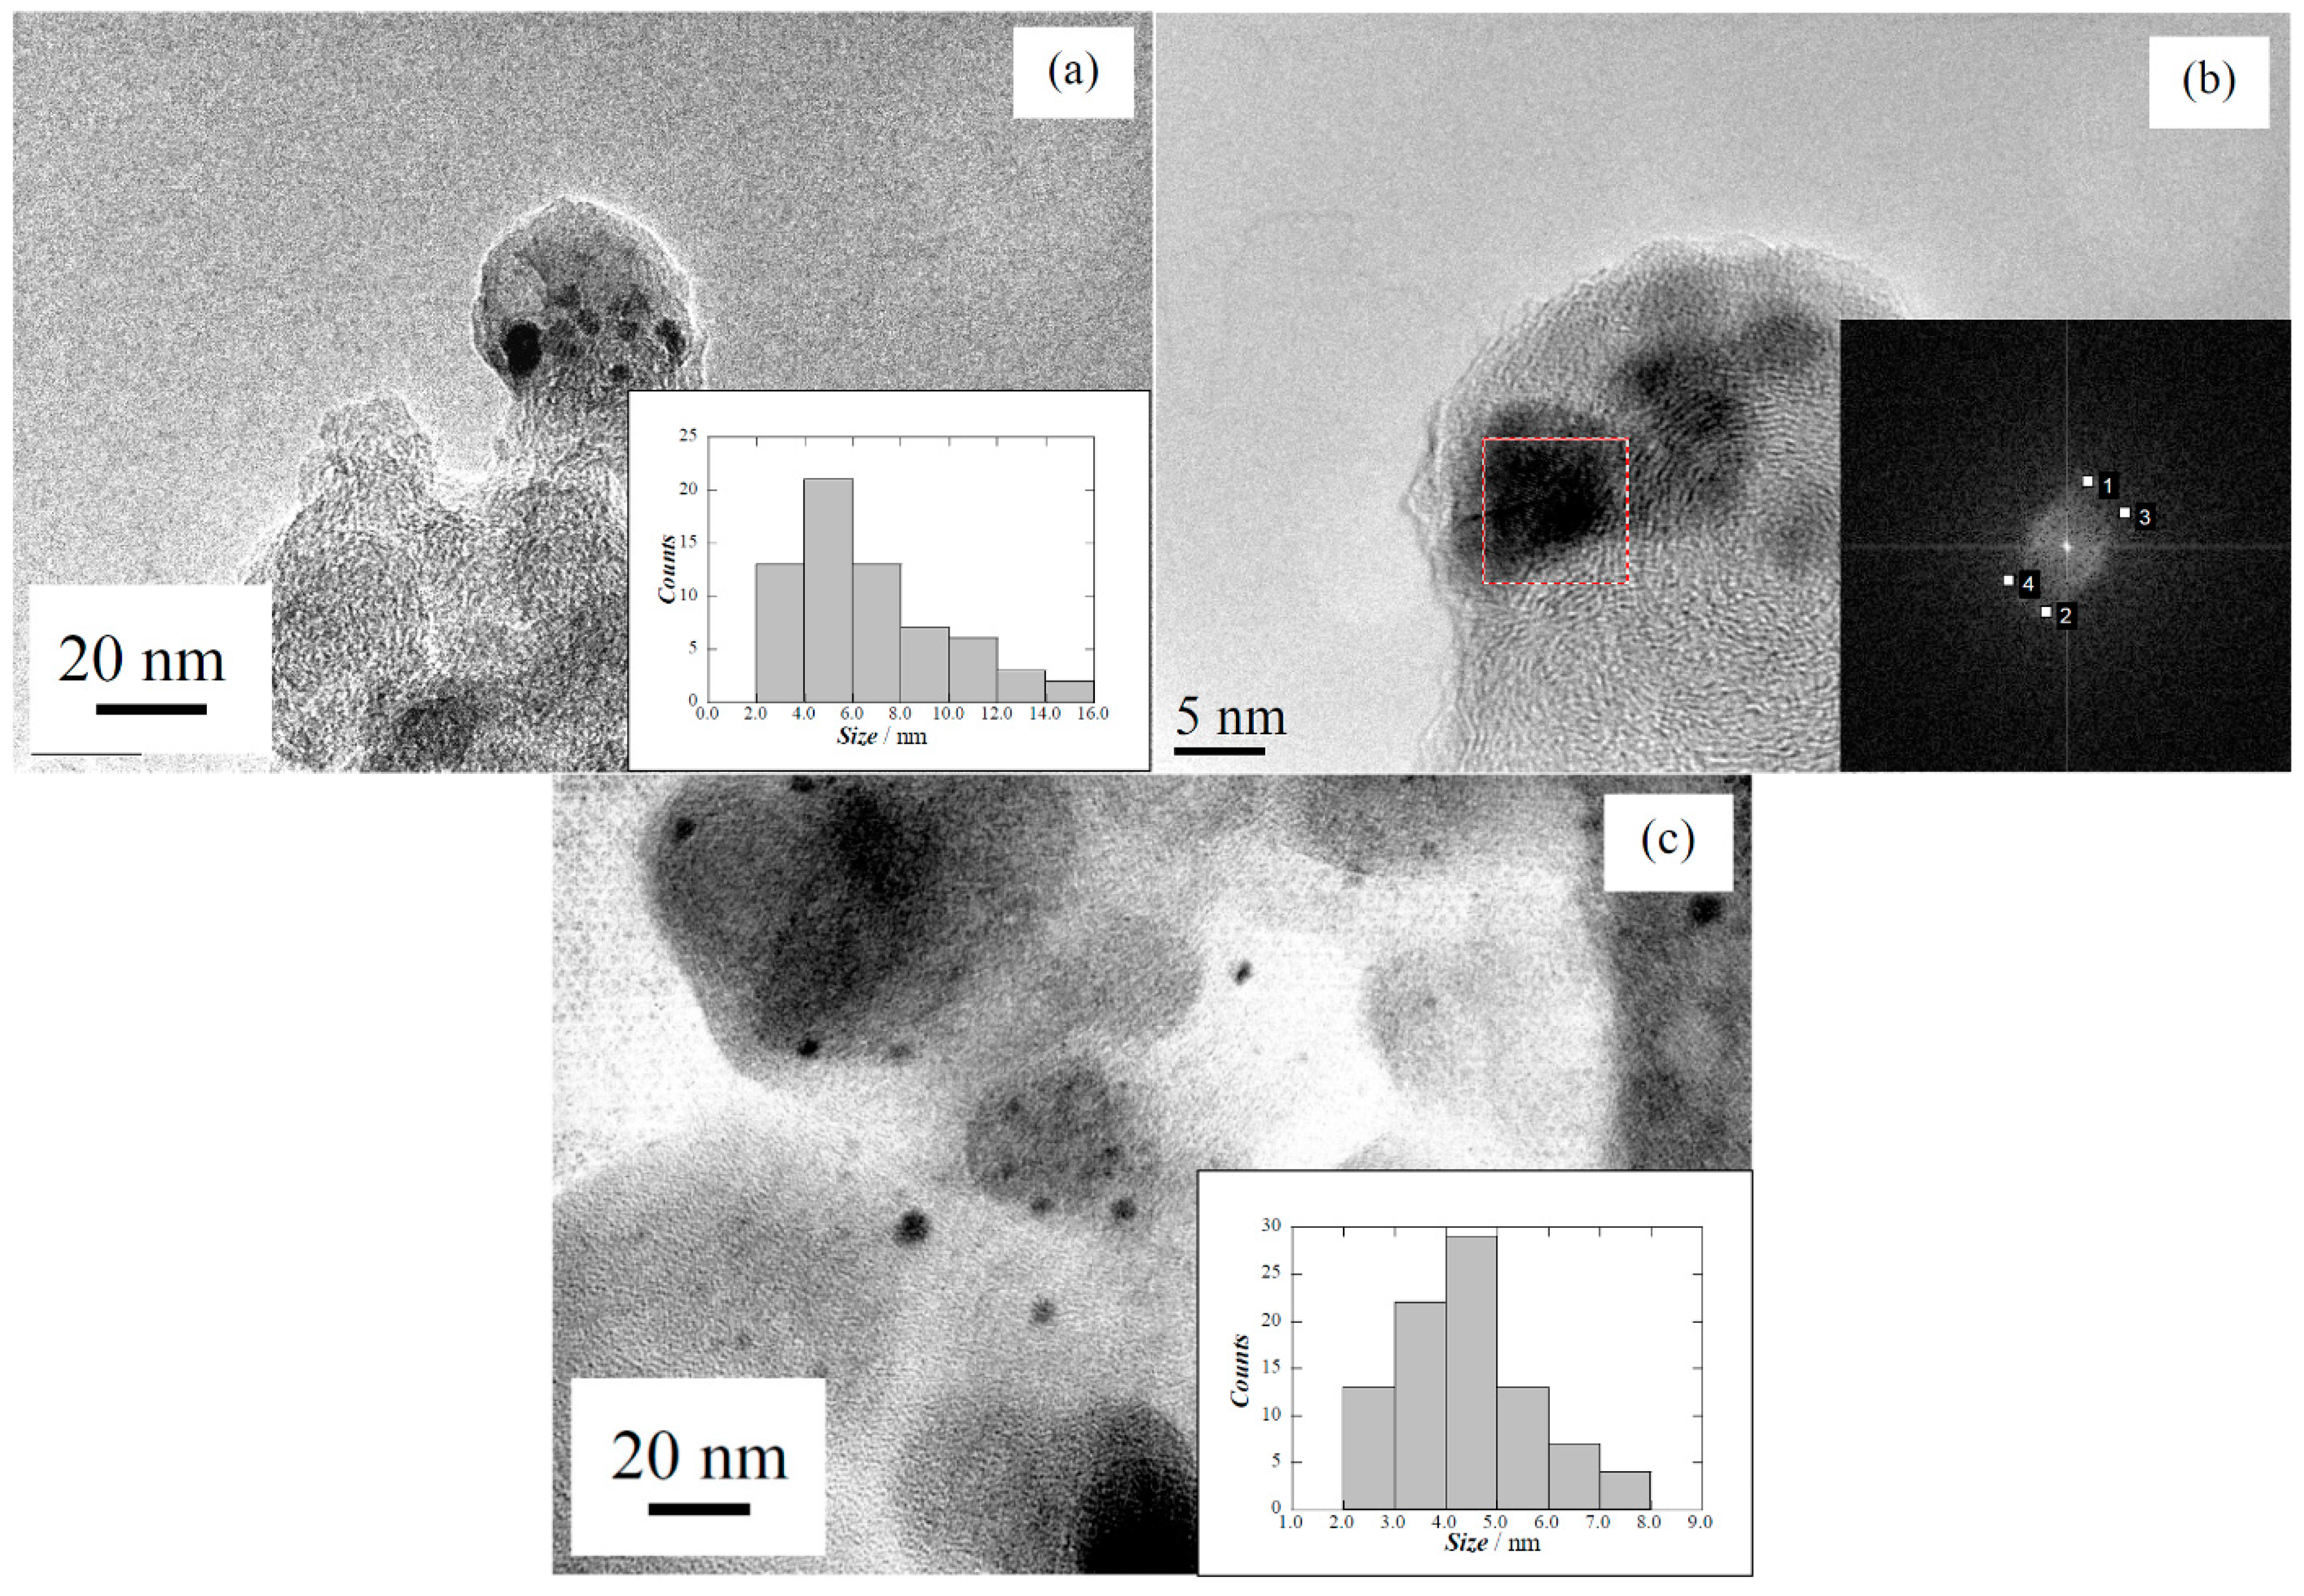
3.3. Microscopic Examination
3.4. XPS Analyses
4. Conclusions
Acknowledgments
Author Contributions
Conflicts of Interest
References
- Antolini, E. Carbon supports for low-temperature fuel cell catalysts. Appl. Catal. B 2009, 88, 1–24. [Google Scholar] [CrossRef]
- Álvarez, G.; Alcaide, F.; Cabot, P.L.; Lázaro, M.J.; Pastor, E.; Sollá-Gullón, J. Electrochemical Performance of low temperature PEMFC with Surface Tailored Carbon Nanofibers as Catalyst Support. Int. J. Hydrogen Energy 2012, 37, 393–404. [Google Scholar] [CrossRef]
- Antolini, E. Platinum-based ternary catalysts for low temperature fuel cells. Part II. Electrochemical properties. Appl. Catal. B 2007, 74, 337–350. [Google Scholar] [CrossRef]
- Wang, Y.; Chen, K.; Mishler, J.; Cho, S.; Cordobes Adroher, X. A review of polymer electrolyte membrane fuel cells: Technology, applications, and needs on fundamental research. Appl. Energy 2011, 88, 981–1007. [Google Scholar] [CrossRef]
- Guo, J.W.; Zhao, T.S.; Prabhuram, J.; Chen, R.; Wong, C.W. Preparation and characterization of Pt-Ru/C nanocatalyst for direct methanol fuell cells. Electrochim. Acta 2005, 51, 754–763. [Google Scholar] [CrossRef]
- Salgado, J.R.C.; Alcaide, F.; Álvarez, G.; Calvillo, L.; Lázaro, M.J.; Pastor, E. Pt–Ru electrocatalysts supported on ordered mesoporous carbon for direct methanol fuel cell. J. Power Sources 2010, 195, 4022–4029. [Google Scholar] [CrossRef]
- Zainoodin, A.M.; Kamarudin, S.K.; Daud, W.R.W. Review: Electrode in direct methanol fuel cells. Int. J. Hydrogen Energy 2010, 35, 4606–4621. [Google Scholar] [CrossRef]
- Alcaide, F.; Álvarez, G.; Cabot, P.L.; Grande, H.J.; Miguel, O.; Querejeta, A. Testing of carbon supported Pd-Pt electrocatalysts for methanol electrooxidation in direct methanol fuel cells. Int. J. Hydrogen Energy 2011, 36, 4432–4439. [Google Scholar] [CrossRef]
- Yasuka, Y.; Fujiwara, T.; Murakami, Y.; Saaki, K.; Oguri, M.; Asaki, T.; Sugimoto, W. Effect of structure of carbon-supported PtRu electrocatalysts on the electrochemical oxidation of methanol. J. Electrochem. Soc. 2000, 147, 4421–4427. [Google Scholar] [CrossRef]
- Steigertwalt, E.; Deluga, G.; Cliffel, D.; Lukehart, C. A Pt-Ru/Graphitic carbon nanofiber nanocomposite exhibiting high relative performance as a direct-methanol fuel cell anode catalyst. J. Phys. Chem. 2001, 105, 8097–8101. [Google Scholar] [CrossRef]
- Dickinson, A.J.; Carrette, L.P.L.; Collins, J.A.; Friedrich, K.A.; Stimming, U. Preparation of Pt-Ru/C catalyst from carbonyl complexes for fuel cell applications. Electrochim. Acta 2002, 47, 3733–3739. [Google Scholar] [CrossRef]
- Friedrich, K.A.; Geiyzers, L.P.; Dickinson, A.J.; Stimming, U. Fundamental aspects in electrocatalysis: from the reactivity of single-crystals to fuel cell electrocatalysts. J. Electroanal. Chem. 2002, 524–525, 261–272. [Google Scholar] [CrossRef]
- Baena-Moncada, A.M.; Coneo-Rodríguez, R.; Calderón, J.C.; Flórez-Montaño, J.; Barbero, C.A.; Planes, G.A.; Rodríguez, J.L.; Pastor, E. Macroporous carbon as support for PtRu catalysts. Int. J. Hydrogen Energy 2014, 39, 3964–3969. [Google Scholar] [CrossRef]
- Velázquez-Palenzuela, A.; Centellas, F.; Garrido, J.A.; Arias, C.; Rodríguez, R.M.; Brillas, E.; Cabot, P.L. Kinetic analysis of carbon monoxide and methanol oxidation on high performance carbon- supported Pt-Ru electrocatalyst for direct methanol fuel cells. J. Power Sources 2011, 196, 3503–3512. [Google Scholar] [CrossRef]
- Boxall, D.L.; Deluga, G.A.; Kenik, E.A.; King, W.D.; Lukehart, C.M. Rapid synthesis of a Pt1Ru1/C nanocomposite using microwave irradiation: A DMFC anode catalyst of high relative performance. Chem. Mater. 2001, 13, 891–900. [Google Scholar] [CrossRef]
- Esparbé, I.; Brillas, E.; Centellas, F.; Garrido, J.A.; Rodríguez, R.M.; Arias, C.; Cabot, P.L. Structure and electrocatalytic activity of carbon-supported Pt nanoparticles for polymer electrolyte fuel cells. J. Power Sources 2009, 190, 201–209. [Google Scholar] [CrossRef]
- Min, M.; Cho, J.; Cho, K.; Kim, H. Particle size and alloying effects of Pt-based alloy catalysts for fuel cell applications. Electrochim. Acta 2010, 45, 4211–4217. [Google Scholar] [CrossRef]
- Tokarz, W.; Lota, G.; Frackowiak, E.; Czerwinski, A.; Piela, P. Fuel cell testing of Pt–Ru catalysts supported on differently prepared and pretreated carbon nanotubes. Electrochim. Acta 2013, 98, 94–103. [Google Scholar] [CrossRef]
- Álvarez, G.; Alcaide, F.; Miguel, O.; Cabot, P.L.; Martinez-Huerta, M.V.; Fierro, J.L.G. Electrochemical stability of carbon nanofibers in proton exchange membrane fuel cells. Electrochim. Acta 2011, 56, 9370–9377. [Google Scholar] [CrossRef]
- Hsieh, C.T.; Lin, J.Y.; Wei, J.L. Deposition and electrochemical activity of Pt-based bimetallic nanocatalysts on carbon nanotube electrodes. Int. J. Hydrogen Energy 2009, 34, 685–693. [Google Scholar] [CrossRef]
- Hwang, J.Y.; Chatterjee, A.; Shen, C.H.; Wang, J.H.; Sun, C.L.; Chya, O.; Chen, C.W.; Chen, K.H.; Chen, L.C. Mesoporous active carbon dispersed with ultra-fine platinum nanoparticles and their electrochemical properties. Diam. Relat. Mater. 2009, 18, 303–306. [Google Scholar] [CrossRef]
- Velázquez-Palenzuela, A.; Centellas, F.; Garrido, J.A.; Arias, C.; Rodríguez, R.M.; Brillas, E.; Cabot, P.L. Structural characterization of Ru-modified carbon-supported Pt nanoparticles using spontaneous deposition with CO oxidation activity. J. Phys. Chem. C 2012, 116, 18469–18478. [Google Scholar] [CrossRef]
- Tegou, A.; Papadimitriou, S.; Pavlidou, E.; Kokkinidis, G.; Sotiropoulos, S. Oxygen reduction at platinum- and gold-coated copper deposits on glassy carbon substrates. J. Electroanal. Chem. 2007, 608, 67–77. [Google Scholar] [CrossRef]
- Papadimitriou, S.; Tegou, A.; Pavlidou, E.; Armyanov, S.; Valova, E.; Kokkinidis, G.; Sotiropoulos, S. Preparation and characterization of platinum- and gold-coated copper, iron, cobalt and nickel deposits on glassy carbon substrates. Electrochim. Acta 2008, 53, 6559–6567. [Google Scholar] [CrossRef]
- Rahsepar, M.; Pakshir, M.; Piao, Y.; Kim, H. Synthesis and electrocatalytic performance of high loading active PtRu multiwalled carbon nanotube catalyst for methanol oxidation. Electrochim. Acta 2012, 71, 246–251. [Google Scholar] [CrossRef]
- García, G.; Flórez-Montaño, J.; Hernández-Creus, A.; Pastor, E.; Planes, G.A. Methanol electrooxidation at mesoporous Pt and Pt-Ru electrodes: A comparative study with carbon supported materials. J. Power Sources 2011, 196, 2979–2986. [Google Scholar] [CrossRef]
- Ding, Y.; Liu, Y.; Rao, G.; Wang, G.; Zhong, Q.; Ren, B.; Tian, Z. Electrooxidation Mechanism of Methanol at Pt-Ru Catalyst Modified GC Electrode in Electrolytes with Different pH Using Electrochemical and SERS Techniques. Chin. J. Chem. 2007, 25, 1617–1621. [Google Scholar] [CrossRef]
- Yue, Z.R.; Jiang, W.; Wang, L.; Gardner, S.D.; Pittman, C.U., Jr. Surface characterization of electrochemically oxidized carbon fibers. Carbon 1999, 37, 1785–1796. [Google Scholar] [CrossRef]
- Li, W.; Liu, L.; Zhong, Ch.; Shen, B.; Hu, W. Effects of Carbon Fiber surface treatment on Cu electrodeposition: The electrochemical behavior and the morphology of Cu deposits. J. Alloy Compd. 2011, 509, 3532–3536. [Google Scholar] [CrossRef]
- Carmo, M.; dos Santos, A.R.; Rocha Poco, J.G.; Linardi, M. Physical and electrochemical evaluation of commercial carbon black as electrocatalysts supports for DMFC applications. J. Power Sources 2007, 173, 860–866. [Google Scholar] [CrossRef]
- Zhang, X.; Chan, K. Water in Oil microemulsion synthesis of platinum-ruthenium nanoparticles, their characterization and electrocatalytic properties. Chem. Mater. 2003, 15, 451–459. [Google Scholar] [CrossRef]
- Podlovchenko, B.I.; Krivchenk, V.A.; Maksimov, Y.M.; Gladysheva, T.D.; Yashina, L.V.; Evlashin, S.A.; Pilevsky, A. Specific features of the formation of Pt (Cu) catalysts by galvanic displacement with carbon nanowalls used as support. Electrochim. Acta 2012, 76, 137–144. [Google Scholar] [CrossRef]
- Podlovchenko, B.I.; Zhumaev, U.E.; Maksimov, Y.M. Galvanic displacement of copper adatoms on platinum in PtCl42− solutions. J. Electroanal. Chem. 2011, 651, 30–37. [Google Scholar] [CrossRef]
- Podlovchenko, B.I.; Gladysheva, T.D.; Filatov, A.; Yashina, L.V. The Use of Galvanic Displacement in Synthesizing Pt(Cu) Catalysts with the Core-Shell Structure. Russ. J. Electrochem. 2010, 46, 1189–1197. [Google Scholar] [CrossRef]
- Wang, J.; Yin, G.; Shao, Y.; Zhang, S.; Wang, Z.; Gao, Y. Effect of carbon black support corrosion on the durability of Pt/C catalyst. J. Power Sources 2007, 171, 331–339. [Google Scholar] [CrossRef]
- Weissmann, M.; Baranton, S.; Clacens, J.M.; Coutanceau, C. Modification of hydrophobic /hydrophilic properties of Vulcan XC72 carbon powder by grafting of trifluoromethylphenyl and phenylsulfonic acid groups. Carbon 2010, 48, 2755–2764. [Google Scholar] [CrossRef]
- Cabot Corporation. Specialty Chemicals and Performance Materials. Available online: http://www.cabotcorp.com (accessed on 20 January 2014).
- Kumar, S.; Soler Herrero, J.; Irusta, S.; Scott, K. The effect of pretreatment of Vulcan XC-72R carbon on morphology and electrochemical oxygen reduction kinetics of supported Pd nano-particle in acidic electrolyte. J. Electroanal. Chem. 2010, 647, 211–221. [Google Scholar] [CrossRef]
- Ghodbane, O.; Roué, L.; Bélanger, D. Copper electrodeposition on pyrolitic graphite electrodes: Effect of the copper salt on the electrodeposition process. Electrochim. Acta 2007, 52, 5843–5855. [Google Scholar] [CrossRef]
- Kumar, S.; Hidyatai, N.; Soler Herrero, J.; Irusta, S.; Scott, K. Efficient tuning of the Pt nano-particle mono-dispersion on Vulcan XC-72R by selective pre-treatment and electrochemical evaluation of hydrogen oxidation and oxygen reduction reactions. Int. J. Hydrogen Energy 2011, 36, 5453–5465. [Google Scholar] [CrossRef]
- Bae, G.; Youn, D.; Han, S.; Lee, J. The role of nitrogen in a carbon support on the increased activity and stability of a Pt catalyst in electrochemical hydrogen oxidation. Carbon 2013, 51, 274–281. [Google Scholar] [CrossRef]
- Yoon, Ch.; Long, D.; Jang, S.; Qiao, W.; Ling, L.; Miyawaki, J.; Rhee, Ch.; Mochida, I.; Yoon, S. Electrochemical surface oxidation of carbon nanofibers. Carbon 2011, 49, 96–105. [Google Scholar] [CrossRef]
- Gómez de la Fuente, J.L.; Martínez-Huerta, M.V.; Rojas, S.; Terreros, P.; Fierro, J.L.G.; Peña, M.A. Methanol electrooxidation on PtRu nanoparticles supported on functionalized carbon black. Catal. Today 2006, 116, 422–432. [Google Scholar] [CrossRef]
- Cao, J.; Song, L.; Tang, J.; Xu, J.; Wang, W.; Chen, Z. Enhanced activity of Pd nanoparticles supported on Vulcan XC72R carbon pretreated via a modified Hummers method for formic acid electrooxidation. Appl. Surf. Sci. 2013, 274, 138–143. [Google Scholar] [CrossRef]
- Yue, Z.R.; Jiang, W.; Wang, L.; Toghiani, H.; Gardner, S.D.; Pittman, C.U., Jr. Adsorption of precious metal ions onto electrochemically oxidized carbon fibers. Carbon 1999, 37, 1607–1618. [Google Scholar] [CrossRef]
- Carmo, M.; Linardi, M.; Rocha Poco, J.G. Characterization of nitric acid functionalized carbon black and its evaluation as electrocatalyst support for direct methanol fuel cell applications. Appl. Catal. A 2009, 355, 132–138. [Google Scholar] [CrossRef]
- Rueffer, M.; Bejan, D.; Bunce, N.J. Graphite: An active or an inactive anode? Electrochim. Acta 2011, 56, 2246–2253. [Google Scholar] [CrossRef]
- Caballero-Manrique, G.; Velázquez-Palenzuela, A.; Centellas, F.; Garrido, J.A.; Arias, C.; Rodríguez, R.M.; Brillas, E.; Cabot, P.L. Electrochemical synthesis and characterization of carbon-supported Pt and Pt-Ru nanoparticles with Cu cores for CO and methanol oxidation in polymer electrolyte fuel cells. Int. J. Hydrogen Energy 2014, 39, 12859–12869. [Google Scholar] [CrossRef]
- Shao, Y.; Yin, G.; Zhang, J.; Gao, Y. Comparative investigation of the resistance to electrochemical oxidation of carbon black and carbon nanotubes in aqueous sulfuric acid solution. Electrochim. Acta 2006, 51, 5853–5857. [Google Scholar] [CrossRef]
- Yumitori, S. Correlation of C1s chemical state intensities with the O1s intensity in the XPS analysis of anodically oxidized glass-like carbon samples. J. Mater. Sci. 2000, 35, 139–146. [Google Scholar] [CrossRef]
- Stankovich, S.; Dikin, D.; Piner, R.; Kohlhaas, K.; Kleinhammes, A.; Jia, Y.; Wu, Y.; Nguyen, S.; Ruoff, R. Synthesis of graphene-based nanosheets via chemical reduction of exfoliated graphite oxide. Carbon 2007, 45, 1558–1565. [Google Scholar] [CrossRef]
- Yang, D.; Velamakannia, A.; Bozoklu, G.; Park, S.; Stoller, M.; Piner, R.; Stankovich, S.; Jung, I.; Field, D.; Ventrice, C., Jr.; et al. Chemical analysis of graphene oxide films after heat and chemical treatments by X-ray photoelectron and Micro-Raman spectroscopy. Carbon 2009, 47, 145–152. [Google Scholar] [CrossRef]
- Terzyk, A. The influence of activated carbon surface chemical composition on the adsorption of acetaminophen (paracetamol) in vitro. Part II. TG, FTIR, and XPS analysis of carbons and the temperature dependence of adsorption kinetics at the neutral pH. Colloids Surf. A 2001, 177, 23–45. [Google Scholar] [CrossRef]
- WWW-MINCRYST. Crystallographic and Crystallochemical Database for Minerals and their Structural Analogues. Available online: http://database.iem.ac.ru/mincrysst (accessed on 30 June 2014).
- Ruth, K.; Vogt, M.; Zuber, R. Development of CO-tolerant catalysts. In Handbook of Fuel Cells—Fundamentals, Technology and Applications; Vielstich, W., Gasteiger, H.A., Lamm, A., Eds.; John Wiley & Sons: New York, NY, USA, 2003; Volume 3, pp. 489–496. [Google Scholar]
- Velázquez-Palenzuela, A.; Brillas, E.; Arias, C.; Centellas, F.; Garrido, J.A.; Rodríguez, R.M.; Cabot, P.L. Structural analysis of carbon-supported Ru-decorated Pt nanoparticles synthesized using forced deposition and catalytic performance toward CO, methanol, and ethanol electro-oxidation. J. Catal. 2013, 298, 112–121. [Google Scholar] [CrossRef]
- Chen, Z.; Xu, L.; Li, W.; Waje, M.; Yan, Y. Polianiline nanofibre supported platinum nanoelectrocatalysts for direct methanol fuel cells. Nanotechnol. 2006, 17, 5254–5259. [Google Scholar] [CrossRef]
© 2015 by the authors; licensee MDPI, Basel, Switzerland. This article is an open access article distributed under the terms and conditions of the Creative Commons Attribution license (http://creativecommons.org/licenses/by/4.0/).
Share and Cite
Caballero-Manrique, G.; Brillas, E.; Centellas, F.; Garrido, J.A.; Rodríguez, R.M.; Cabot, P.-L. Electrochemical Oxidation of the Carbon Support to Synthesize Pt(Cu) and Pt-Ru(Cu) Core-Shell Electrocatalysts for Low-Temperature Fuel Cells. Catalysts 2015, 5, 815-837. https://doi.org/10.3390/catal5020815
Caballero-Manrique G, Brillas E, Centellas F, Garrido JA, Rodríguez RM, Cabot P-L. Electrochemical Oxidation of the Carbon Support to Synthesize Pt(Cu) and Pt-Ru(Cu) Core-Shell Electrocatalysts for Low-Temperature Fuel Cells. Catalysts. 2015; 5(2):815-837. https://doi.org/10.3390/catal5020815
Chicago/Turabian StyleCaballero-Manrique, Griselda, Enric Brillas, Francesc Centellas, José Antonio Garrido, Rosa María Rodríguez, and Pere-Lluís Cabot. 2015. "Electrochemical Oxidation of the Carbon Support to Synthesize Pt(Cu) and Pt-Ru(Cu) Core-Shell Electrocatalysts for Low-Temperature Fuel Cells" Catalysts 5, no. 2: 815-837. https://doi.org/10.3390/catal5020815