1. Introduction
As a kind of sustainable clean energy technology, fuel cells have been demonstrated and recognized as the feasible option for energy conversion for power generation due to their high efficiency and zero/low emissions [
1,
2]. In several types of fuel cells, direct ethanol fuel cells (DEFCs) are considered to be one of the important options for automotive and portable electronic applications, owing to their high energy density, low operating temperature, and liquid fuel feeding operation [
3,
4]. Compared with the direct methanol fuel cells (DMFCs), DEFCs also have some advantages including lower fuel cost, lower toxicity, lower fuel crossover effect, and higher theoretical mass energy density (8 kWh·kg
−1 vs. 6.1 kWh·kg
−1) [
5]. Furthermore, ethanol can be easily produced in large scale from agricultural products or biomass [
6].
Unfortunately, the low reaction activity and difficult C-C bond breaking of ethanol electrooxidation are the major drawbacks hindering DEFCs’ practical applications [
7,
8]. Currently, the most effective catalysts used for ethanol electrooxidation are Pt-based materials, which are high-cost and also insufficient in overcoming both the low catalyst activity and difficulty of breaking C-C bond of ethanol. To overcome these challenges, tremendous efforts have been made to explore alternative catalysts which hopefully could give high activity/selectivity/stability, and be low cost.
With respect to this, some less expensive and more abundant non-platinum catalysts with acceptable performance have been widely explored. For instance, Pd-based catalysts have been found to have good a performance in ethanol electrooxidation, and therefore are considered to be good candidates for DEFCs [
9,
10]. Pd alloying with non-noble metals (Fe, Co, Ni,
etc.) to produce multiple-component catalysts has also tested to be one of the effective approaches in enhancing the catalytic activity, decreasing the loading of noble metals, and then reducing the cost of Pd catalysts [
11,
12]. Furthermore, the nanostructure types of Pd-alloy catalysts have also been identified to play a considerable role in improving the catalyst’s performance towards the ethanol electrooxidation [
13]. Among the different nanostructures of Pd-alloy materials, hollow nanostructure represents a new type of catalyst because of their high surface area, low density, easy recovery, self-supporting capacity, and high surface permeability [
14,
15]. In this regard, various hollow nanostructures including hollow nanospheres [
16] and hollow nanotubes [
17] have been reported in literature. Meanwhile, the ideal catalyst supports with large surface areas, good conductivity and strong adsorption of metals have been demonstrated to have the ability to improve the dispersion of metal nanoparticles, and thereby enhance the utilization and efficiency of the noble metal electrocatalysts [
18,
19]. Among different catalyst supports, graphene-based materials have been considered to be one of the ideal catalyst supports because they possess a large surface area, good thermal and chemical stability as well as great electrical conductivity [
20,
21]. However, when metal or metal alloy particles are supported on the graphene surface, they tend to aggregate together due to the inefficient binding sites on the pristine graphene surface for anchoring metal nanoparticles. To improve the binding interaction between the catalyst particles and the graphene surface, some doping strategies to create more binding sites has been developed. For example, when graphene is doped with nitrogen to form N-doped graphene (NG), the binding interaction can be significantly improved [
22]. It was observed that with the introduction of nitrogen into graphene support material, the metal nanoparticles could be homogeneously anchored onto the support, leading to the generation of MeN
x (Me Co, Fe) active sites, and thereby enhancing the electrocatalytic activity and utilization efficiency of the catalysts [
23]. The studies showed that the N species on the graphene surface could play an important role in controlling and regulating the shape and size of metal nanoparticles [
24]. Therefore, design and synthesis of hollow Pd-alloy nanosphere catalysts supported on N-doped graphene represent a new way to improve the performance and utilization of catalysts with the reduced cost.
In this paper, hollow PdCu-alloy nanocube catalysts supported on N-doped graphene (H-PdCu/ppy-NG) are successfully synthesized by a facile and low-cost method. The results indicate that the successfully synthesized N-doped graphene can tightly support hollow PdCu-alloy nanocubes with a uniform dispersion on the support and a relatively narrow distribution of catalyst particle size. Electrochemical characterizations reveal that the H-PdCu/ppy-NG catalyst has both excellent catalytic activity and stability toward ethanol electrooxidation in alkaline electrolyte, demonstrating that this catalyst would be a promising anode catalyst for DEFCs.
2. Results and Discussion
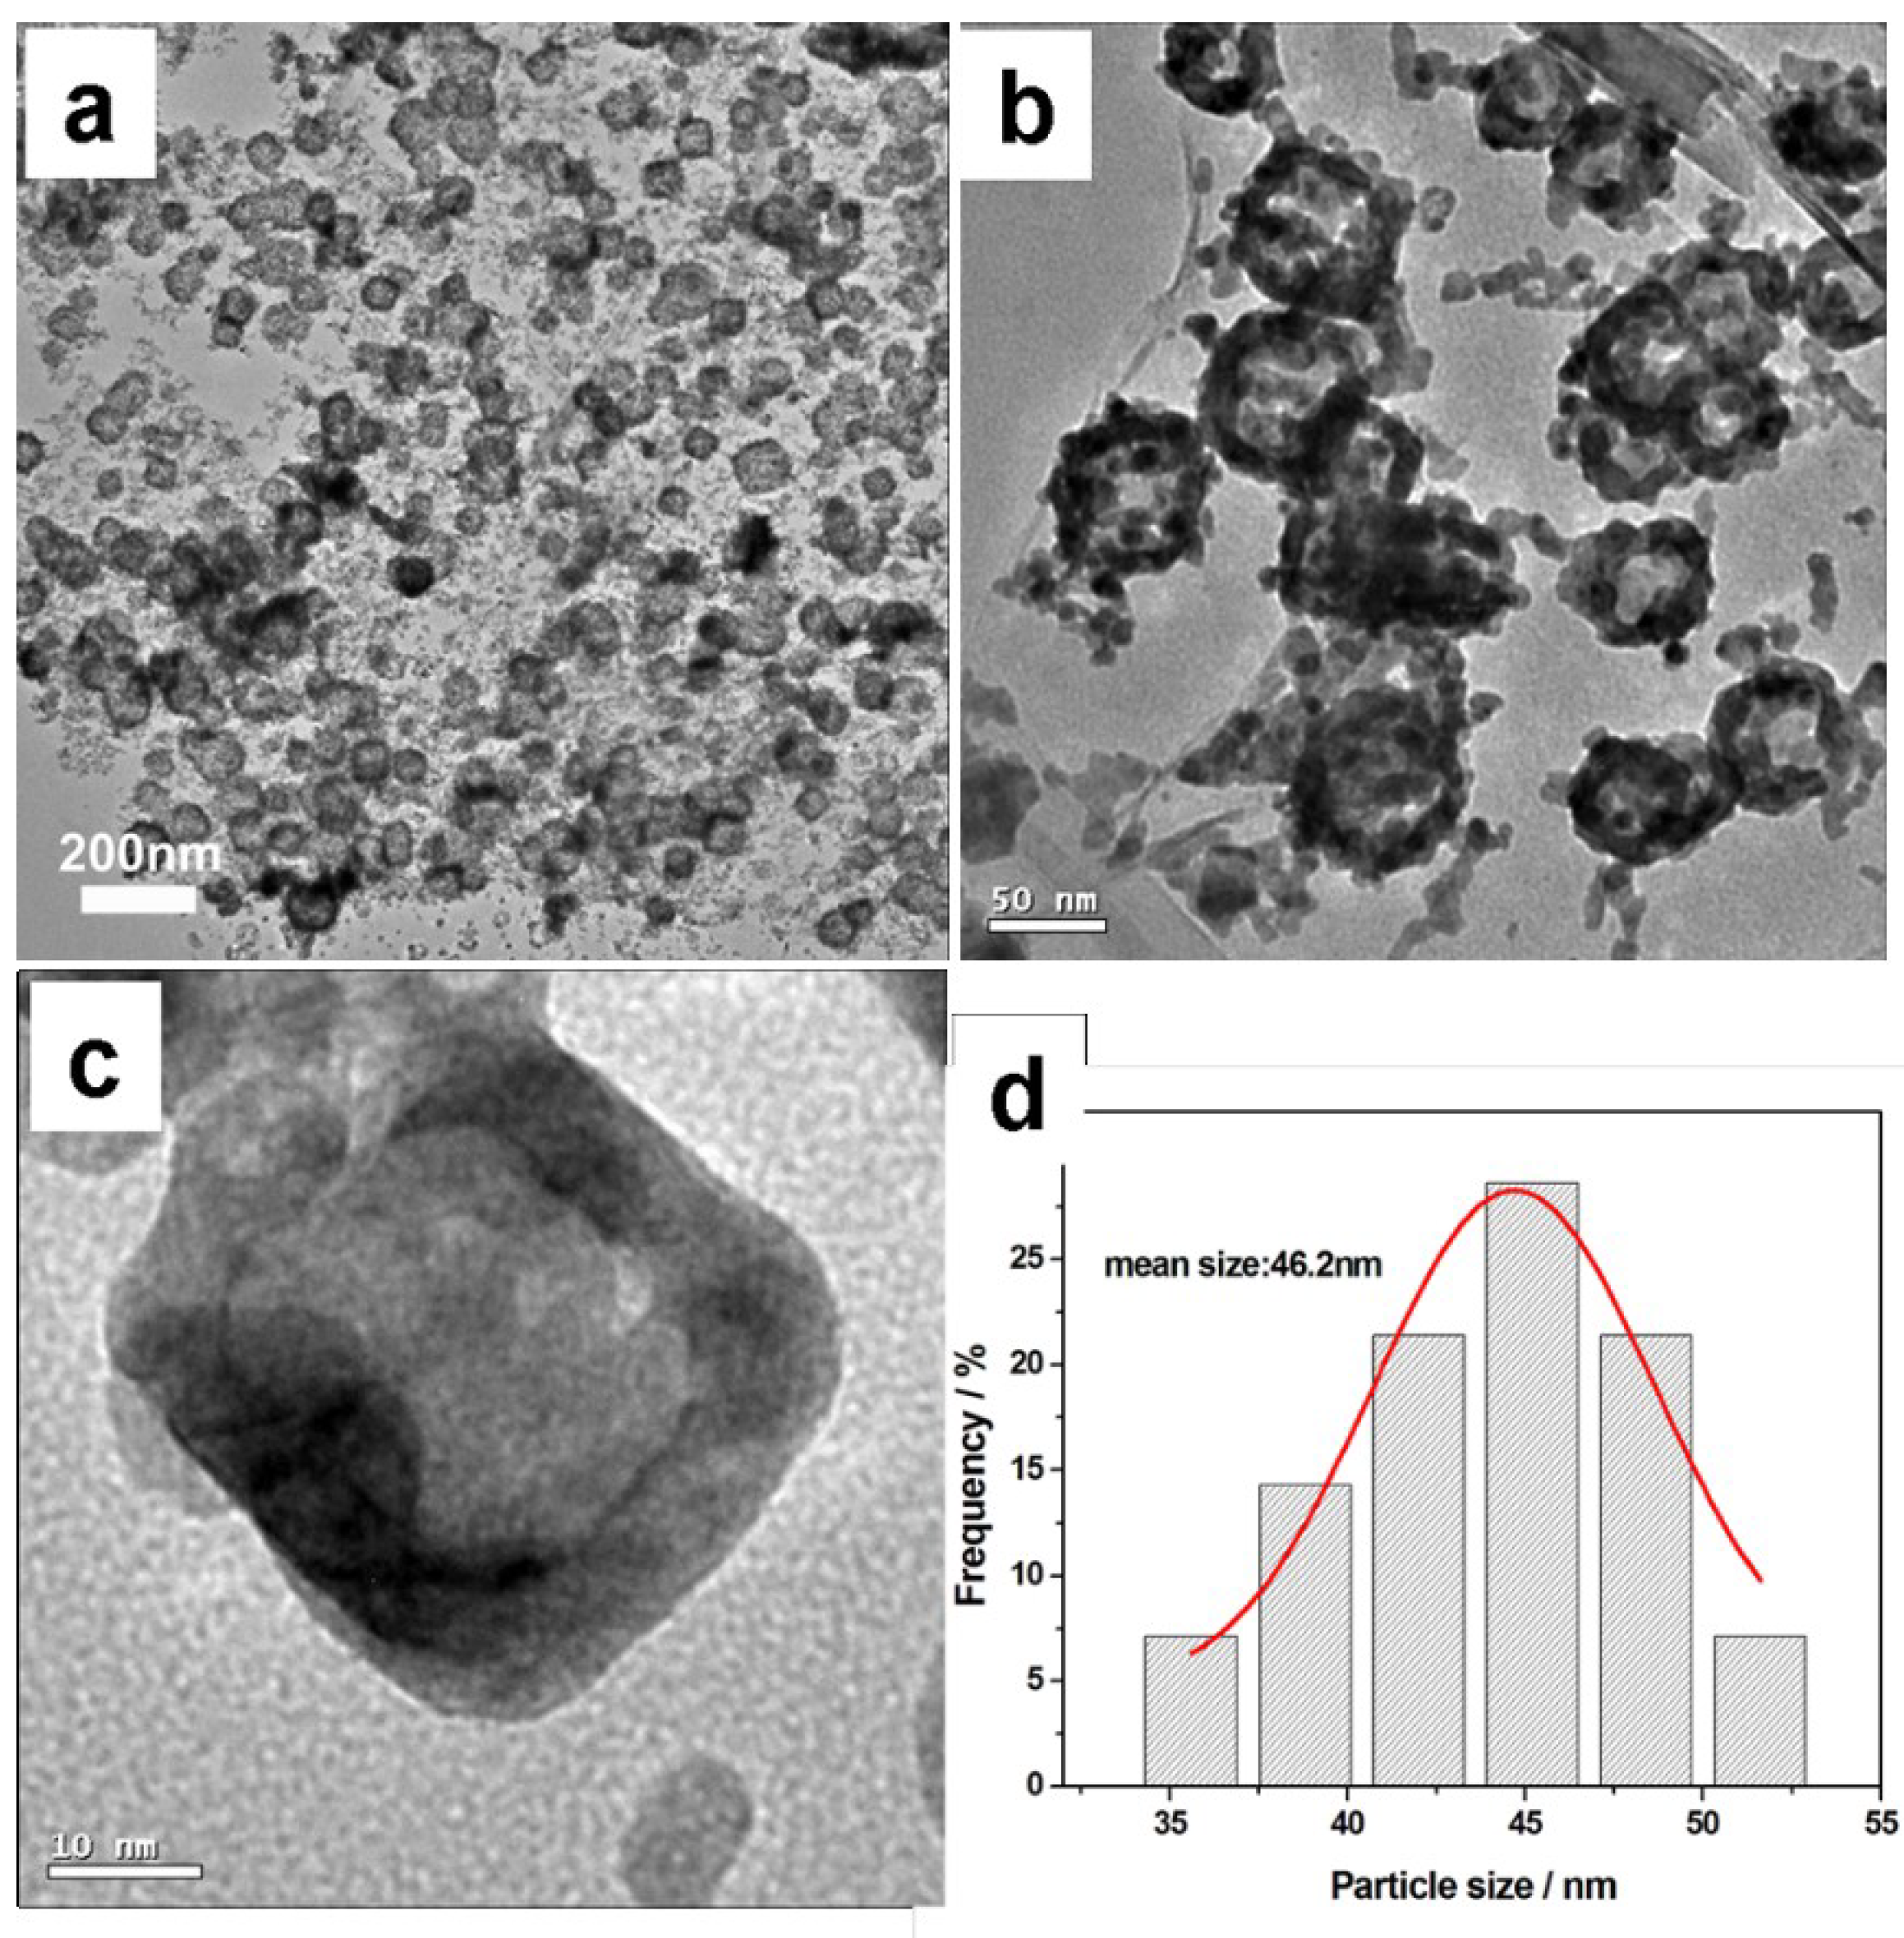
Figure 1 shows the TEM images and the size frequency curve of the resulting sample from the typical experiment. From
Figure 1a, it can be seen that the hollow PdCu nanocubes are uniformly dispersed on the N-doped graphene surface with a uniform dispersion and a narrow particle size distribution. The catalyst particle diameters from the amplificatory TEM image vary from 35 to 53 nm, and the mean size calculated by the lognormal distribution is about 46.2 nm (
Figure 1d). As observed in
Figure 1c, the metal shell is clearly visible due to its higher contrast compared to the central cavity region. The contrast difference can prove the existence of the hollow structure. To better investigate the formation mechanism of hollow nanocubes in our system, two sets of control experiments were carried out.
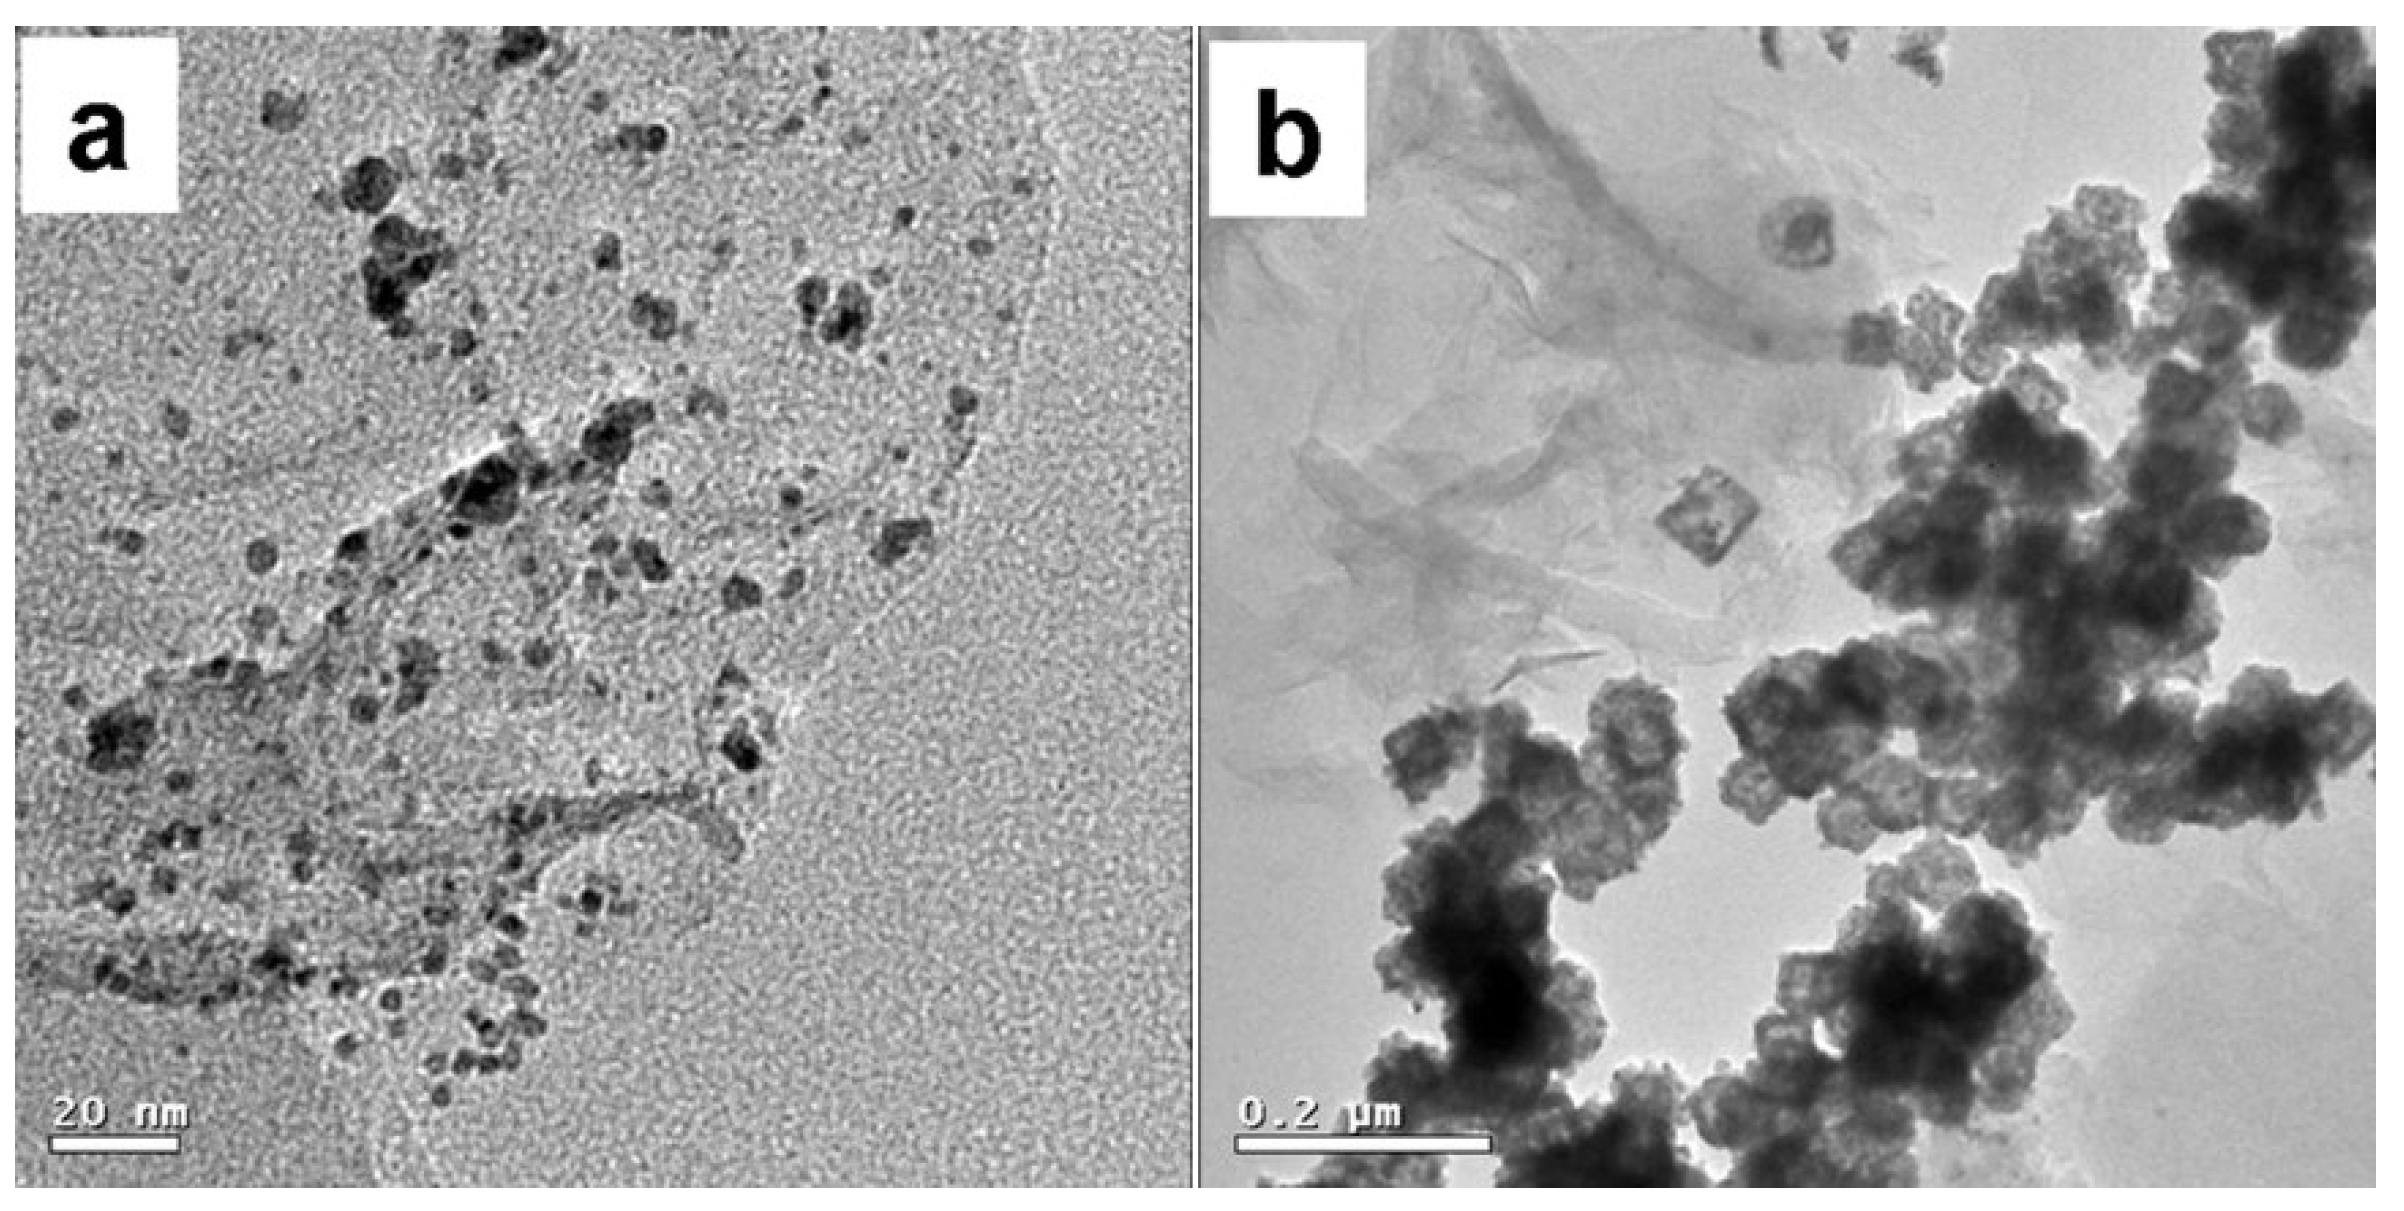
Figure 2 shows the TEM images from the control experiments. Control A was carried out under the same conditions described as the typical experiment, apart from 140 °C as the reaction tempeture. When a lower temperature (
i.e., 140 °C) was adopted, only solid PdCu nanoparticles supported on ppy-NG could be observed (
Figure 2a), which might be due to that the low temperature was not conducive to oriented attachment process in the dynamics. As shown in
Figure 2a, the PdCu alloy nanoparticles have near-spherical shapes and showed a slight agglomeration. It demonstrates that reaction tempeture is important in controlling and regulating the shape and size of the hollow nanospheres. To further study the effect of N doping, control B was done in the same conditions described as the typical experiment, apart from the RGO as the support.
Figure 2b shows the TEM image of the H-PdCu/RGO, in which a small quantity of hollow PdCu nanocubes was immobilized on the RGO compared with the typical experiment. This indicates that the N doping is a key factor to absorb PdCu nanoparticles onto the surface of the support. From the above results, it can be believed that a much more uniform size and distribution of H-PdCu nanoparticles relies on the cooperation of the appropriate reaction temperature and N doping.
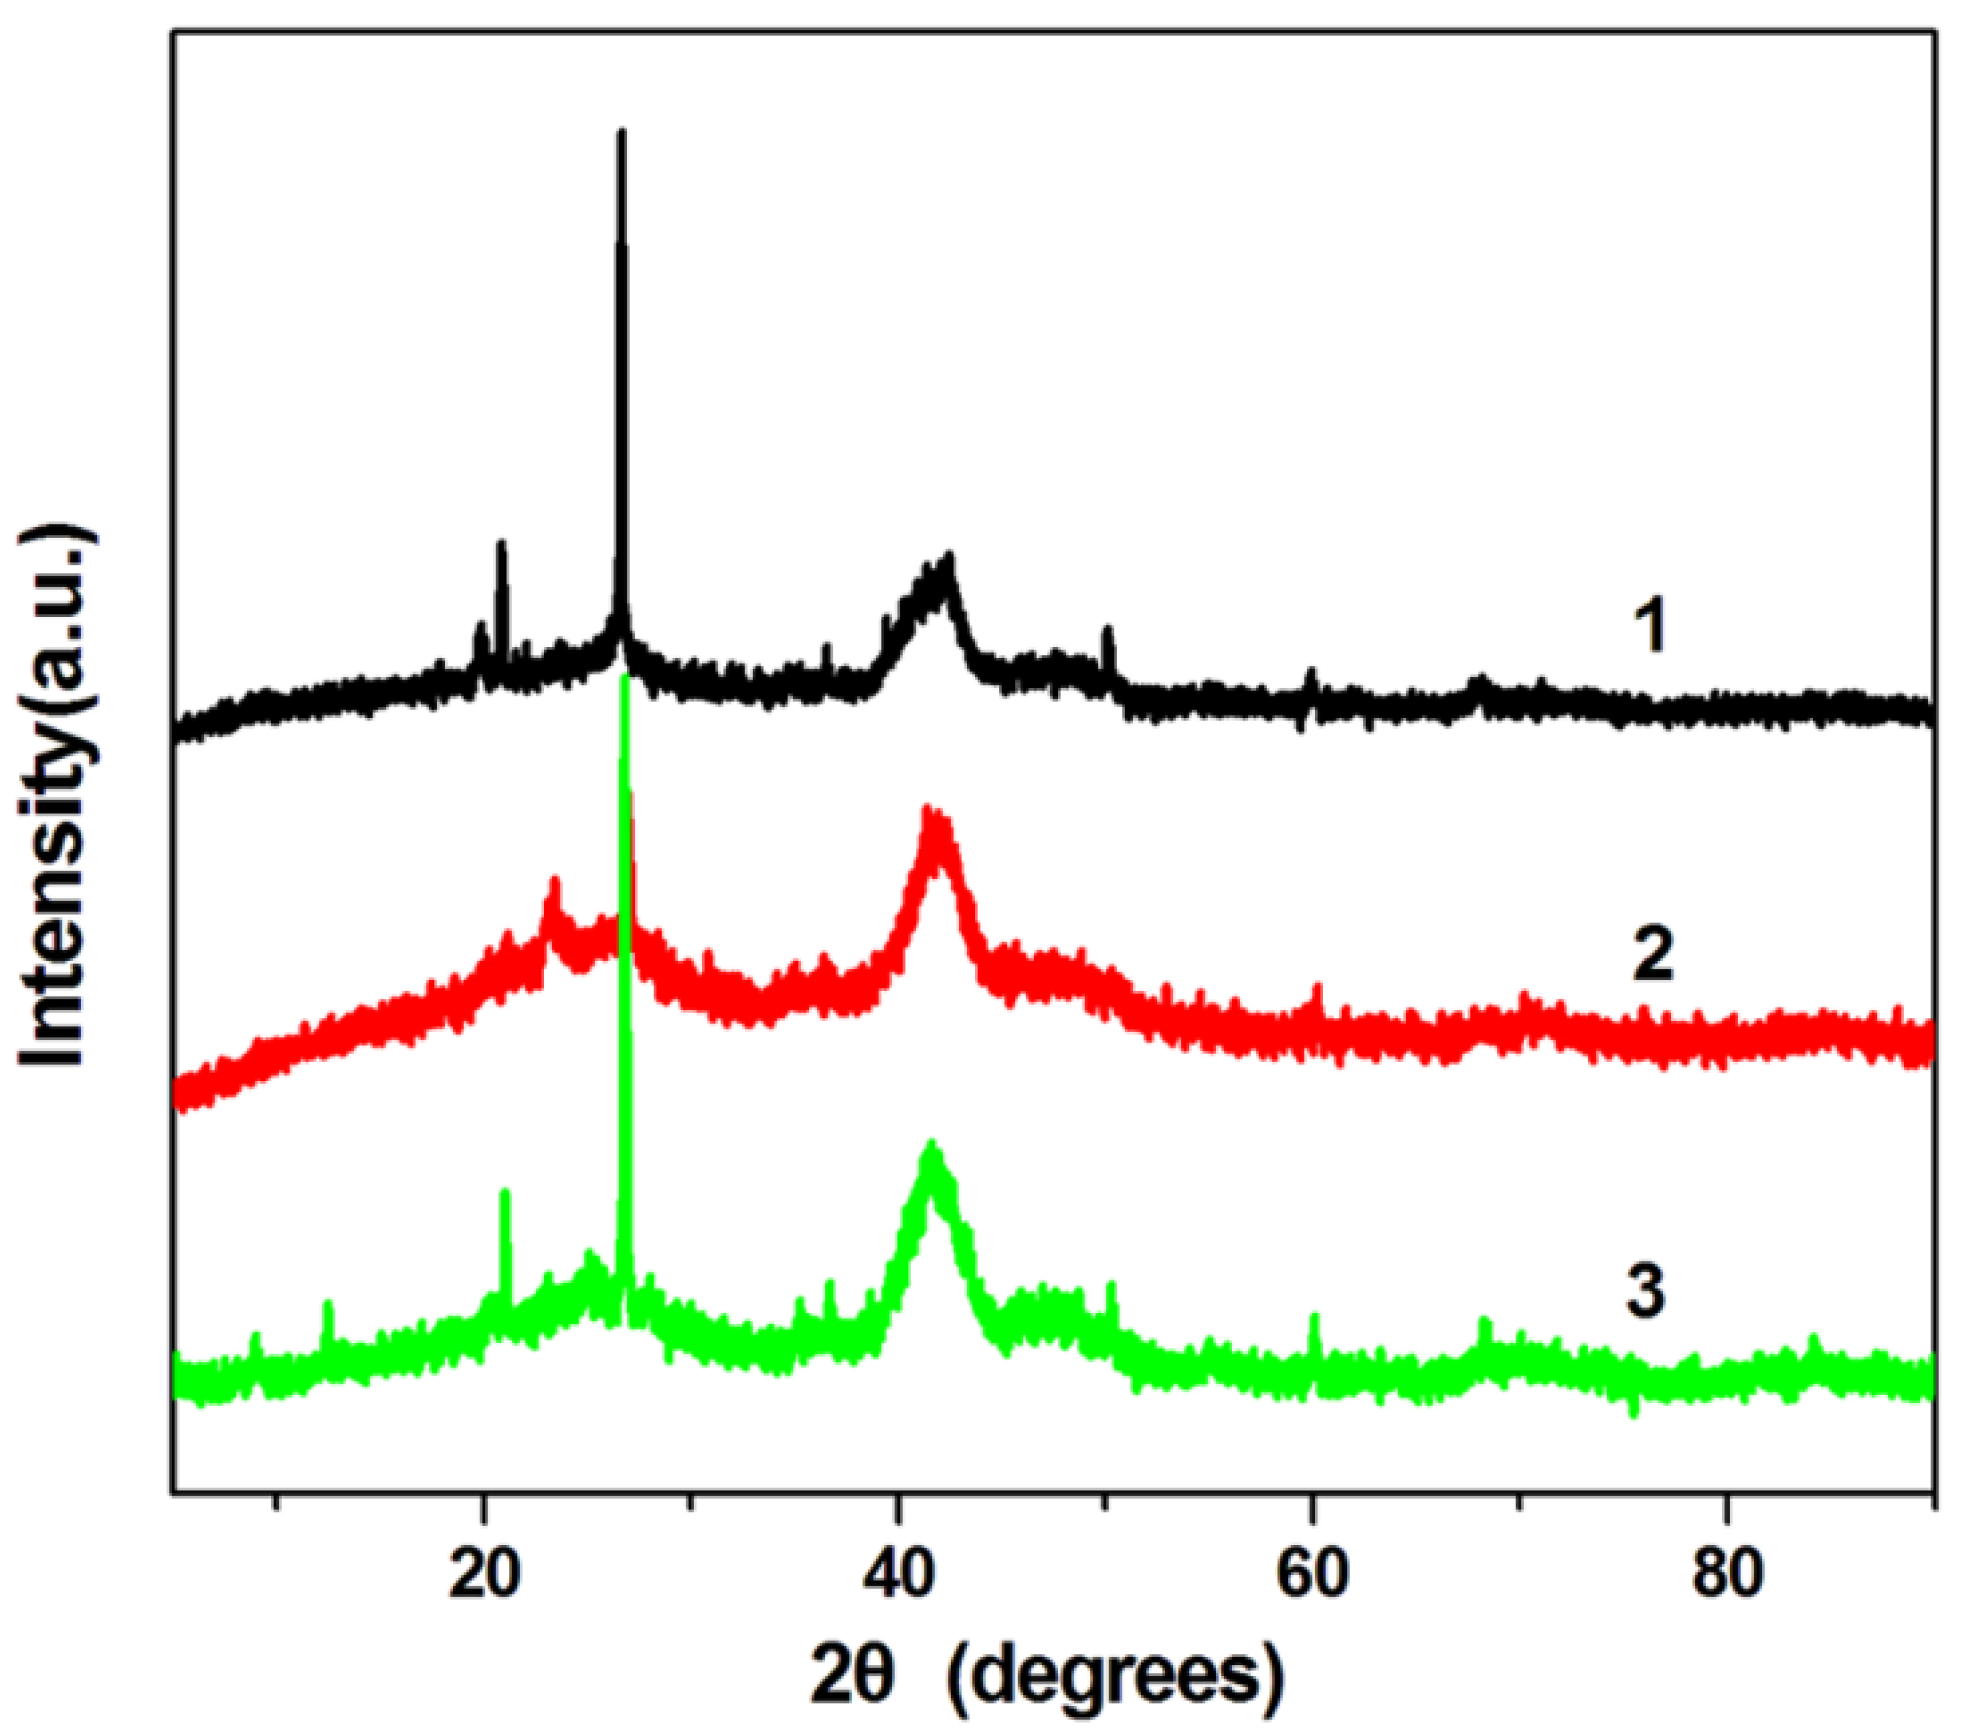
Figure 3 shows the XRD patterns of H-PdCu/ppy-NG, PdCu/ppy-NG and H-PdCu/RGO catalysts, respectively. As displayed in
Figure 3, four peaks at 39.8°, 46.1°, 68.6° and 81.9° are characteristics of face-centered-cubic (fcc) crystalline Pd, which are corresponding to the facets (111), (200), (220), and (311), respectively. Obviously, the peak positions for H-PdCu/RGO slightly shift to higher angles when compared to Pd/RGO, which is ascribed to the formation of PdCu alloy. Additionally, the peak at 21.5° in each case can be attributed to the (002) planes of RGO, which is different from that sharp peak centered at 10.2° for GO, indicating the decreased interlayer distance from 0.71 to 0.34 nm [
25]. This is due to the removal of oxygen-containing functional groups from the RGO. These observations demonstrate that the GO was efficiently transformed to RGO. Moreover, the XRD pattern of H-PdCu/ppy-NG is consistent with that of H-PdCu/RGO. It can be concluded that the crystal structure of RGO is not changed after N doping.
Figure 1.
TEM images of TEM images (a–c) and the size frequency curve (d) of H-PdCu/ppy-NG.
Figure 1.
TEM images of TEM images (a–c) and the size frequency curve (d) of H-PdCu/ppy-NG.
Figure 2.
TEM images from PdCu/ppy-NG (a) and H-PdCu/RGO (b) catalysts.
Figure 2.
TEM images from PdCu/ppy-NG (a) and H-PdCu/RGO (b) catalysts.
Figure 3.
XRD patterns of H-PdCu/ppy-NG (Curve 1), PdCu/ppy-NG (Curve 2) and H-PdCu/RGO (Curve 3) catalysts.
Figure 3.
XRD patterns of H-PdCu/ppy-NG (Curve 1), PdCu/ppy-NG (Curve 2) and H-PdCu/RGO (Curve 3) catalysts.
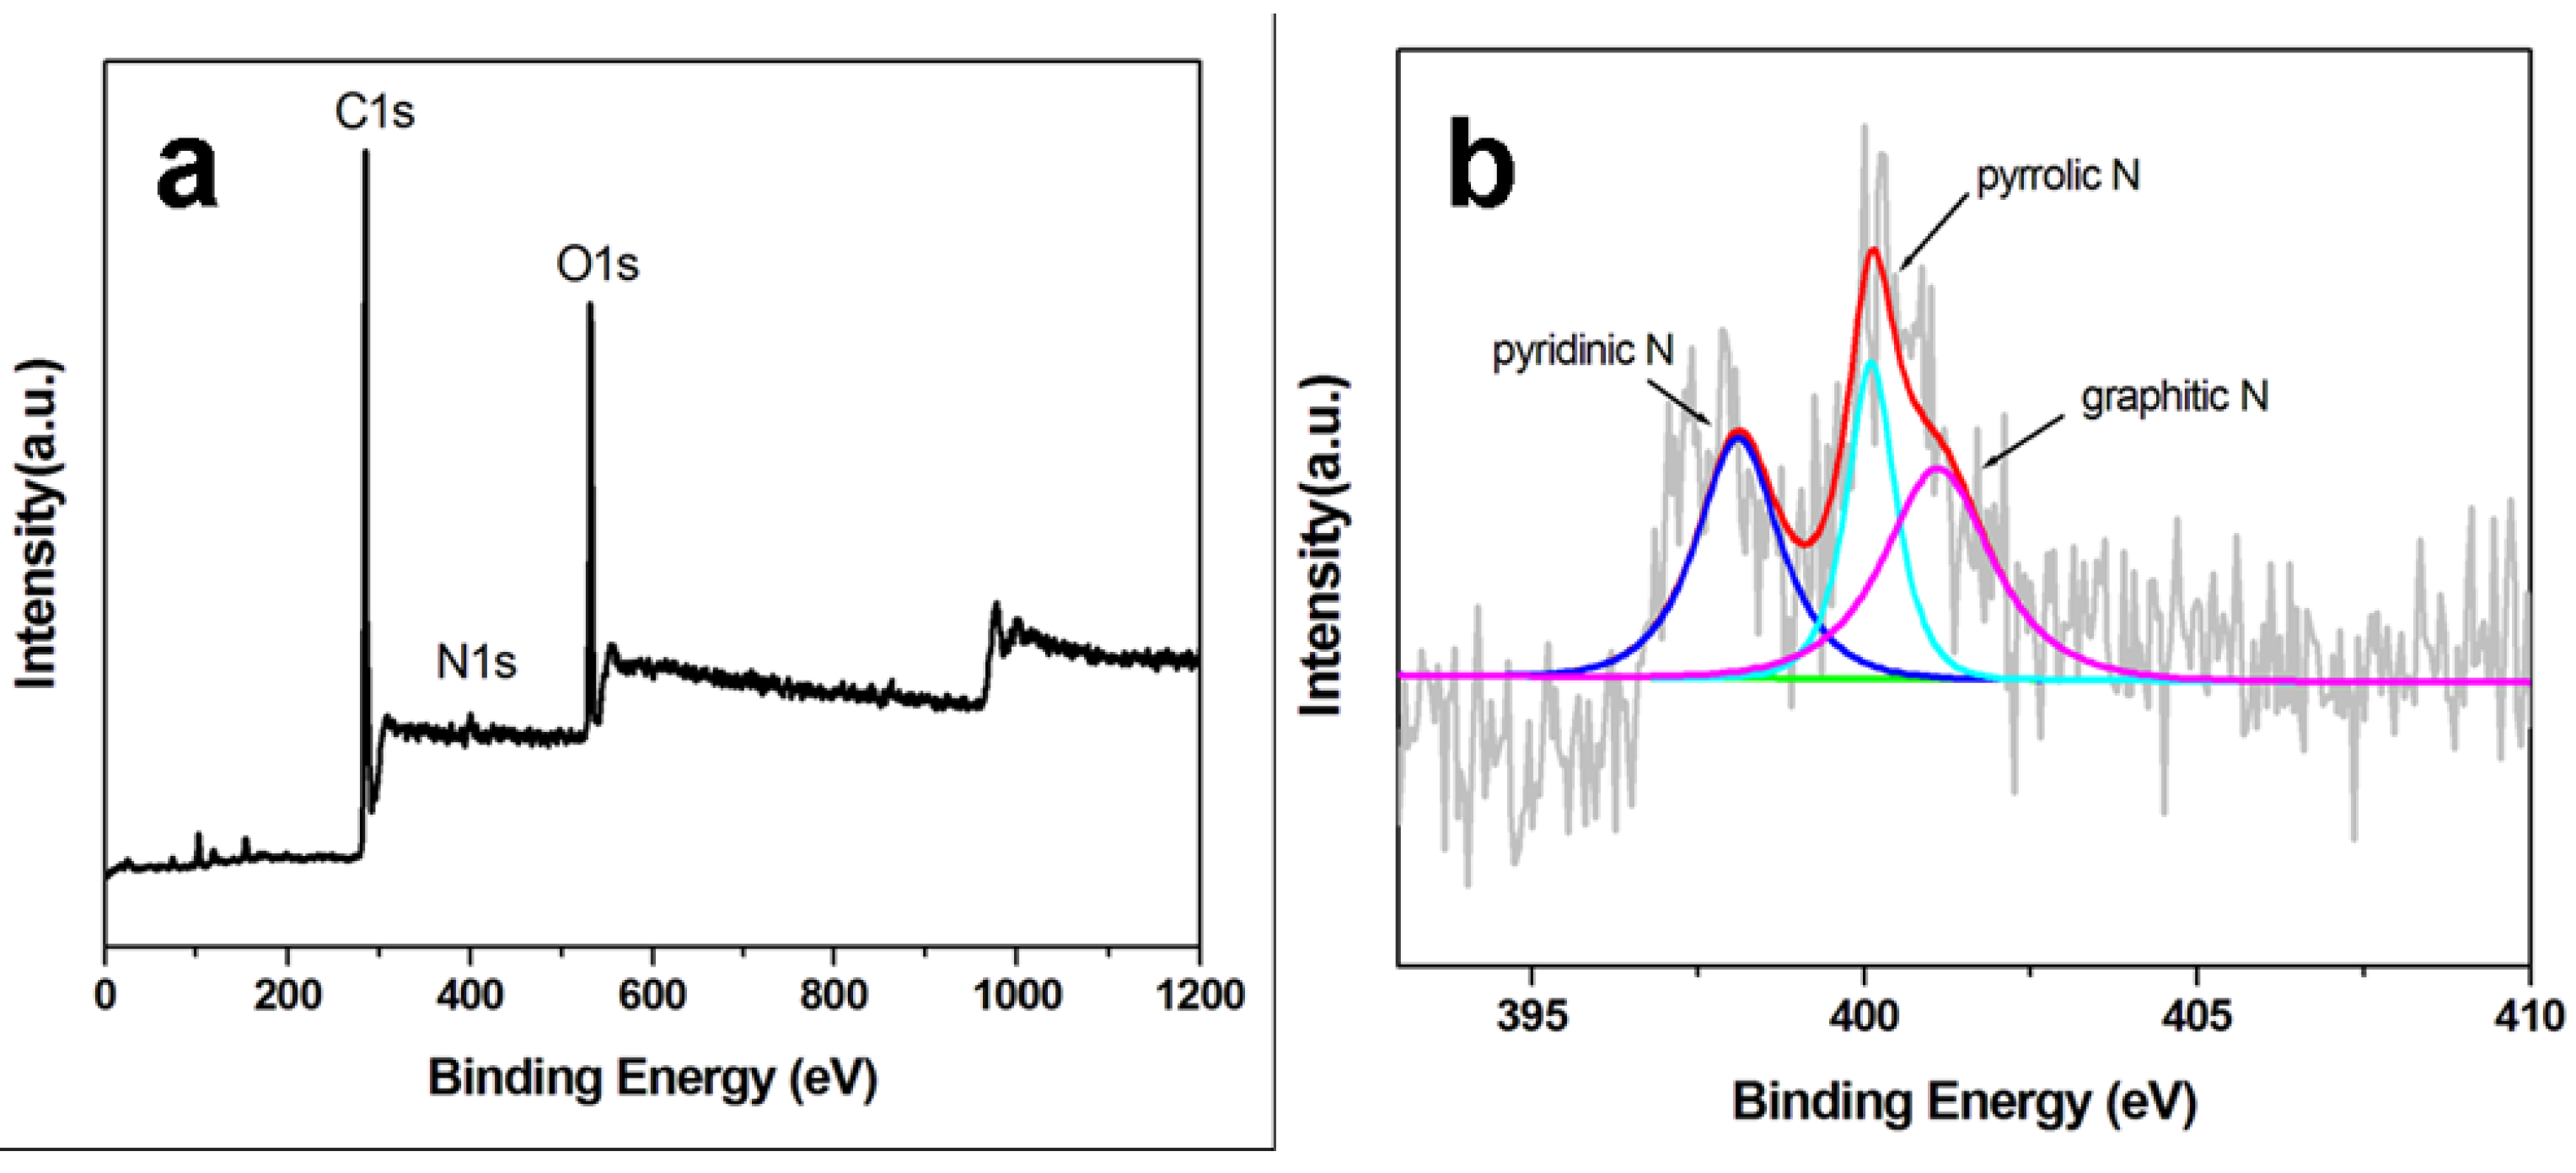
The surface chemical states and elemental compositions of ppy-NG support were analyzed by XPS.
Figure 4 shows the XPS spectra of the ppy-NG and the corresponding high-resolution N1s spectrum. The survey-scan spectrum of ppy-NG support is mainly dominated by the signals of C 1s, N 1s and O 1s elements. The presence of N1s peak at about 400 eV demonstrates the successful incorporation of nitrogen in NG supports. From
Figure 4b, the high-resolution N1s spectrum can be deconvoluted into three peaks, which correspond to three individual N-containing species. The peak at about 400.1 eV can be assigned to pyrrolic N species from the pentagonal ring of ppy, 398.1 eV to pyridinic N, and 401.1 eV to graphitic N, respectively. From the sizes of the peaks, it can be calculated that the total N content in ppy-NG is 1.62%, which contains 15% of pyrrolic N, 43% of pyridinic N and 42% of graphitic N. More pyridinic N and graphitic N species on ppy-NG surfaces should be helpful to load more H-PdCu for enhancing the catalytic activity of the H-PdCu/ppy-NG.
Figure 4.
XPS spectra of ppy-NG support (a) and its corresponding high-resolution N1s spectrum (b).
Figure 4.
XPS spectra of ppy-NG support (a) and its corresponding high-resolution N1s spectrum (b).
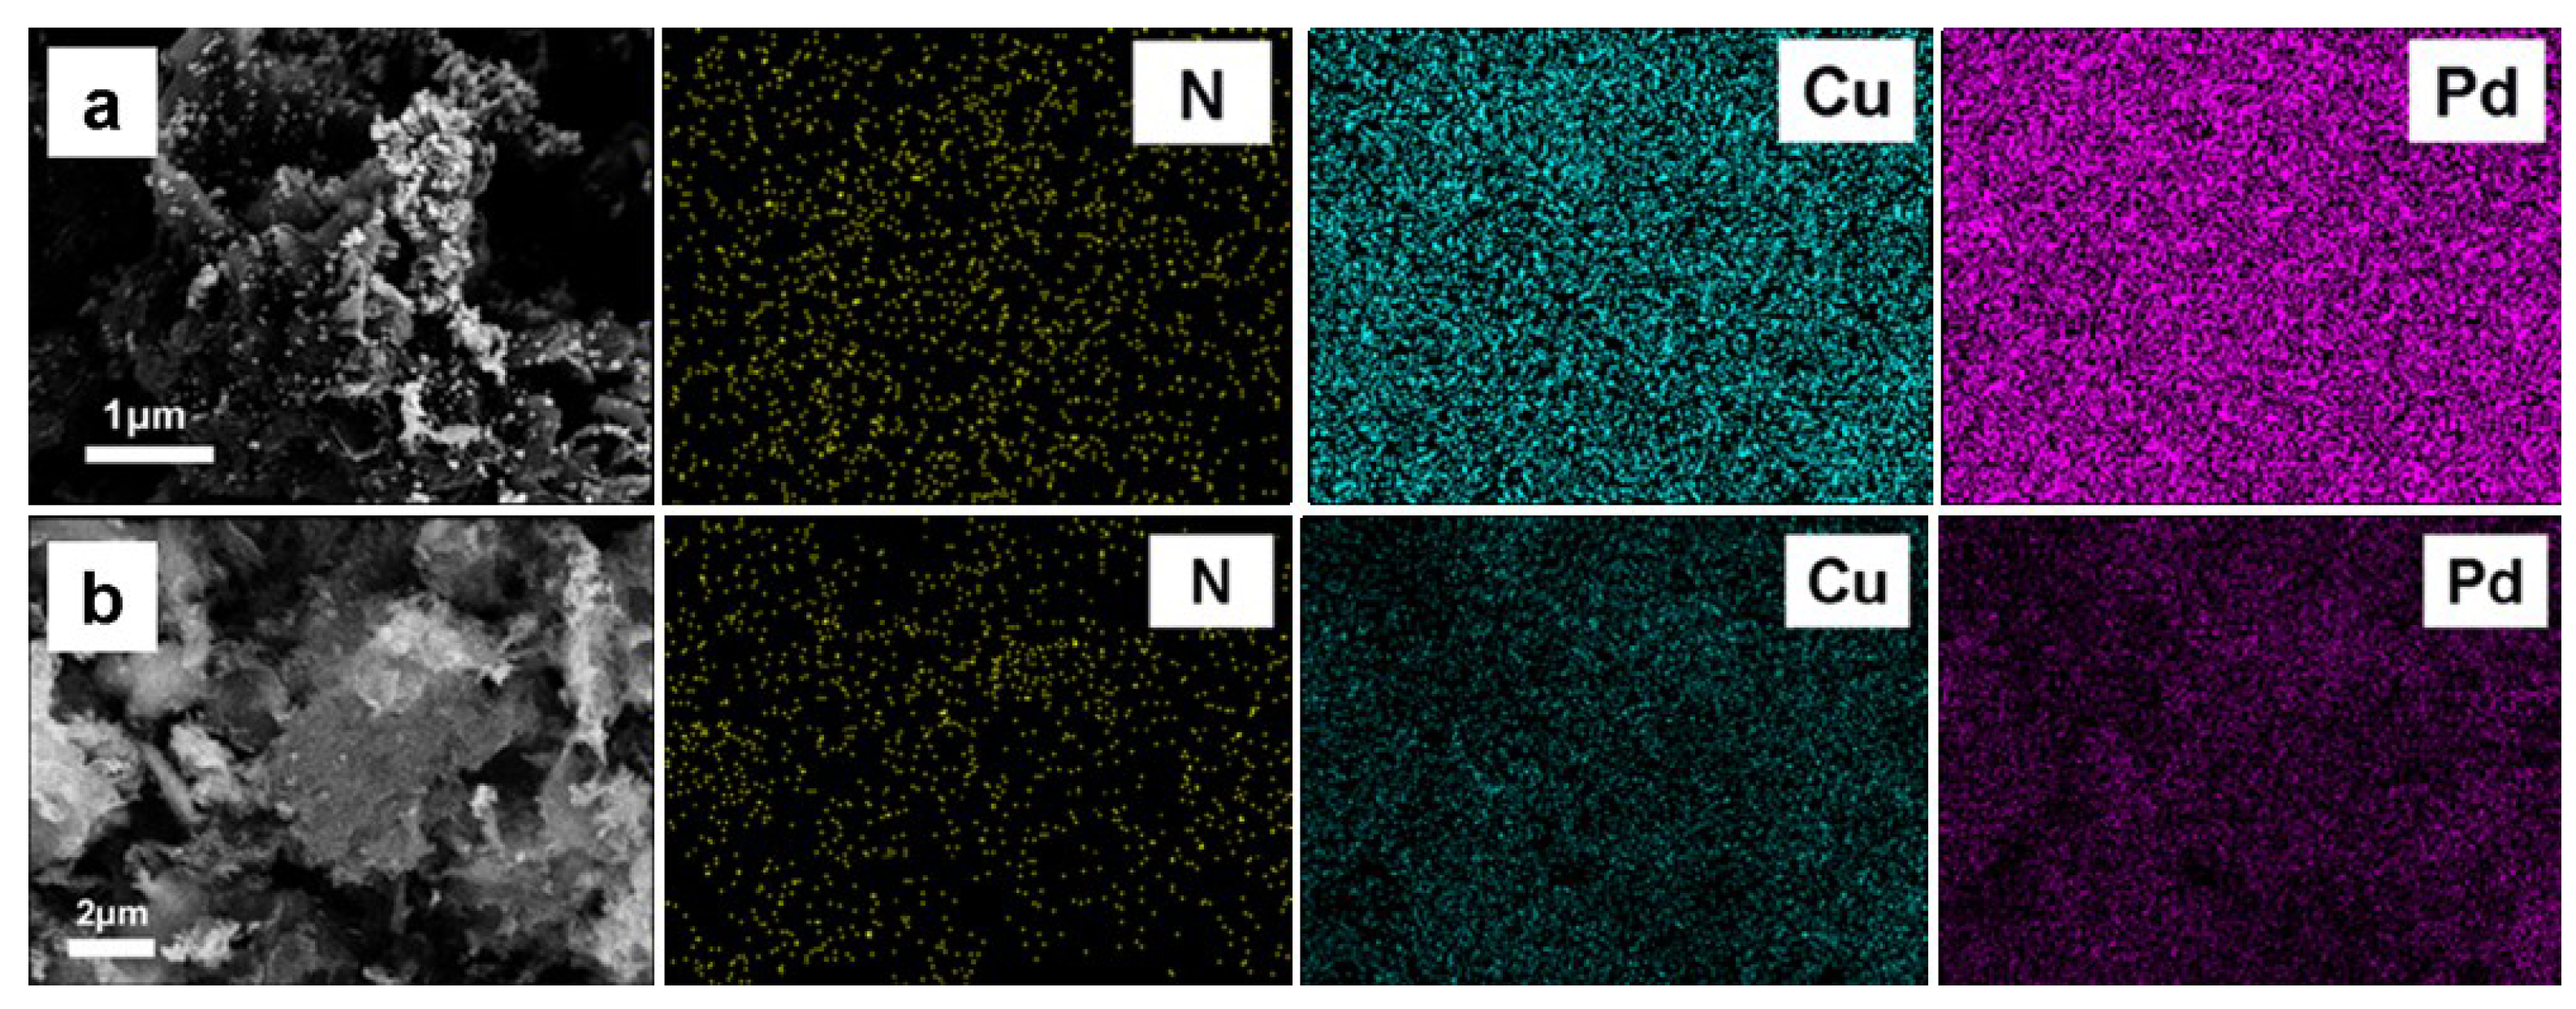
In order to investigate the distribution of the different elements in the catalysts, elemental mapping measurements were also performed.
Figure 5 shows the SEM images and the corresponding elemental mapping of the as-prepared catalysts from H-PdCu/ppy-NG (a) and PdCu/ppy-NG (b) catalysts. From the mapping images of the samples, a homogeneous distribution of N, Pd and Cu elements can be clearly observed, except from the C element. It can be seen that Pd and Cu are uniformly distributed in the mappings, which is in agreement with the TEM results. The results reveal that the graphene has been successfully doped by N and the N atoms are all homogeneous distributed in ppy-NG, which is in good accordance with the results of XPS spectra. In the process of N dope, the N atoms can provide highly effective functional groups on the surface of graphene, which contribute to the subsequent deposition of PdCu nanoparticles with a much more uniform size and distribution.
Figure 5.
FESEM images and the corresponding chemical mapping of H-PdCu/ppy-NG (a) and PdCu/ppy-NG (b) catalyst.
Figure 5.
FESEM images and the corresponding chemical mapping of H-PdCu/ppy-NG (a) and PdCu/ppy-NG (b) catalyst.
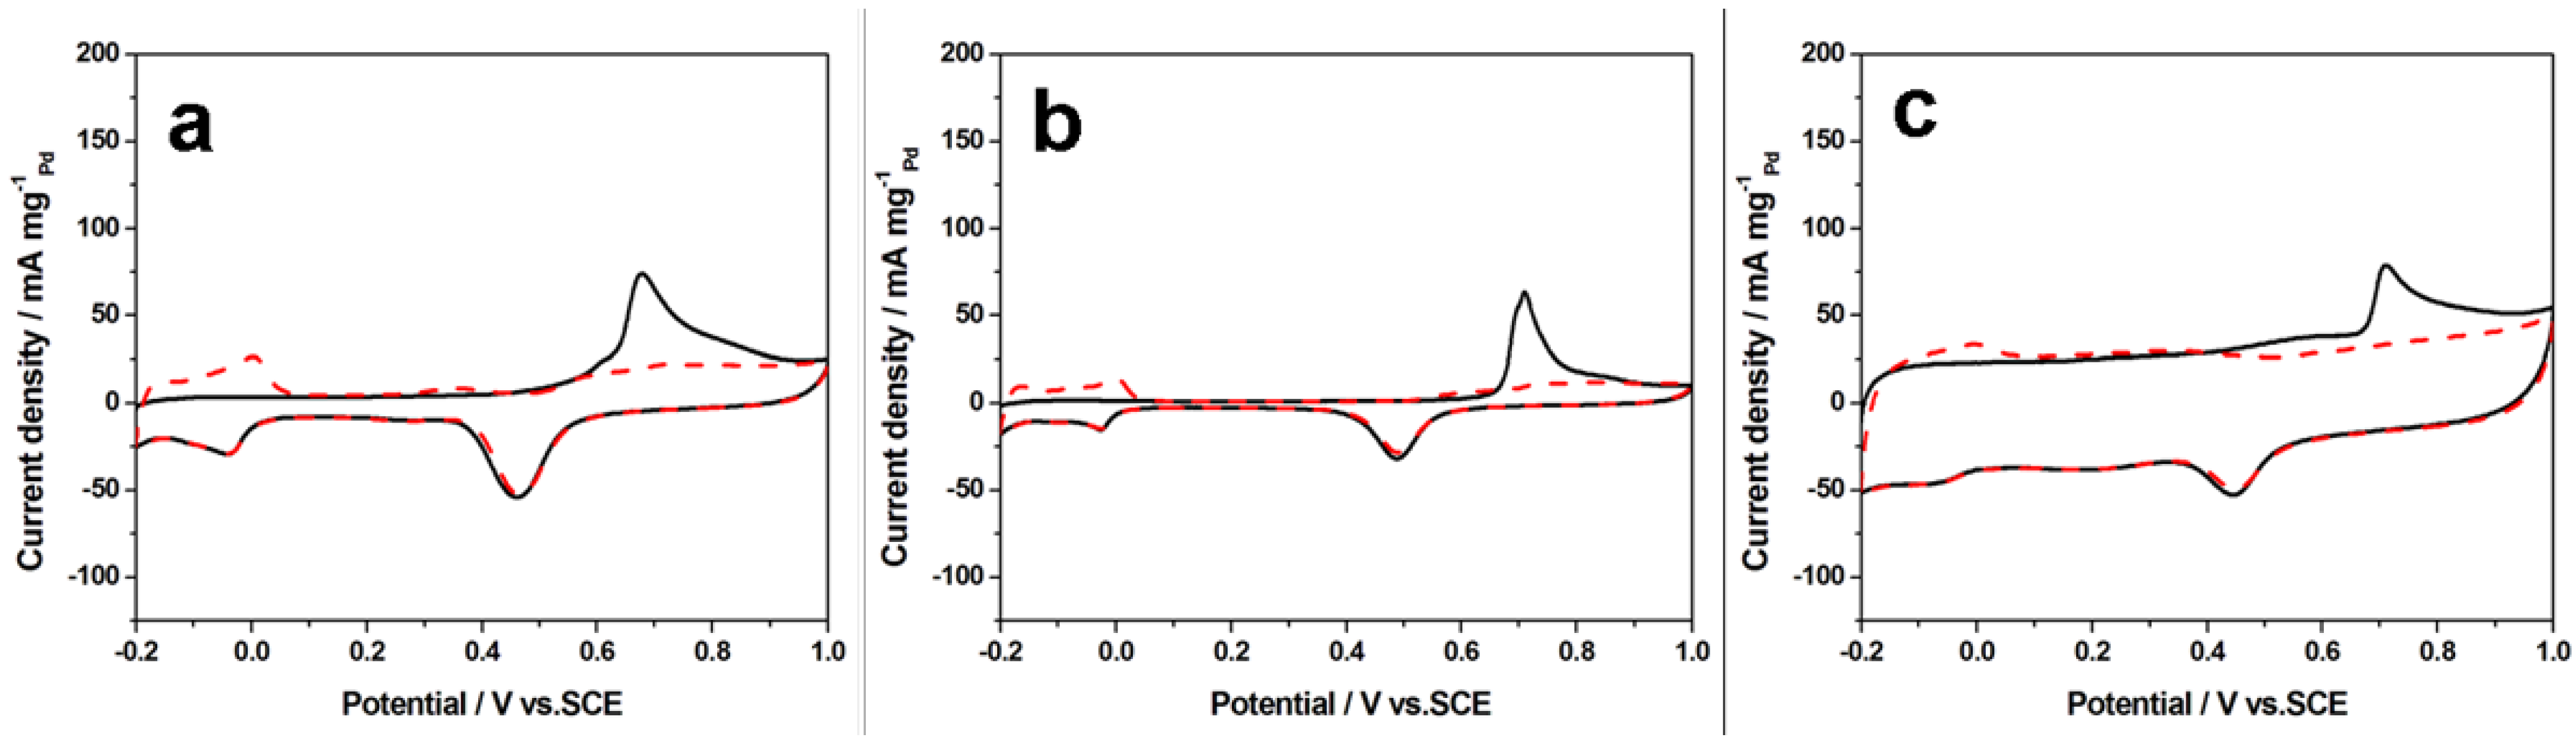
For evaluating the electrochemically-active surface areas (ECSA) of the catalysts, CO-stripping experiments were carried out in N
2-saturated 0.5 M H
2SO
4 electrolyte at a scan rate of 50 mV·s
−1.
Figure 6 shows the CO-stripping cyclic voltammograms (CVs) for three different catalysts (H-PdCu/ppy-NG (a), PdCu/ppy-NG (b) and H-PdCu/RGO (c), respectively). The corresponding ECSA values were calculated using Equation (1) [
26]:
where
Q is the charge of the CO desorption-electrooxidation in microcoulomb (μC),
G represents the total amount of Pd (μg) on the electrode, and 420 is the charge required to oxidize a monolayer of CO on the catalyst in μC·cm
−2. The calculated ECSA values are 268, 202, and 138 m
2·g
−1 for H-PdCu/ppy-NG, PdCu/ppy-NG and H-PdCu/RGO catalysts, respectively. Clearly, the ECSA value for the H-PdCu/ppy-NG catalyst is much larger than those of the other two, probably suggesting that H-PdCu/ppy-NG may be more active than both PdCu/ppy-NG and H-PdCu/RGO. Obviously, this ECSA value further demonstrates that N-doped graphene can effectively increase the active sites, and thereby may be able to enhance the catalytic activity and stability of the electrocatalysts.
The electrocatalytic activities for ethanol oxidation using the synthesized electrocatalysts were also analyzed by CV measurement in N
2-saturated 1.0 M KOH containing 1.0 M CH
3CH
2OH aqueous solution under the half-cell conditions at a scan rate of 50 mV·s
−1.
Figure 7 compares the CV curves of three catalysts of H-PdCu/ppy-NG, PdCu/ppy-NG and H-PdCu/RGO, respectively. In general, the ethanol electrooxidation can be characterized by two well-defined current peaks at the forward and reverse scans. In the forward scan, the oxidation peak in
Figure 7 is corresponding to the oxidation of freshly chemisorbed species which come from ethanol adsorption. The reverse scan peak is primarily associated with removal of carbonaceous species which are not completely oxidized in the forward scan. The value of the peak current in the forward scan represents the electrocatalytic activities of the electrocatalysts. From
Figure 7, two main peaks for ethanol oxidation in both forward and reverse scan directions can be observed at all three electrodes coated by three catalysts separately. The corresponding anodic peak current density of H-PdCu/ppy-NG is about 650 mA·mg
−1, much higher than those of the PdCu/ppy-NG (
ca. 320 mA·mg
−1) and H-PdCu/RGO (
ca. 150 mA·mg
−1). This demonstrates that H-PdCu/ppy-NG modified electrode can give an extraordinarily higher electrocatalytic activity than the other two for ethanol electrooxidation.
Figure 6.
Cyclic voltammograms (CVs) of the electrooxidation of pre-adsorbed CO on H-PdCu/ppy-NG (a); PdCu/ppy-NG (b) and H-PdCu/RGO (c) catalysts coated glassy carbon electrodes in N2-saturated 0.5 M H2SO4 aqueous solution with a scan rate of 50 mV·s−1 at 25 °C. Dashed curves were CVs for these catalyzed electrodes without CO adsorption.
Figure 7.
Cyclic voltammograms of H-PdCu/ppy-NG (Curve 1), PdCu/ppy-NG (Curve 2) and H-PdCu/RGO (Curve 3) coated glassy carbon electrodes. Electrolyte: N2-saturated 1.0 M KOH containing 1.0 M CH3CH2OH aqueous solution at 25 °C, potential scan rate: 50 mV·s−1.
Figure 7.
Cyclic voltammograms of H-PdCu/ppy-NG (Curve 1), PdCu/ppy-NG (Curve 2) and H-PdCu/RGO (Curve 3) coated glassy carbon electrodes. Electrolyte: N2-saturated 1.0 M KOH containing 1.0 M CH3CH2OH aqueous solution at 25 °C, potential scan rate: 50 mV·s−1.
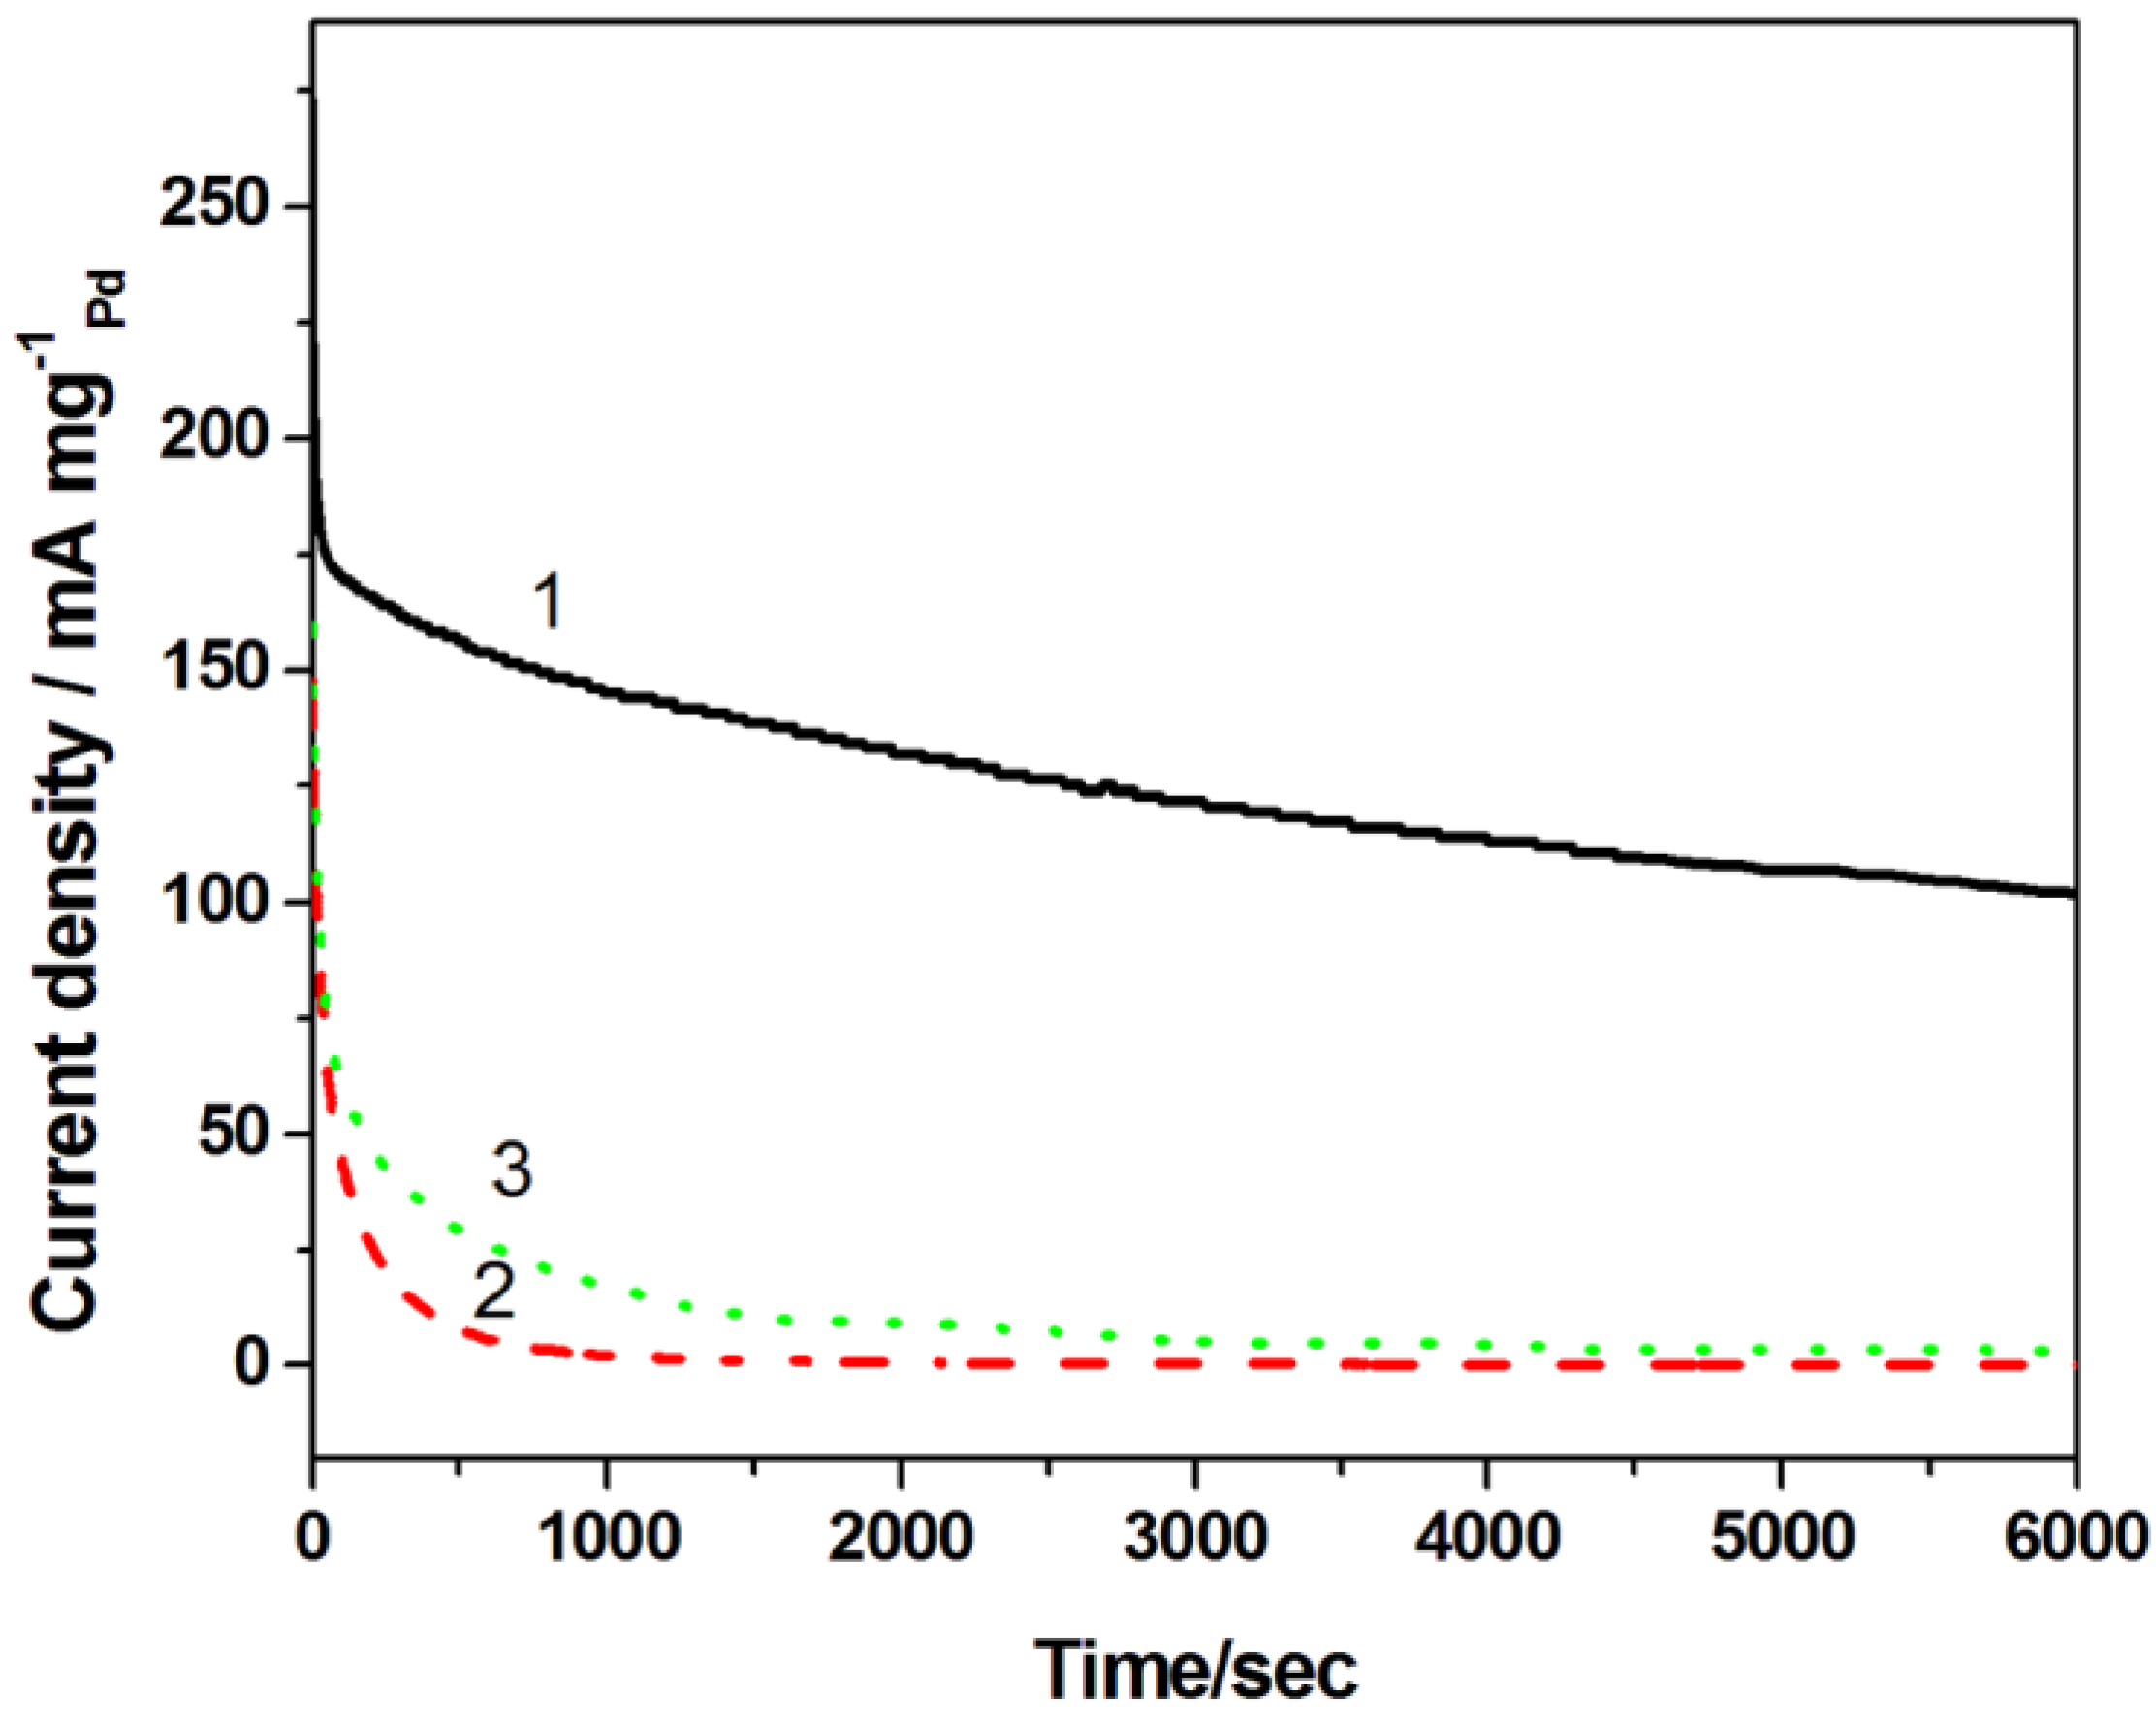
In order to compare the electrochemical stability of the catalysts for alcohol oxidation, chronoamperometric tests were carried out at −0.3 V for 6000 s in N
2-saturated 1 M NaOH solution containing 1 M ethanol (
Figure 8). Evidently, the H-PdCu/ppy-NG catalyst shows a much higher anodic current and a much slower degradation than other two catalysts. The result further demonstrates that the NG using ppy as a N source can significantly enhance both the activity and stability of the catalyst toward ethanol electrooxidation.
Figure 8.
Chronoamperometric curves of H-PdCu/ppy-NG (Curve 1), PdCu/ppy-NG (Curve 2) and H-PdCu/RGO (Curve 3) coated glassy carbon electrodes. Electrolyte: N2-saturated 1.0 M KOH containing 1.0 M CH3CH2OH aqueous solution at 25 °C. Electrode potential held at −0.3 V.
Figure 8.
Chronoamperometric curves of H-PdCu/ppy-NG (Curve 1), PdCu/ppy-NG (Curve 2) and H-PdCu/RGO (Curve 3) coated glassy carbon electrodes. Electrolyte: N2-saturated 1.0 M KOH containing 1.0 M CH3CH2OH aqueous solution at 25 °C. Electrode potential held at −0.3 V.

