1. Introduction
Metal oxide photocatalytic degradation of organic pollutants has attracted significant attention by researchers because of its usefulness in tackling environmental contaminants [
1]. Whereas titanium dioxide as a metal oxide seems to be one of the most promising semiconductors for many photocatalytic applications due to its low cost, chemical stability and non-toxicity. Its utilization remains typically confined to UV light because of its wide band gap (3.2 eV for anatase and 3.0 eV for rutile) [
2]. This limits the efficient utilization of solar energy for TiO
2 because TiO
2 cannot efficiently utilize solar light since UV light accounts for only 4–6% of solar radiation. Therefore, many attempts have been undertaken in recent decades to shift the threshold of the photo-response of TiO
2 into the visible region, which would enhance its potential for chemical solar energy conversion and open possibilities for further applications [
3,
4,
5,
6,
7].
One of the alternative approaches for achieving the threshold of the photo-response of TiO
2 into the visible region is to make a composite semiconductor by modifying TiO
2 with noble metals. These noble metals act separately or simultaneously depending on the photoreaction conditions, experimental methods used and they may (i) enhance the electron-hole separation by acting as electron traps [
8,
9,
10,
11], (ii) extend the light absorption into the visible range and enhance surface electron excitation by size- and shape-dependent plasmon resonances excited by visible light [
7,
12,
13,
14] and/or (iii) modify the surface properties of TiO
2 [
15,
16]. The early methods [
17,
18,
19], to produce noble-metal nanoparticles are still used today and continue to be the standard by which other synthesis methods are compared [
20,
21,
22]. In particular, silver as a noble metal has attracted considerable attention, as a result of its remarkable role in the improvement of the photo-activity of semiconductors [
9,
13,
23]. They could be reused, and handled more easily and economically if impregnated on substrates. Therefore, many researchers have focused on modifying TiO
2 with Ag by synthesis Ag/TiO
2 heterostructures [
8,
9,
10,
11,
12,
13,
14,
23,
24].
Although the synthesis of Ag/TiO
2 heterostructures was intensively reported in large quantities [
8,
9,
10,
11,
12,
13,
14,
23,
24], there are few reports about Ag/TiO
2 composite thin films with amounts of Ag > 18 mol%, prepared by chemical methods such as sol-gel, so far in the literatures. It is well reported that incorporating larger amount of Ag particles was limited by the sol-gel dip-coating method of up to 18 mol% due to Ag particles coalescing with each other into huge particles during sintering [
25]. Moreover, Ag/TiO
2 electrodes were short-lived because Ag NPs on TiO
2 are easily oxidized and dissolved in an electrolytic solution under vis-light irradiation [
26,
27]. Ag NPs must be coated with a SiO
2 shell or Al
2O
3 mask to prevent foremost their oxidation by TiO
2 [
26,
27]. By incorporating silver ions and Cu ions into clay minerals/TiO
2 mixtures with different ratio, it obtained composites capable of degrading ethanol in the visible wavelength range about twice as fast as the reference photocatalyst type P25 [
28,
29]. Using molecular precursor method (MPM), a coating precursor solution can be prepared by a reaction of Ti(O
iPr)
4 with ethylenediamine
-N,
N,
N′,
N'
-tetraacetic acid (EDTA) under the presence of dibutylamine and hydrogen peroxide [
30,
31,
32]. Consecutively, the Ag acetate ethanol solution can be easily prepared, simply by dissolving the silver salt in ethanol [
32,
33]. The two precursor solutions can be then mixed at different molar concentration to form a composite solution [
32,
33]. By spin coating the composite precursor solution on quartz glass substrates, the potential of producing metallic Ag-nanoparticles/titania (Ag NP/TiO
2) composite thin films with various and unprecedentedly high Ag particles, up to 80 mol% of Ag homogeneously distributed in a titania matrix can be fabricated by heat treated at 600 °C [
32,
33]. It was concluded that the MPM offers excellent miscibility of the silver and titania precursor solutions, and is effective for overcoming the limitations in miscibility of the conventional sol-gel method and is necessary for fabricating Ag/TiO
2 composite thin films with amounts of Ag ≤ 80 mol% [
32].
In this study, we report the photocatalytic activity of Ag-NP/TiO
2 composite thin films with various amounts of Ag (10≤ Ag mol% ≤ 80) in titania and compare them with pure TiO
2 thin film, both fabricated by the MPM. The relationship between the unprecedentedly high amounts of metallic silver in TiO
2 and photocatalytic decoloration rate of methylene blue was examined. Homogeneous distribution and growth of Ag-NP in the composite thin films were clarified by the FE-SEM and TEM observations. The absorption spectra of Ag-NP/TiO
2 composite thin films were analyzed by using Kubelk-Munk equation for diffuse reflectance spectra (DRS), in order to study the plasmonic effect of Ag-nanoparticles (Ag NP) in dielectric TiO
2 matrix. The findings demonstrated that a positive relationship exists between Ag NP surface plasmon absorption and the rate enhancements of decoloration and prove the hypothesis that the metallic plasmonic enhances rates of photocatalytic reactions [
24].
2. Results
The TiO
2 thin film and eight Ag-NP/TiO
2 composite thin films (COMP-Ag
n;
n = 10, 20, 30, 40, 50, 60, 70, and 80) were fabricated. The XRD and electrical conductivity results of these Ag-NP/TiO
2 composite thin films are presented in our recent paper [
32,
33].
2.1. Chemical Characterization of Thin Films by XPS
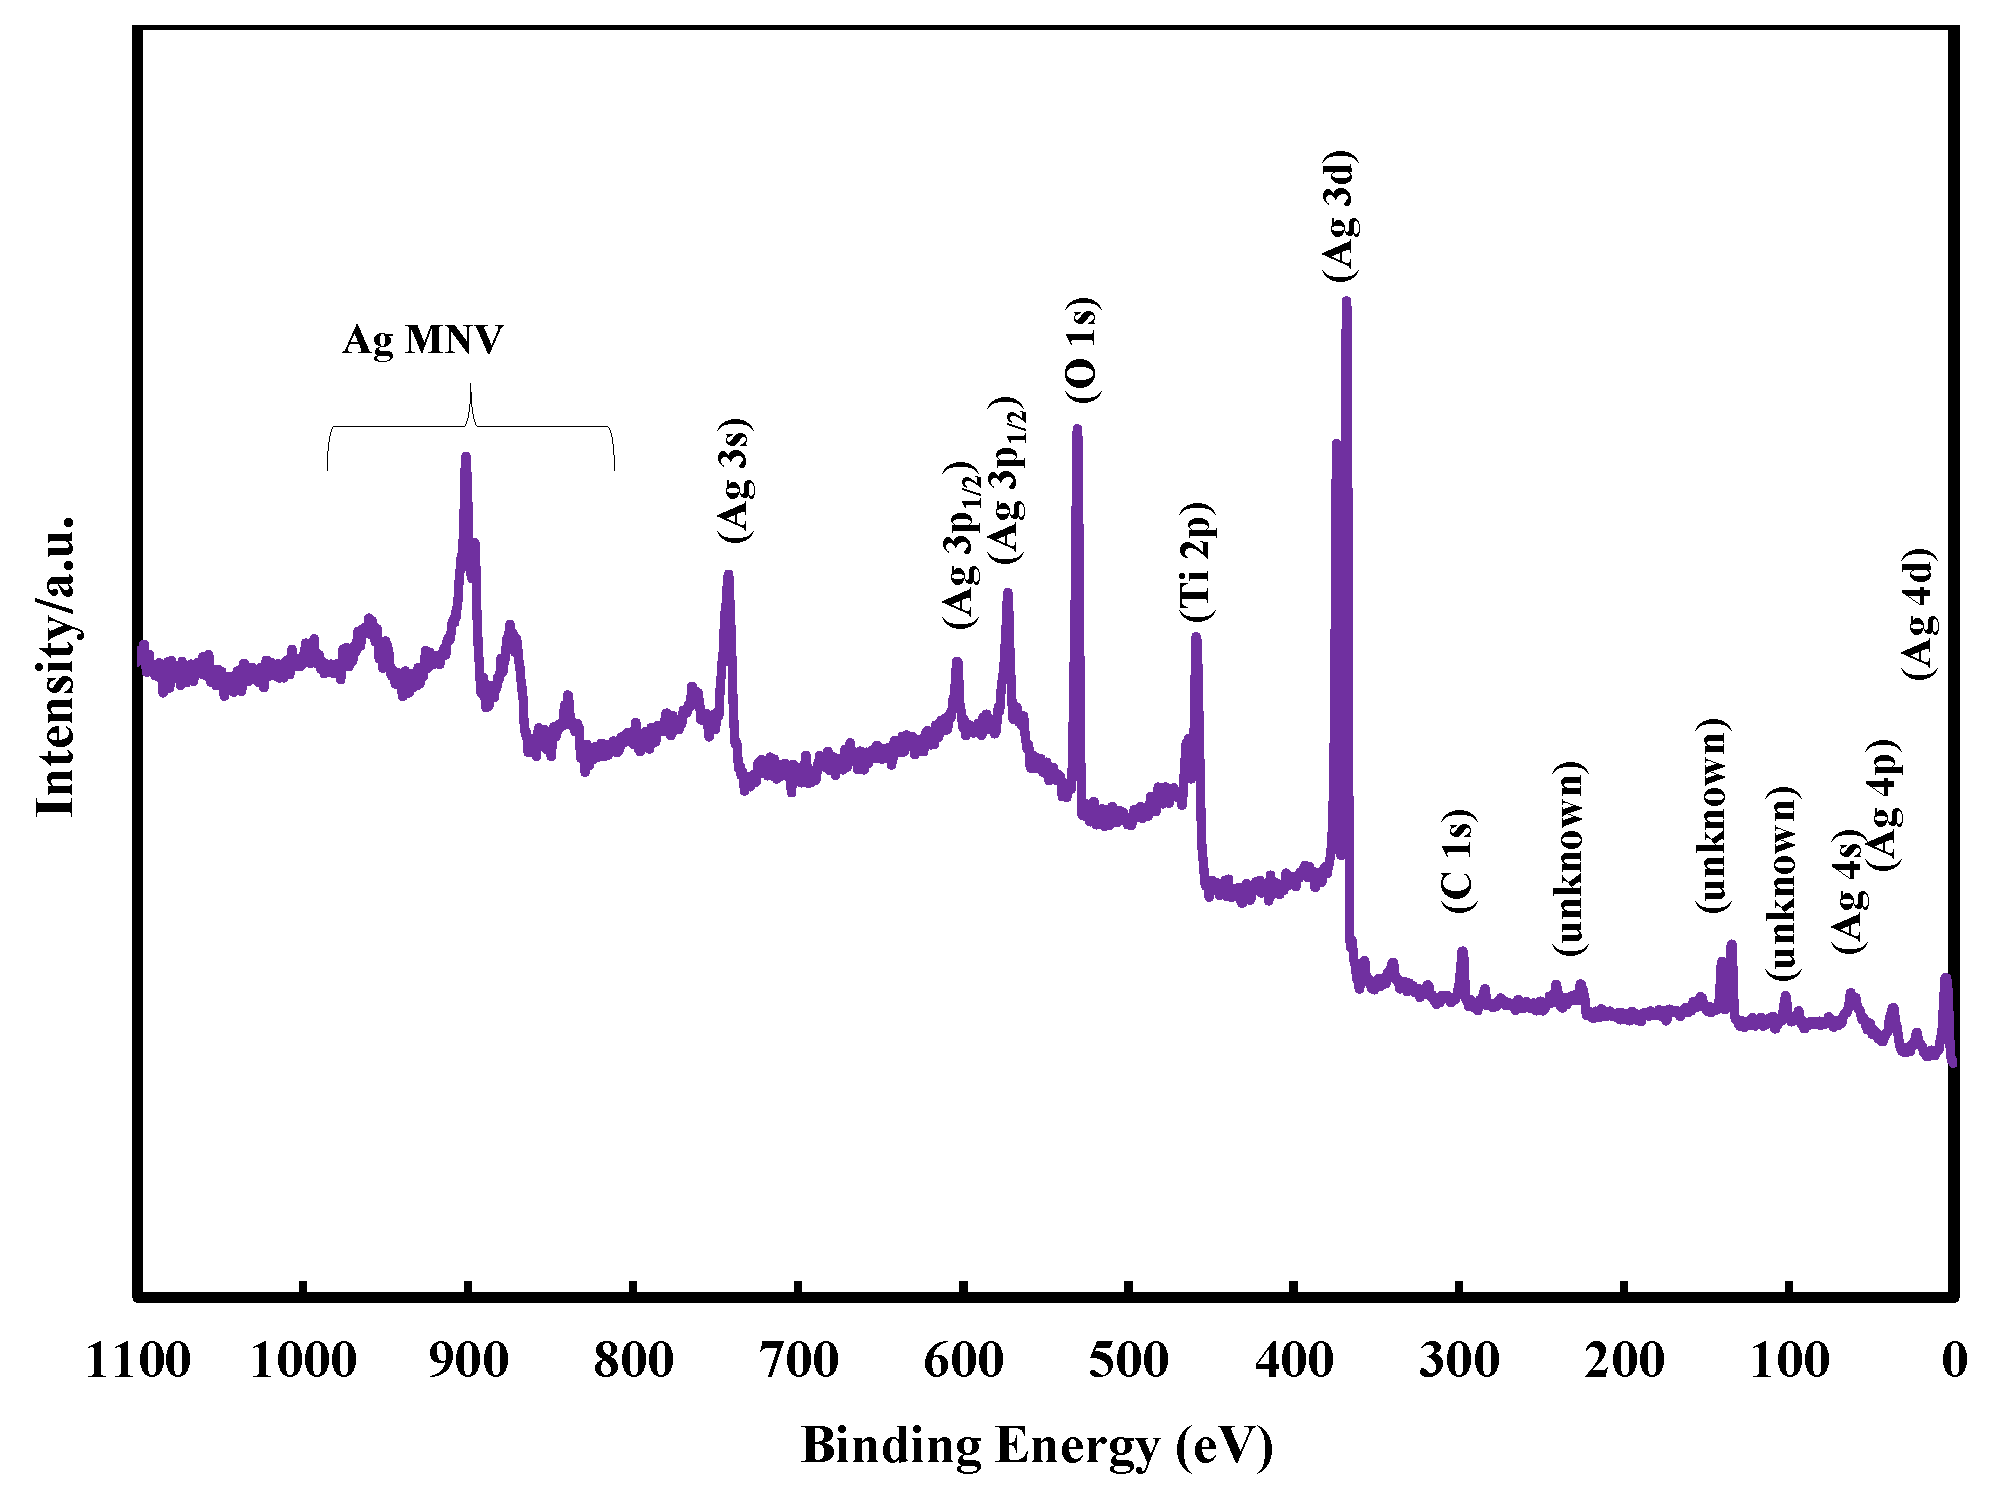
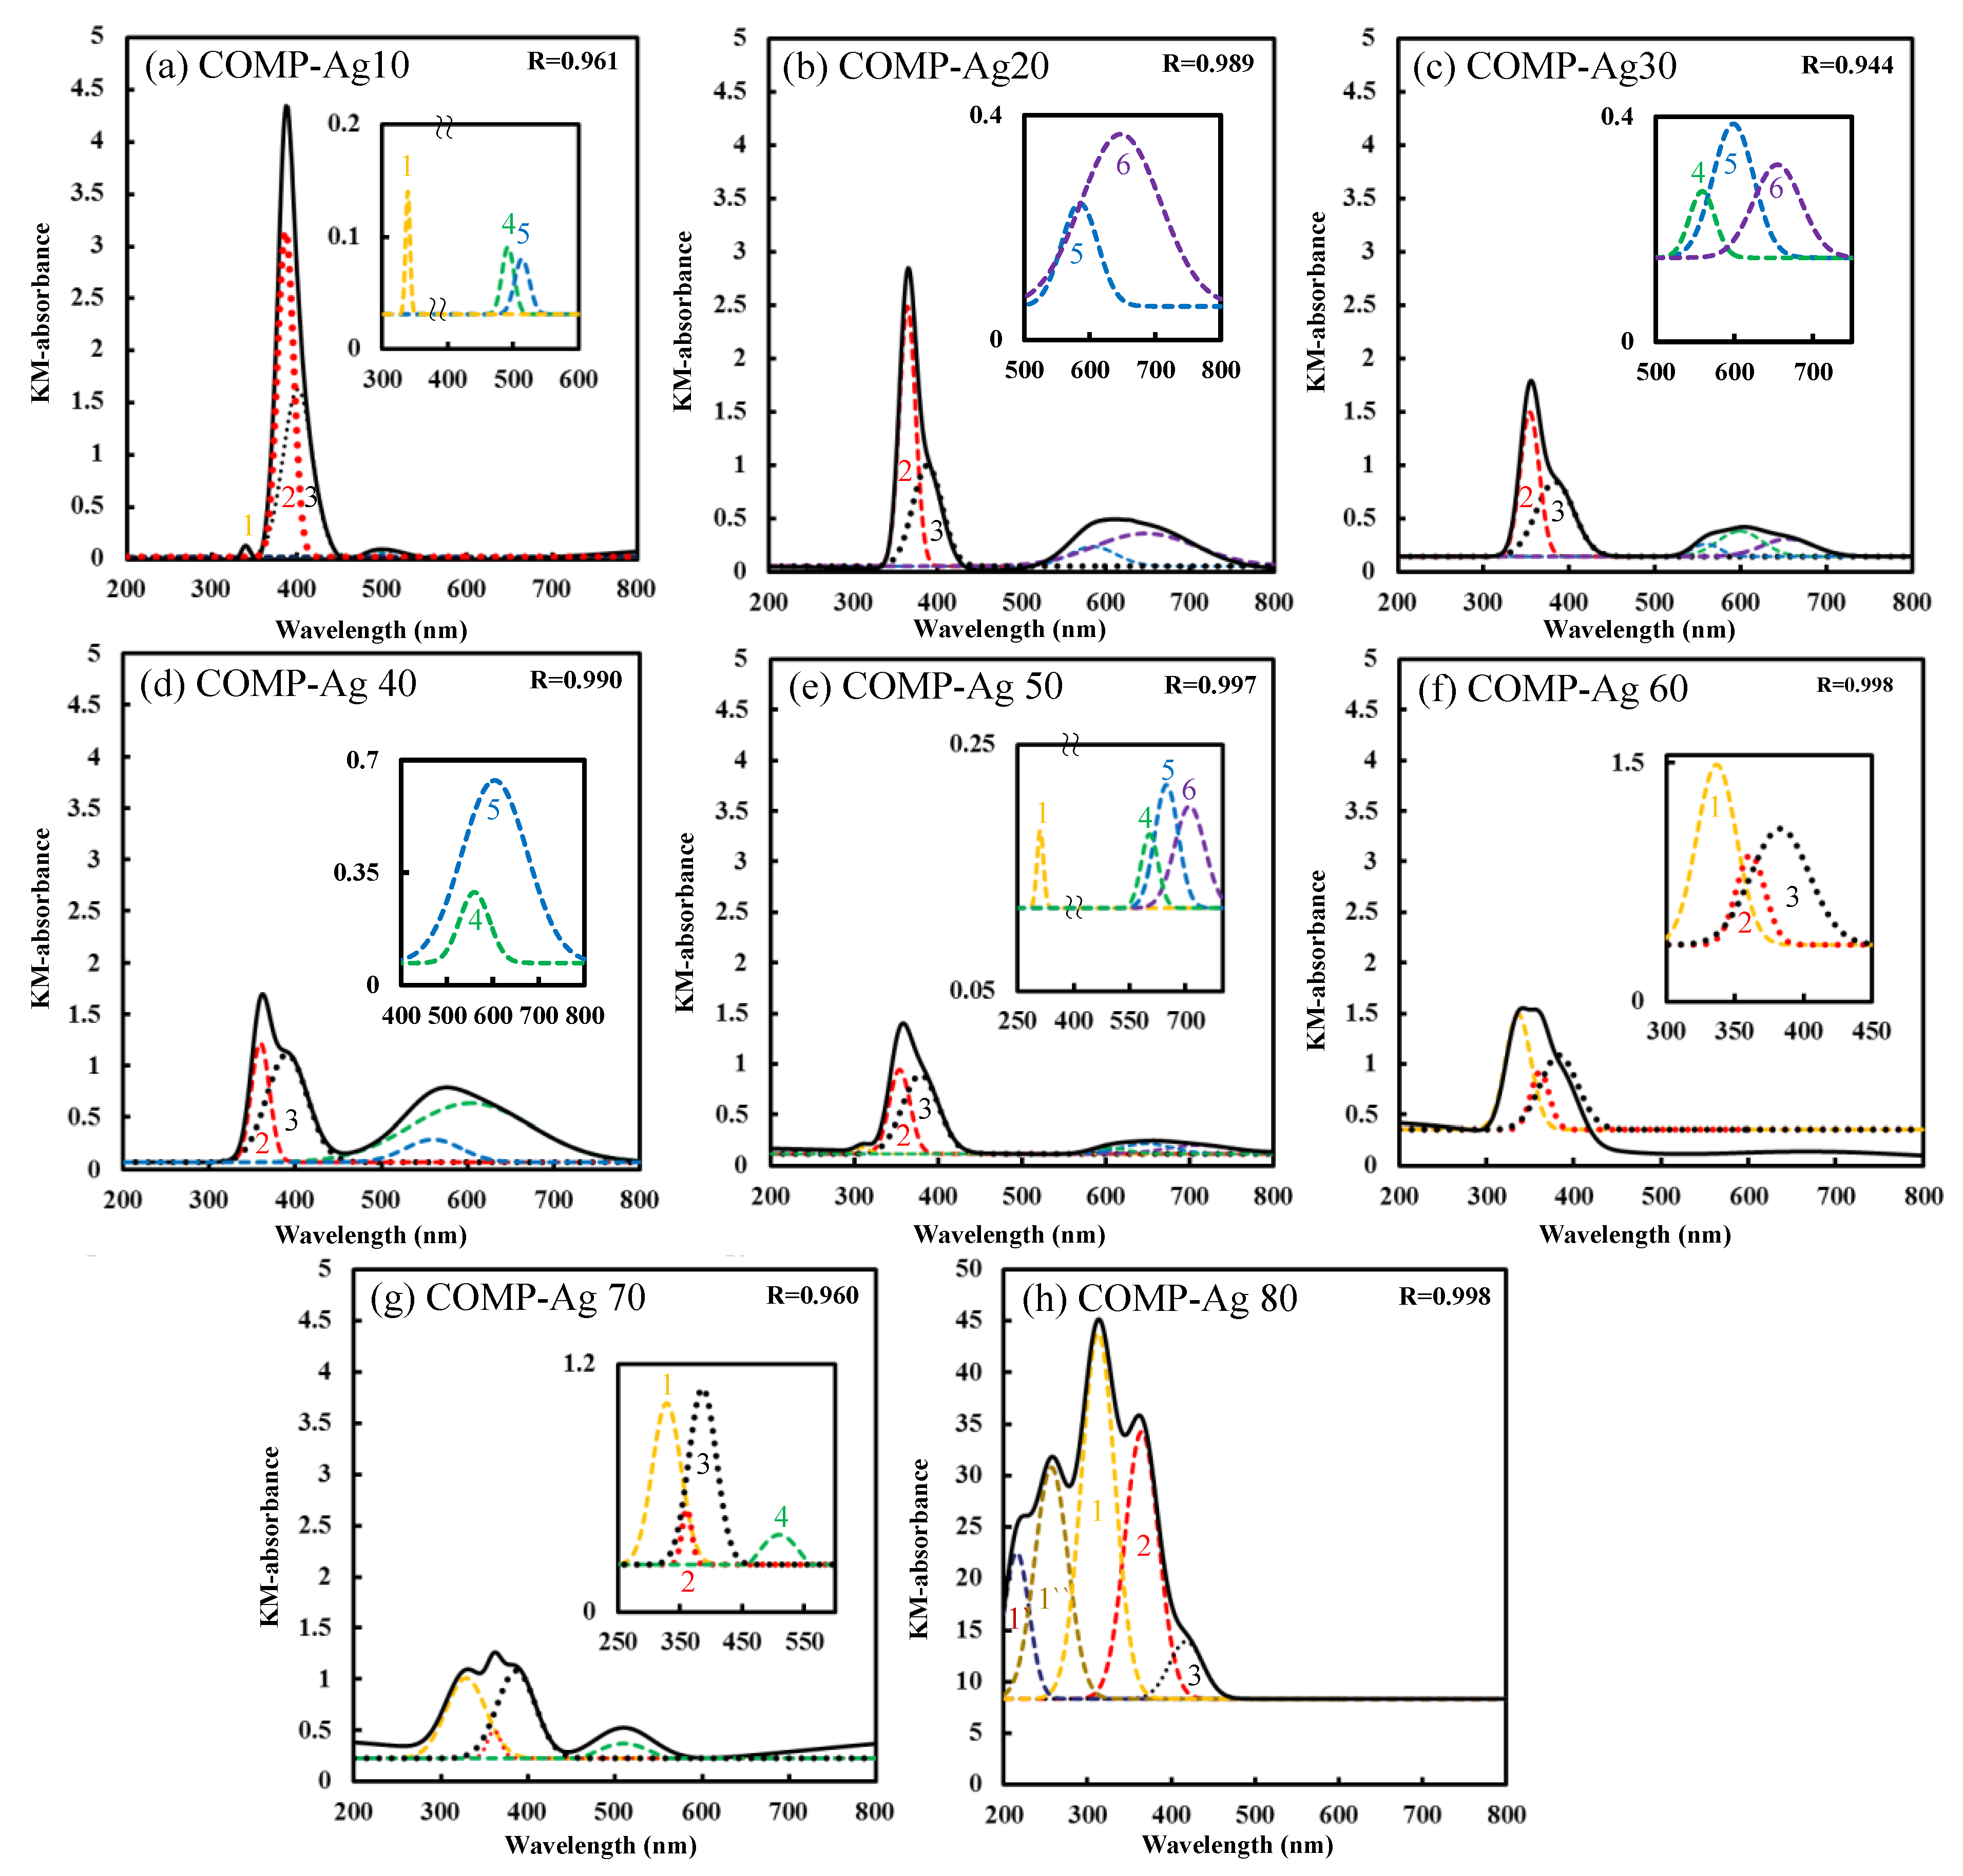
Figure 1 shows the XPS high resolution wide scans for COMP-Ag70. The major XPS peaks include Ag 3d, Ti 2p, and O 1s. The XPS peak for C1s (284.8 eV) is due to the adventitious hydrocarbon from the XPS instrument itself. The depth profile for COMP-Ag40, 50 and 70 were scanned as shown in
Figure 2; including the spectra obtained after performing Gaussian curve-fitting. The Ag 3d peaks (
Figure 2a) for all thin films are located at 368.0 eV (3d
5/2) and 374.0 eV (3d
3/2), with a spin-orbit splitting of 6.0 eV. This is attributed to metallic Ag [
34], consistent with the XRD result reported previously [
30]. By increasing the amount of Ag in the composite thin films, the Ag 3d peak shifts slightly to a lower binding energy position by only 0.1 eV (within experimental uncertainty).
Figure 1.
Representative wide-scan XPS survey spectrum taken from the surface of COMP-Ag50 composite thin films.
Figure 1.
Representative wide-scan XPS survey spectrum taken from the surface of COMP-Ag50 composite thin films.
The Ti 2p
3/2 and 2p
1/2 peaks (
Figure 2b) are found at 458.1 and 463.5 eV, respectively, attributed to Ti
4+ for pure crystalline TiO
2 [
34,
35]. The peak position shows no critical change compared to that of pure TiO
2. This indicates that there is no significant interfacial interaction between Ag and TiO
2. The O 1s peaks (
Figure 2c) found at 531.0 eV is due to O
2− of TiO
2 [
34,
36]. The Ti 2p and O 1s peaks are reduced in intensity. The O:Ti ratio obtained from XPS for TiO
2, COMP-Ag
n (
n =40, 50 and 70) are 2.003, 1.997, 2.007 and 2.130, respectively. Further, any peak around 457.4 eV attributable to the Ti
3+ ion could not be observed [
36].
2.2. The Distribution of Ag NP in the Ag-NP/TiO2 Composite Thin Films
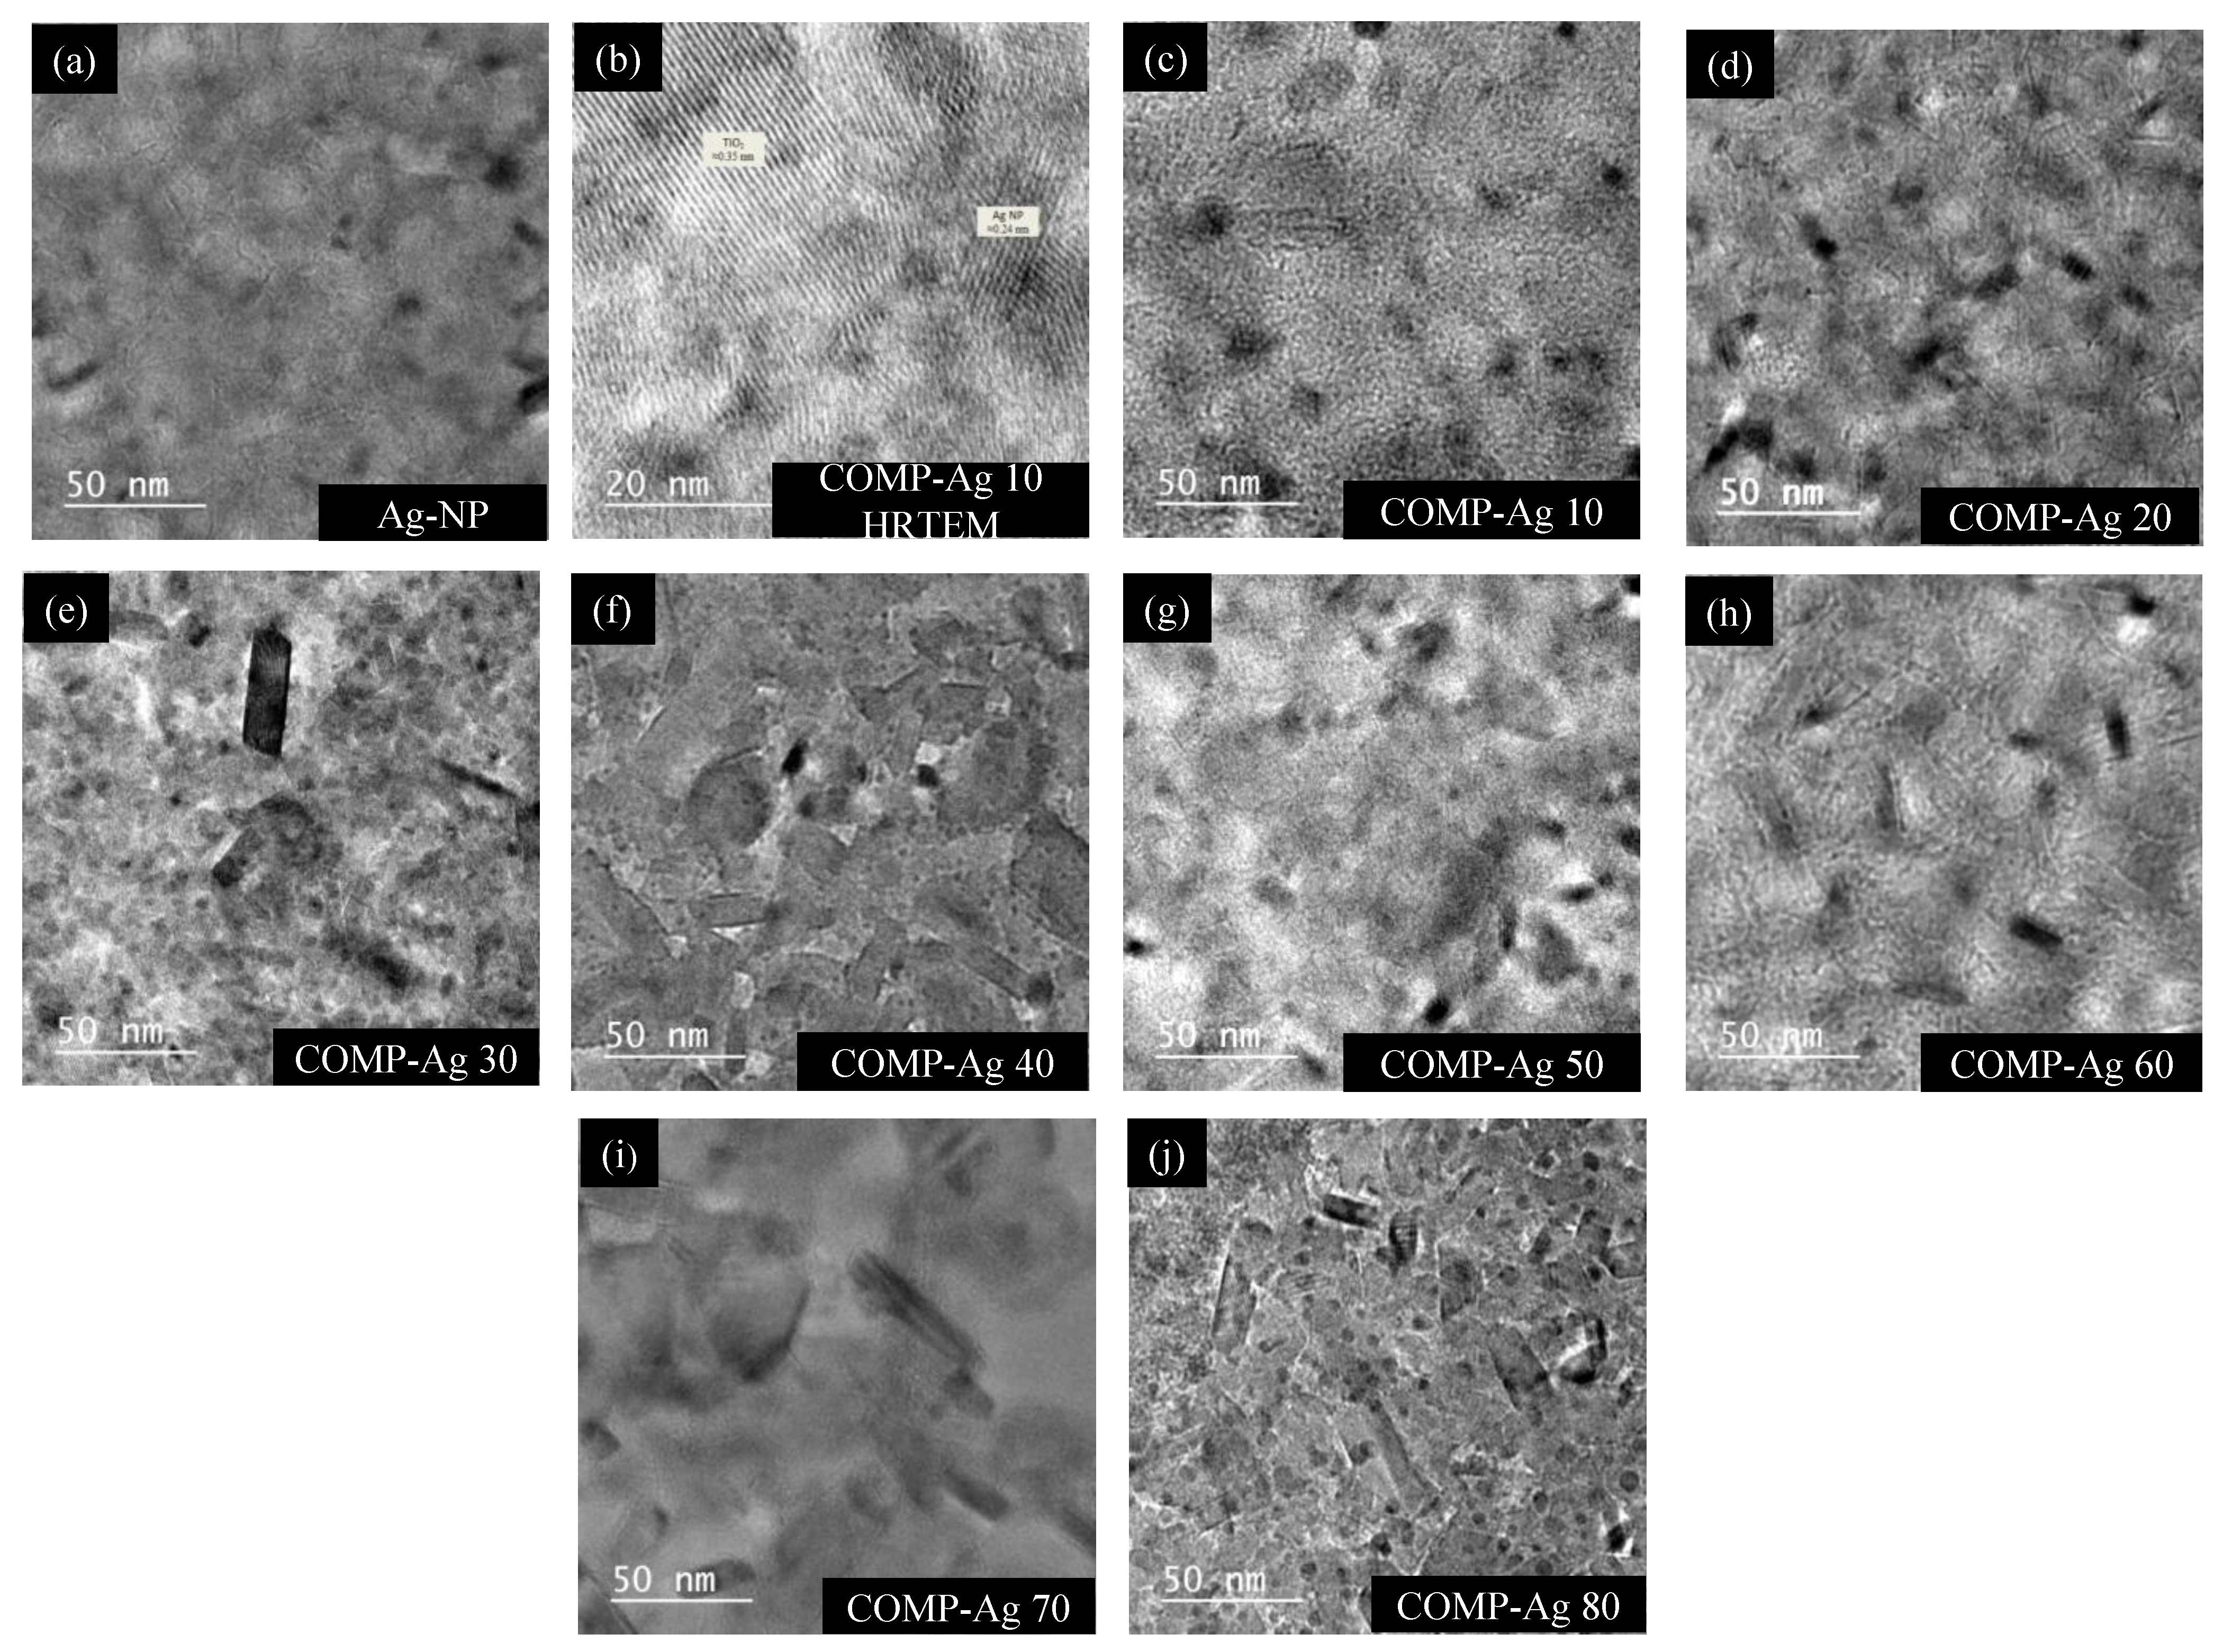
The TEM images of all the composite thin films and Ag NP film are shown in
Figure 3. As presented in
Figure 3a, the presence and distribution of the Ag NP can be observed clearly as dark spots. Hence, the dark spots within the composite films micrographs (
Figure 3b–j) represent the Ag NP. The high-resolution TEM image (
Figure 3b) confirmed that the composite samples was comprised of crystalline titania and silver nanoparticles with the lattice spacing of a-axis agreeing well with the anatase phase (0.352 nm) and metallic silver (0.240 nm), respectively.
All the TEM micrographs (
Figure 3a–j) exhibited small Ag-nanoparticles: 5 ± 2 nm. Three other populations of Ag NP are obtained; small spherical nanoparticles: 11 ± 7 nm, larger spherical: 29 ± 8 nm, and rod-like: 45 ± 25 nm, or agglomerated ones depending on the amount of silver in a given thin film. Therefore, COMP-Ag
n can be categorized into three types, as categorized by their UV/vis absorption spectra we indicated in recent work; low-Ag-level (10 ≤
n ≤ 40), middle-Ag-level (40 <
n < 70), and high-Ag-level (70 ≤
n) composite thin films. The low-Ag-level thin films show spherical Ag NP homogeneously distributed in the titania with diameter 11 ± 7 nm. Most of Ag NP by the high-Ag-level thin films are more agglomerated, which is in contrast to the behaviors of the low- and middle-Ag-level thin films.
Figure 2.
High resolution regional (a) Ag3d; (b) Ti 2p and (c) O 1s XPS spectra. The thin solid lines indicate the original data of XPS. The dashed curves show theoretically fitted curves by assuming Gaussian distribution.
Figure 2.
High resolution regional (a) Ag3d; (b) Ti 2p and (c) O 1s XPS spectra. The thin solid lines indicate the original data of XPS. The dashed curves show theoretically fitted curves by assuming Gaussian distribution.
Figure 3.
(a) TEM image of Ag NP; (b) HRTEM image of COMP-Ag10, and (c)–(j) TEM images of Ag-NP/TiO2 composite thin films at various amounts of Ag molar concentrations: (c) 10; (d) 20; (e) 30; (f) 40; (g) 50; (h) 60; (i) 70 and (j) 80, respectively.
Figure 3.
(a) TEM image of Ag NP; (b) HRTEM image of COMP-Ag10, and (c)–(j) TEM images of Ag-NP/TiO2 composite thin films at various amounts of Ag molar concentrations: (c) 10; (d) 20; (e) 30; (f) 40; (g) 50; (h) 60; (i) 70 and (j) 80, respectively.
2.3. Particle Morphology and the Dispersion of Silver Nanoparticles
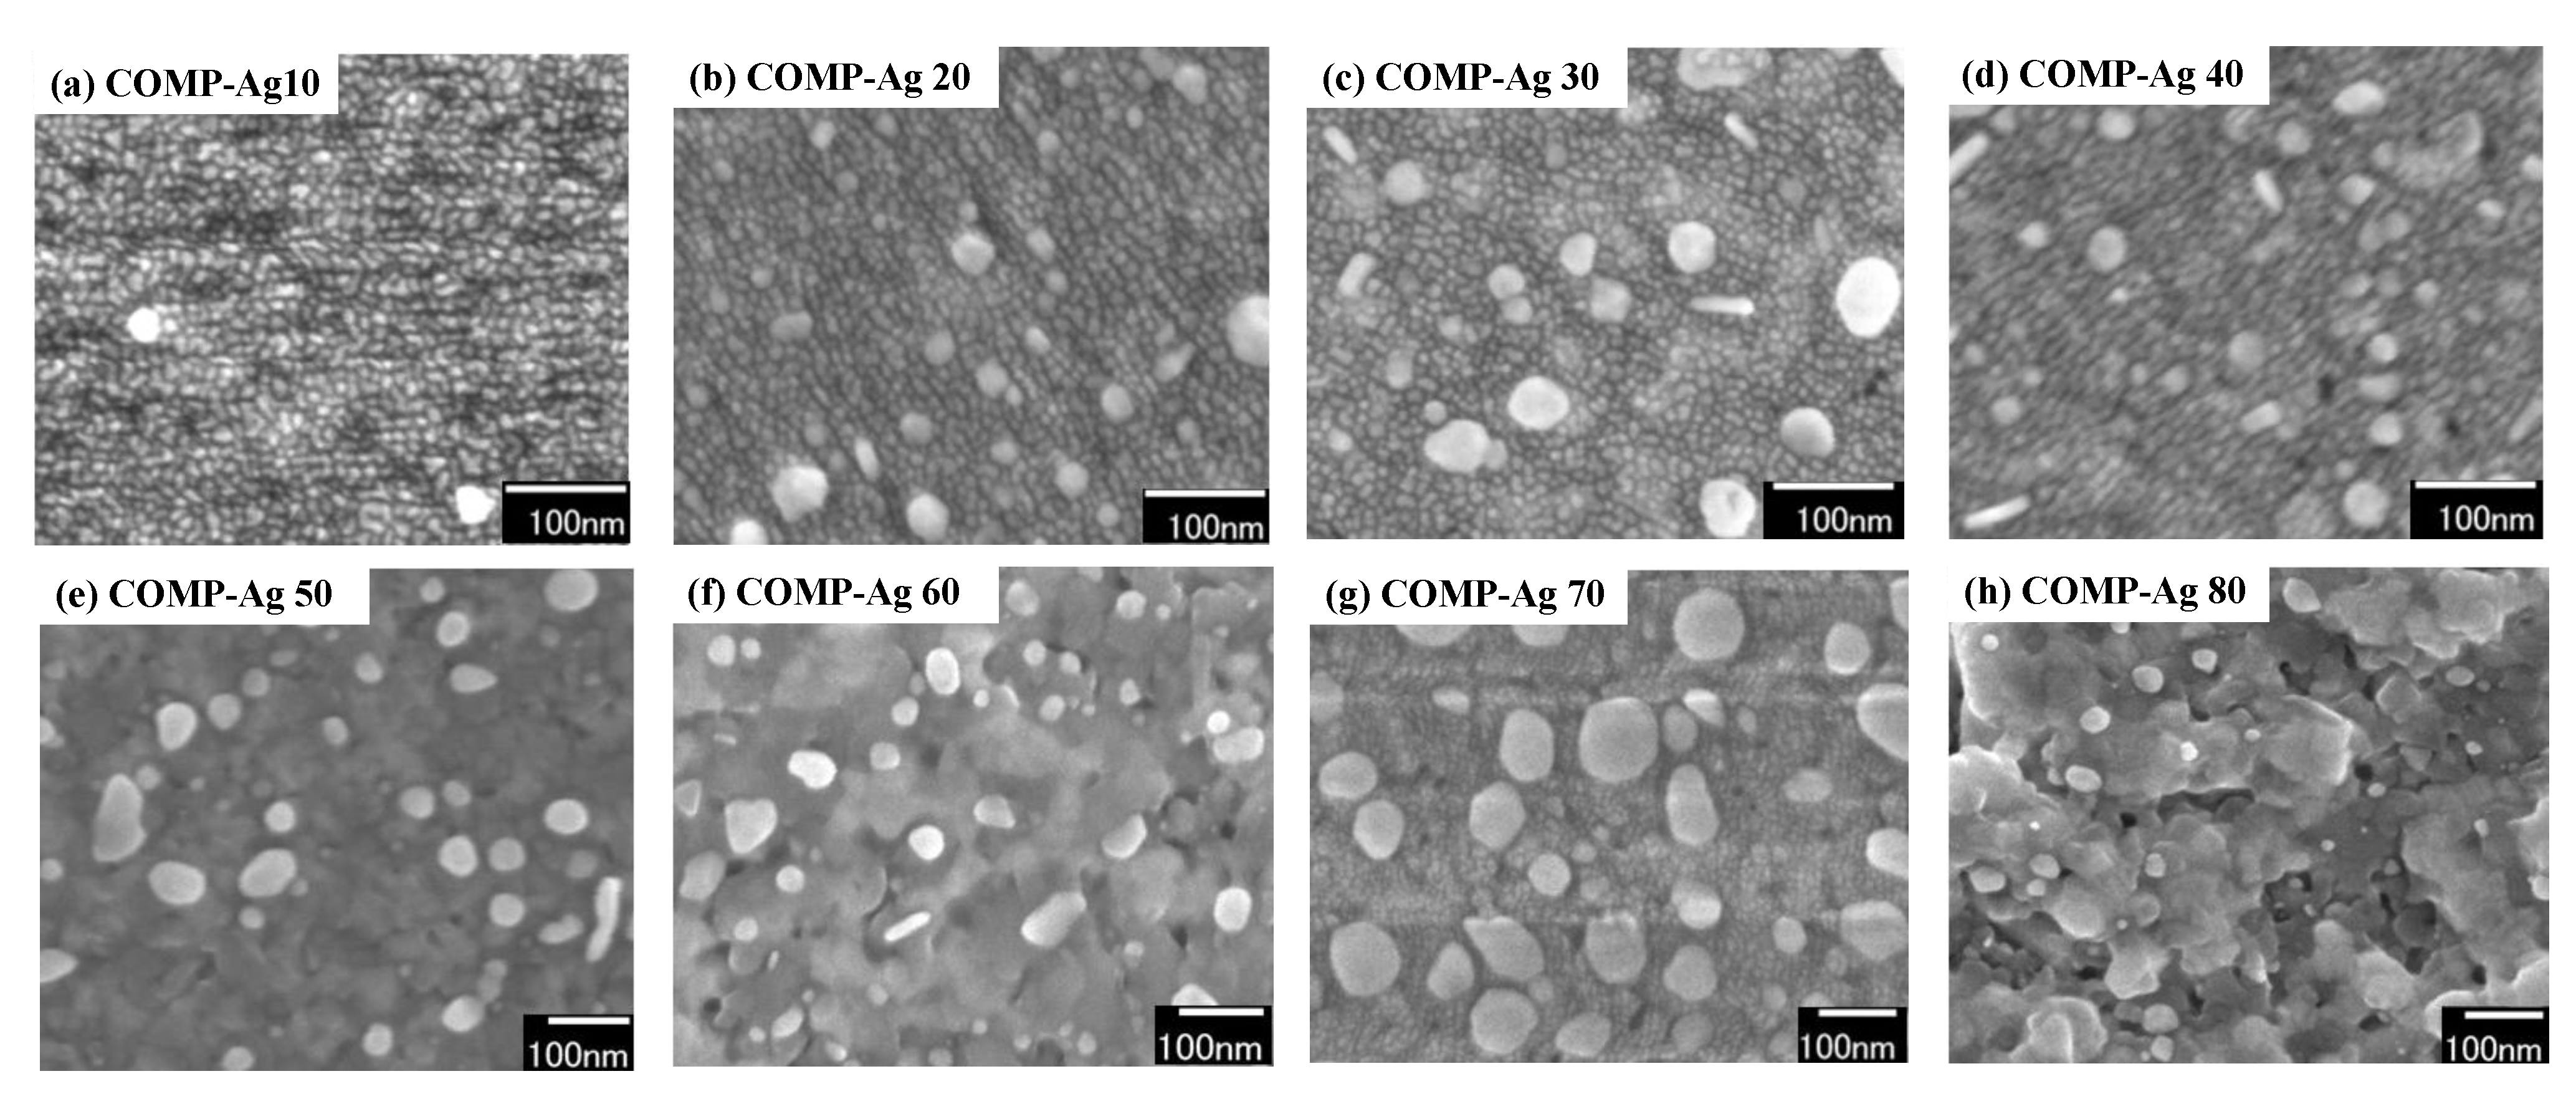
The surface morphology observed by FE-SEM of Ag-NP/TiO
2 composite thin films is illustrated in
Figure 4. The amounts of Ag grains (white dots) on the surface of low-Ag-level thin films (
Figure 4a–d) were fewer and scattered compared to middle- and high-Ag-level thin films (
Figure 4e–h), respectively.
Figure 4e–f images for middle-Ag-level composite thin films illustrated that the surface morphology of three composite thin films, COMP-Ag50 and 60 respectively, are quite identical and Ag particles are homogeneously distributed with some spherical/rod-like and partially agglomerated Ag NP on the surface of the composite thin films.
Figure 4g–h image shows high-Ag-level thin film, COMP-Ag 70 and 80, having a rough surface structure, with some spherical, rod-like and highly agglomerated Ag particles on the surface.
Figure 4.
SEM images a-h, of the Ag-NP/TiO2 composite thin films at various amounts of Ag molar concentrations: (a) 10; (b) 20; (c) 30; (b) 40; (e) 50; (f) 60, (g) 70 and (h) 80, respectively.
Figure 4.
SEM images a-h, of the Ag-NP/TiO2 composite thin films at various amounts of Ag molar concentrations: (a) 10; (b) 20; (c) 30; (b) 40; (e) 50; (f) 60, (g) 70 and (h) 80, respectively.
2.4. Optical Properties of TiO2 Thin Film, Ag-NPs and Ag-NP/TiO2 Composite Thin Films
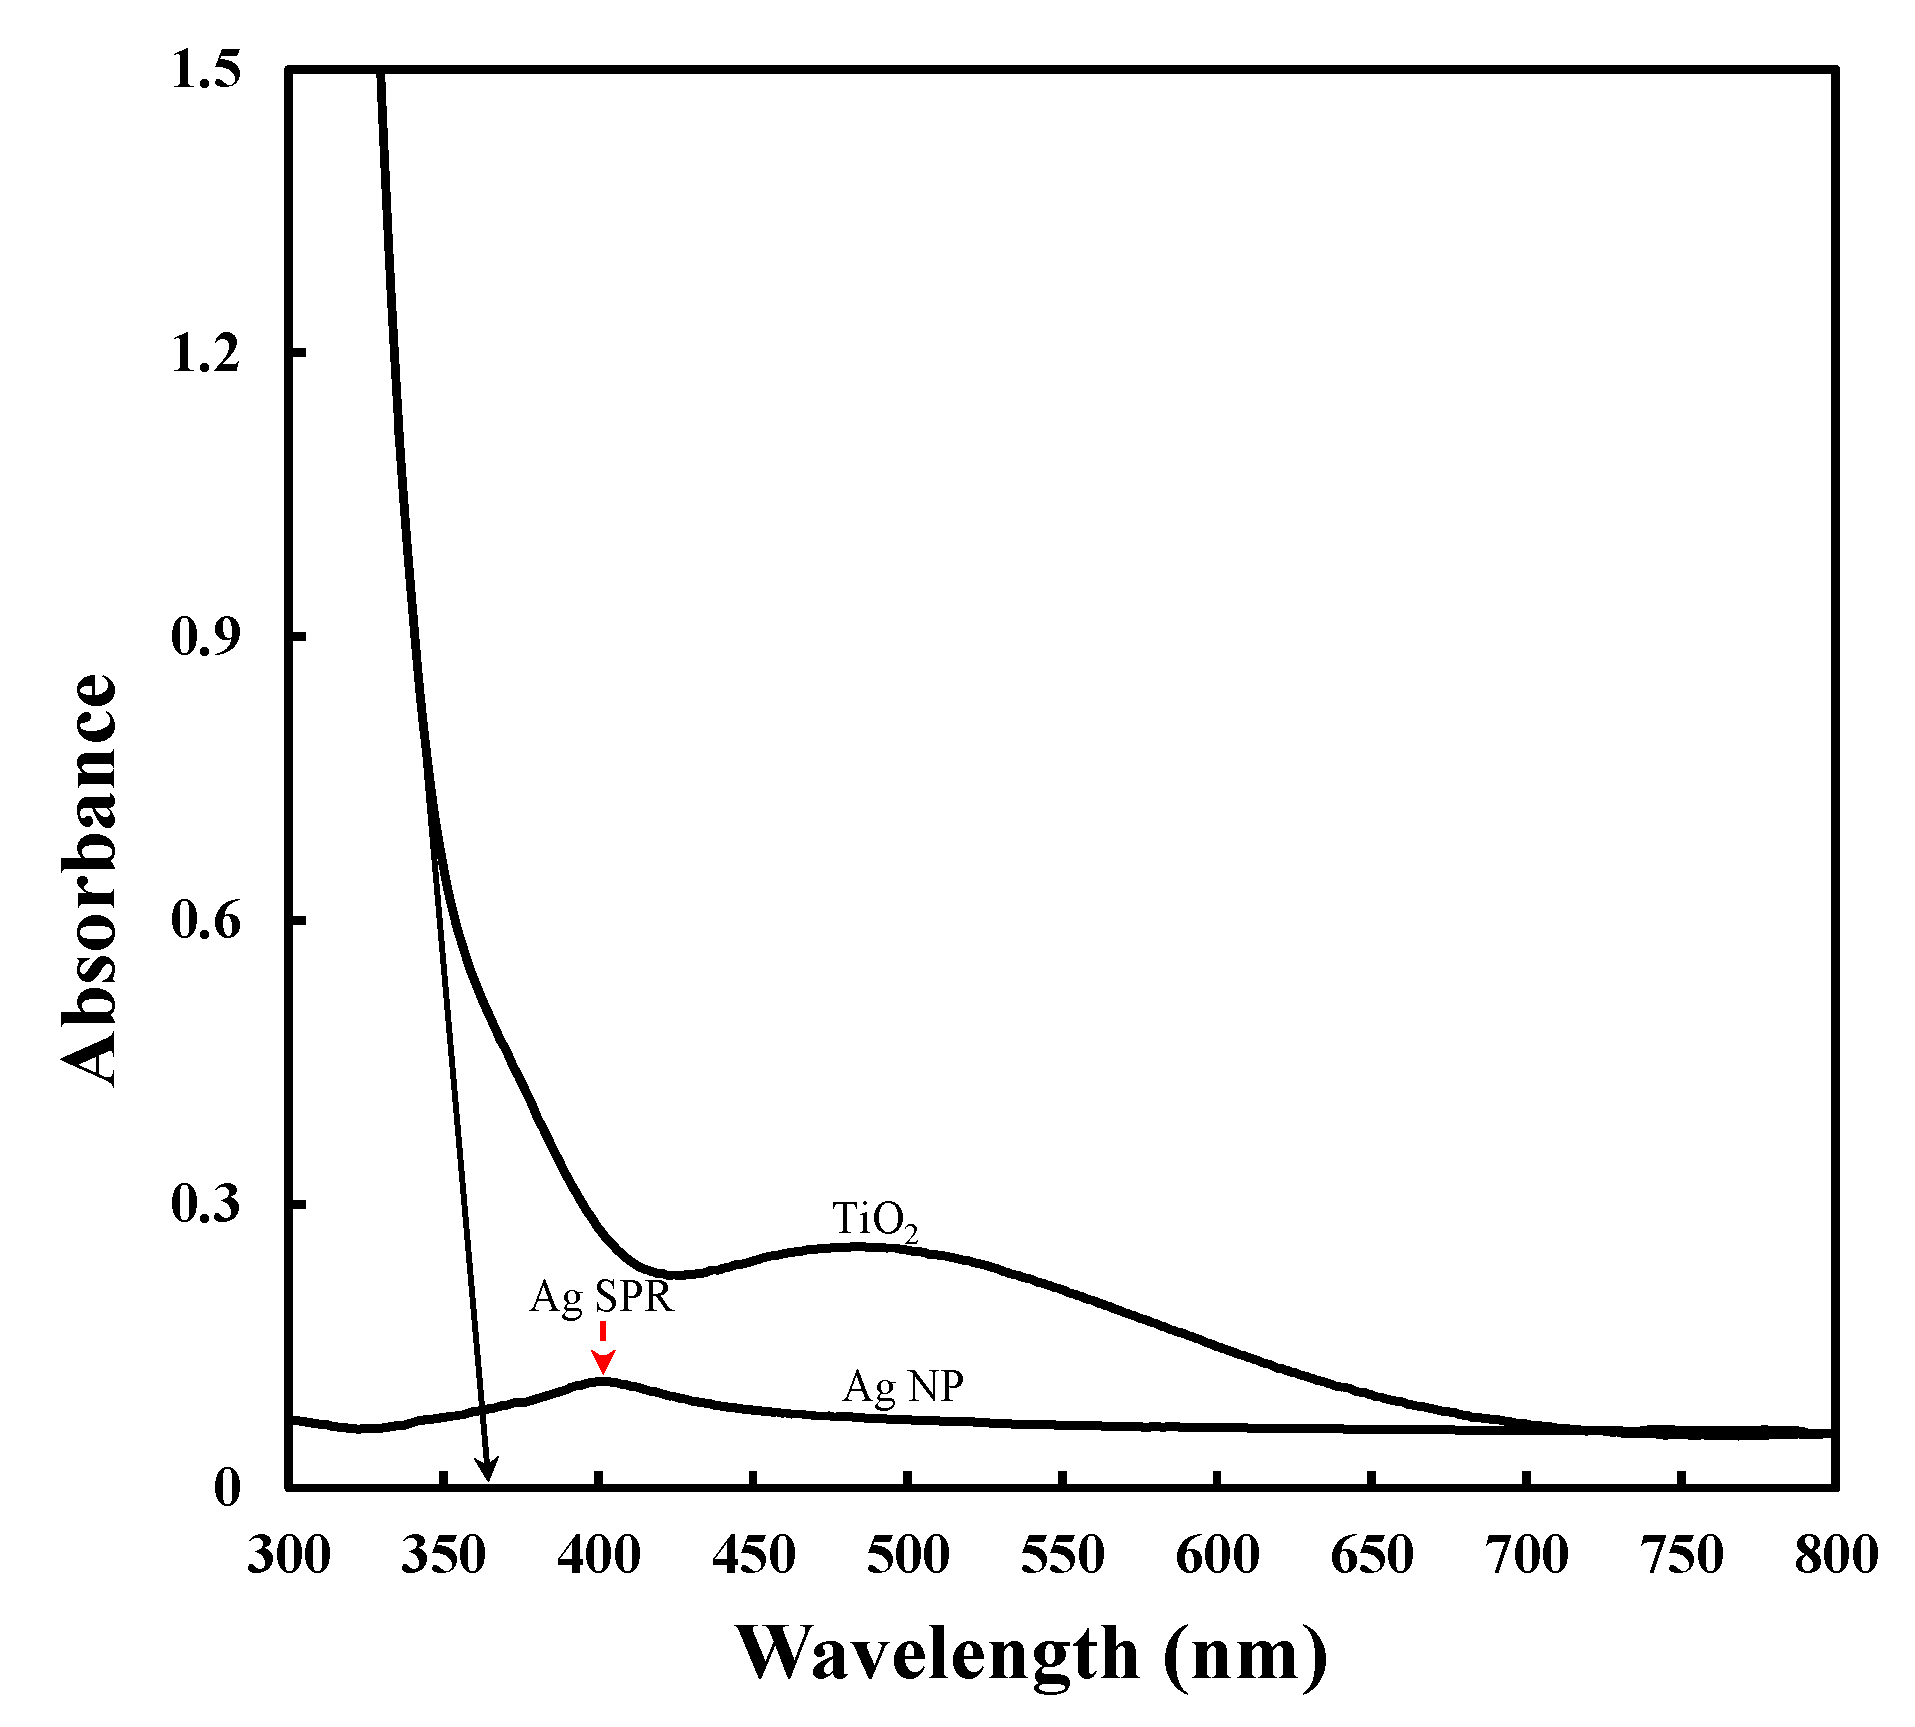
Figure 5 represents the UV-vis absorption spectra for TiO
2 and Ag NP. The TiO
2 thin film showed a low-intensity absorption band in the vis-region; however, its absorption intensity increased steeply at shorter wavelengths with the band edge at around 355. In contrast, the Ag NP film showed a weak and broad absorption band at around 410 nm. The absorption band in this region corresponds to the characteristic SPR of Ag NPs [
33]. This absorption band was also observed for the COMP-Ag
n thin films, though the peak position in this region gradually increased in intensity upon increasing the Ag content [
33].
Figure 5.
UV-vis absorption spectra for TiO2 thin film and Ag NP fabricated on quartz glass.
Figure 5.
UV-vis absorption spectra for TiO2 thin film and Ag NP fabricated on quartz glass.
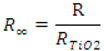
The DRS of the composite thin films are presented in
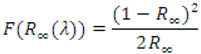
Figure 5(a−g). The DRS measured in the range of 200–800 nm were converted to the absorbance spectra using Kubelka-Munk equation (Equations 1 and 2) [
37,
38].
Where R is the reflectance recorded and RTiO2 is the reference recorded for a reference (titania in this case). The Origin9 software (OriginLaB Co., Northampton, MA, USA) was used to obtained individual Gaussian peaks, which are theoretically fitted peaks by assuming Gaussian distribution.
The peak positions and peak areas obtained by analysis with curve-fitting procedure are listed in
Table 1. All the composites show two main peaks, labeled peak 2 and 3. Peak 2, which is at 365 nm on average, may represent a typical semiconductor optical absorption since the lambda maximum of pure TiO
2 is at around 365 nm, corresponding to a band gap of around 3.4 eV. As shown in
Figure 5, the band edge of TiO
2 is around 365 nm and according to our recent paper [
33], there was no band gap shift observed for TiO
2 in all the composite thin films; therefore, we assign peak 2 in all the composites to be related to the TiO
2 absorption spectrum. Peak 3, which is located at around 390 nm, can be regarded as the main Gaussian peak since it has the largest peak area ratio per volume compared to the other peaks.
Figure 6.
UV–Vis diffuse reflectance spectra (DRS) of Ag-NP/TiO2 composite thin films at various amounts of Ag molar concentrations: (a) 10; (b) 20; (c) 30; (d) 40; (e) 50; (f) 60; (g) 70 and (h) 80, respectively.
Figure 6.
UV–Vis diffuse reflectance spectra (DRS) of Ag-NP/TiO2 composite thin films at various amounts of Ag molar concentrations: (a) 10; (b) 20; (c) 30; (d) 40; (e) 50; (f) 60; (g) 70 and (h) 80, respectively.
Table 1.
The DRS peak positions and peak area ratios of Ag-NP/TiO2 composite thin films. These data were obtained by Gaussian curve-fitting using ORIGIN9 software (OriginLaB Co., Northampton, USA).
Table 1.
The DRS peak positions and peak area ratios of Ag-NP/TiO2 composite thin films. These data were obtained by Gaussian curve-fitting using ORIGIN9 software (OriginLaB Co., Northampton, USA).
| Notation | Peak position (λ nm) | Peak area ratio (%) |
|---|
| 1 | 2 | 3 | 4 | 5 | 6 | 1 | 2 | 3 | 4 | 5 | 6 |
|---|
| COMP-Ag10 | 340 | 386 | 400 | 492 | 520 | - | 1 | 49 | 46 | 2 | 2 | - |
| COMP-Ag20 | - | 365 | 390 | − | 584 | 640 | - | 44 | 31 | - | 10 | 15 |
| COMP-Ag30 | - | 351 | 385 | 559 | 598 | 655 | - | 35 | 35 | 5 | 13 | 12 |
| COMP-Ag40 | - | 359 | 390 | 560 | 600 | - | - | 15 | 30 | 9 | 46 | - |
| COMP-Ag50 | 310 | 354 | 379 | 603 | 649 | 710 | 2 | 29 | 46 | 4 | 9 | 10 |
| COMP-Ag60 | 336 | 361 | 383 | - | - | - | 44 | 15 | 41 | - | - | - |
| COMP-Ag70 | 329 | 360 | 386 | 510 | - | - | 41 | 5 | 43 | 11 | - | − |
| COMP-Ag80 | 312 | 364 | 417 | - | - | - | 53 | 39 | 8 | - | - | − |
Although the average lambda maximum peak position for peak 3 is at 390 nm, as shown in
Figure 6a–h, more than one-third of its area cover, the visible region ≥400 nm. In addition, peak 1 is also exhibited in COMP-Ag10 as well as in the middle- and high-Ag-level composite thin films. Moreover, with exception to COMPAg60, overlapped Gaussians peaks with smaller peak areas than those of peak 2 and 3 are appearing in the visible light regions. These peaks 4, 5 and 6 have lambda maximum at around 500 nm, 600 nm and 550 nm, respectively.
2.5. Photo-Responsive Activity of Ag-NP/TiO2 Composite Thin Films
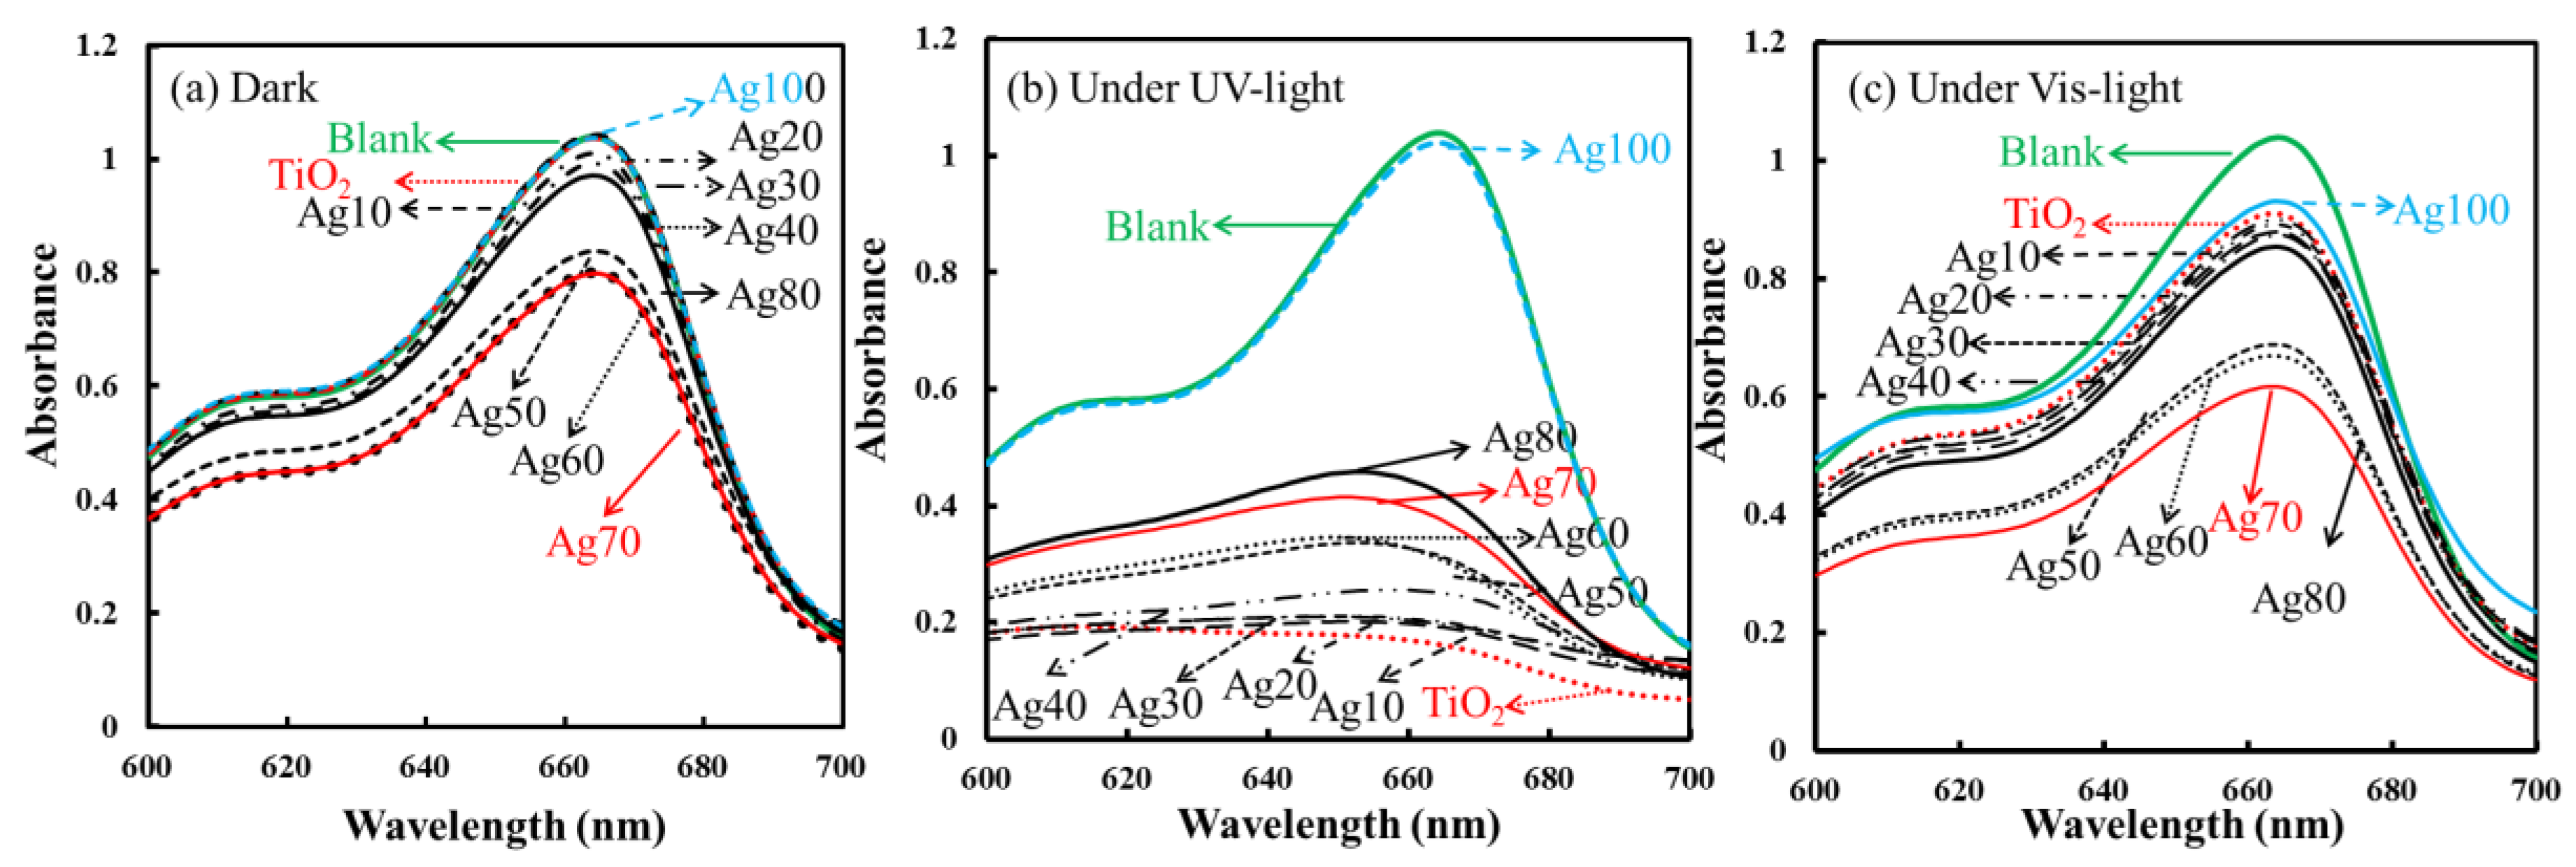
The photocatalytic activity of MB decoloration was investigated quantitatively by monitoring the changes between the initial MB absorption spectra and the final MB absorption spectra intensity positions, as well as qualitatively by determining the decoloration rate of MB (nM min
−1). The absorption spectra of decoloration of 1 × 10
−2 mM of MB aqueous solution tested under dark, UV light and vis-light irradiation for 18 h are shown in
Figure 7a–c, respectively, by employing the pure TiO
2 thin film, pure Ag NP, COMP-Ag
n thin films, where 10 ≤
n ≤ 80 and the blank.
Under dark (
Figure 7a), the MB absorption spectra change for pure TiO
2, pure Ag (Ag100) and COMP-Ag10 are at the identical intensity position to that of the blank. This illustrated that there was no catalytic activity taking place in these two samples under dark condition. The absorption spectra for COMP-Ag20, 30 and 40 show small changes compared to those of COMP-Ag50, 60 and 70. COMP-Ag80’s absorption spectral change is smaller than those of COMP-Ag 50, 60 and 70 composite thin films but larger than for low-Ag-level composite thin films. The influence of the amount of the Ag in titatia on self-decoloration of MB could be thus evaluated.
Figure 7.
Absorption spectra of decomposition of 0.001 mmol of MB aqueous solution in the presence of different Ag-NP/TiO2 thin films after kept under (a) dark; (b) UV and (c) vis-light irradiation for 18 h.
Figure 7.
Absorption spectra of decomposition of 0.001 mmol of MB aqueous solution in the presence of different Ag-NP/TiO2 thin films after kept under (a) dark; (b) UV and (c) vis-light irradiation for 18 h.
In
Figure 7b, the absorption spectral changes is getting smaller with the increase in the Ag amount in COMP-Ag
n; whereby COMP-Ag80 and pure Ag NP (high-Ag-level) show the smallest changes and TiO
2 shows the biggest change under UV-light irradiation. The pure Ag NP exhibited a very poor photocatalytic activity under UV and dark almost equal to that of the blank, which reflected that Ag did not act as catalytic on itself. Almost 100% decoloration of MB solution has been attained when UV-light was irradiated for 18 hours on pure TiO
2 and on low-Ag-level composite thin films. Middle-Ag-level shows the moderated change between the initial MB absorption spectra and the final MB absorption spectra intensity positions. In
Figure 7c, the absorption spectral change was larger with an increase in the amount of Ag in COMP-Ag
n thin film under visible-light irradiation. Pure TiO
2 shows the smallest change, while COMP-Ag70 shows the largest change. Kőrösi
et al. showed that the rate of photooxidation of organic compounds was significantly enhanced by silver-modification of titania [
39].
In order to obtain qualitative data, an index of photocatalytic activity (IPCA, nM min
−1) of decoloration rate of 1 × 10
−2 mM MB solution permitted us to directly compare the performance of pure TiO
2 and composite thin films under light irradiation to the dark condition. Each experimental set was repeated three times. The results were reproduced within narrow limits and the mean value was selected. The IPCA values extracted from a decoloration rate of 1 × 10
−2 mM MB solution by photoreaction with each thin film and a blank are shown in
Table 2.
Under UV-light irradiation, none of the composite samples exhibit more photoactivity than pure TiO2, while all of the composite samples are more photoactive than pure TiO2 under both dark and visible-light irradiation. The different results reveal that the photoactive enhancement mechanisms under UV and visible-light irradiation are different.
Table 2.
The index of photocatalytic activity (IPCA) of decoloration rate of 1.0 × 10⁻² mM MB solution by photoreaction with each thin film and a blank.
Table 2.
The index of photocatalytic activity (IPCA) of decoloration rate of 1.0 × 10⁻² mM MB solution by photoreaction with each thin film and a blank.
| Notation | IPCA/nM min−1 |
|---|
| Vis-light | UV-light | Dark |
|---|
| Blank | 3.2(5) | 2.8(6) | 4(1) |
| TiO2 | 5.1(9) | 22(5) | 4.5(1) |
| COMP-Ag10 | 5.6(6) | 23(6) | 5.5(4) |
| COMP-Ag20 | 4.1(1) | 21(2) | 4(2) |
| COMP−Ag30 | 5.4(8) | 20(2) | 5.1(3) |
| COMP-Ag40 | 7.5(9) | 14(1) | 7(1) |
| COMP-Ag50 | 10(4) | 18(3) | 6.9(5) |
| COMP-Ag60 | 9.4(4) | 18(3) | 5(1) |
| COMP-Ag70 | 13(3) | 19(8) | 8(1) |
| COMP-Ag80 | 9.6(8) | 9(4) | 8(1) |
| Pure Ag NP | 4.6(5) | 3.3(3) | 4.2(1) |
2.6. Influence of Electrical Resistivity on Photocatalytic Decoloration Rate of the Composite Thin Films
In
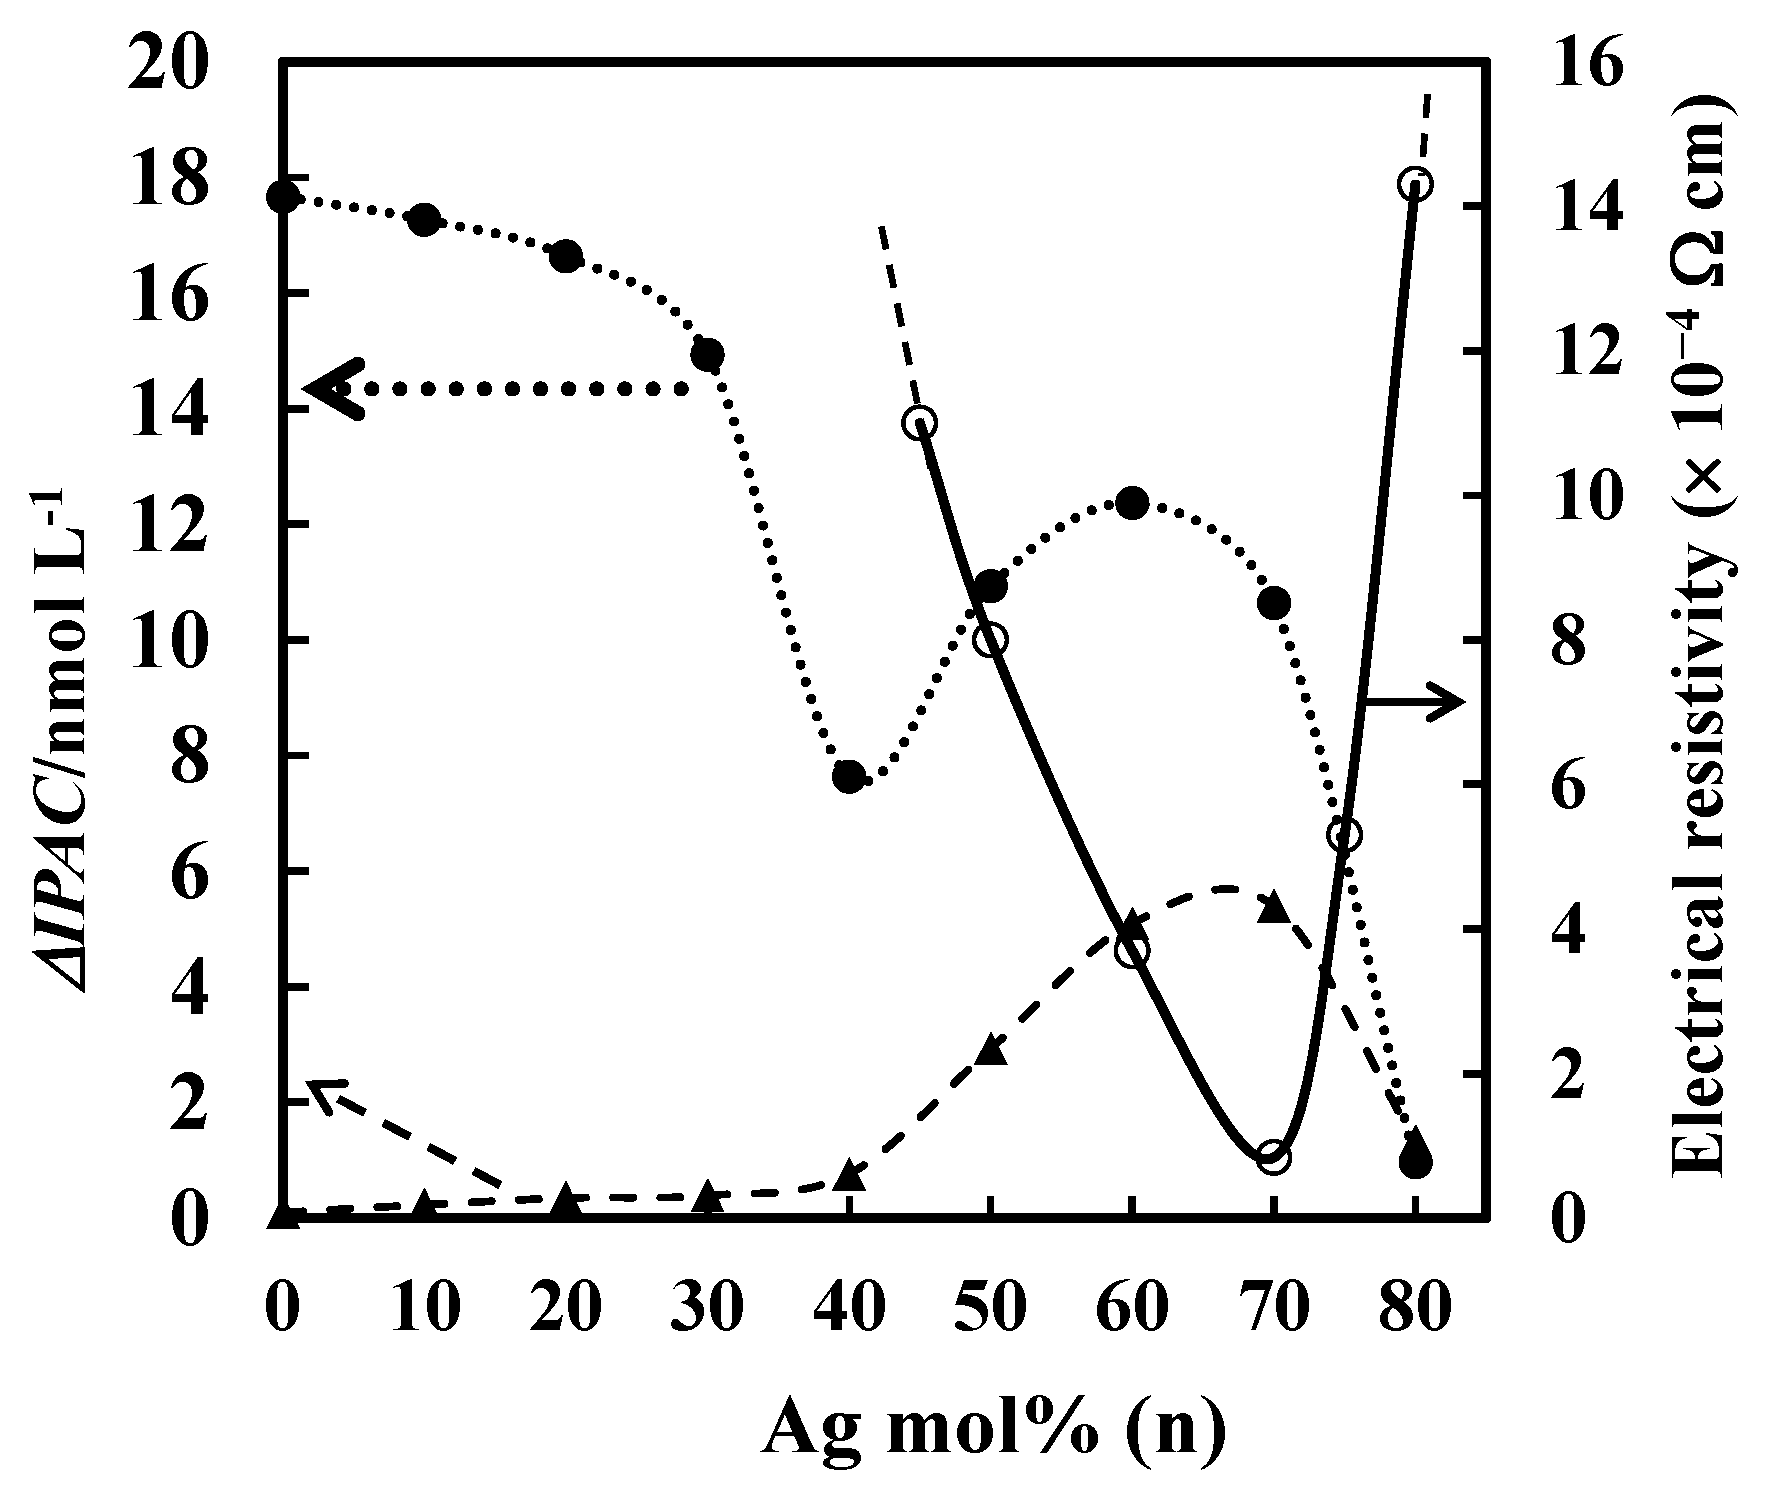
Figure 8, electrical resistivity and dependency of net photocatalytic decoloration rate (ΔIPCA) of each thin film as a function of Ag mol% in the Ag-NP/TiO
2 composite thin films are presented. The electrical resistivity values are extracted from the paper we reported recently [
32]. The ΔIPCA value of each thin film is calculated as the difference between the IPCA under UV- or vis-light irradiation and the corresponding value measured for each thin film under dark conditions.
Figure 8.
Electrical resistivity and dependency of net photoreactivity (∆IPAC) of each thin film as a function of Ag mol% in the Ag/TiO2 composite thin films. The lines indicate as follows: open circle, resistivity; close circle ΔIPAC under UV; filled triangle ∆IPAC under Vis. These values (∆IPAC) were obtained to measure the differences between the IPAC of the decomposition of MB aqueous solution under UV and Vis-light irradiation with those under dark conditions.
The low-Ag-level thin films show electrical resistivity higher than 106 Ω cm, the ΔIPCA values show a decrease trend under UV-light irradiation, and very lower ΔIPCA values slightly increasing under vis-light irradiation with the increase of Ag mol % in the composites. Middle-Ag-level composite thin films show low electrical resistivity in the range 10−1–10−4 Ω cm and their ΔIPCA values increases again toward the two-third level of the original TiO2 ΔIPCA value under UV-light irradiation. In contrary, the middle-Ag-level composite under vis-light irradiation shows the vis-response, whose level is slightly lower than the decreased UV-sensitivity of the identical thin film samples. A net photocatalytic activity local maximum appears between 60 and 70 mol% for vis-sensitivity. The electrical resistivity of high-Ag-level thin films is increasing from 10−5 Ω cm for COMP-Ag70 to higher than 106 Ω cm for COMP-Ag80, hence the acute decrease of the ΔIPCA value under both UV- and vis-light irradiation can be observed between 70 and 80 mol% of the Ag amount.
3. Discussion
The photocatalytic activity of the Ag-NP/TiO
2 composite thin films including those of unprecedentedly high Ag amounts was quantitatively examined by the decoloration reaction of MB in an aqueous solution. In
Figure 8, the dependency of net photoreactivity (∆IPCA) of each thin film as a function of Ag mol% in the Ag NP/TiO
2 composite thin films are presented, along with that of electrical resistivity. Each ΔIPCA value was calculated as the difference between the IPCA under UV- and vis-light irradiations and the corresponding value measured for each thin film under dark conditions (
Table 1) [
40,
41]. The IPCA under dark condition can be representing both adsorption and self-decoloration of MB [
42,
43], and they are dependent on the Ag amount in the thin films. The IPCA of pure Ag NP is slightly high under visible light compare to those under UV-light and dark; this could be due to the plasmonic photocatalyst associated with Ag nanoparticles [
41].
3.1. Photocatalytic Activity under UV-Light Irradiation
As shown in
Figure 8, the ΔIPCA of the composites under UV irradiation has two points of inflection depending on the Ag amount in the composites. One appears at 40 mol% as a local minimum and another at 60 mol% as a local maximum.
The high ∆IPCA values of the composites whose Ag amounts to up to 30 mol% indicates UV-sensitivity almost identical to anatase thin films [
40]. The decreasing tendency of the activity in this region is due to both the decreases of anatase in TiO
2 [
32] and the TiO
2 amount in the composites by increasing the Ag amount in the composites. The photocatalytic activity of TiO
2 under UV-light irradiation should be due to the anatase form of TiO
2 in the thin films and not to the rutile form [
40], because it was indicated that the photocatalytic activity of these composite thin films is not owing to the oxygen deficiency by the present XPS analysis (
Figure 1).
The acute decrease of the activity occurs between 30 and 40 mol% of the Ag amount which critically corresponds to the percolation threshold of electrical conductivity of the composites [
32]. The ΔIPCA decrease of the composite thin films due to TiO
2 components under UV-light irradiation is thus inevitable by the decrease of anatase with the increase of Ag NP. This tendency should be accelerated by increasing the Ag amount in the composites, because the covering of the TiO
2 surfaces by the deposited Ag particles occurs significantly even if the Ag NP distribute homogeneously (
Figure 3,
Figure 4).
It can be therefore accepted that the decrease of the photocatalytic activity by anatase under UV-irradiation should be consecutive with the increasing amount of Ag NP. However, the ΔIPCA value increases again toward the local maximum whose position deviates slightly from that of the lowest electrically resistivity of the composite thin films, at 60 mol% of Ag amount in the composite. Consequently, the activity recovery to a two-third level of the original TiO2 may be assisted by the enhanced electrical conductivity of the composite. The slight difference between the local-minimum position of the photocatalytic activity and that of the electrical resistivity suggests that the anatase amount in the composites is more effective than the electrical resistivity.
3.2. Photocatalytic Activity under Vis-Light Irradiation
We have shown in
Figure 7c that the increase in the amount of Ag in the composite consistently increased the vis-sensitivity of the composite thin films. This increase in vis-sensitivity of the composite was not only significant, but relatively large in magnitude (
Figure 8). The synergistic effect can be interpreted as the result of the excellent adsorption capabilities of the Ag NP combined with the advantageous effect of silver nanoparticles on light absorption in the visible range [
28,
29]. While there were general positive effects on photocatalytic activity with the increase in the amount of Ag in the composite of up to 70 mol% of Ag amount in the composite, an acute decrease of the ΔIPCA value can be observed between 70 and 80 mol% of the Ag amount. Collectively, these results suggest that the ultimate impact of Ag NP on composite thin films’ photocatalytic activity may be quite predictable. However, the mechanistic basis for vis-sensitivity could be difficult to understand and predict without a good deal of optical absorption spectra [
26,
27]. Therefore, the optical absorption of AgNP/TiO
2 composite thin films were characterized by UV/vis DRS (
Figure 4) in order to study the apparition of different resonant absorption peaks caused by the difference in amounts of Ag in the composite.
3.2.1. Contribution of SPR and LSPR in Photocatalytic Activity under Vis-Light Irradiation
In
Figure 6, when the composite has less than or equal to 70 Ag mol% it is possible to appreciate only a DRS peak 3 (black dotted line). This first well-defined DRS peak was found centered at around
ca. 390 nm (peak 3), and it is attributed to the natural optical resonance of spherical Ag NP [
12,
14]. Although this peak is centered around 390 nm, about one-third of its area in all the composite thin films belongs to visible light region (≥400 nm). The lamp used to study the decoloration of MB aqueous solution employed in this study doe emit 0.8 mWcm
−2 at a wide range of 400 nm–800 nm, which is sufficient to stimulate visible light photocatalytic activity even for the area that cover by the SPR peak 3. All the composites exhibit this SPR peak 3, and are therefore reflecting their capability to respond to visible light. Whereby, peak 3 takes the potential advantage of being present in the same visible spectra widow of the natural optical SPR of spherical Ag NP.
In addition, all the composite thin films showed a typical semiconductor optical absorption band with a lambda maximum peak at around ca. 365 nm (peak 2), which corresponded to the band gap of pure TiO
2, and that is only responsible for UV-sensitivity [
40] and hence not important for vis-sensitivity. Titanium dioxide displays photocatalytic behavior under UV illumination. However, other DRS peaks (peak 1, 4, 5 and 6) are assignable to localized surface plasmon resonance (LSPR). Size-shape-dependent LSPR occur when metallic Ag NP with a different size, shape and separation distance are irradiated by light, whereby large oscillating electric fields are produced between the metal nanoparticles [
12]. Therefore, these plasmonic properties of the Ag NP/TiO
2 composite thin films can help us in elucidating the mechanism behind photocurrent generation by Ag NP/TiO
2 composite thin films. (1) Due to LSPR, electrons from Ag NPs are promoted to higher states in the band. (2) These electrons are then injected into the conduction band of TiO
2 and defuse to catalytically active sites at the semiconductor/liguid interface where they drive chemical transformations [
9,
41]. The proposed mechanism is already confirmed by the experiments of transient photocurrent response [
12,
33].
TEM and SEM micrographs (
Figure 3,
Figure 4) corroborate that the composites have Ag NPs with different size and shapes. XPS results show that Ag NPs are metallic. The metallic property of the Ag NP in our composite thin film is consistent with the XRD we reported recently [
32]. Usually, Ag/TiO
2 thin films are short-lived because Ag NPs on TiO
2 are easily oxidized under vis-light irradiation; therefore, no plasmonic photocatalyst was observed unless the Ag core is covered with a silica (SiO
2) shell [
27] or masked with an Al
2O
3 nanomask [
26] to prevent oxidation of Ag by direct contact with TiO
2. Molecular precursor method enables plasmonic photocatalysis without covering the metallic Ag core in the composite.
3.2.2. Contribution of Electrical Conductivity on the Photocatalytic Activity
Something to be noted is that the dependency of net photocatalytic decoloration rate ∆IPCA of middle-Ag-level composite thin films was significantly higher than that for low- and high-Ag-level composite thin films (
Figure 8). It is interesting that the net photocatalytic decoloration rates of the composite thin films are strongly correlated to their electrical resistivity rather than to the number of LSPR peaks that appeared in the visible region. The low-Ag-level thin films show resistivity higher than 10
6 Ω cm and exhibit the poorest photocatalytic activity under visible light irradiation. These films could still easily absorb photons to produce photoexcited electrons under vis light due to SPR and LSPR DRS peaks in visible light region. However, the movement of these photoexcited electrons is difficult because of very high electrical resistivity associated with low-Ag-level composite thin films [
33]. Hence, this is leading to an increase in extinction probability, which is unfavorable to the photoresponsive activity of the thin film.
On the other hand, the middle-Ag-level thin films show low electrical resistivity in the range 10
−1–10
−5 Ω cm [
32] and high photocatalytic activity, which gradually increases with an increase in the amount of Ag NP on the surface of titania. The increase of Ag NP on the surface of titania may result in a lower electron density of the Ti atoms in the Ag/TiO
2 samples. However, it is widely accepted that the Ag NPs in TiO
2 will benefit the separation of photogenerated electron-hole pairs due to electrical conductivity, thus enhancing the photocatalytic activity [
44].
The electrical resistivity of the high-Ag-level thin films increases again from 10
−5 Ω cm–10
−2 Ω cm [
32] with an increase in the amount of Ag in titania from 70 mol%–80 mol%, respectively. At the same time, the photocatalytic activity of the high-Ag-level thin films has acute decreases with an increase in the amount of Ag from 70 mol%–80 mol%, respectively. This reveals that the electrical conductivity of Ag-NP/TiO
2 composite thin film is important for the higher photocatalytic decoloration rate observed under both UV and vis-light irradiation. Thus, the electrical conductivity property of the thin film facilitates the transportation of extra electrons to the conduction band, which in turn are able to produce more reactive species at the titania surface [
45], blocking electron–hole recombination which stops the production of radicals at the surface [
44].
4. Experimental Section
4.1. Materials
Ethylenediamine-N,N,N′,N′-tetraacetic acid (EDTA) and titanium tetraisopropoxide (Ti(OiPr)4) were purchase from Kanto Chemical Co., Inc. Tokyo, Japan. 30% H2O2 were purchased from Santoku Chemical Industries Co., Ltd. Tokyo, Japan, respectively. Silver acetate, methylene blue (MB) and dibutylamine were purchased from Wako Pure Chemical industries, Ltd. Methanol and 2-propanol were purchased from Taisei Chemical Co., Ltd., Tokyo, Japan while ethanol was purchased from Ueno Chemical Industries, Ltd., Tokyo, Japan and dried on 4A molecular sieves prior to use. Other materials were used without further purification. Polished quartz glass was purchased from Akishima Glass Co., Ltd. (Tokyo, Japan). The quartz glass substrates of 20 × 20 × 1.1 mm3 were prepared and cleaned in 2-propanol with an ultrasonic bath to remove physisorbed organic molecules from the surfaces, followed by rinsing several times with de-ionized water. Then the substrates were dried in a drying oven at 70 °C. NaCl single crystals were purchased from MANAC Incorporated (Tokyo, Japan). Cu grid plates were purchased from NISSHIN EM Co. (Tokyo, Japan).
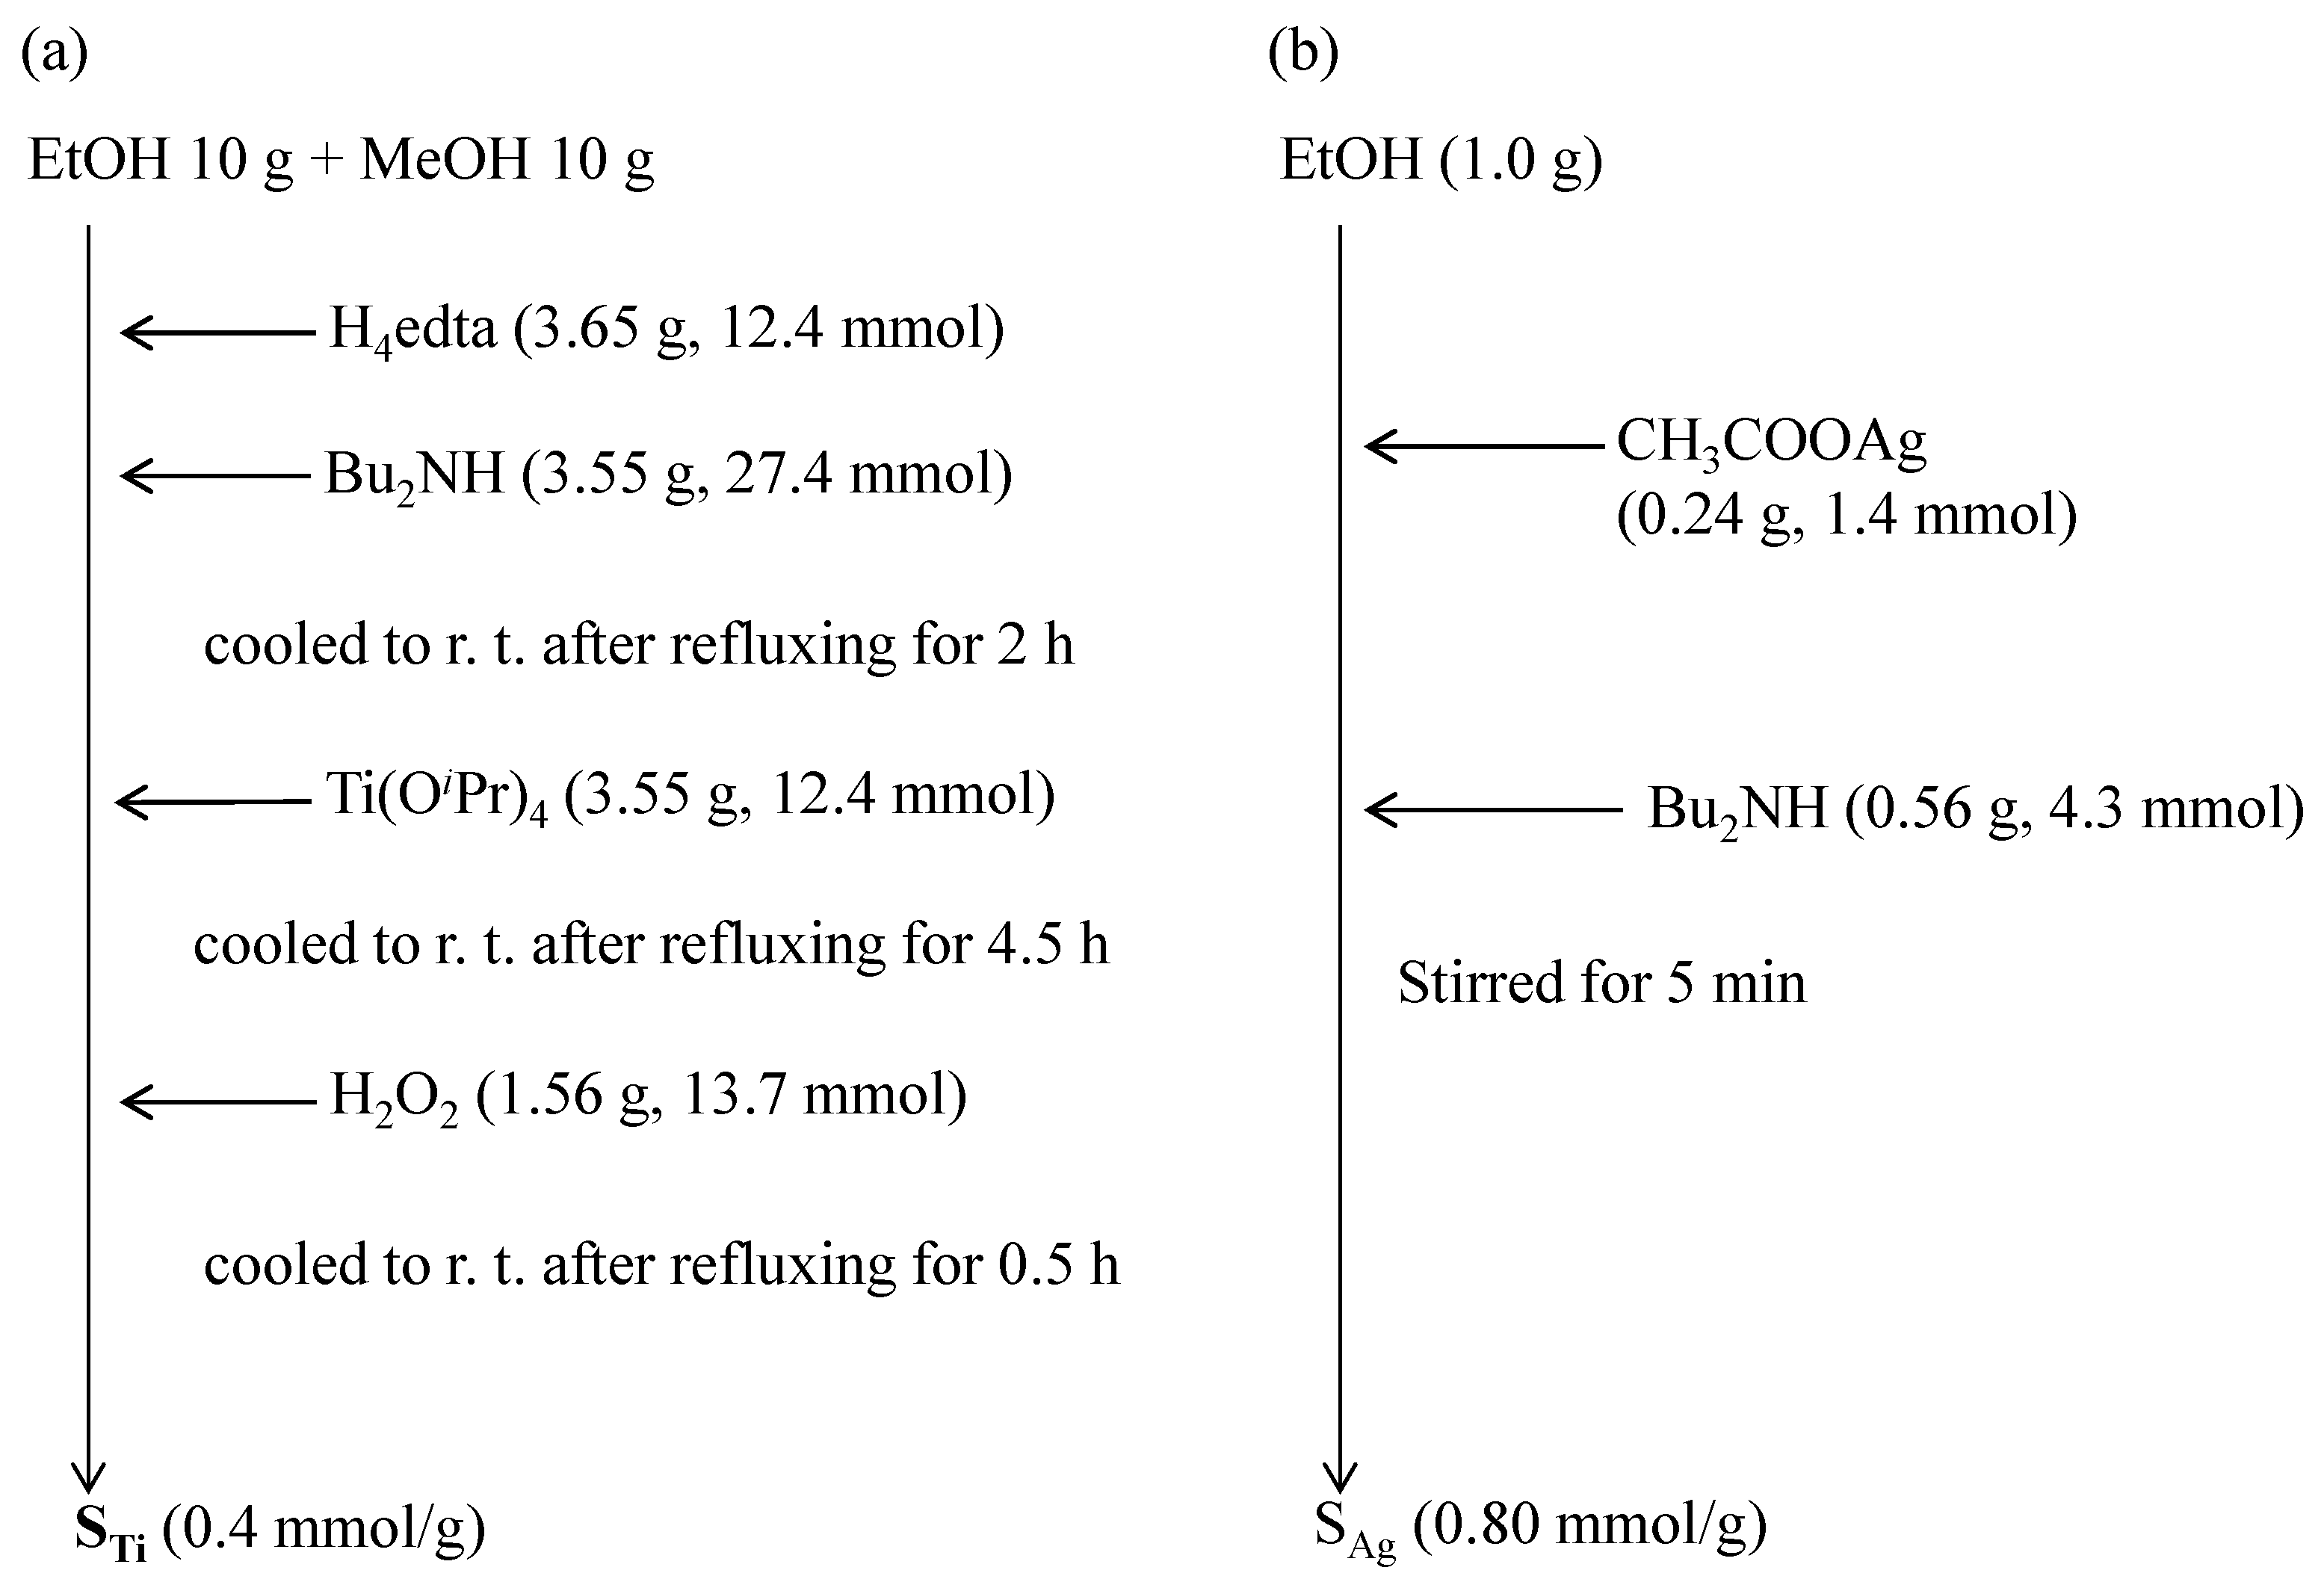
4.2. Preparation of Coating Precursor Solutions, STi, SAg and Scomposite
As shown in
Scheme 1(a), the precursor solution
STi contains a Ti
4+ complex of EDTA was prepared in accordance with the molecular precursor method (MPM) reported in our previous studies [
30,
31,
32,
33]. The ethanol solution of Ag-nanoparticle,
SAg for fabrication of Ag-nanoparticles titania thin film was also prepared separately based on the method that we reported recently [
32] and
Scheme 1b shows how the silver precursor solution
SAg was synthesized. For Ag nanoparticle suspensions, a common method is the Lee-Meisel method, which is a variation of the Turkevich method in that Ag nitrate is used as the metal source [
22,
46]. The application of acetate in the reaction allowed synthesizing metallic nanoparticles without any additional reducer. It makes that kind of synthesis simple, fast, and relatively cheap, and makes it possible to obtain pure composites without any impurities, which is a big advantage when compared to the reduction of silver nitrate [
23,
34]. The
Scomposite, with different compositions, was achieved by mixing a certain amount of
SAg with
STi. Then, the
Scomposite was sonicated with stirring for 5 min to increase the homogeneity.
Scheme 1.
Preparation procedure of the (a) precursor solution STi contains a Ti4+ complex of EDTA and (b) precursor solution, SAg containing silver acetate.
Scheme 1.
Preparation procedure of the (a) precursor solution STi contains a Ti4+ complex of EDTA and (b) precursor solution, SAg containing silver acetate.
4.3. Fabrication of Ag-Nano Particle-Titania Thin Films on Quartz Glass
Before the deposition of
Scomposite, quartz glass substrates (volume: 20 × 20 × 1.1 mm
3) was cleaned using the procedure reported in our recent paper [
33]. Then, the wafers were dried in a drying oven at 70 °C. The Ag-nanoparticle/titania composite (COMP-Ag
n) films were fabricated by heat treating the spin-coated precursor films, while applying the solution
Scomposite. The number
n in the notation of the composite films indicates the silver molar percentage (Ag mol%) to TiO
2; for example, the name COMP-Ag50 indicates that the silver molar percentage in the
Scomposite solution was 50 mol%. The Ag-NP/TiO
2 composite thin films were deposited by spin coating of the
Scomposite onto the substrates with a double step mode: first at 500 rpm for 5 s and then at 2000 rpm for 30 s in all the cases. Thin films were fabricated by heat-treatment at 600 °C for 0.5 h to remove residual organic compounds. Ag-NP/TiO
2 composite ultra-thin films used to measure the TEM images of the composite was also prepared using the same procedure, except that the thin film was fabricated on NaCl single crystals as a supportive substrate and the ultra-thin films were transfer on Cu grid upon.
4.4. Characterization of Ag-NP/TiO2 Composite Thin Films
A Phi Quantum 2000 Scanning ESCA Microprobe (Shimadzu, Tokyo, Japan) with a focused monochromatic Al-Kα X-ray (1486.6 eV) source was employed in order to evaluate the elemental states and quantities―Ti, O, C and Ag―in the thin films. No critical surface charging during the XPS measurements was observed; thereby, no correction of binding energy was performed. The depth profiles were obtained with the identical instrument. The stepwise etching was performed by bombarding the Ar+ ions with 2 kV for 3 min before measuring each layer.
4.5. Surface morphology and Measurement of Optical Properties of Ag-NP/TiO2 Composite Thin Films
The surface morphology of the all resulting composite thin films was observed with a field-emission scanning electron microscope (FE-SEM S-4200, Hitachi, Tokyo, Japan) at an accelerating voltage of 0.5 kV. The nanostructure images for Ag-NP/TiO2 composite thin films were observed with a transmission electron microscope (TEM H8100, Hitachi, Tokyo, Japan) at an accelerating voltage of 120 kV using the ultra-thin films applied on Cu grid. The reflectance spectra of pure TiO2 as well as for those of the Ag-NP/TiO2 composite thin film samples were performed with a Perkin-Elmer Lambda 35 spectrometer provided with a diffuse reflectance accessory
4.6. Photocatalytic Measurement of TiO2 Thin Film and Various Ag-NP/TiO2 Composite Thin Films
The study of the decoration of methylene blue aqueous solution was done using the method adapted in our laboratory [
40,
47]. Here, the photocatalytic activity of pure TiO
2 and composite thin films was estimated by measuring the decoloration rate of methylene blue (0.01 mM) in an aqueous solution (10 mL) containing 20 × 20 mm
2 thin film photocatalyst. Various Ag-NP/TiO
2 composite thin films with different Ag molar concentration or pure TiO
2 thin film was used as the photocatalyst. The photocatalysts were immersed in the 0.02 mM MB aqueous solutions overnight in the dark to allow equilibrate adsorption on the film surfaces.
For UV measurements, the suspension was irradiated using a black light, National FL10BL-B, which emits UV light. The distances of the black light sources from sample surfaces were adjusted to maintain UV intensities at 365 nm of 1.2 mW cm−2 which was measured by an UV meter, UVR-400, Iuchi Co., Ltd. (Tokyo, Japan). Vis-light was obtained from a fluorescent light, Duro-Test Vita-Lite, by removing light of wavelengths shorter than 400 nm using a cut-off filter, Ishihara Window Paint. The vis-light intensity after removing UV components from the fluorescent light, which was estimated by an illuminometer, LX-105, CUSTOM Co., Ltd. (Tokyo, Japan) was 0.8 m W cm−2. In order to examine the degree of adsorption on the glass substrate and self-decomposition of MB, same measurement was performed on the same samples without irradiation (dark) as a reference.
The MB concentration was determined by measuring the absorption spectra of the aqueous solution with the U-2800 spectrophotometer. For the decoloration test,
ca. 3 mL of the 0.01 mM MB aqueous solution was transferred into a quartz cell of dimensions 1
W × 1
L × 4.5
H cm
3 at 20-min intervals. After spectral measurement in the range of 600–700 nm, the solution was immediately returned to the vessel and mixed with the aliquot. The mixed solution continued to be used until the test for each film was completed. The mixed solution was further used until the test for each film was done again after 18 h. The absorption peak value at 664 nm were used in order to determine the concentration of MB after
t minutes, C(
t), using Equation 3:
where Abs(
0) and Abs(
t) represent the absorption values of the solution just before the light irradiation and after
t minutes during irradiation, respectively.
The decoloration rate of MB was examined three times for each film, and the initial decoloration rate (
k) values of concentration after
t minutes of 0.01 µM MB aqueous solution by photoreaction with each potential photocatalytic thin film and a blank were measured by an approximate line for the function of C(
t)
versus t obtained in the range from 0 ≤
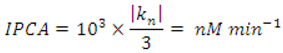
t ≤ 180 min by a least-square method. The index of photocatalytic activity (IPCA) of the film was estimated from the averaged value of
k, using equation 4 adapted from [
40,
48].
where
kn indicates each initial decoloration rate obtained thrice (
n = a, b, c), independently, thus determined by a standardized method.


