Article

Microvolume TOC Analysis as Useful Tool in the Evaluation of Lab Scale Photocatalytic Processes

1
Laboratory of Adsorption and Catalysis, University of Antwerp (UA), Universiteitsplein 1, B-2610 Wilrijk, Belgium
2
Flemish Institute for Technology Research, VITO, Boeretang 200, B-2400 Mol, Belgium
*
Author to whom correspondence should be addressed.
Catalysts 2013, 3(1), 74-87; https://doi.org/10.3390/catal3010074
Submission received: 21 November 2012 / Revised: 24 December 2012 / Accepted: 16 January 2013 / Published: 22 January 2013
(This article belongs to the Special Issue Photocatalysts)

Abstract

:
Analysis methods that require small volumes of aqueous samples can be of large benefit for applications when expensive chemicals are involved or available volumes are substantially small and concentrations are low. A new method is presented to allow microvolume liquid injections on TOC equipment using a special designed Shimadzu gas injection kit® in combination with a high precision syringe and Chaney adapter. Next to details on the methodology of microvolume TOC injections, the technique is shown to be beneficial to evaluate the efficiency of photocatalytic dye degradation on titania materials in terms of CO2 conversion simultaneously with classic UV-Vis analysis measurements within a lab scale photocatalytic test setup (volume <100 mL). The possibility to allow multiple microvolume samplings in short time intervals during several hours without a substantial decrease in volume/catalyst ratio is of particular value for the evaluation of photocatalysts. By combining both techniques at short time intervals, additional knowledge of the degradation process/mechanism, kinetics and the efficiency can be obtained in a direct way. Moreover, the developed μV-TOC analysis is specifically useful in those applications in which low sample volumes in combination with low concentrations are involved. For example, μV-TOC can similarly be put into service in a wide range of small volume setups, e.g., analytes from high-throughput screening, pharmaceutical applications and other advanced oxidation processes that formally could not be analyzed due to limited sample volumes and often low concentrations.

1. Introduction

Recently, titanium dioxide based photocatalysis became an established, significant and still expanding area of research, since it has been proven that the photoinduced “advanced oxidation processes” (AOP) are very efficient in the degradation of harmful, organic pollutants towards CO2 [1,2,3,4,5,6]. Various methods for assessing and characterizing the photoactivity of these materials have been developed. Most of these techniques study the photobleaching process of dye molecules (e.g., methyl orange and Rhodamine 6G) by plotting the decrease in concentration of the dye as a function of time determined via UV-Vis analysis measured at only one wavelength, that of maximum absorption of the original dye [2,3,6]. Although it is a particularly fast, non-destructive and inexpensive method, it only allows evaluating the decrease in concentration of the initial test molecule in function of time. Even though the photobleaching process can be studied in this way, it is not necessarily representative for the total degradation towards CO2 nor the efficiency of the photocatalyst, since only a few bonds in the conjugated system of the molecule needs to be broken to result in a decreased intensity of the absorption maximum of the dye. Therefore, UV-Vis analysis can only be correlated to the initial degradation steps (photobleaching) and not to the total degradation process into CO2 (photobleaching + photomineralization) although the difference is seldom specified. Other techniques such as LC-MS, GC-MS, etc., do allow analysis of different degradation products and degradation mechanisms. However, these techniques are time consuming, expensive and have technical limitations concerning, e.g., column use in respect to aqueous samples, detectable products, etc. Therefore, they are mainly applied for identification of degradation products rather than to study the concentration decay of all products down to CO2.
Total organic carbon analysis (TOC) allows measurement of the total amount of organic carbon present in aqueous samples and is therefore a commonly used, online technique in industry in order to evaluate wastewater streams [7,8]. However, TOC analysis could also be of great importance in the evaluation of advanced oxidation processes, such as photocatalysts, in terms of analysis of the conversion efficiency of the initial pollutants towards CO2 [9]. Nevertheless, the use of classic TOC analysis in these small, lab scale applications (volumes: 25–100 mL) can give rise to serious misinterpretations. Indeed, relatively large volumes of at least 5 mL are needed for each sampling due to the substantial amount of external and internal tubing that leads to the combustion tube, syringe, etc. that needs to be purged with part of the sample volume and results in dead volume. Noting the above stated facts, the number of TOC measurements that can be performed on the available sample volumes at lab scale applications is (too) limited. This implies that, if only a limited amount of samples can be taken for TOC analysis, the sampling is totally arbitrary in function of time what can lead to serious misinterpretations [10,11]. The use of larger test setups is however not opportune in the field of catalyst development and screening, because this implies the need for a substantially increased amount of catalyst [12,13].
In order to resolve these drawbacks and to allow multiple sampling in small volume applications, an alternative injection method for TOC was developed. A Shimadzu® designed gas injection kit was applied to inject a small quantity of sample (liquid) directly on the combustion tube, therefore allowing the use of small volumes of a few microliters only (μL). To assure repetitive and precise injections, a high precision syringe (Hamilton) equipped with Chaney Adapter was applied.
In this study, the developed microvolume injection technique was evaluated on liquids by studying the photobleaching (decomposition of initial molecule) and photomineralization (complete decomposition of initial molecule towards CO2 and H2O) process by titania based photocatalysts. It will be demonstrated that, due to the modified injection method, a standard TOC apparatus can becomea suitable and valuable technique to evaluate the CO2 removal in small volume photoreactors, with a high amount of samplings in short time intervals and for long duration of up to several hours, without disrupting or altering the catalytic activity by substantial changes in the catalyst/solution ratio. Moreover, it will prevent serious errors in interpretations often made by the current methodologies.
Photocatalytic reactions in presence of two different catalysts are described to illustrate the great benefits of μV-TOC analysis (microvolume). The analysis speed and small volume injection allow multiple samplings, which could lead to a better insight into the applied processes. Furthermore, the simple design of the manual injection kit could allow a further development towards auto-sampling. In this way, fully automated analysis could become possible.

2. Results and Discussion

2.1. Performing Microvolume-TOC Analysis in Lab Scale Photocatalytic Applications

In 
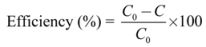
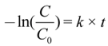
Figure 1, the scheme of a standard TOC is plotted. A detailed picture of the gas injection kit is shown in Figure 2. This new injection technique allows injecting directly on the combustion oven. In this way, large death volumes and a large amount of tubing, that needs to be cleaned with sample solution before injection, is avoided. This leads to a significant reduction of the volume needed for analysis. Applying a dilution procedure, in order to increase the sampling volume and to use the standard tubing, is not always possible. Certainly in case of degradation processes due to the often low concentrations of the organic pollutant and degradation products. Furthermore, because tubing cleaning before injection can be bypassed by direct injection on the combustion tube, the analysis time and sampling frequency can be increased. Moreover, it seriously reduces the amount of Milli-Q water needed and the possibility for errors due to dilution.
The benefit of performing microvolume TOC on small volume liquids in lab scale applications is exemplified by studying the photocatalytic degradation processes of 25 mL 4 × 10⁻⁵ M R6G by 8 mg of the P25 commercial photocatalyst (Evonik®) as photocatalyst. By applying multiple small volume TOC analyses at short intervals, details on the photomineralization processes, next to the information on photobleaching (UV-Vis), can be obtained to assure complete photomineralization in time. This leads to a more thorough evaluation of the photocatalyst in a very fast way. After adsorption (40 min equilibration time, not shown in the 
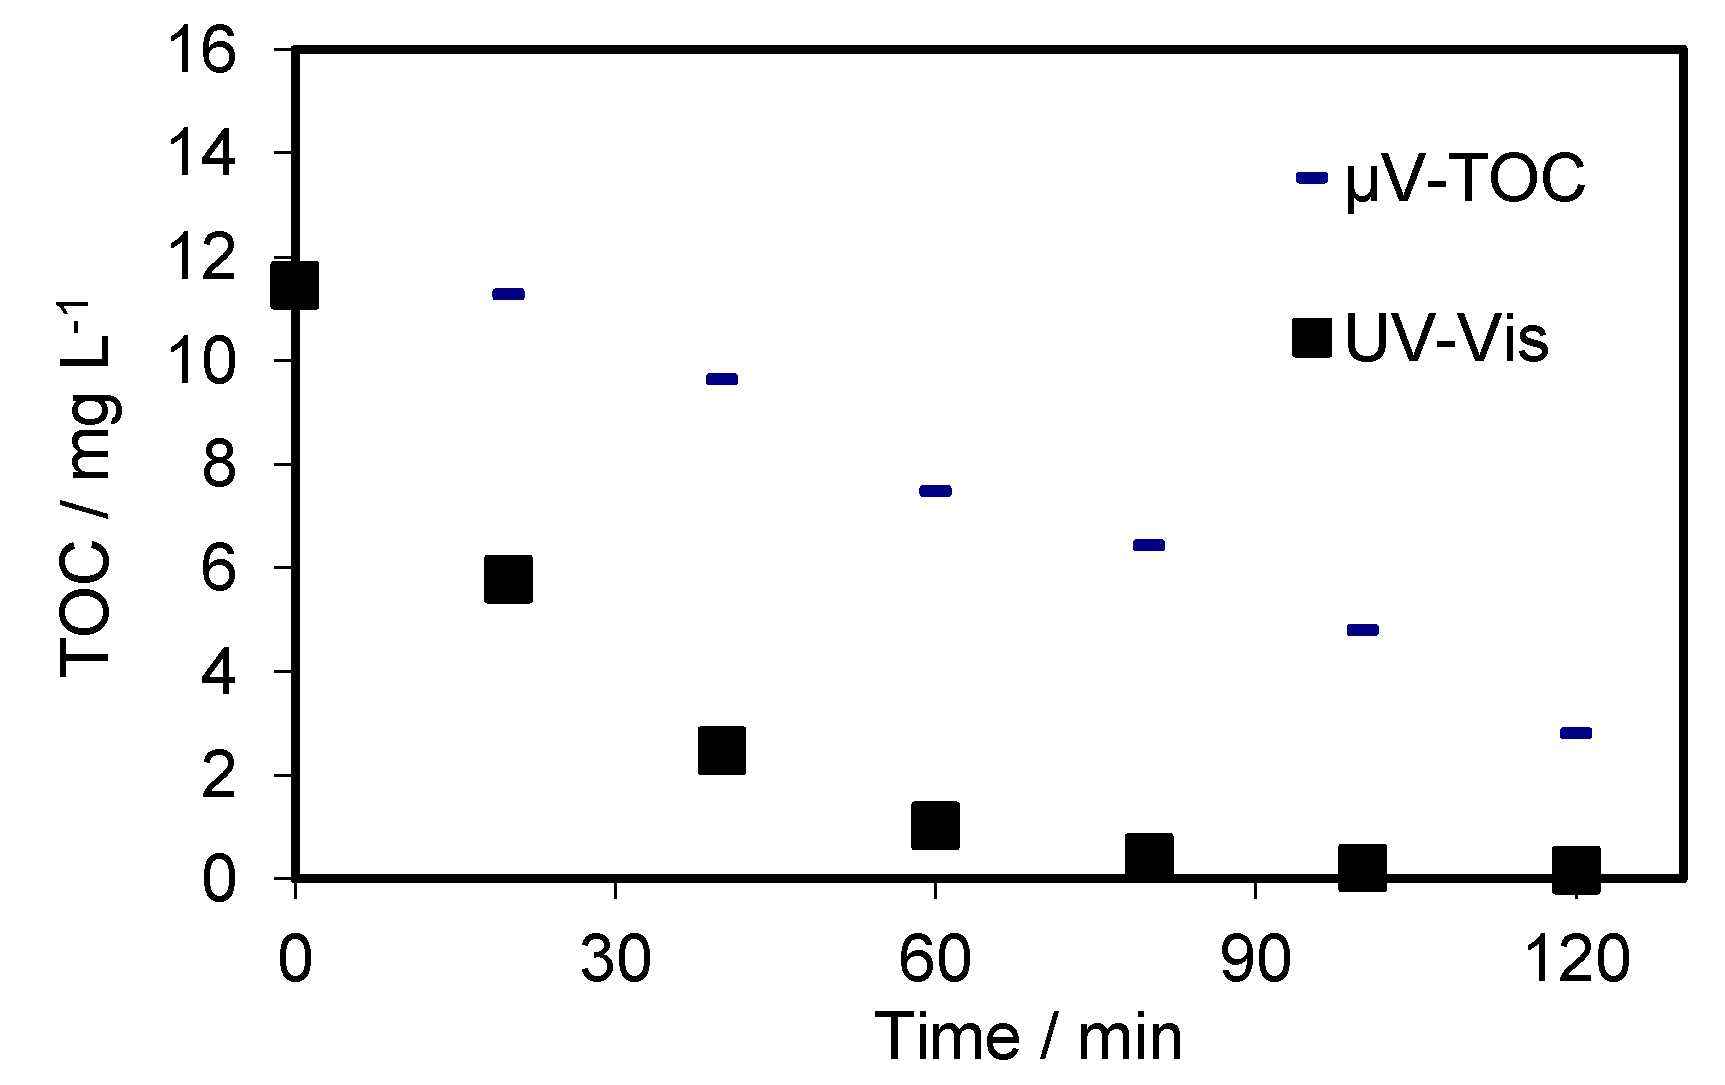
Figure 3), the R6G solution was illuminated with UV-light (365 nm) for 120 min during which UV-Vis spectroscopy and μV-TOC-analysis were performed every 20 min. Results of both measurements are plotted in Figure 3.
Figure 1. Technical scheme of standard TOC equipment (black square). The part of the TOC equipment applied in μV-TOC analysis is marked in grey. The high precision syringe with Chaney Adapter is marked in red: (1) TC injection and (2) IC injection. The part of the standard TOC equipment that is bypassed in μV-TOC-analysis is marked in white. The high precision syringe (Hamilton) equipped with a Chaney Adapter allows for very precise and reproducible injected volumes for each injection, which is indispensable for accurate measurements. The gas injection kit was developed by Shimadzu and applied for the first time for injection of liquids.
Catalysts 03 00074 g001
Figure 2. Close up picture on top of the TOC equipment showing the microvolume injection setup: (1) Shimadzu gas injection kit; (2) Chaney Adapter; (3) Hamilton high precision syringe equipped and (4) cooling fan.
Catalysts 03 00074 g002
Figure 3. Results of the photocatalytic test with 8 mg of P25 in 25 mL 4 × 10⁻⁵ M R6G at room temperature and after 40 min of adsorption-desorption equilibrium in dark:
Catalysts 03 00074 g003
By using the high precision syringe, the standard deviation of each measuring point (TOC) is determined to be maximum 2% (see Table 1). By using the developed micro injection technique, small volumes can be analyzed and many samplings can be performed with only minor influence on the catalyst/dye ratio. This implies that although TOC analysis is a destructive analysis method, it remains applicable in the evaluation of a photocatalyst as sampling volumes are only a few microliters in contrast to 5 mL samples required in regular TOC method. The dye concentration, measured with UV-Vis analysis, is recalculated to the corresponding amount of carbon (ppm) in order to be able to make a good comparison between both analysis methods.
Table 1. Results of automatic and manual injection.
Automatic Injection/ppm TCManual Injection/ppm TC
2 ppm TC5 ppm TC10 ppm TC2 ppm TC5 ppm TC10 ppm TC
2.225.089.982.395.5310.84
2.305.2210.002.625.1810.68
2.155.189.952.745.7510.64
2.165.129.942.425.7510.87
2.555.049.922.515.6110.66
2.235.2010.212.585.8510.23
2.175.0610.062.495.5510.58
2.164.7010.082.495.5310.87
2.165.149.902.555.6810.82
2.135.139.922.825.4310.16
2.22 ± 0.125.09 ± 0.149.99 ± 0.092.56 ± 0.135.59 ± 0.1910.63 ± 0.25
Results of UV-Vis analysis (Figure 3) show an immediate rapid decrease in absorbance, meaning that the degradation of the dye (photobleaching so breaking of the conjugated system) starts immediately after the UV-light has been switched on. After 60 min, only a small amount of the initial dye molecule (16%) is still present in solution and after 120 min, the photobleaching process is almost complete. The obtained TOC profile is however completely different. It can be seen that the total amount of organic carbon in the solution is almost constant during the first 20 min. Longer irradiation times (>20 min), oxidation to CO2 starts to take place but at a much lower rate. This means that at the starting point of the CO2 removal, the concentration of the initial dye has already reached very low values. After 60 min of UV irradiation, 36% of the initial amount of carbon has been oxidized to CO2 (μV-TOC analysis, photomineralization) whereas 91% of the initial dye molecule has been photodegraded into smaller compounds (UV-Vis analysis, photobleaching), indicating a long lifetime of intermediates.
More details on the exact degradation pathway, which is out of the scope of this article, can be found in literature [14]. The combination of both UV-Vis analysis and μV-TOC analysis indicate that the complete photodegradation of R6G into CO2 is a stepwise process. Indeed, CO2 formation occurs only after sufficient formation of certain intermediate products and sufficiently low concentration for R6G. Moreover, the difference in kinetics is clearly visible when comparing the curve of photobleaching (UV-Vis) with photomineralization (μV-TOC). This information would not be obtained with a single point TOC measurement at the end of the experiment as often applied. Table 2 shows the underlying μV-TOC-analysis data and the standard deviations on the measurement.
Table 2. Calculated TOC-values, average TOC-value and standard deviation.
Time (min)TOC (ppm)Average TOC (ppm)Standard deviation
011.8111.7111.6711.720.07
2011.3111.3611.1611.280.10
409.779.699.449.630.17
607.537.337.567.480.12
806.456.366.476.430.06
1004.964.794.654.800.15
1202.692.862.862.800.05
The above described example shows the advantages of μV-TOC -analysis compared to standard TOC measurements. It can be clearly seen that UV-Vis spectroscopy and the detailed μV-TOC analysis reveal different, though complementary information concerning the photobleaching and mineralization process. Therefore, μV-TOC analysis can become an important analytical technique to obtain detailed information on the photomineralization profile, e.g., the required illumination time after which CO2 will start being formed, the lifetime of intermediates, possible occurring deactivation of the catalyst, rate limiting steps, differences in kinetics etc. It becomes clear that misinterpretations and severe errors can be made by only relying on UV-Vis analysis and/or a few sample points (1 or 2) using a standard TOC.
In order to compare the automatic and manual μV-injection further and to determine the accuracy of the μV-injections as compared to general TOC measurements at three different concentrations (2, 5 and 10 ppm) were performed. The results of the measurements are presented in Table 1. Moreover, in order to compare the benefit of μV-TOC analysis with the option of diluting μV samples to obtain the required 5 mL sample amount for general TOC, the results of automatic injection of diluted solutions are compared to original concentrations in the μV sample (Table 3).
As can be seen from Table 1 the standard deviations of the manual and automatic injection method are quite similar. Although the accuracy of the automated injection is better, the normal injection still shows good values that seem to have a repeated overestimation of 0.5 ppm. This could be due to the opening of the gas portal causing the systematic error on all the results for manual injection method. This can be possibly attributed to a small amount of air that is measured while the portal is open. The Table 3 shows the results of automatic injection of diluted solutions. As can be seen from the recalculated results there is a large variation in the data. Comparing these results with those of μV manual injection clearly shows the much higher accuracy compared to automatic injection of diluted solution.
Table 3. Results of automatic injection of diluted solutions (in brackets results recalculated to the μV amount before fifty times dilution).
Automatic injection
2 ppm TC5 ppm TC10 ppm TC
0.21 (10.8)0.28 (14.3)0.30 (15.0)
0.17 (8.8)0.25 (12.9)0.31 (16.0)
0.17 (8.7)0.22 (11.9)0.30 (15.5)
0.18 (9.0)0.24 (12.2)0.30 (15.5)
0.17 (8.5)0.23 (11.8)0.30 (15.4)
0.18 (9.2 ± 0.9)0.24 (12.6 ± 1.1)0.30 (15.5 ± 0.4)

2.2. Benefits of Microvolume-TOC Analysis in Screening of Different Photocatalysts

Due to the advantages of μV-TOC analysis, the photocatalytic activity/efficiency of different materials can be compared. The benefit of combining UV-Vis for photobleaching with μV-TOCanalysis for photomineralization, is further shown in the following experiment in which μV-TOC and UV-Vis analysis will be combined to evaluate the photocatalytic efficiency of two synthesized photocatalysts (non-calcined hydrogen trititanate nanotubes (H-TNT nc) [15] and mesoporous titanium dioxide (EISA NH4OH C450) [16] towards the degradation of R6G. Both catalysts have strongly divergent characteristics (specific surface area, crystal phase and pore diameter) as can be seen in Table 4.
Table 4. Structural characteristics and data deduced from photocatalytic degradation reactions.
S.A. a (m²/g)Pore b Diam. (nm)Ads c (%)UV d (removal %)k-value eμV-TOC f (removal%)Crystal g Phase
EISA C450 NH4OH2473.617980.007339Anatase (TiO2)
H-TNT nc3204.022880.002574Trititanate H2Ti3O7
a S.A. (specific surface area) deduced from N2-sorption, BET, −196 °C; b Pore diameter deduced from N2-sorption, BJH method, −196 °C and HR-TEM; c Percentage R6G removed out of solution by adsorption determined after 40 min at λmax = 526 nm; d Percentage of carbon removed via photobleaching determined using UV-analysis at λmax = 526 nm; ek-Value represents the degradation rate determined from UV-analysis at λmax = 526 nm; f Percentage of photomineralization determined using μV-TOC after 360 min of irradiation; g Crystal phase determined using FT-Raman.
In the photocatalytic tests 16 mg of catalyst is added to 50 mL 4 × 10⁻⁵ M R6G and later illuminated with UV light. The detailed description of the photocatalytic tests can be found in the 
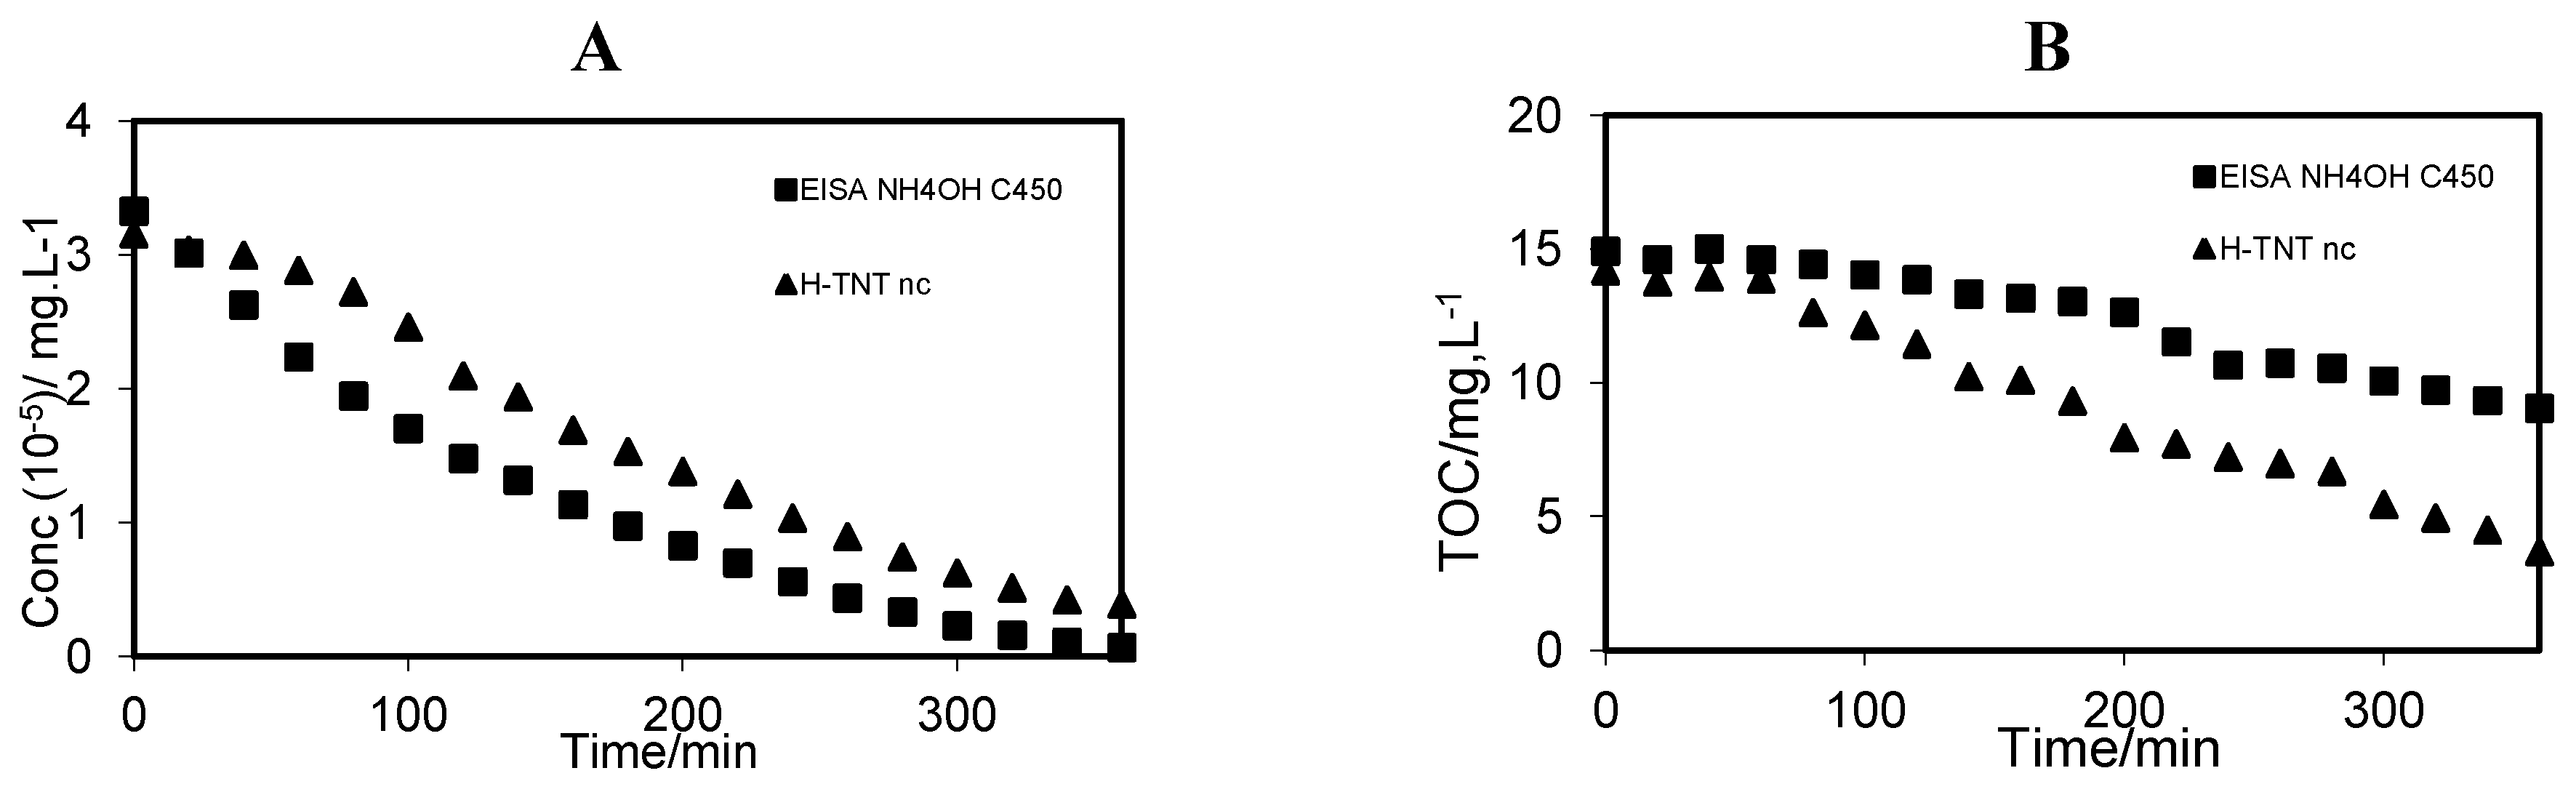
Experimental Section. Results of the photocatalytic experiment as obtained by UV-Vis spectroscopy and after establishing the adsorption-desorption equilibrium are plotted in Figure 4A. The concentration of the initial dye molecule (R6G) is plotted as function of time. Figure 4B depicts the results of the μV-TOC measurements. UV-Vis-analysis shows that there is an immediate decrease in dye concentration using both catalysts, as soon as the UV-light has been switched on. However, there is a significant difference in the photodegradation rate (Table 4 and Figure 4A). Considering only the results of UV-Vis analysis, this could allow to conclude that both catalysts are very active, but that EISA NH4OH C450 has faster kinetics. Yet, when looking at the photomineralization (Figure 4B, μV-TOC) neither the TOC profile of EISA NH4OH C450 nor H-TNT nc show an immediate decrease. Even more, the TOC amount is constant during the first 60 min of UV irradiation indicating that only intermediate products are formed and no complete mineralization to CO2 has taken place. If the irradiation time is long enough (>60 min), the intermediate degradation products can be photooxidized further to CO2 as observed by decreasing TOC concentrations.
Figure 4. Photodegradation of 50 mL 4 × 10⁻⁵ M R6G by 16 mg of catalyst at room temperature and after 40 min of adsorption-desorption equilibrium in dark: (A) UV-Vis-analysis and (B) μV-TOC-analysis.
Catalysts 03 00074 g004
According to UV-Vis analysis (Figure 4A and Table 5), H-TNT nc needs a longer irradiation time to have the same percentage of degradation of R6G, as compared to EISA NH4OH C450 and would therefore be seen as the least interesting catalyst. However, the conversion to CO2 after 360 min is four times higher in case of H-TNT nc indicating that it is much more efficient in photomineralization (Figure 4B). After 360 min, 74% of the TOC is removed by H-TNT nc, whereas EISA NH4OH C450 eliminates only 40% of TOC out of the water. It is now clear, that H-TNT nc would be more interesting for applications as the lifetime of intermediate degradation products is much shorter. One can understand that in the water treatment, it is more important to convert the organic pollutants into CO2 in a fast and efficient way instead of degrading molecules in only smaller intermediate degradation products that can be as harmful (or worse) than the original pollutant. The stepwise decrease of TOC (Figure 4B) is assumed to be due to competitive adsorption with other intermediate reactions that go not towards direct photomineralization. However, further research and explanations are ongoing.
Table 5. Degradation percentage of R6G by H-TNT nc and EISA NH4OH C450 using UV-Vis analysis and μV-TOC analysis.
H-TNT ncEISA C450 NH4OH
UV analysis (removal %)6060
μV-TOC analysis (removal %)4712
Time (min) *200140
* Time (min) needed to obtain the described removal % in UV-Vis.
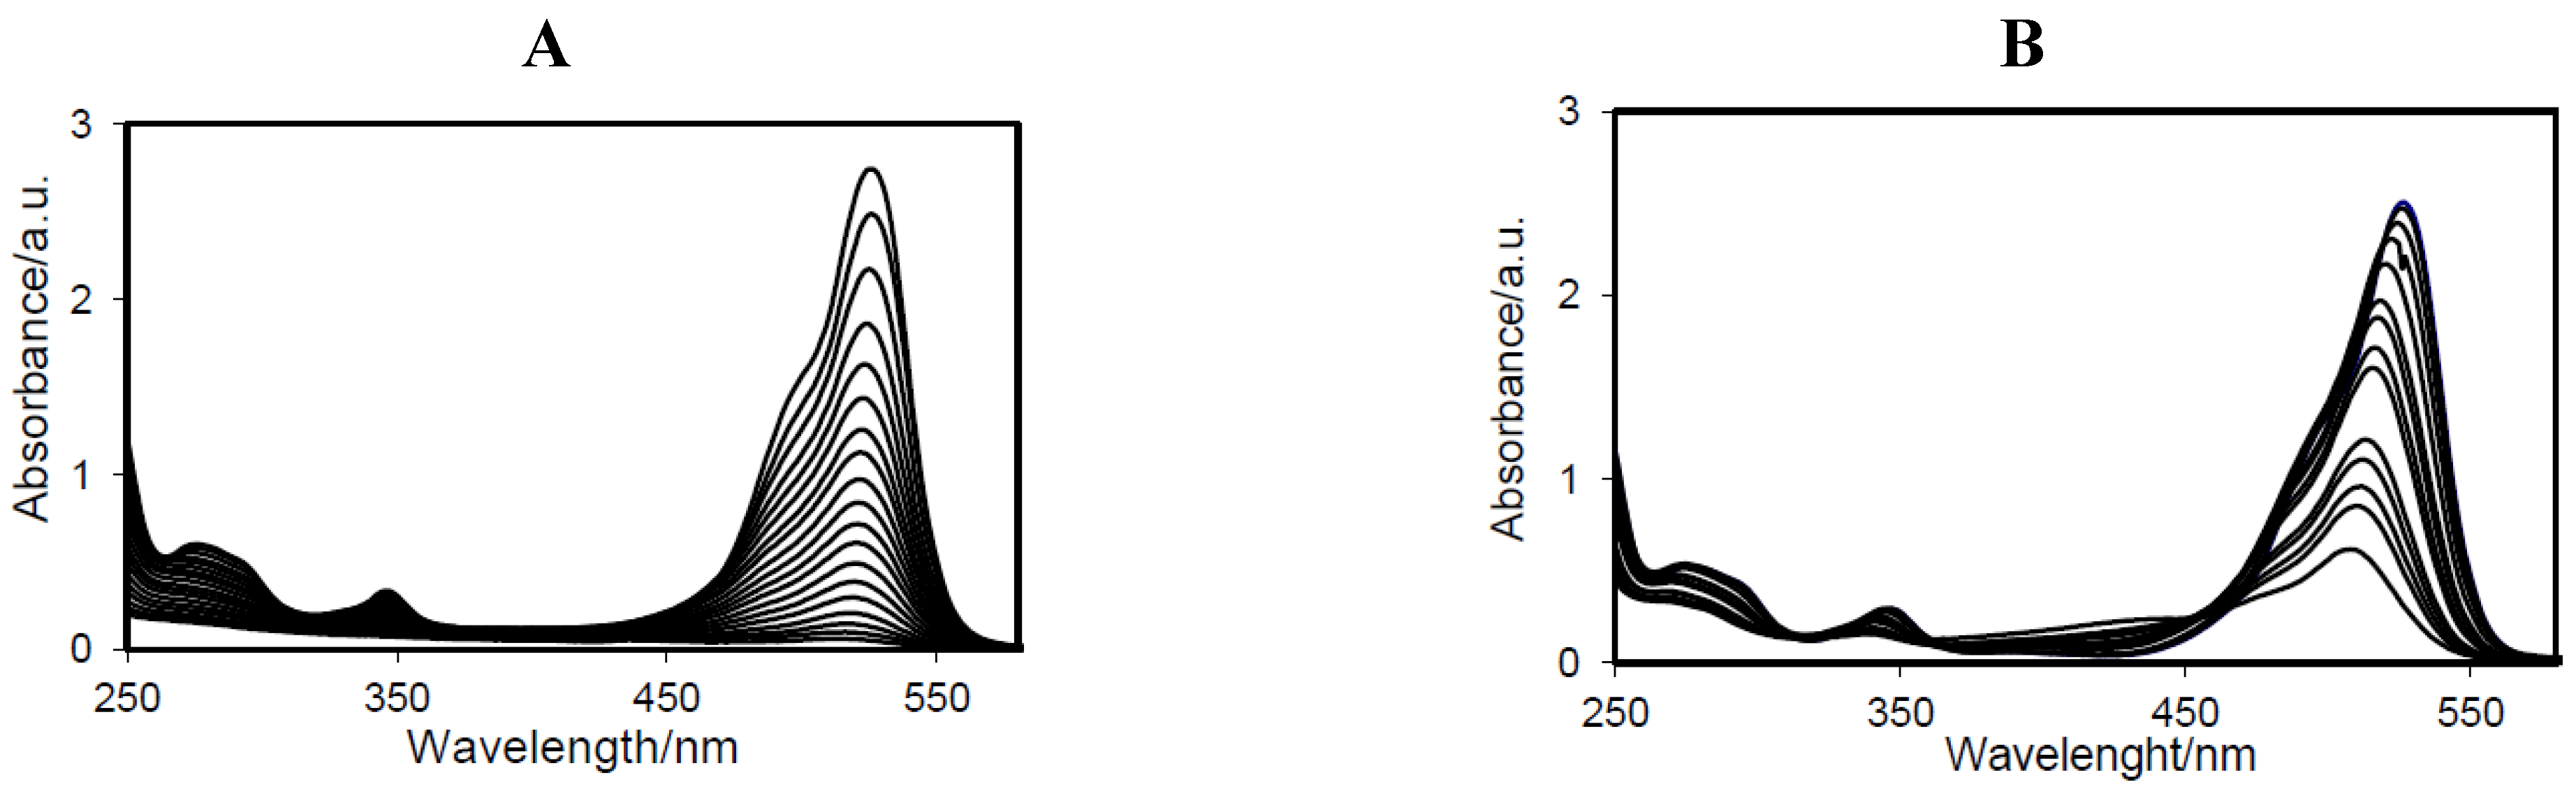
The benefit of combining both techniques (UV-Vis analysis and μV-TOC analysis) is clearly illustrated by this large difference in the degradation mechanism for both catalysts. Moreover, for both catalysts, stepwise TOC removal is observed, similar as observed in case of P25 as catalyst. This type of information could not have been derived based on only UV-Vis analysis and/or a few TOC measuring points as classically applied. Therefore, μV-TOC analysis can be applied as quick screening method unraveling important differences between catalysts. The strongly divergent degradation mechanism can be confirmed by UV-Vis scans (Figure 5A and Figure 5B) of the degraded R6G solution by both catalysts in function of time. In Figure 5B, it can be seen that H-TNT leads to a decrease and hypsochromic shift in absorption maximum whereas for EISA NH4OH C450 only a decrease in absorption maximum can be observed without a shift of the maximum (Figure 5A). It has to be noticed that these scans only apply to the photobleaching process.
Figure 5. Photodegradation of 50 mL 4 × 10⁻⁵ M R6G by 16 mg of catalyst at room temperature and after 40 min of adsorption-desorption equilibrium in dark analyzed by means of UV-Vis scan: 16 mg of catalyst in 50 mL 4 × 10⁻⁵ M R6G: (A) EISA NH4OH C450 and (B) H-TNT nc.
Catalysts 03 00074 g005
For a more thorough study of the formed intermediate reaction products, other techniques such as LC-MS are necessary. The reason for the divergent degradation mechanism can be appointed to the structural and/or physicochemical differences, e.g., the crystal phase. However, this does not fall within the scope of this paper though it is part of ongoing research.
In this example, the detailed μV-TOC plots, obtained by the developed μV-TOC analysis method give very valuable synergic information when combined with UV-Vis analysis. The various benefits can be summarized as follows:
(1) Multiple injections in short time intervals using small microliter volumes became possible, revealing important difference in kinetics for photobleaching and photomineralization. Performing only UV-Vis analysis could lead to serious misinterpretations, as has been shown above, since photocatalysts can only be regarded as efficient if both reaction rates (photobleaching and photomineralization) are high.
(2) Due to many sampling points, a detailed TOC profile can be obtained and the time needed for photomineralization to take place can be determined. This offers a huge benefit compared to standard TOC measurements on lab scale applications in which only 1 or 2 sampling points can be measured. Indeed, using standard TOC in this kind of applications, the sampling points have to be chosen arbitrary what could lead to very different and erroneous results depending on the time after which these points are taken.
(3) The combination of μV-TOC analysis with UV-Vis analysis allows for a fast screening of photocatalysts allowing detection of structural and/or physicochemical effects that influence the catalytic efficiency towards CO2. This could be clearly proven by studying the photoeffiency of different catalysts in the degradation of dyes. Effects such as arising deactivation processes or rate limiting steps, etc., which cannot be directly detected via UV-Vis analysis, become very clear in the mineralization profile obtained by μV-TOC analysis. A more detailed study can be performed afterwards to identify the different intermediates and reaction mechanism using more expensive, advanced and time consuming techniques such as LC-MS.

3. Experimental Section

3.1. Chemical Reagents

All products were used as received without any modification or purification, unless stated otherwise. Ultrapure Milli-Q water was used to prepare the different solutions. The dye molecule applied in this work is Rhodamine 6G (R6G). TiO2-P25 Evonik® (Evonik Indistries, Essen, Germany) was used as one of the photocatalysts. The crystalline phase of TiO2-P25 Evonik® is composed of mixed phase of anatase/rutile (80%/20%) with a specific surface area of 50 m²/g and a particle size between 20–50 nm.

3.2. Catalyst Synthesis

Mesoporous titania was synthesized using the “Evaporation Induced Self-Assembly”-method (EISA). To stabilize the structure, the obtained powder was refluxed in NH4OH and after drying calcined at 450 °C to remove the organic template. Samples will be referred to as “EISA NH4OH C450”. More details on the synthesis method can be found in the synthesis procedure [15,16]. Furthermore, hydrogen trititanate nanotubes (H-TNT nc) were synthesized using a hydrothermal, template free, synthesis method [16,17]. The nanotubes were crushed afterwards. (Structural details are given in Table 4).

3.3. Instrumentation

Microvolume-TOC analysis was performed on a Shimadzu TOC-VCPH (Shimadzu, Kyoto, Japan) equipped with a palladium normal sense catalyst and a Shimadzu designed gas injection kit. Samples are injected with a high precision syringe of 250 μL (Hamilton 1725 gastight syringe with Chaney Adapter. RN type 2. Hamilton Company, Bonaduz, Switzerland). Combustion of the injected samples to CO2 takes place at 680 °C. The amount of CO2 is measured with a NDIR detector (Shimadzu, Kyoto, Japan).
UV-Vis measurements of the dye solution, taken at fixed wavelengths at maximum absorption (λmax = 526 nm) as well as wavelength scans were performed on a Thermo-electron evolution 500 UV-Vis double beam spectrometer (Thermo Fisher Scientific, Waltham, MA, USA).
N2-sorption: The surface area and porosity of the photocatalysts were determined on a Quantachrome Quadrasorb SI automated gas adsorption system with an AS-6 degasser (Quantachrome Instruments, Odelzhauzen, Germany). Prior to the measurement he EISA and P25 samples were outgassed at 200 °C for 16 h whereas the H-TNT sample was degassed at 150 °C for 16 h. Afterwards N2-sorption was carried out at −196°C. The Brunauer-Emmet-Teller (BET) method was used to calculate the specific surface area. The volume adsorbed at a relative pressure P/P0 = 0.97 was used to determine the total pore volume.
FT-Raman spectroscopy: Samples were measured on a Nicolet Nexus 670 bench equipped with an InGaAs detector in a 180 °C reflective sampling configuration using a 1064 nm Nd:YAG laser and a laser power of 0.8 watt (Thermo Fisher Scientific, Waltham, MA, USA).

3.4. Measurements of Photocatalytic Activity by UV-Vis-Analysis

The photocatalytic activity was tested by photodegradation of a cationic dye (rhodamine-6G R6G) in aqueous solution. The catalyst (8 mg/16 mg) was added to a suspension of 50 mL 4 × 10⁻⁵ M dye solution and stirred for 40 min without UV irradiation so that an adsorption-desorption equilibrium could be established between the dye molecules and the catalyst surface. Then, the solution was irradiated for 120–360 min with UV light (wavelength 365 nm) emitted by a 100 Watt Hg-lamp (Sylvania Par 38; 21.7 mW/cm² at 5 cm). During this illumination, samples with a volume of 5 mL were taken out of the suspension at fixed time intervals (20 min) and analyzed by UV-Vis spectroscopy (Thermo-electron evolution 500, double beam UV-Vis spectrometer). A volume of 0.6 mL was used for TOC-measurements. The remaining 4.4 mL of the sample was brought back to the illuminated test solution to prevent large changes in volume/catalyst ratio. The absorbance was measured in UV-Vis at 526 nm (λmax of R6G) with water as a reference. The obtained absorbance values were converted to concentrations by applying the Lambert-Beer’s law. The determination of the decolorization efficiency (%) (photobleaching) can be given by the following Equation (1):
Catalysts 03 00074 i001
where C0 is the initial concentration of the dye after adsorption-desorption equilibrium has been established and C is the final concentration after illumination by UV-light for a certain time.
Besides the efficiency percentage, the reaction rate constant (k-value) of photobleaching can be calculated. In all the discussed photocatalytic experiments, photobleaching of dye molecules using titania based materials follows a first order reaction. Therefore, the reaction rate is given by Equation (2):
Catalysts 03 00074 i002
Integration of Equation (2) between C and C0 (respectively the concentration at t and t = 0):
Catalysts 03 00074 i003
The reaction rate is always measured based on the UV-Vis-analysis and therefore it consists only of the rate of photobleaching and not on the total photodegradation to CO2.
Under the applied experimental conditions, photolysis of the dyes is negligible. All photocatalytic reactions were performed at room temperature.

3.5. Measurements of Photocatalytic Activity by Microvolume-TOC Analysis

Every 20 min, 5 mL samples were taken for UV-Vis analysis. From this sample, 0.6 mL was used for μV-TOC analysis. Using this 0.6 mL volume, two separate measurements were performed in which (1) the total amount of carbon (TC) was measured and (2) the total amount of inorganic carbon (IC) was determined. For both TC and IC measurements 3 sequential injections were performed (50 µL was injected for TC and 150 μL was injected for IC). Samples for TC analysis were injected directly on the combustion oven, using the special designed gas injection kit. Samples for IC analysis were injected directly on the acid containing vile (see Figure 1 and Figure 2). The Total Organic Carbon (TOC) value can be calculated using the following equation
TOC = TC − IC
where TOC—Total Organic Carbon; TC—Total Carbon; IC—Inorganic Carbon. The detection limit for the TOC measurement is 50 μg/L.

3.6. Method Validation

The method was validated by repeated injections of diluted TC standard solution on the TOC equipment. Solutions of concentration 10, 5 and 2 ppm TC were prepared from 1000 ppm TC standard solutions. The prepared solutions were further diluted (one milliliter of solution was transferred to a 50 mL volumetric flask) in order to compare the results of manual injection of prepared μV solutions with automatic injection of diluted solutions and then recalculated to the original concentration before dilution.

4. Conclusions

In small volume applications involving low concentrations of organics, e.g., photocatalytic tests at lab scale, only a few points can be measured using classical TOC analysis because relatively high sample volumes are required. In this way, substantial and important information is disregarded and severe errors can be made in the interpretation of the results, especially in these applications where TOC concentrations change in function of time. Therefore, a Shimadzu® designed gas injection kit, in combination with a high precision syringe equipped with a Chaney Adapter, was applied to perform microvolume (μV) Total Organic Carbon (TOC) measurements on liquids. The injection of microvolumes, μV-TOC analysis can be performed simultaneously with UV-Vis analysis on small lab scale setups (25–100 mL) allowing TOC values to be measured in short time intervals and for long irradiation times. A true synergy is achieved via detailed information on both the photobleaching (UV-Vis) and photomineralization (μV-TOC) processes in a fast, cheap, easy and direct way without substantial changes in the catalyst/solution ratio. The μV-TOC analysis has been found very useful for correct information on photocatalytic efficiency, differences in degradation mechanism, deactivation studies and kinetics. The use of this new technique can be further extended towards, e.g., other advanced oxidation processes, high throughput applications, cleaning validation in pharmaceutical and biotechnological research laboratories and other small volume applications. In short, all applications that involve small volumes of (often expensive) chemicals present in low concentrations can benefit from the presented μV-TOC application.

Acknowledgments

Joke Van Laer and Matthias Laleman (Shimadzu) are acknowledged for their technical support with respect to the development of the μV TOC analysis. This work has been performed in the frame of the FWO project (G. 0237.09).

Conflict of Interest

The authors declare no conflict of interest

References

  1. Carp, O.; Huisman, C.L.; Reller, A. Photoinduced reactivity of titanium dioxide. Prog. Solid State Chem. 2004, 32, 33–177. [Google Scholar] [CrossRef]
  2. Gaya, U.I.; Abdullah, A.H.; Zainal, Z.; Hussein, M.Z. Photocatalytic treatment of 4-chlorophenol in aqueous ZnO suspensions: Intermediates, influence of dosage and inorganic anions. J. Hazard. Mater. 2009, 168, 57–63. [Google Scholar] [CrossRef]
  3. Klavarioti, M.; Mantzavinos, D.; Kassinos, D. Removal of residual pharmaceuticals from aqueous systems by advanced oxidation processes. Environ. Int. 2009, 35, 402–417. [Google Scholar] [CrossRef]
  4. Ollis, D.F.; Pelizzetti, E.; Serpone, N. Photocatalyzed destruction of water contaminants. Environ. Sci. Technol. 1991, 25, 1522–1529. [Google Scholar] [CrossRef]
  5. Ratiu, C.; Manea, F.; Lazau, C.; Orha, C.; Burtica, G.; Grozescu, I.; Schoonman, J. Photocatalytically-assisted electrochemical degradation of p-aminophenol in aqueous solutions using zeolite-supported TiO2 catalyst. Chem. Papers 2011, 65, 289–298. [Google Scholar] [CrossRef]
  6. Xia, H.; Zhuang, H.; Zhang, T.; Xiao, D. Visible-light-activated nanocomposite photocatalyst of Fe2O3/SnO2. Mater. Lett. 2008, 62, 1126–1128. [Google Scholar] [CrossRef]
  7. Thomas, O.; El Khorassani, H.; Touraud, E.; Bitar, H. TOC versus UV spectrophotometry for wastewater quality monitoring. Talanta 1999, 50, 743–749. [Google Scholar] [CrossRef]
  8. Catalkaya, E.C.; Kargi, F. Advanced oxidation treatment of pulp mill effluent for TOC and toxicity removals. J. Environ. Manag. 2008, 87, 396–404. [Google Scholar] [CrossRef]
  9. Slezak, R.; Krzystek, L.; Ledakowicz, S. Simulation of aerobic landfill in laboratory scale lysimeters—Effect of aeration rate. Chem. Papers 2009, 63, 223–229. [Google Scholar]
  10. Araña, J.; Herrera Melán, J.A.; Doña Rodriguez, J.M.; González Diaz, O.; Viera, A.; Pérez Peña, J.; Marrero Sosa, P.M.; Espino Jiménez, V. TiO2-photocatalysis as a tertiary treatment of naturally treated wastewater. Catal. Today 2002, 76, 279–289. [Google Scholar]
  11. Zhao, C.; Deng, H.; Li, Y.; Liu, Z. Photodegradation of oxytetracycline in aqueous by 5A and 13X loaded with TiO2 under UV irradiation. J. Hazard. Mater. 2010, 176, 884–892. [Google Scholar] [CrossRef]
  12. Son, H.S.; Lee, S.J.; Cho, I.H.; Zoh, K.D. Kinetics and mechanism of TNT degradation in TiO2 photocatalysis. Chemosphere 2004, 57, 309–317. [Google Scholar] [CrossRef]
  13. You, S.J.; Damodar, R.A.; Hou, S.C. Degradation of Reactive Black 5 dye using anaerobic/aerobic membrane bioreactor (MBR) and photochemical membrane reactor. J. Hazard. Mater. 2010, 177, 1112–1118. [Google Scholar] [CrossRef]
  14. He, Z.; Sun, C.; Yang, S.; Ding, Y.; He, H.; Wang, Z. Photocatalytic degradation of rhodamine B by Bi(2)WO(6) with electron accepting agent under microwave irradiation: Mechanism and pathway. J. Hazard. Mate. 2009, 162, 1477–1486. [Google Scholar] [CrossRef]
  15. Ribbens, S.; Meynen, V.; van Tendeloo, G.; Ke, X.; Mertens, M.; Maes, B.U.W.; Cool, P.; Vansant, E.F. Development of photocatalytic efficient Ti-based nanotubes and nanoribbons by conventional and microwave assisted synthesis strategies. Microporous Mesoporous Mater. 2008, 114, 401–409. [Google Scholar] [CrossRef]
  16. Beyers, E.; Cool, P.; Vansant, E.F. Stabilisation of mesoporous TiO2 by different bases influencing the photocatalytic activity. Microporous Mesoporous Mater. 2007, 99, 112–117. [Google Scholar] [CrossRef]
  17. Meynen, V.; Cool, P.; Vansant, E.F. Verified syntheses of mesoporous materials. Microporous Mesoporous Mater. 2009, 125, 170–223. [Google Scholar] [CrossRef]

