2.1. Influence of Synthesis Conditions in the Textural Properties of Carbon Xerogels
Though it will be further on described in detail within the experimental section, note that the synthesized carbon xerogels were labelled as follows: CX stands for carbon xerogel, followed by an identifying number and the main variable changed in its synthesis. For instance: CX-1-RF-25, stands for a carbon xerogel prepared under a resorcinol/formaldehyde molar ratio = 0.25. Carbon xerogels named as CX-4-RC-50-Ac. or CX-5-H2SO4, were synthesized under resorcinol/catalyst molar ratio = 50, using acetone as solvent and sulphuric acid as catalyst, respectively. Carbon xerogels followed by RC-800-W or RC-1500-W represent carbon materials synthesized with a resorcinol/catalyst molar ratio = 800 or 1500, and water (W) as solvent. Vulcan XC-72C carbon black, denoted C-Vulcan, was also used in the preparation of analogous catalytic systems.
Table 1 shows the values of BET surface area (
SBET), micropore volume (
Vmicro), mesopore volume (
Vmeso BJH), total pore volume (V
pore p/p0 ≈ 1), as well as mean pore diameter, derived from the N
2 adsorption isotherms acquired for the carbon xerogels prepared under different synthesis conditions. The results obtained in this textural characterization confirm that carbon materials of diverse porous structures can be obtained by modifying parameters such as the precursor to formaldehyde molar ratio (P/F), the amount and type of catalyst and solvent employed. The assorted values of surface area obtained, ranging from 176 to 554 m
2 g
−1, clearly indicate that carbon xerogels possess different degrees of porous structure development, resulting in materials with very different pore size distribution.
Table 1.
Surface area and pore volumes obtained from N2 adsorption isotherms for the carbon xerogels prepared.
Table 1.
Surface area and pore volumes obtained from N2 adsorption isotherms for the carbon xerogels prepared.
| Carbon xerogel | SBET (m2 g−1) | Vmicro (cm3 g−1) | Vmeso BJH (cm3 g−1) | Vporep/p0 ≈ 1 (cm3 g−1) | Mean pore size (nm) |
|---|
| CX-1-RF-25 | 554 | 0.09 | 0.82 | 0.93 | 8.9 |
| CX-2-RF-50 | 534 | 0.12 | 0.95 | 1.07 | 11.7 |
| CX-3-RF-100 | 176 | 0.10 | 0.00 | 0.10 | 3.4 |
| CX-4-RC-50-Ac | 425 | 0.19 | 0.16 | 0.39 | 10.9 |
| CX-5-H2SO4 | 390 | 0.21 | 0.01 | 0.23 | 2.6 |
| CX-6-RC-800-W | 528 | 0.14 | 1.66 | 1.79 | 23.1 |
| CX-7-RC-1500-W | 405 | 0.22 | 0.04 | 0.27 | 11.6 |
| CX-8-Pyrogallol | 234 | 0.12 | 0.01 | 0.14 | 24.0 |
| C-Vulcan | 224 | 0.04 | 0.46 | 0.47 | 11.0 |
Carbon xerogels CX-1-RF-25, CX-2-RF-50 and CX-3-RF-100 were prepared using different resorcinol to formaldehyde molar ratios. Moving to R/F (resorcinol/formaldehyde) molar ratios lower than the stoichiometric value of 0.5, results in excess formaldehyde and, thus, increased reactant dilution, which yields higher polymeric particle sizes near the gelation limit [
2]. Thus, upon drying, the gel structure partially collapses, resulting in a material, CX-1-RF-25, possessing lower mean pore size and lower mesopore, V
BJH, pore volume, in comparison to CX-2-RF-50, carbon xerogel synthesized using the stoichiometric molar ratio. Tamon and co-workers previously reported similar collapse of the mesopore structure, due to the presence of remaining formaldehyde after sol-gel polycondensation [
17]. Further increasing
R/
F molar ratio up to a value of 1,
i.e., excess resorcinol, results in a carbon material, CX-3-RF-100, which is predominantly microporous. Tamon
et al. described as well difficulties in drying the gel prepared using
R/
F = 1, due to incomplete gelation of the sol. Maldonado-Hódar
et al. [
18] reported lower surface areas and pore volume corresponding to pore diameter higher than 50 nm, for carbon aerogels synthesized using increasing R/F molar ratios. Final textural properties of the carbon xerogels are as well determined by the relative amount of catalyst in the sol. Catalysts act in fact as a buffer regulating the sol pH. In the case of using an alkaline catalyst,
i.e., Na
2CO
3, it is generally considered that low P/C (precursor/catalyst) molar ratios result in small polymer particles (about 3–5 nm size) which are highly interconnected by large necks giving the gel a fibrous appearance. In contrast, high P/C molar ratios result in large polymer particles (16–200 nm diameter), yielding a carbon material of notably increased mesopore volume [
2]. A low amount of catalyst,
i.e., high P/C ratios, means fewer nucleation sites in the sol for the growth of clusters, which thus form a less branched network and will persist longer in the nucleation regime, leading to less compact gels [
19,
20]. In this sense, CX-6-RC-800-W, synthesized using P/C = 800, possesses higher mesoporous volume and shows increased mean pore size in comparison to CX-2-RF-50, prepared at P/C = 50. However, further increase of P/C molar ratio from 800 to 1500 leads to a carbon xerogel, CX-7-RC-1500-W, of increased micropore volume, with almost no contribution of mesopores, in comparison to the materials synthesized at P/C values of 50 and 800, most probably due to the presence of wide pores (>300 nm), or macropore-enriched structure. On the other hand, employing an acid catalyst—H
2SO
4—in the synthesis of these materials, see CX-5-H
2SO
4, results in faster gelation [
2], leading to a highly cross-linked and thus more dense structure which yields a completely microporous carbon material. Solvent type,
i.e., using acetone instead of water: compare CX-4-RC-50-Ac to CX-2-RF-50 , the latter synthesized using P/C = 50 and water as solvent, results in a more controlled evaporation due to lower surface tension of acetone in comparison to water. Moreover, most probably the presence of acetone in the media slows down the gelation rate yielding higher primary particle size less compact gel, to a much lesser extent, but having a similar effect than the increase in P/C ratio. The carbon xerogel synthesized using pyrogallol as precursor, instead of resorcinol, CX-8-Pyrogallol, possesses a poorly developed porous structure, as previously reported by El Mir
et al. [
21].
2.2. Influence of Synthesis Conditions in the Structural Properties of Carbon Xerogels
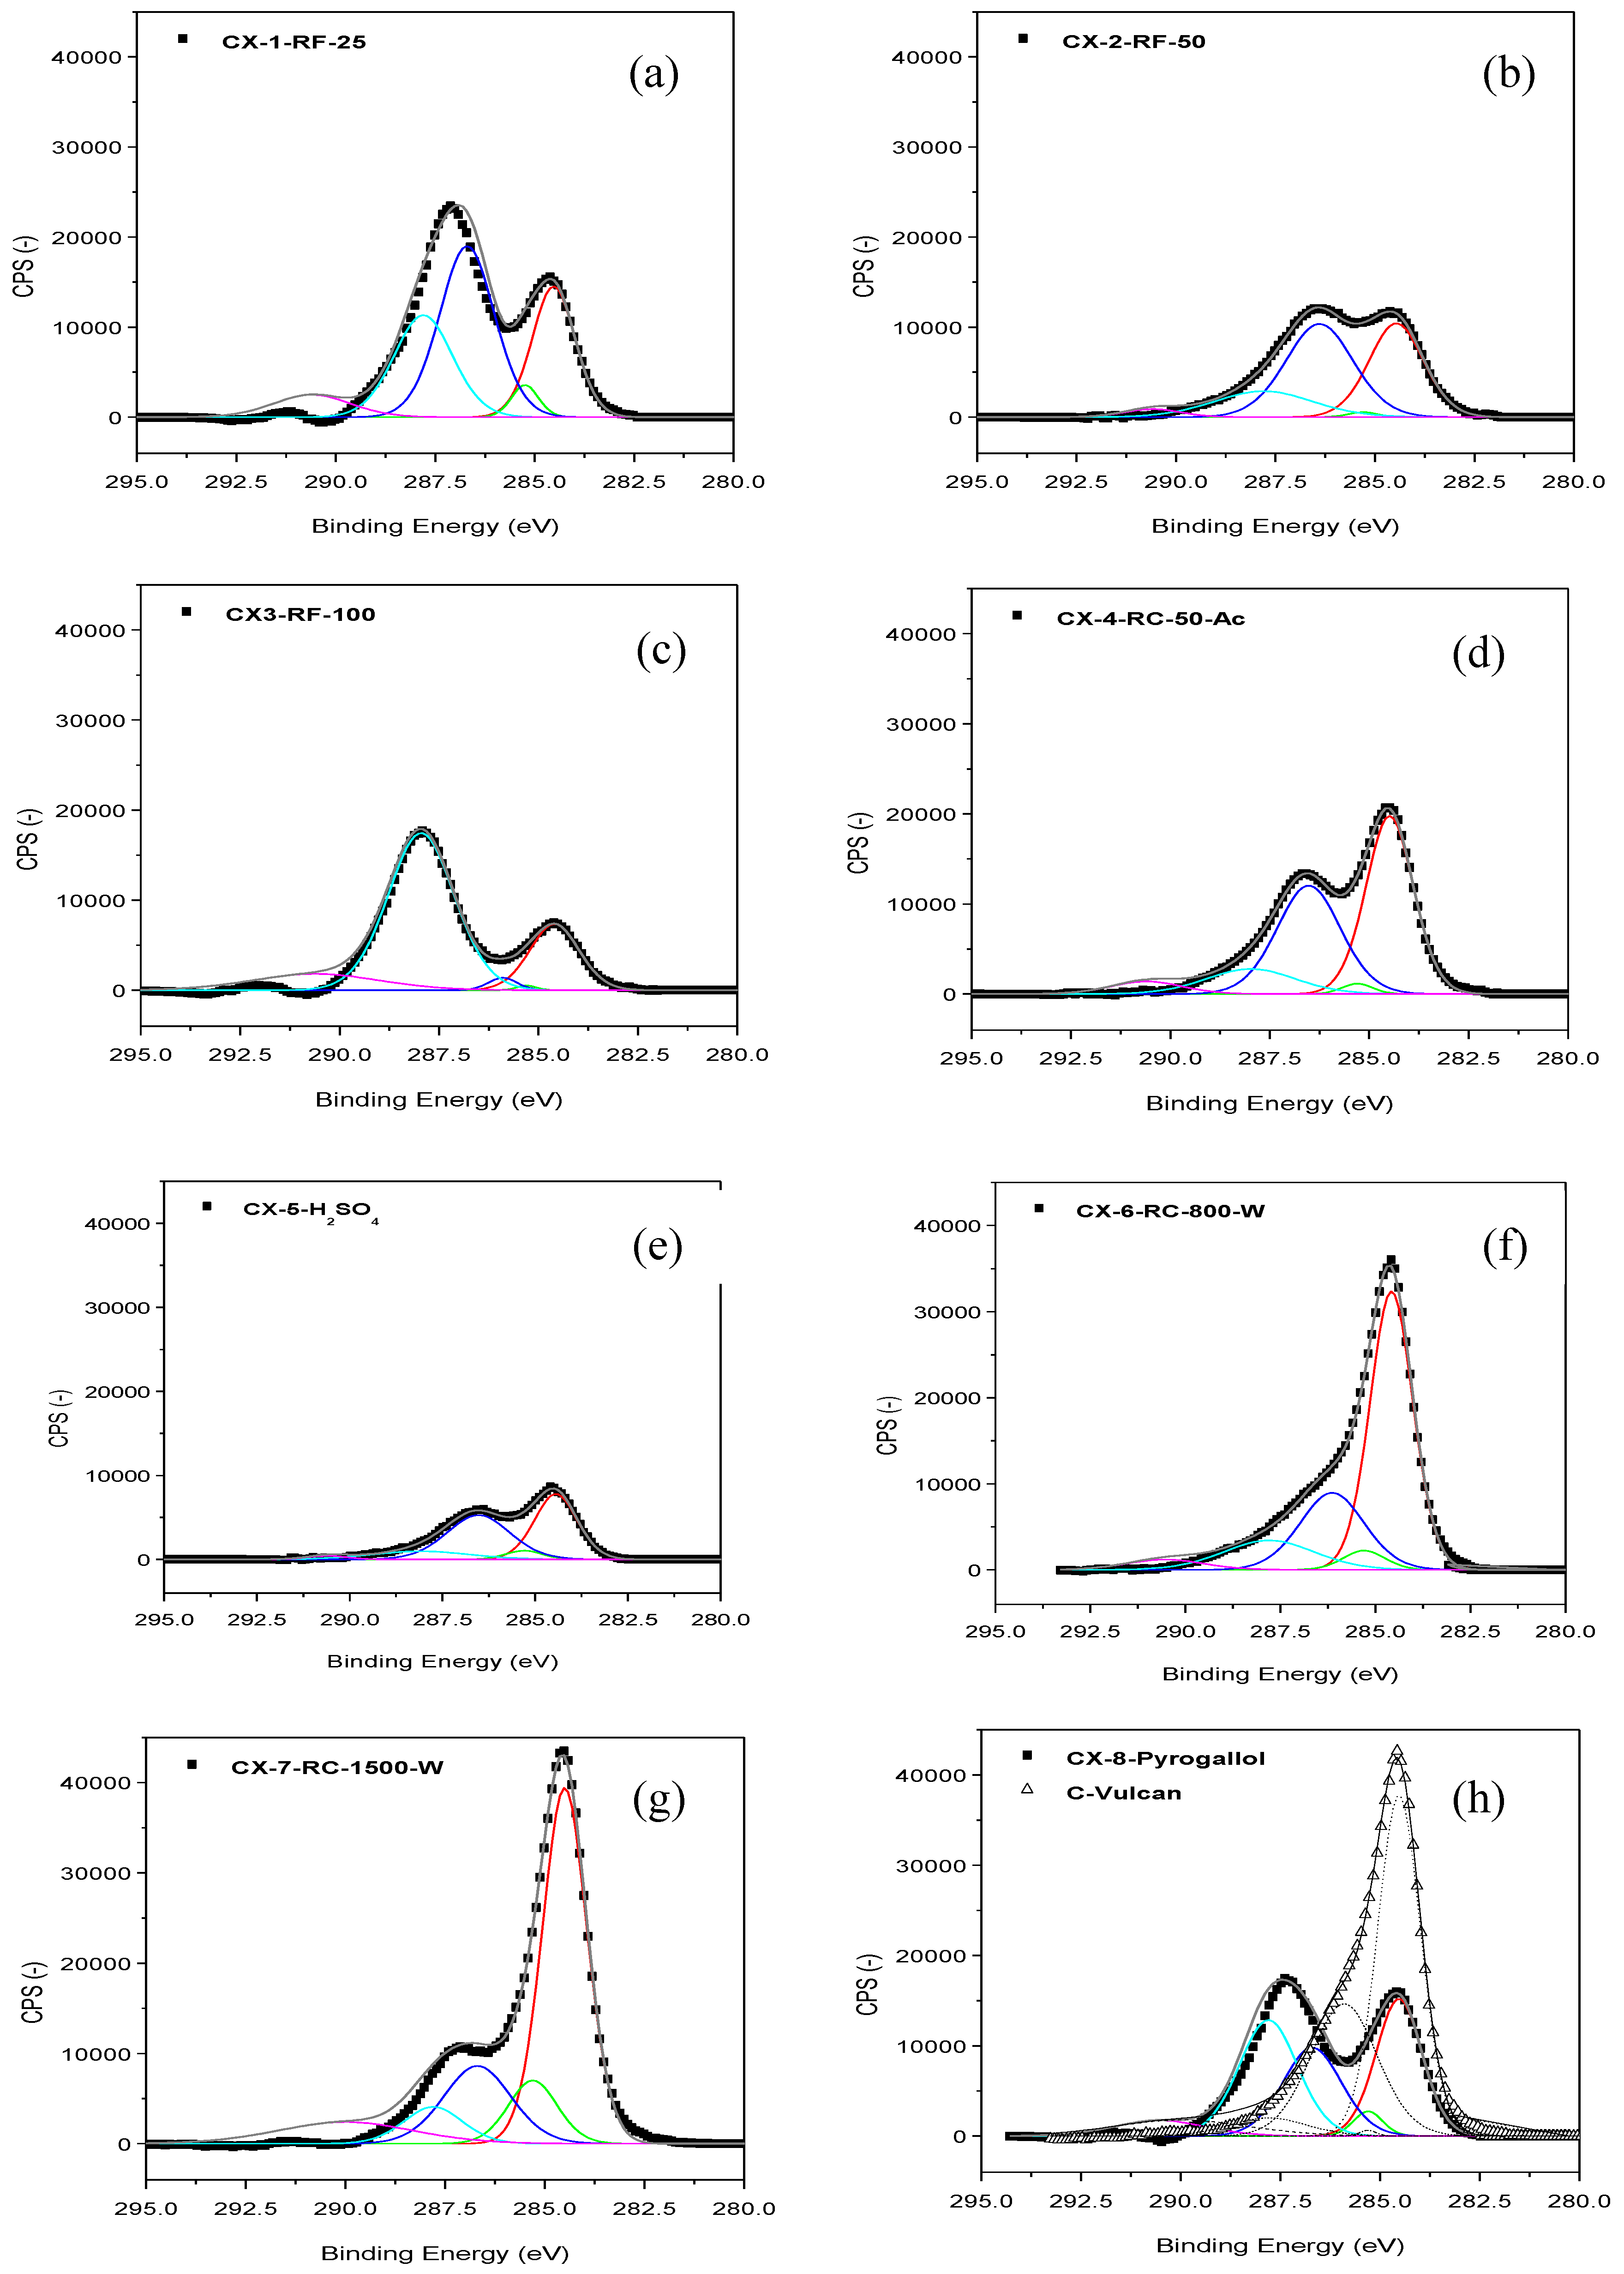
Figure 1 shows the C 1s band in the XPS spectra acquired for the different carbon xerogels prepared. These C 1s bands were deconvoluted into five components [
22]. The contribution at 284.5-284.6 eV can be ascribed to the presence of C-C bonds in graphitic carbon. A peak at
ca. 284.9-285.3 eV is related to the presence of defects in the graphitic structure of the carbon material. Whereas, peaks at
ca. 286.7 eV and 287.8 eV account for the presence of oxidized carbon, in the form of C-O and C=O species, respectively. Finally, a low intensity and broad band at
ca. 290 eV is traditionally attributed to π-π* transition characteristic of pure graphitic samples, sometimes considered as an indirect measure of the graphitic character of carbon blacks. Many differences can be observed at the sight of the C 1s bands shown in
Figure 1, which point to important dissimilarities among the prepared carbon materials, as a function of their particular synthesis conditions. In most cases, C-C peak at 284.5-284.6 eV is accompanied by a significant contribution corresponding to functionalized C; C-O and C=O peaks, in fact, generate a band which even appears as a separated peak, and not as a shoulder contribution to C-C signal, contrary to what could be expected in a relatively ordered carbon material, see for example
Figure 1 h, C 1s band for Vulcan carbon black. These contributions corresponding to functionalized C can be due to incomplete or too fast and random gelation of the organic gel mixture, due either to reactant excess, to excess catalysts or to the use of acidic catalysts, leading to the presence of an important fraction of non-polymerized material which upon pyrolysis is transformed into amorphous/disordered/defected carbon. In this sense, the amount of catalyst employed within the synthesis seems crucial. CX-6-RC-800-W and CX-7-RC-1500-W present C 1s bands with a marked C-C contribution, in comparison to CX-2-RF-50, moreover compared to CX-1-RF-25, CX-3-RF-100 or CX-5-H
2SO
4.
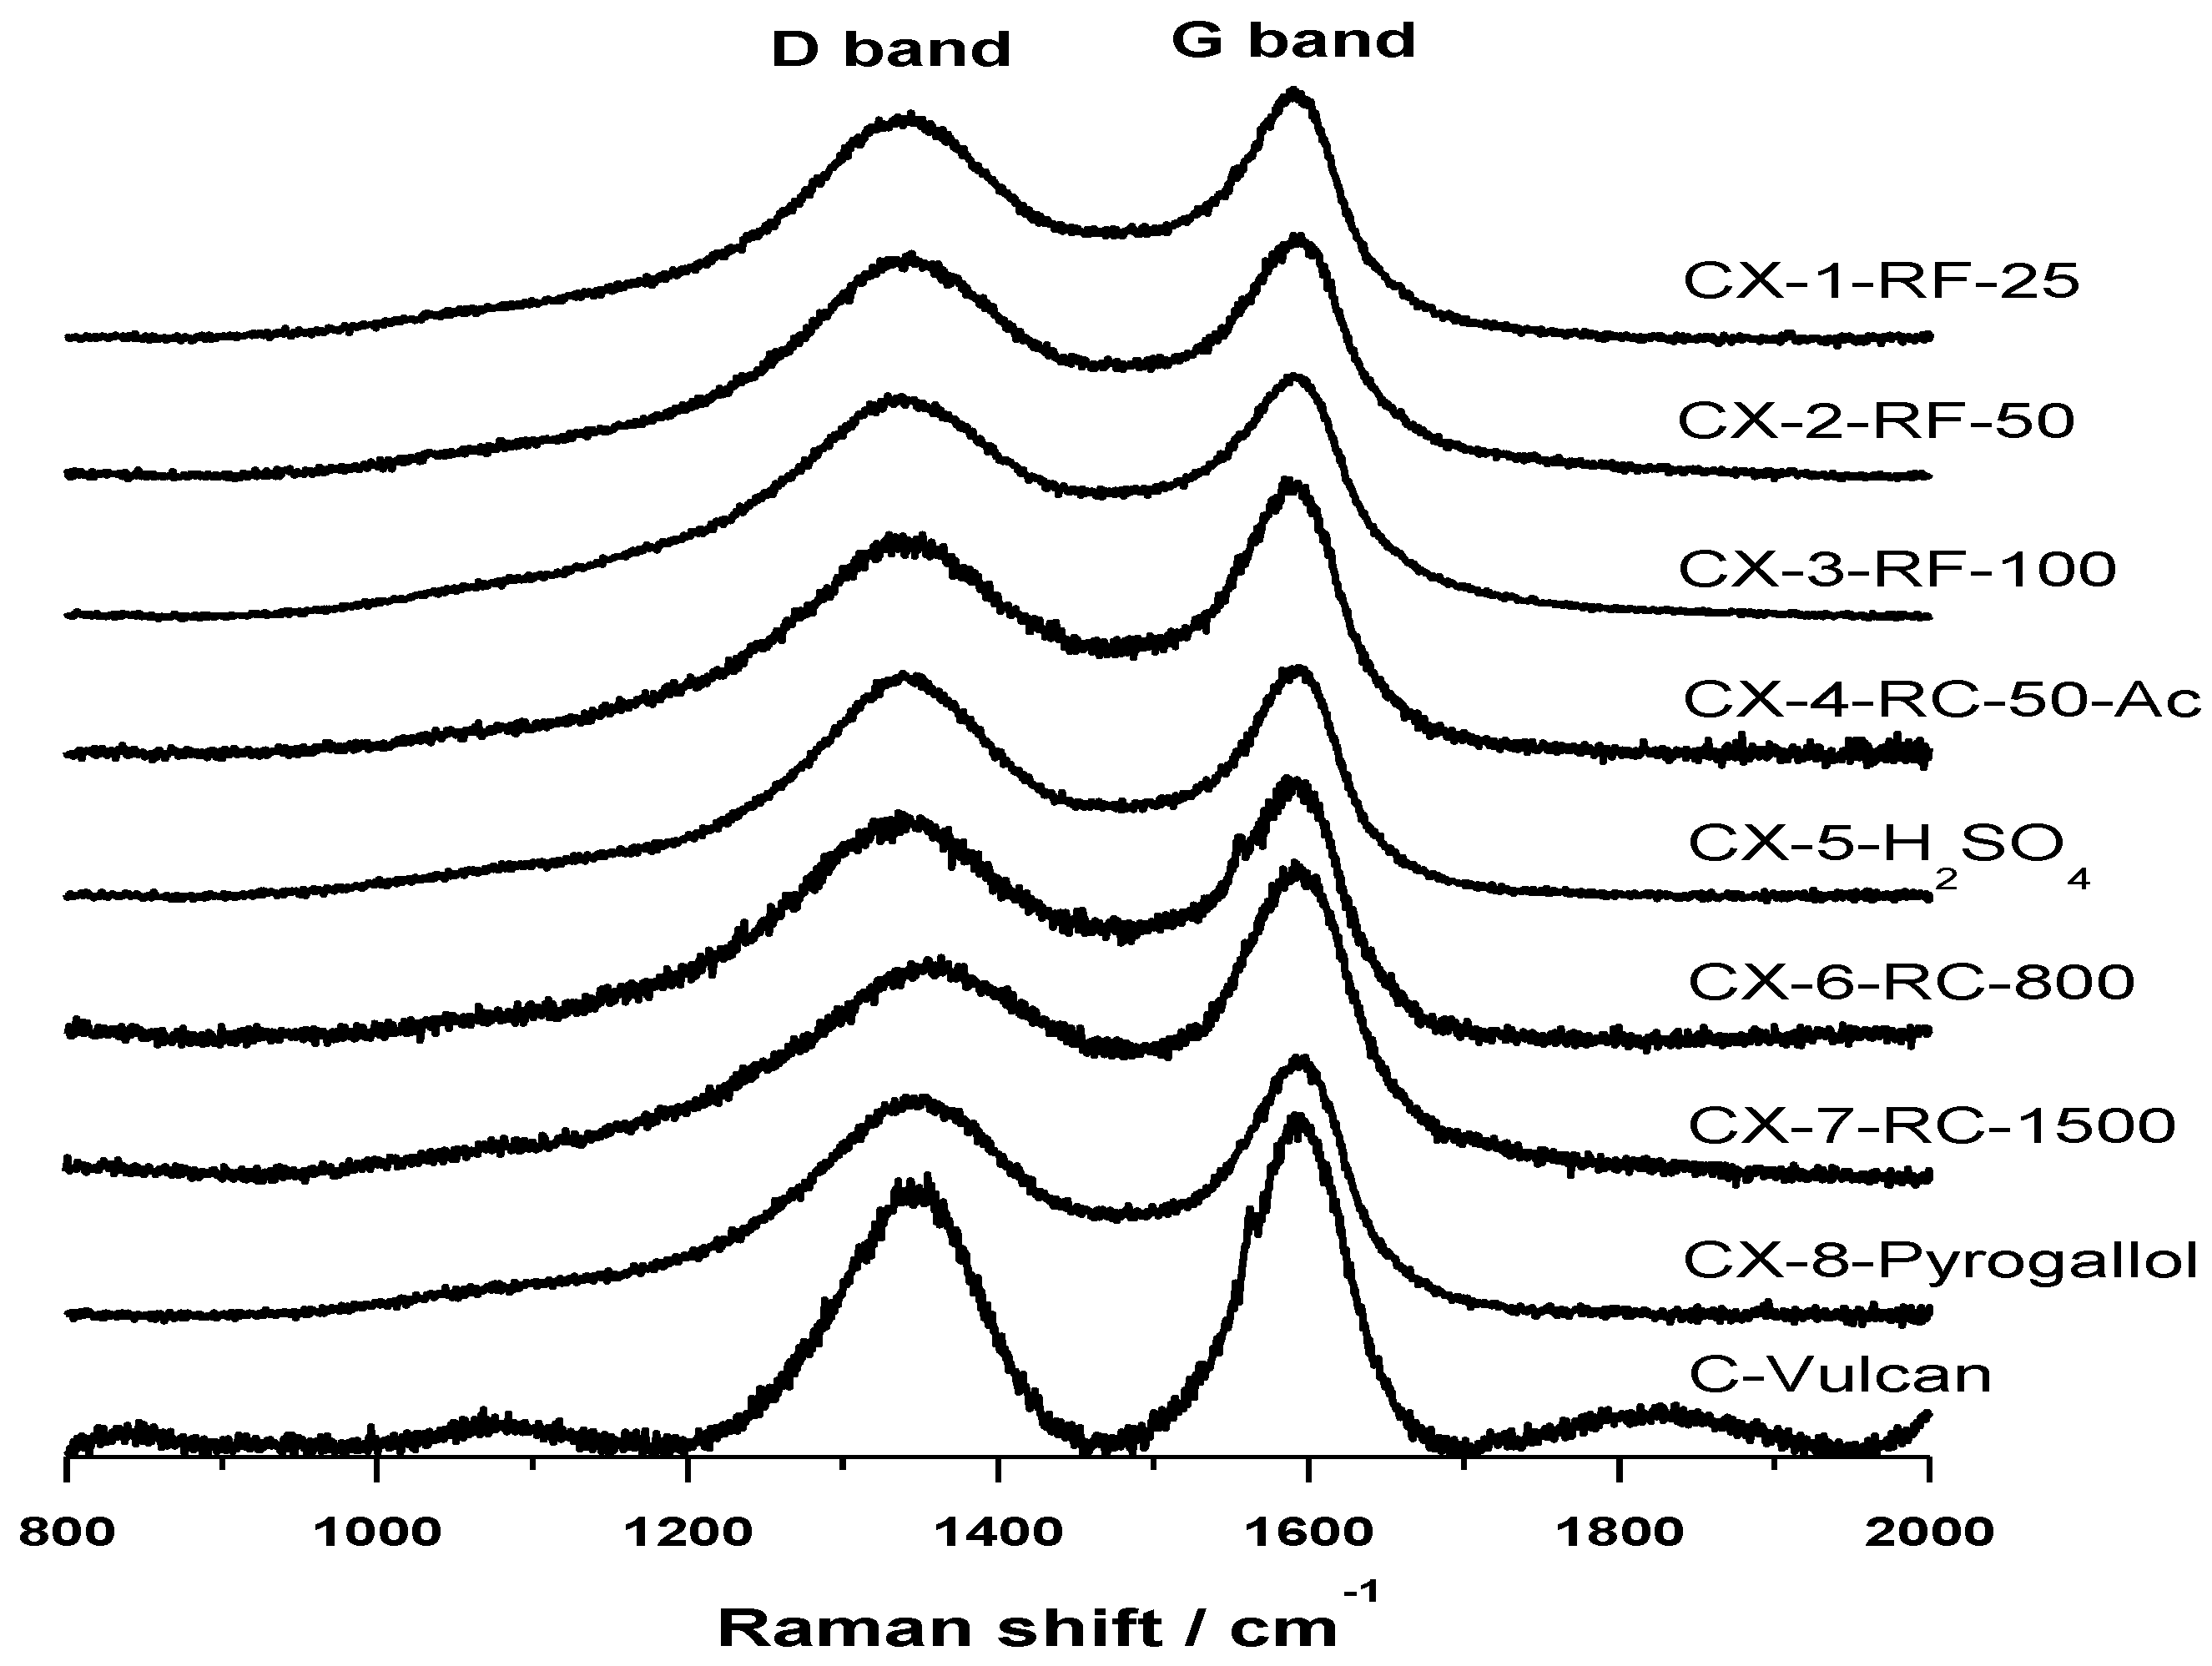
Raman spectra, shown in
Figure 2, confirm the results obtained in the deconvolution of XPS C 1s signal of the synthesized carbon materials. Raman spectroscopy is a well-known technique revealing short-range structural order changes in carbon materials. A Raman spectrum of perfect graphite shows a single narrow first order peak at 1580 cm
−1 known as G band, ascribed to the stretching of C–C bonds in the hexagonal rings [
23,
24]. However, in imperfect graphite, G band is usually accompanied by another band at about 1360 cm
−1 known as D band that has been normally associated to the presence of defects in the graphite structure, and thus known as “defect band”. The variation in the position, width and relative intensities of D and G bands in Raman spectra are therefore characteristic of structural differences in carbon materials. In this sense, it is well-known that the position of G band is shifted to higher frequencies, the width of D band increases and the intensity ratio
ID/
IG raises as the short-range structural order in graphite decreases. Spectra obtained for the various carbon xerogels considered in this work are presented in
Figure 2. All the carbon materials show a wide D band, whose intensity is relatively similar to that of G band, shifted in all cases to higher frequencies around 1585–1595 cm
−1. Relative intensity of these bands,
ID/
IG, is however lower for CX-4-RC-50-Ac and, more evidently, in the case of CX-6-RC-800-W and CX-7-RC-1500-W. The low amount of catalyst used in the synthesis of this two carbon materials resulted, as explained before, in slower gelation, less dense and lower cross-linked but highly polymerized organic gel, which upon pyrolysis yields a slightly more organized carbon material presenting a lower number of structural defects.
Figure 1.
XPS C 1s band and deconvolution for the different carbon xerogels prepared (a–h), and Vulcan carbon black (h).
Figure 1.
XPS C 1s band and deconvolution for the different carbon xerogels prepared (a–h), and Vulcan carbon black (h).
Figure 2.
Raman spectra acquired for the synthetized carbon xerogels and Vulcan carbon black.
Figure 2.
Raman spectra acquired for the synthetized carbon xerogels and Vulcan carbon black.
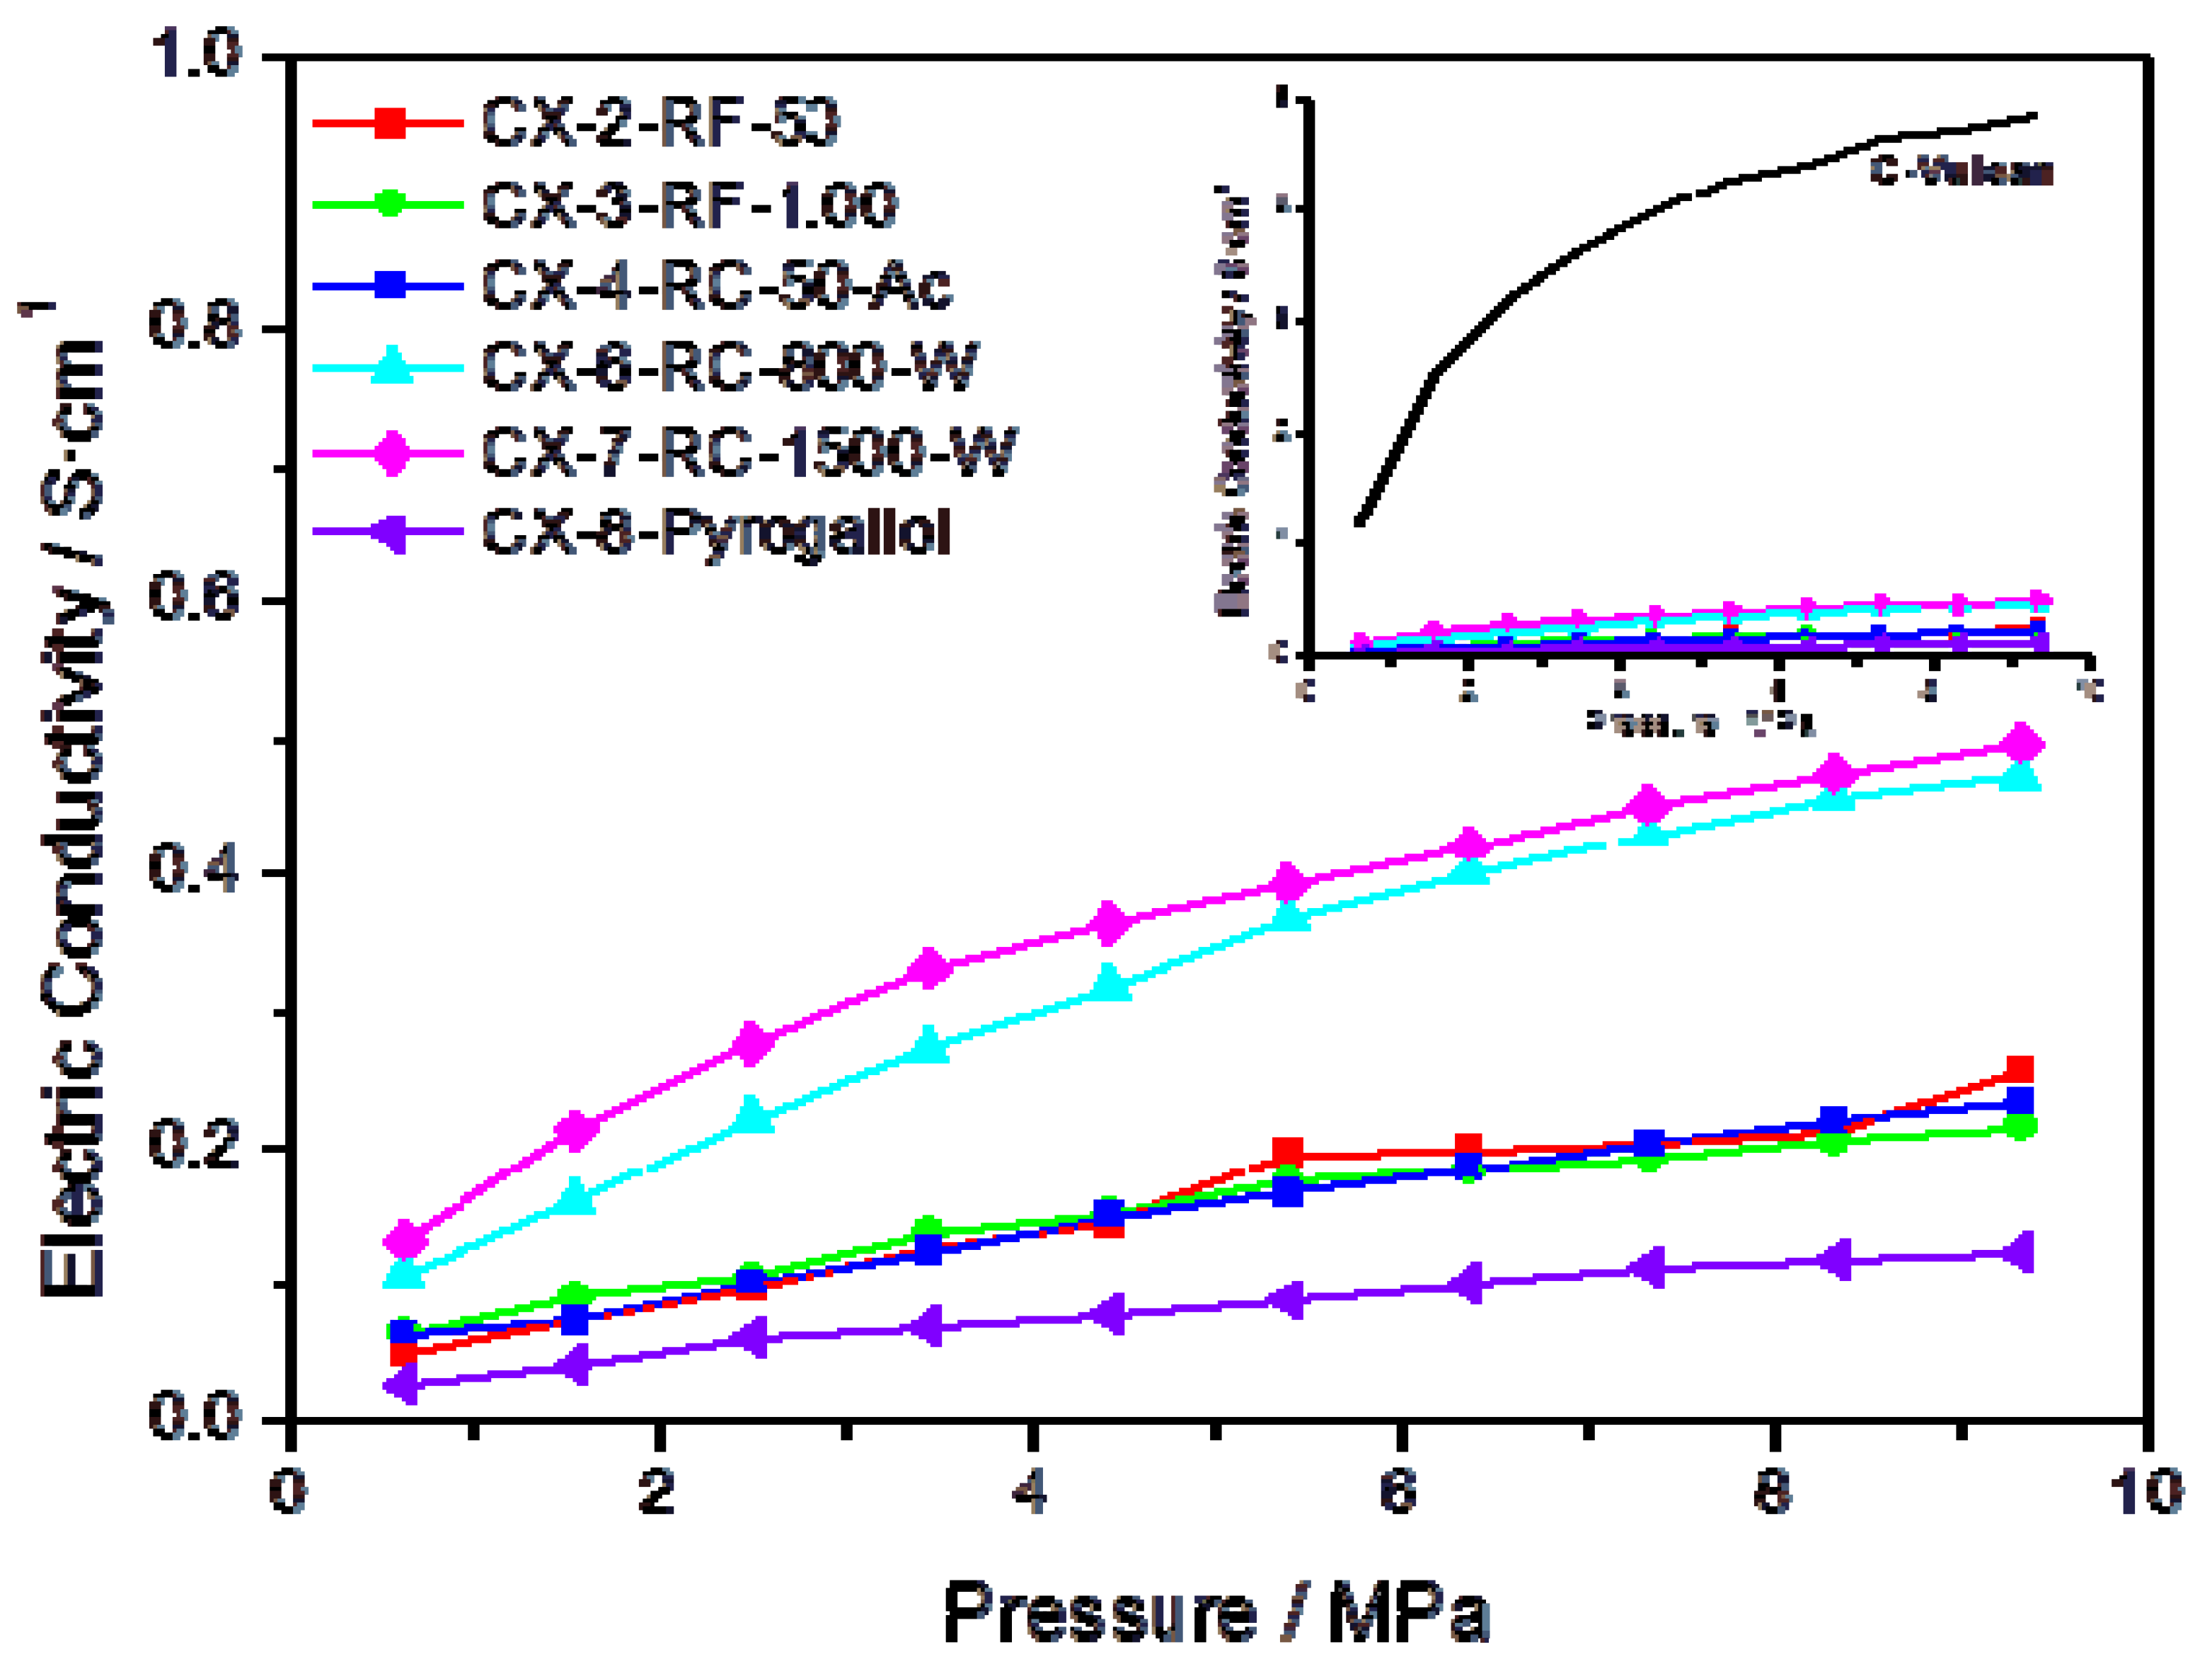
Further evidence on the higher degree of ordering in some of the synthesized materials can be gained through the measurement of their electrical conductivity.
Figure 3 presents the conductivity measured, as a function of the applied pressure, for several carbon xerogels synthesized under different conditions. In agreement with the results obtained in the characterization of these materials by means of XPS and Raman spectroscopy, carbons CX-6-RC-800-W and CX-7-RC-1500-W show higher conductivity within the pressure interval, pointing to a less defected structure. The inset in
Figure 3 plots the conductivity measured for Vulcan carbon black, compared to the synthetic carbon materials, evidencing much higher conductivity for this carbon black than for any of the synthesized carbon xerogels, due to its well-known highly ordered structure, both in terms of short and long range order.
Figure 3.
Electric conductivity vs. pressure for some of the prepared carbon xerogels; insert presents the conductivity of Vulcan carbon black as a function of the pressure, in comparison to the same series of carbon materials.
Figure 3.
Electric conductivity vs. pressure for some of the prepared carbon xerogels; insert presents the conductivity of Vulcan carbon black as a function of the pressure, in comparison to the same series of carbon materials.
2.4. Solid-State Characterization of Pt-Catalysts
The different carbon xerogels synthesized were used as Pt-catalysts supports, in order to evaluate the influence of the carbon material textural and structural properties in the electrochemical performance of these catalysts in the electrochemical oxygen reduction reaction (ORR).
Table 3 shows the results obtained in the textural characterization of the carbon xerogel and Vulcan carbon black supported Pt-catalysts. As previously described elsewhere [
25], Pt is deposited mostly on the mesoporous structure of the carbon materials. Therefore, an important decrease of mesopore volume can be observed in most cases, amounting to almost 45% loss of mesopore volume,
Vmeso BJH, in the case of CX-6-RC-800-W. It is worth noting that in the case of Pt/CX-7-RC-1500-W and contrary to what could be expected, mesopore volume increases from 0.04 to 0.21 cm
3 g
−1 upon Pt loading. This increase is due to partial blockage of wide mesopores or macropores reaching a size lower than 300 nm. To a lower extent, this can be as well observed for CX-4-RC-50-Ac and CX-8-Pyrogallol. Still, generally, most of the catalysts maintain an adequately developed porous structure after the deposition of the active phase, moreover in comparison with the analogous catalyst prepared using Vulcan carbon black as support.
XPS was used to identify the oxidation state of Pt on the surface of the different catalysts prepared. Pt 4f core level region was curve fitted to three sets of spin-orbital doublets, namely accounting for 4f
7/2 and 4f
5/2 peaks. Contributions at 71.4, 72.7 and 75.1 eV, and 74.8, 76.1 and 78.4 eV, were assigned to Pt
0, Pt
2+ (PtO) and Pt
4+ (PtO
2) oxidation states, respectively, based on the existing literature on XPS studies of carbon-based Pt and PtRu catalysts [
26,
27,
28]. Full-width at the half-maximum, FWHM, and relative intensities of such species are presented in
Table 4. For most catalysts, Pt
0 was found to be the predominant species on their surface. There is, however, an important contribution of oxidized Pt
2+, as well as of Pt
4+. Lower amount of Pt
0 can be found, according to XPS, in the catalysts prepared using the supports CX-1-RF-25, CX-2-RF-50 and CX-3-RF-100. The more difficult and less effective Pt deposition in such cases can be ascribed to the poorly developed and defect-full structure of these series of carbon materials, as well as to the increased presence of carboxylic groups on their surface. Surface chemistry must in fact play a decisive role during the impregnation process. Indeed, the catalyst prepared using the carbon xerogel CX-5-H
2SO
4, possessing the lower amount of carboxylic functionalities on its surface, see TPD deconvolution in
Table 2, presents an increased presence of reduced Pt, the highest of this series, 73.6%, in comparison to 43.5% determined for Pt/CX-3-RF-100.
Table 3.
BET surface area and pore volumes obtained from N2 adsorption isotherms for the Pt-catalysts prepared.
Table 3.
BET surface area and pore volumes obtained from N2 adsorption isotherms for the Pt-catalysts prepared.
| Carbon xerogel | SBET (m2 g−1) | Vmicro (cm3 g−1) | Vmeso BJH (cm3 g−1) | Vpore p/p0 ≈ 1 (cm3 g−1) | Mean pore size (nm) |
|---|
| Pt/CX-1-RF-25 | 476 | 0.08 | 0.76 | 0.84 | 10.9 |
| Pt/CX-2-RF-50 | 472 | 0.13 | 0.71 | 0.84 | 10.0 |
| Pt/CX-3-RF-100 | - | - | - | - | - |
| Pt/CX-4-RC-50-Ac | 306 | 0.14 | 0.18 | 0.33 | 11.6 |
| Pt/CX-5-H2SO4 | - | - | - | - | - |
| Pt/CX-6-RC-800-W | 380 | 0.14 | 0.94 | 1.08 | 23.5 |
| Pt/CX-7-RC-1500-W | 314 | 0.14 | 0.21 | 0.38 | 11.6 |
| Pt/CX-8-Pyrogallol | 116 | 0.06 | 0.03 | 0.10 | 23.2 |
| Pt/C-Vulcan | 173 | 0.03 | 0.35 | 0.38 | 11.9 |
Table 4.
Deconvolution of XPS Pt 4f7/2 signal for the different catalysts prepared.
Table 4.
Deconvolution of XPS Pt 4f7/2 signal for the different catalysts prepared.
| Catalyst | Pt 4f7/2 |
|---|
| Species | B.E. (eV) | FWHM (eV) | Intensity (%) |
|---|
| Pt/CX-1-RF-25 | Pt | 71.4 | 1.5 | 48.0 |
| PtO | 72.8 | 2.4 | 41.2 |
| PtO2 | 75.1 | 3.2 | 10.8 |
| Pt/CX-2-RF-50 | Pt | 71.3 | 1.5 | 40.1 |
| PtO | 72.9 | 2.4 | 45.3 |
| PtO2 | 75.0 | 3.2 | 14.6 |
| Pt/CX-3-RF-100 | Pt | 71.3 | 1.5 | 43.5 |
| PtO | 72.9 | 2.4 | 33.2 |
| PtO2 | 75.0 | 3.2 | 23.3 |
| Pt/CX-4-RC-50-Ac | Pt | 71.4 | 1.5 | 57.8 |
| PtO | 72.7 | 2.4 | 37.6 |
| PtO2 | 75.1 | 3.2 | 4.6 |
| Pt/CX-5-H2SO4 | Pt | 71.4 | 1.5 | 73.6 |
| PtO | 72.7 | 2.5 | 22.8 |
| PtO2 | 75.0 | 3.2 | 3.6 |
| Pt/CX-6-RC-800-W | Pt | 71.5 | 1.5 | 65.6 |
| PtO | 72.7 | 2.4 | 26.8 |
| PtO2 | 75.1 | 3.1 | 7.6 |
| Pt/CX-7-RC-1500-W | Pt | 71.5 | 1.5 | 66.8 |
| PtO | 72.7 | 2.4 | 16.3 |
| PtO2 | 75.1 | 3.1 | 16.9 |
| Pt/CX-8-Pyrogallol | Pt | 71.5 | 1.5 | 66.6 |
| PtO | 72.7 | 2.4 | 30.2 |
| PtO2 | 75.1 | 3.1 | 3.2 |
| Pt/C-Vulcan | Pt | 71.5 | 1.5 | 59.2 |
| PtO | 72.7 | 2.4 | 27.9 |
| PtO2 | 75.1 | 3.1 | 12.9 |
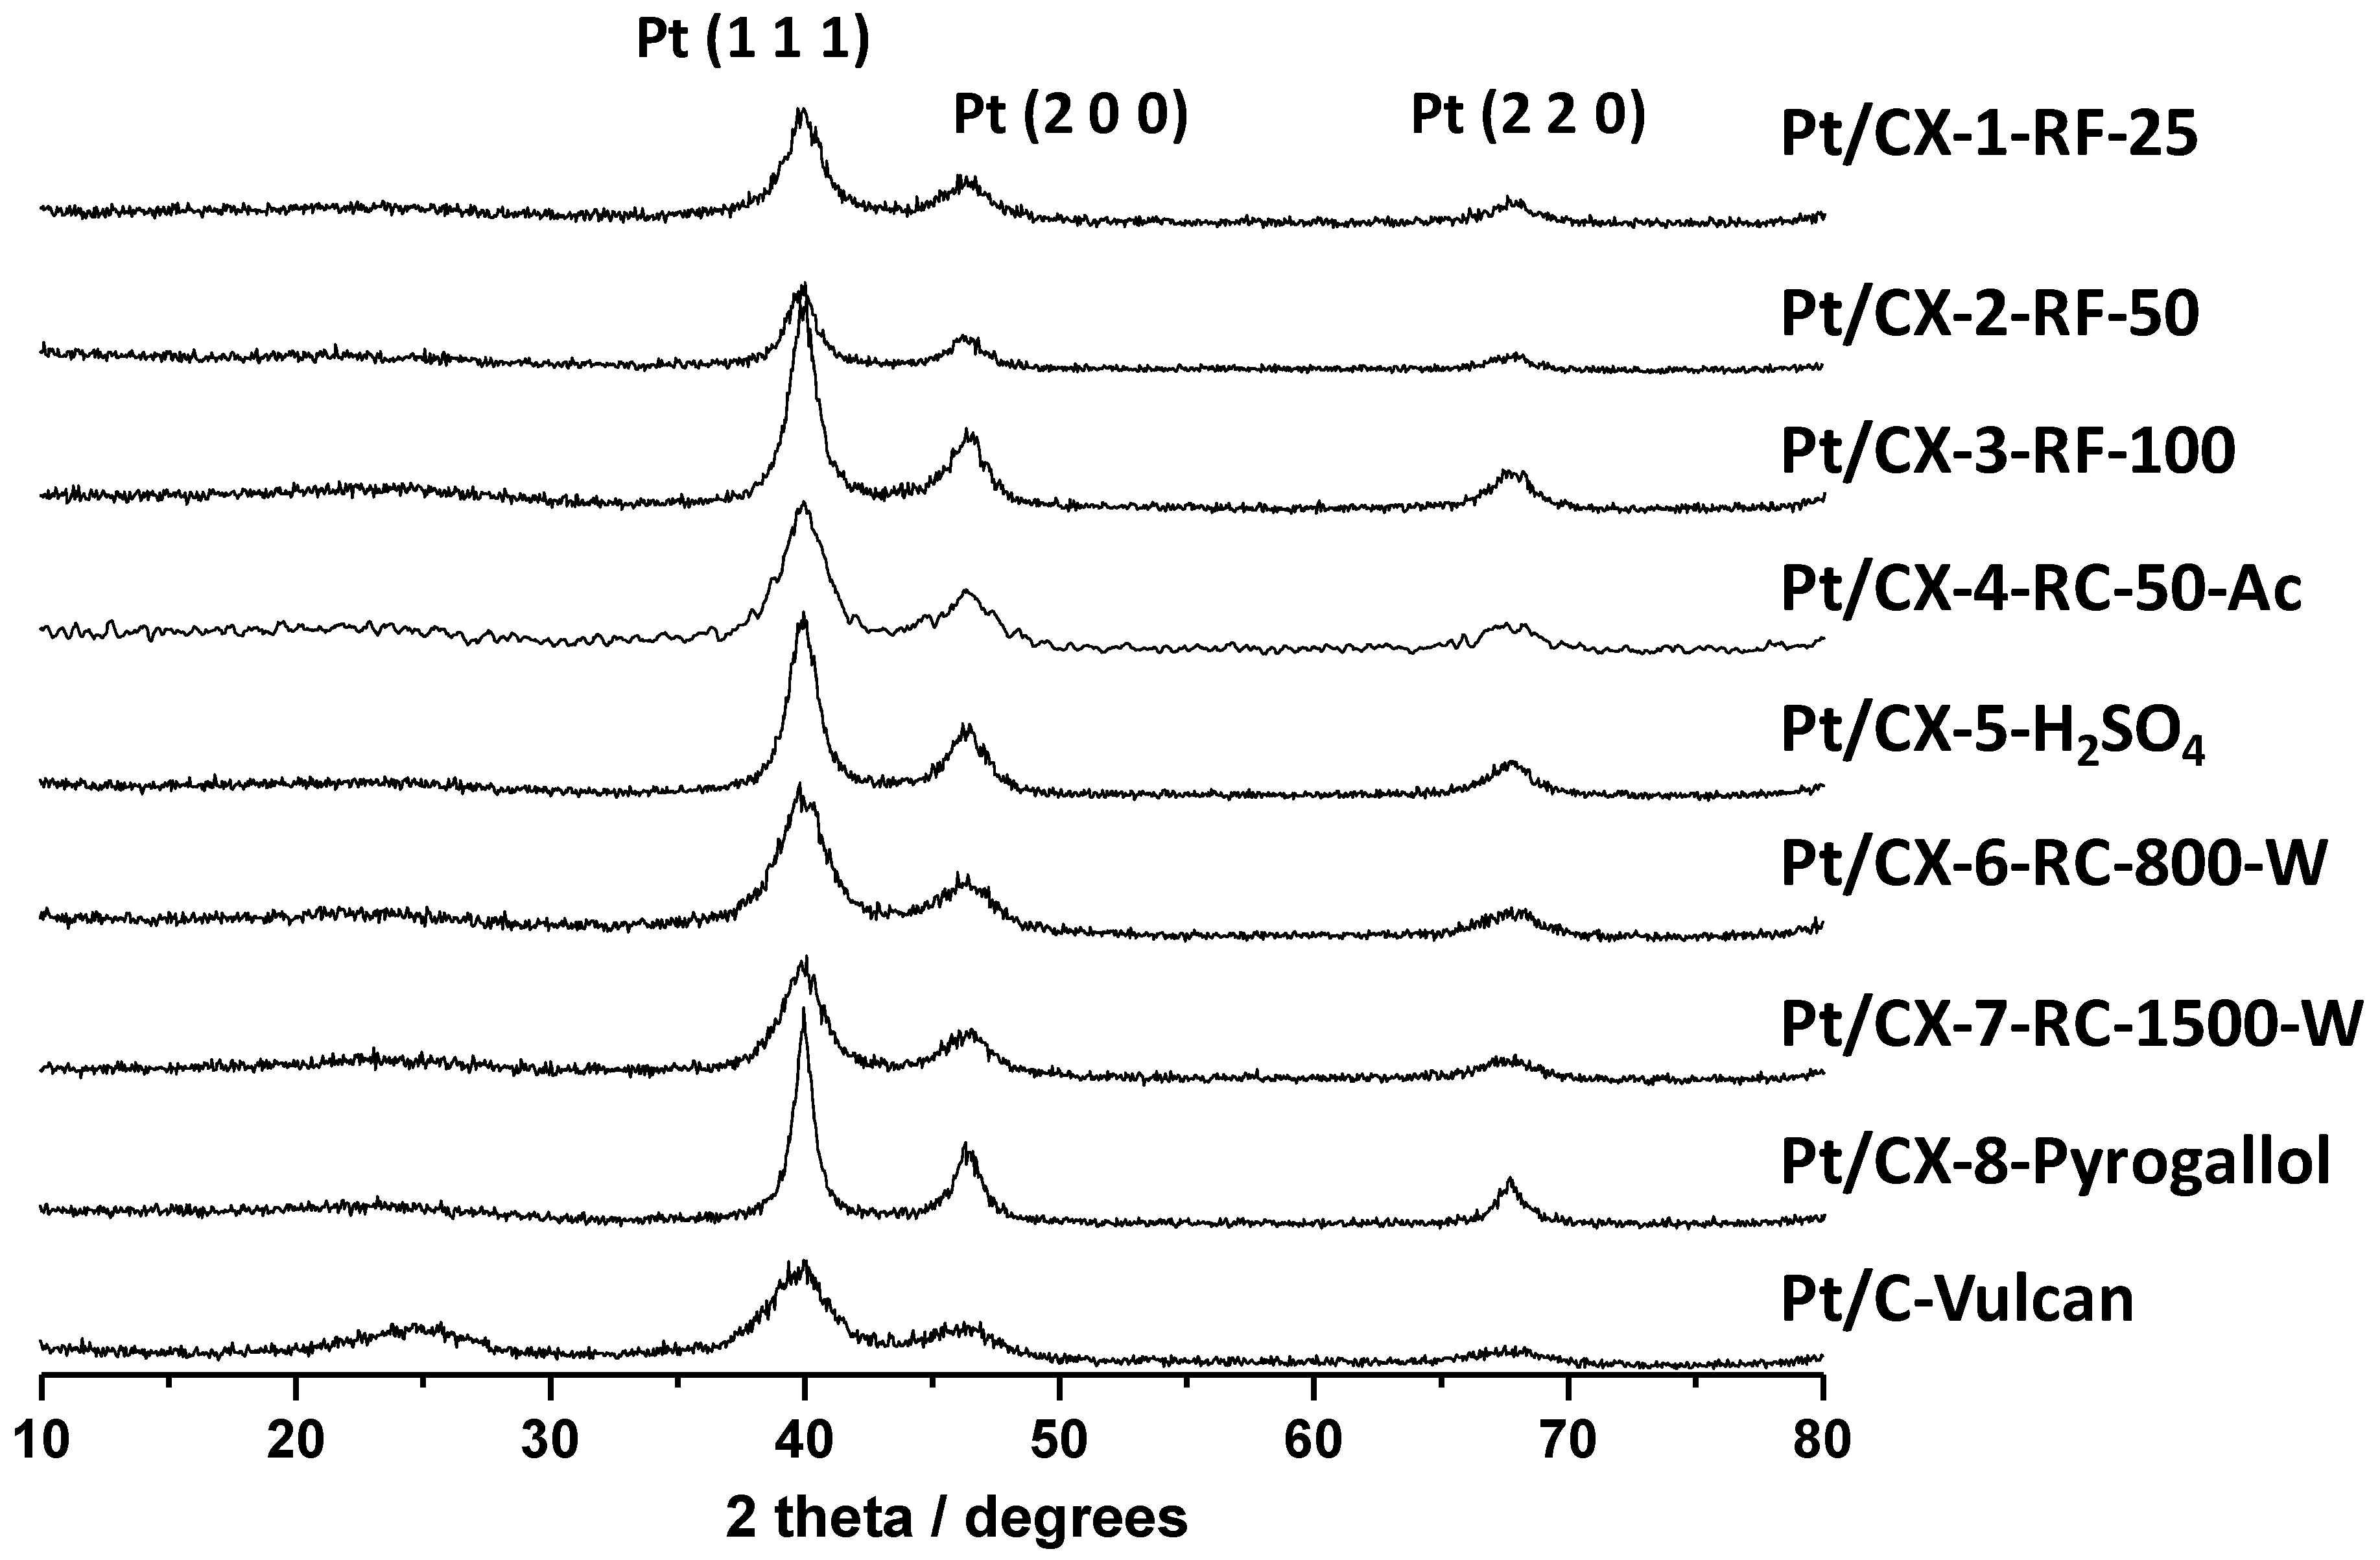
X-ray diffraction patterns of the various catalysts are shown in
Figure 4. Platinum showed face centered cubic structure. Pt crystal sizes were calculated from the Pt (220) peak broadening and applying the Scherrer’s equation, and the values are reported in
Table 5. Small Pt particles of about 3.5 nm were obtained for the catalysts based on CX-4-RC-50-Ac, CX-6-RC-800-W and CX-7-RC-1500-W, this is, the carbon xerogels characterized by stoichiometric resorcinol/formaldehyde ratio. The rest of supports gave place to higher Pt crystal sizes of
ca. 5 nm, and even higher in the case of the carbon xerogel based on pyrogallol as precursor (8.4 nm). It must be pointed out here that the platinum concentration was the same for all these catalysts, as determined by ICP-AES, evidencing that the differences encountered in crystal size may not be ascribed to different platinum loadings. Moreover, neither the BET surface area of the support nor the surface oxygen content explains this trend of Pt particle size. It must then be interpreted in terms of surface morphology and defects. It is well known that platinum nucleation and growth takes place preferentially at defect carbon sites [
29]. Pt crystals became bigger in the case of carbon xerogel supports based on a higher density of defects, as evidenced by weaker C-C signal in C 1s XPS band and higher values of
ID/
IG determined by Raman spectroscopy, pointing to lower extent of polymerization resulting in a less ordered gel structure. The Pt crystal size for Vulcan carbon-black supported catalysts is also small and accordingly similar to those carbon xerogels with a low density of defects,
i.e., CX-4-RC-50-Ac, CX-6-RC-800-W and CX-7-RC-1500-W.
According to the Pt crystal size of these catalysts, a selection was considered to investigate the electrochemical activity towards the oxygen reduction reaction (ORR). This reaction is governed by the Pt crystal size, showing a volcano-shaped curved with a maximum at approximately 3 nm, as demonstrated by Kinoshita [
30]. For this reason, the catalysts showing a Pt crystal size close to 3.5 nm were chosen, this is, those based on CX-4-RC-50-Ac, CX-6-RC-800-W and CX-7-RC-1500-W supports as well as Vulcan carbon black-based catalyst.
Figure 4.
Diffractograms obtained by XRD for the synthesized Pt catalysts.
Figure 4.
Diffractograms obtained by XRD for the synthesized Pt catalysts.
Table 5.
Ptcrystal size obtained by XRD and Pt concentration in the synthesized catalysts.
Table 5.
Ptcrystal size obtained by XRD and Pt concentration in the synthesized catalysts.
| Catalyst | Crystal size (nm) | % wt. metal concentration |
|---|
| Pt/CX-1-RF-25 | 5.1 | 19.9 |
| Pt/CX-2-RF-50 | 5.3 | 16.9 |
| Pt/CX-3-RF-100 | 5.2 | 15.8 |
| Pt/CX-4-RC-50-Ac | 3.6 | 20.5 |
| Pt/CX-5-H2SO4 | 5.2 | 23.5 |
| Pt/CX-6-RC-800-W | 3.6 | 17.9 |
| Pt/CX-7-RC-1500-W | 3.7 | 18.6 |
| Pt/CX-8-Pyrogallol | 8.4 | 21.7 |
| Pt/C-Vulcan | 3.4 | 16.7 |
2.5. Catalytic Activity towards ORR and Durability Tests
The catalytic activity towards the oxygen reduction reaction (ORR) was determined by polarization curves for the selected catalysts in a half-cell system under a continuous flow of pure oxygen, using 0.5 M sulfuric acid as electrolyte and at 25 °C.
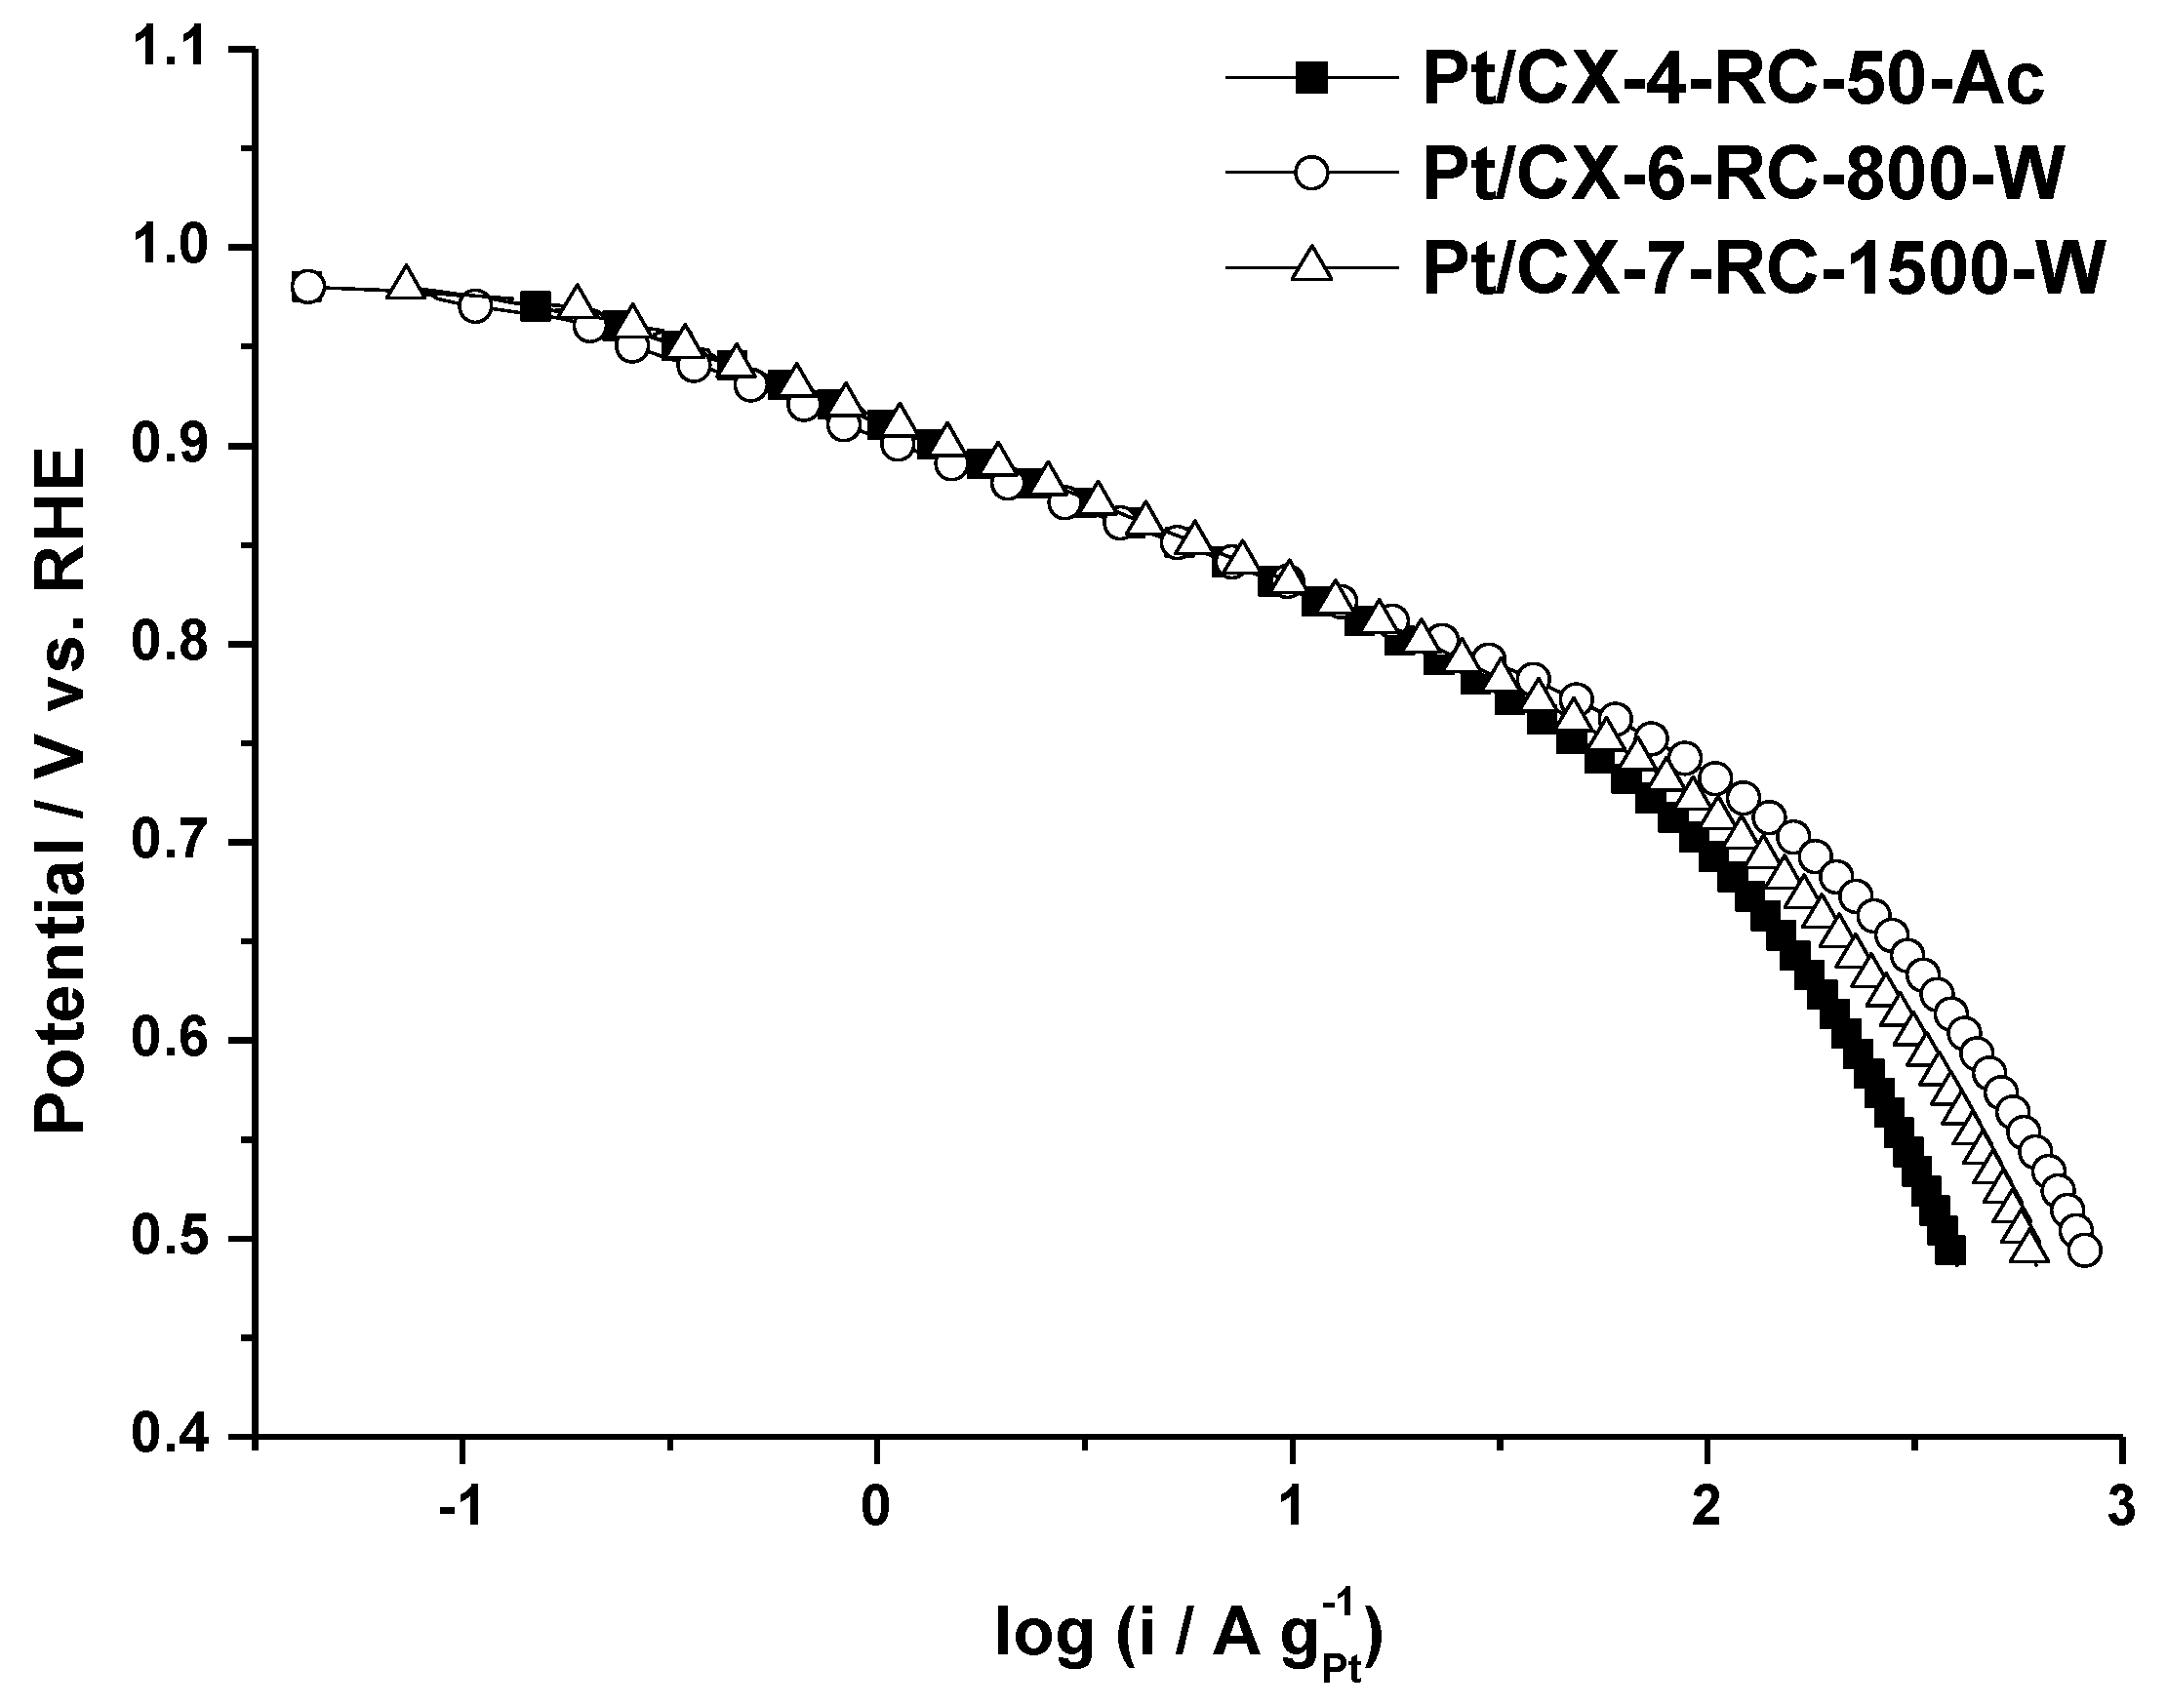
Figure 5 shows the polarization curves obtained for the three selected carbon xerogel based catalysts. It is worth to mention that the three of them present a very similar slope in the low current density region, this is, the activation controlled part of the polarization curve, although the catalytic activity at a determined potential value is maximized for the catalyst based on CX-6-RC-800-W. Similar slopes indicate that the oxygen adsorption mechanism is essentially the same, corresponding to a Temkin type adsorption process, according to the values calculated from Tafel plots (approx. 70–80 mV dec
−1), removing the contribution of ohmic drop. This electrokinetic parameter evidences the similar Pt particle size of approx. 3.6 nm and appropriate nanoparticles dispersion. Slight differences encountered at low current density are more evident at high current density (higher overpotential). The catalyst with the highest mass activity (A g
−1Pt) is the one based on CX-6-RC-800W, this is, the one based on xerogels with a high porosity development (
Table 3). This support is characterized by a wide pore size (23.5 nm) in comparison with the other xerogels (11.6 nm) and the commercial support (11.9 nm) and also a high mesopore volume (0.94 cm
3 g
−1). These results highlight the importance of support morphology and porosity on the electrochemical activity, which may result a key parameter for the operation in a fuel cell cathode [
5,
6].
Figure 5.
Polarization curves obtained in gas diffusion electrode, 0.5 M H2SO4 electrolyte, feeding pure oxygen to the backing layer and at 25 °C.
Figure 5.
Polarization curves obtained in gas diffusion electrode, 0.5 M H2SO4 electrolyte, feeding pure oxygen to the backing layer and at 25 °C.
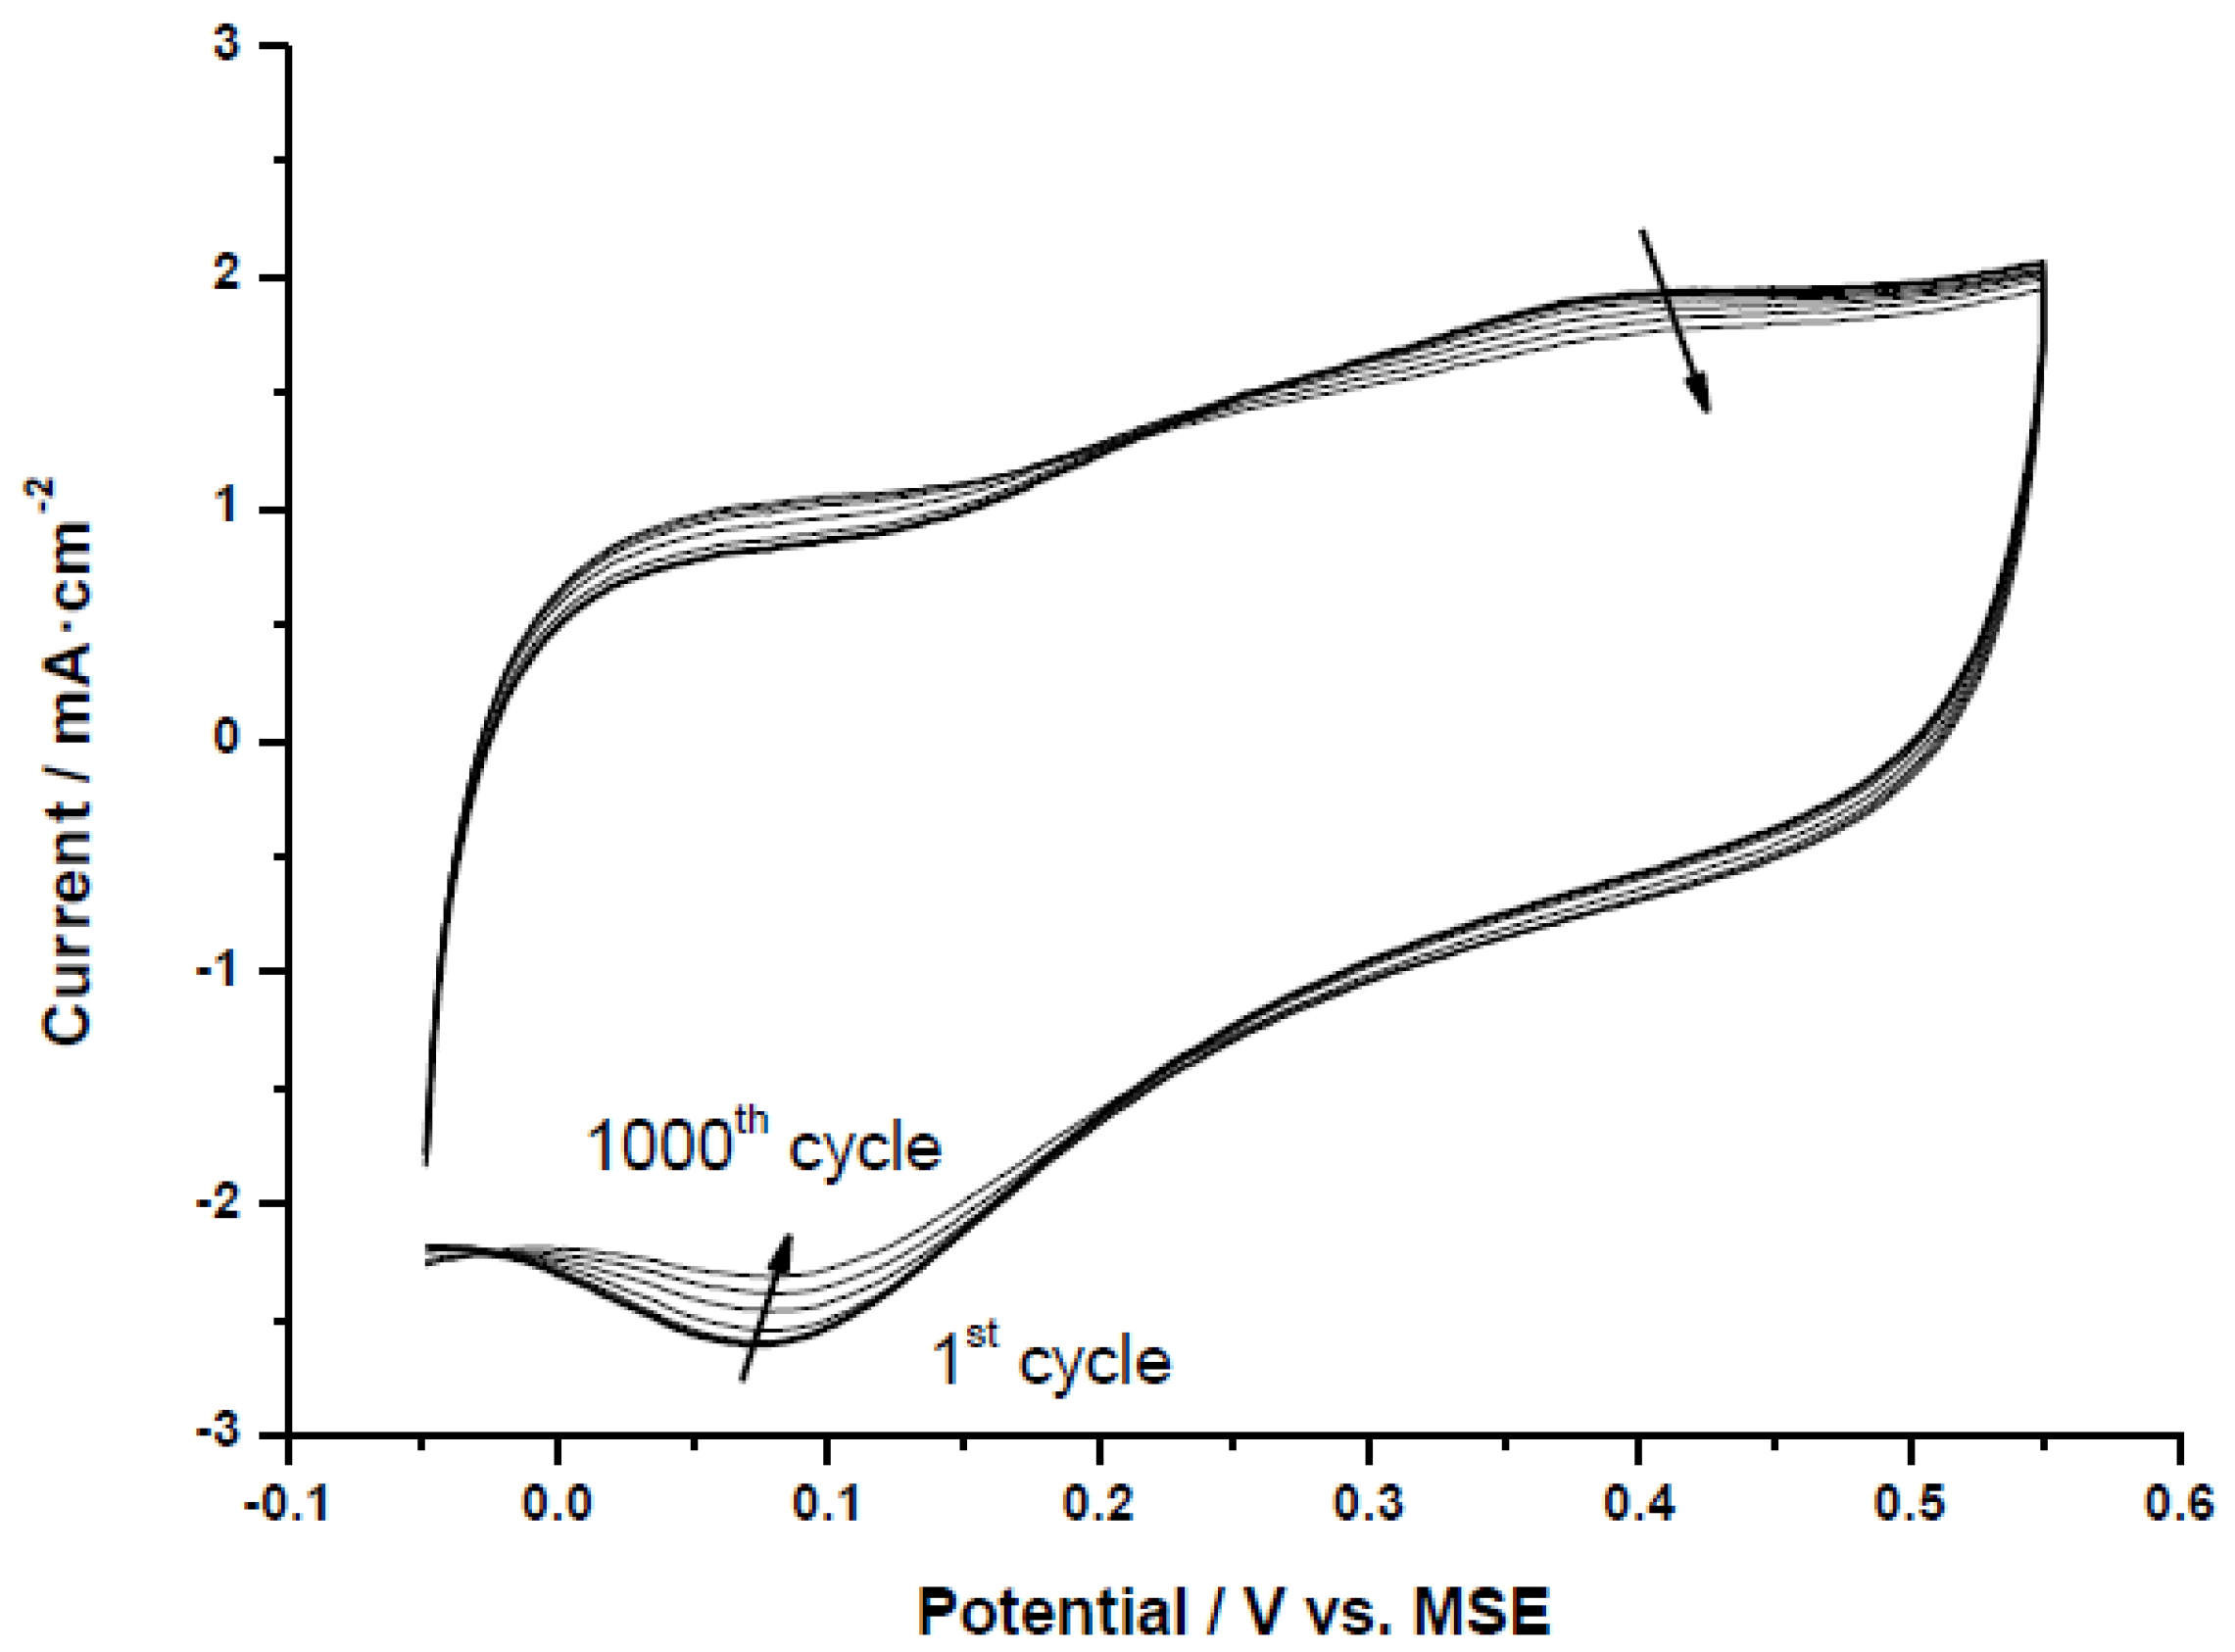
The selected Pt-catalysts were subjected to an accelerated test procedure to evaluate catalyst stability under potential cycling conditions.
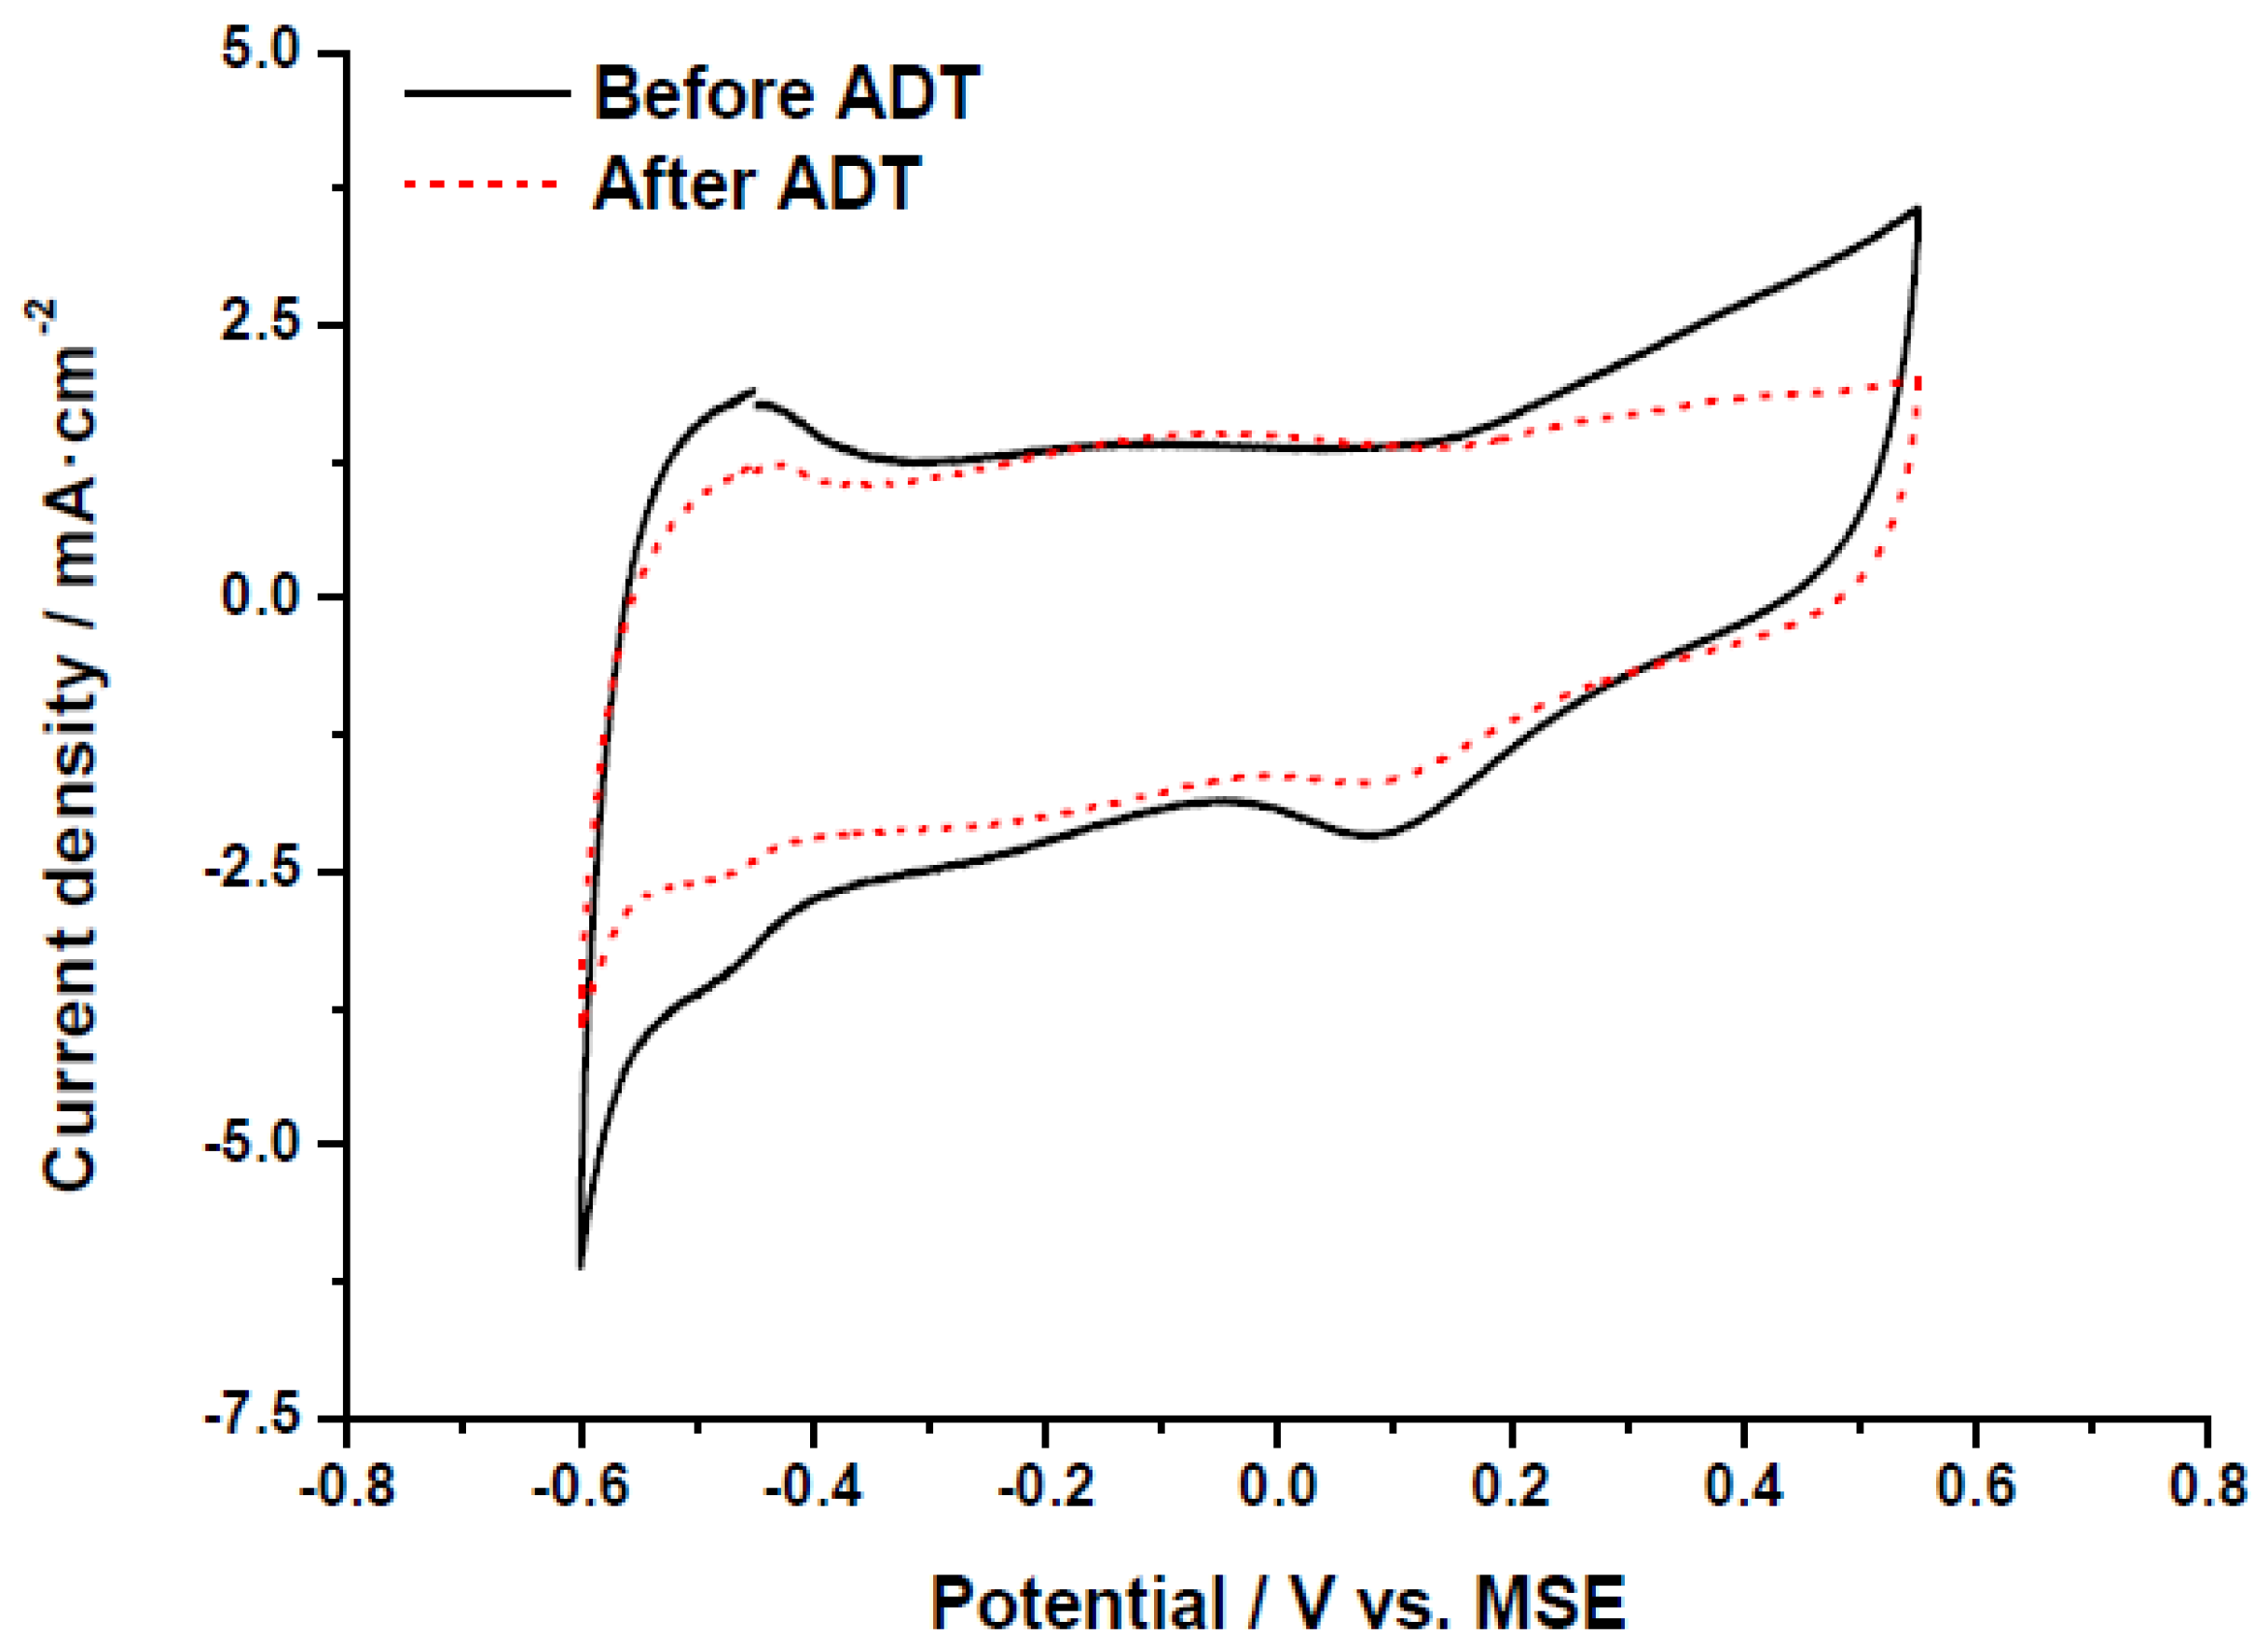
Figure 6 shows an example of accelerated degradation test (ADT) for the catalyst Pt/CX-4-RC-50-Ac. All the electrodes followed the same trend and are not included for simplicity. It can be clearly observed how the oxygen reduction peak (negative current peak at around 0.07 V
vs. MSE) shifts to higher potentials and decreases in intensity during the cycling process (from the first cycle to the 1000th cycle as indicated by the arrows). This can be attributed to an increase of particle size with the consequent reduction of the electrochemically active surface area (ECSA), and an increase of the specific (or intrinsic) activity for oxygen reduction, as observed by Aricò and co-workers [
31]. The decrease of the electrochemically active surface area is also evidenced in the cyclic voltammograms recorded at room temperature in 0.5 M H
2SO
4, represented in
Figure 7. The hydrogen adsorption-desorption region, this is, the response at potentials between −0.60 and −0.40 V
vs. MSE, clearly shows the change in the ECSA after the accelerated degradation test. It must be noted that as carbon xerogels present a relatively high BET surface area, the contribution of the double layer capacitance to current values is significantly higher than that commonly obtained for carbon blacks with an approximately two-fold lower BET surface area. The appearance of a small oxidation-reduction response (−0.30 to +0.05 V
vs. MSE) suggests the formation of oxygen groups on the surface of carbon support, which also indicates that the catalyst stability may be influenced not only by the Pt particle growth (presumably due to Ostwald ripening mechanism) but also by the corrosion of carbon support, which may lead to Pt particles instability. To individuate the contribution of both main degradation phenomena (Pt growth and carbon corrosion), XRD analysis may indicate the Pt crystal size growth, but the total amount of Pt in the corroded area of the electrodes is not high enough (less than 20 µg) to obtain reliable results. Future works with larger electrode areas will be performed to identify the degradation mechanisms.
Figure 6.
Accelerated Pt degradation test by potential cycling for Pt/CX-4-RC-50-Ac, 1000 cycles in 0.5 M H2SO4 at room temperature.
Figure 6.
Accelerated Pt degradation test by potential cycling for Pt/CX-4-RC-50-Ac, 1000 cycles in 0.5 M H2SO4 at room temperature.
Figure 7.
Cyclic voltammetry (half-cell, nitrogen fed, 0.5 M H2SO4, 25 °C) before and after accelerated degradation tests (ADT) for the catalyst Pt/CX-4-RC-50-Ac.
Figure 7.
Cyclic voltammetry (half-cell, nitrogen fed, 0.5 M H2SO4, 25 °C) before and after accelerated degradation tests (ADT) for the catalyst Pt/CX-4-RC-50-Ac.
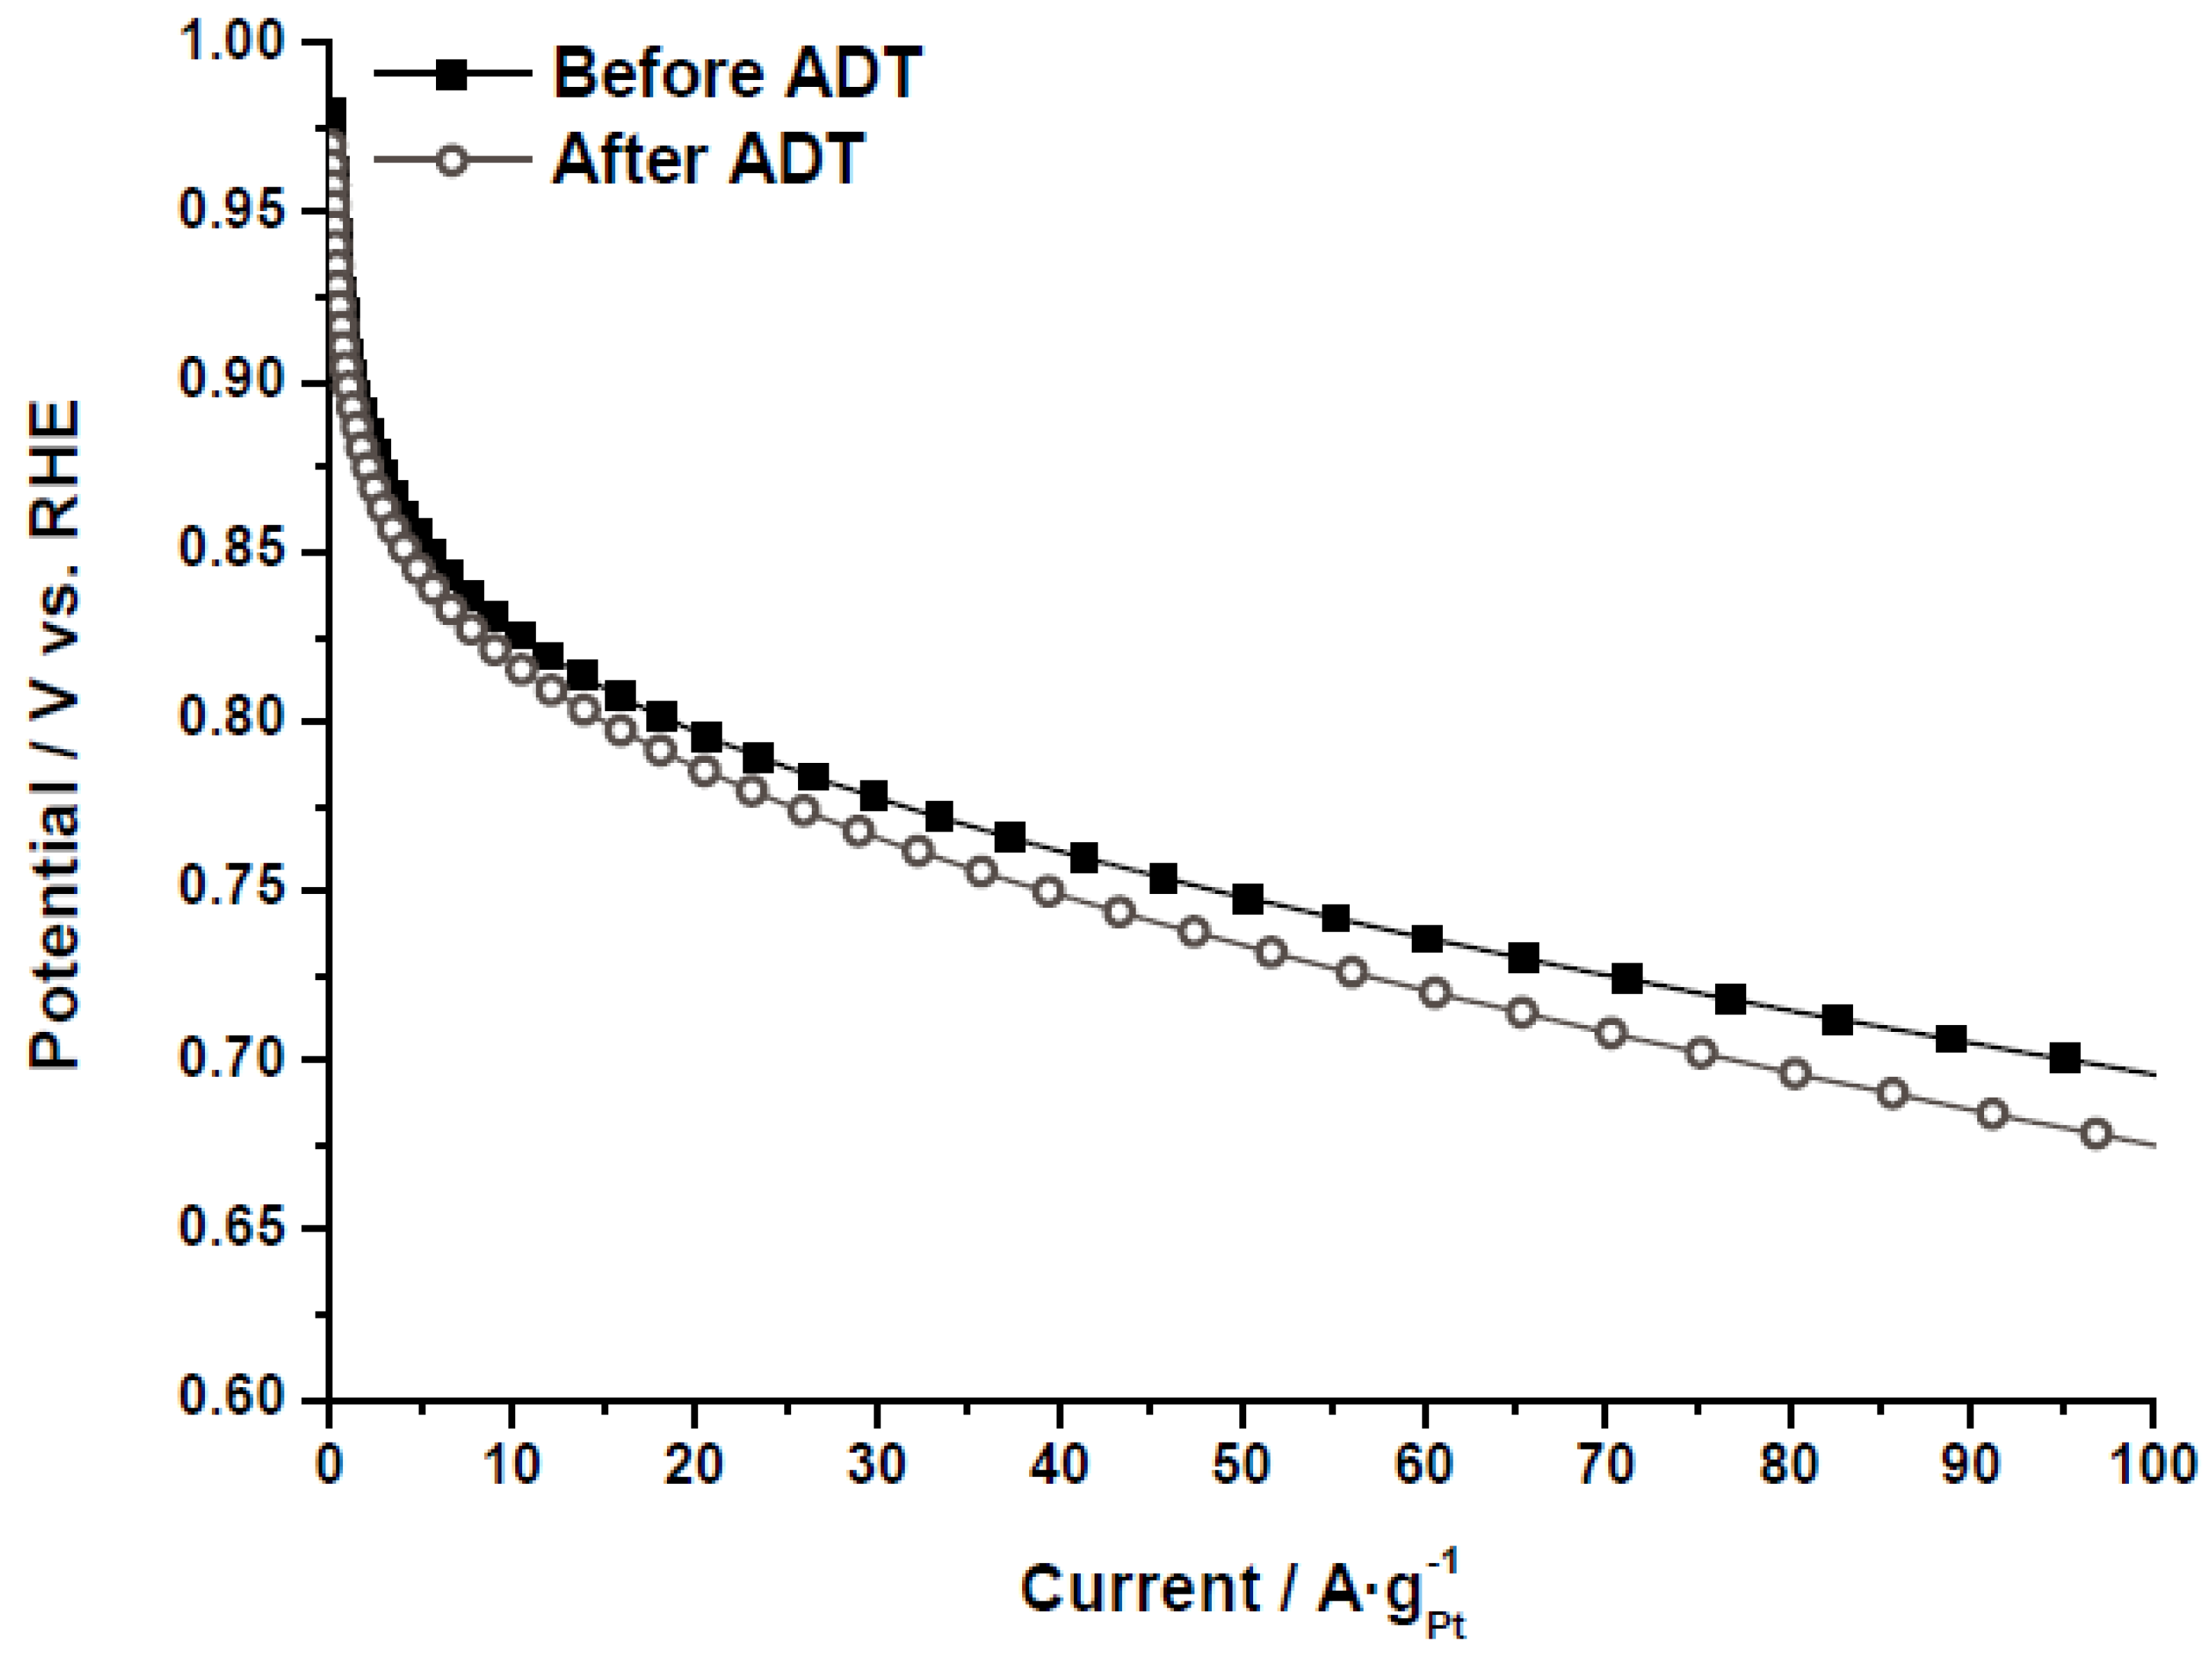
The electrochemical activity towards the ORR was evaluated by polarization curves in half-cell, as further described in the experimental section.
Figure 8 shows the polarization curves for the catalyst Pt/CX-4-RC-50-Ac before and after the ADT, as an example. The same behavior was obtained for all the catalysts, indicating that, after the degradation, the catalytic activity decreases as a result of several phenomena (Pt particle growth, Pt loss, support corrosion,
etc.). It must be pointed out that the values of mass activity have been obtained under flooded conditions, at room temperature and sulfuric acid, so these performances cannot be directly comparable to those obtained in polymer electrolyte fuel cells. To individuate the causes of this activity loss as well as to evaluate the catalytic activity as a function of the carbon xerogel properties, cyclic voltammetry and polarization curves were analyzed before and after the ADT.
Figure 8.
Polarization curves (half-cell, oxygen fed, 0.5 M H2SO4, 25 °C) before and after accelerated degradation tests (ADT) for the catalyst Pt/CX-4-RC-50-Ac.
Figure 8.
Polarization curves (half-cell, oxygen fed, 0.5 M H2SO4, 25 °C) before and after accelerated degradation tests (ADT) for the catalyst Pt/CX-4-RC-50-Ac.
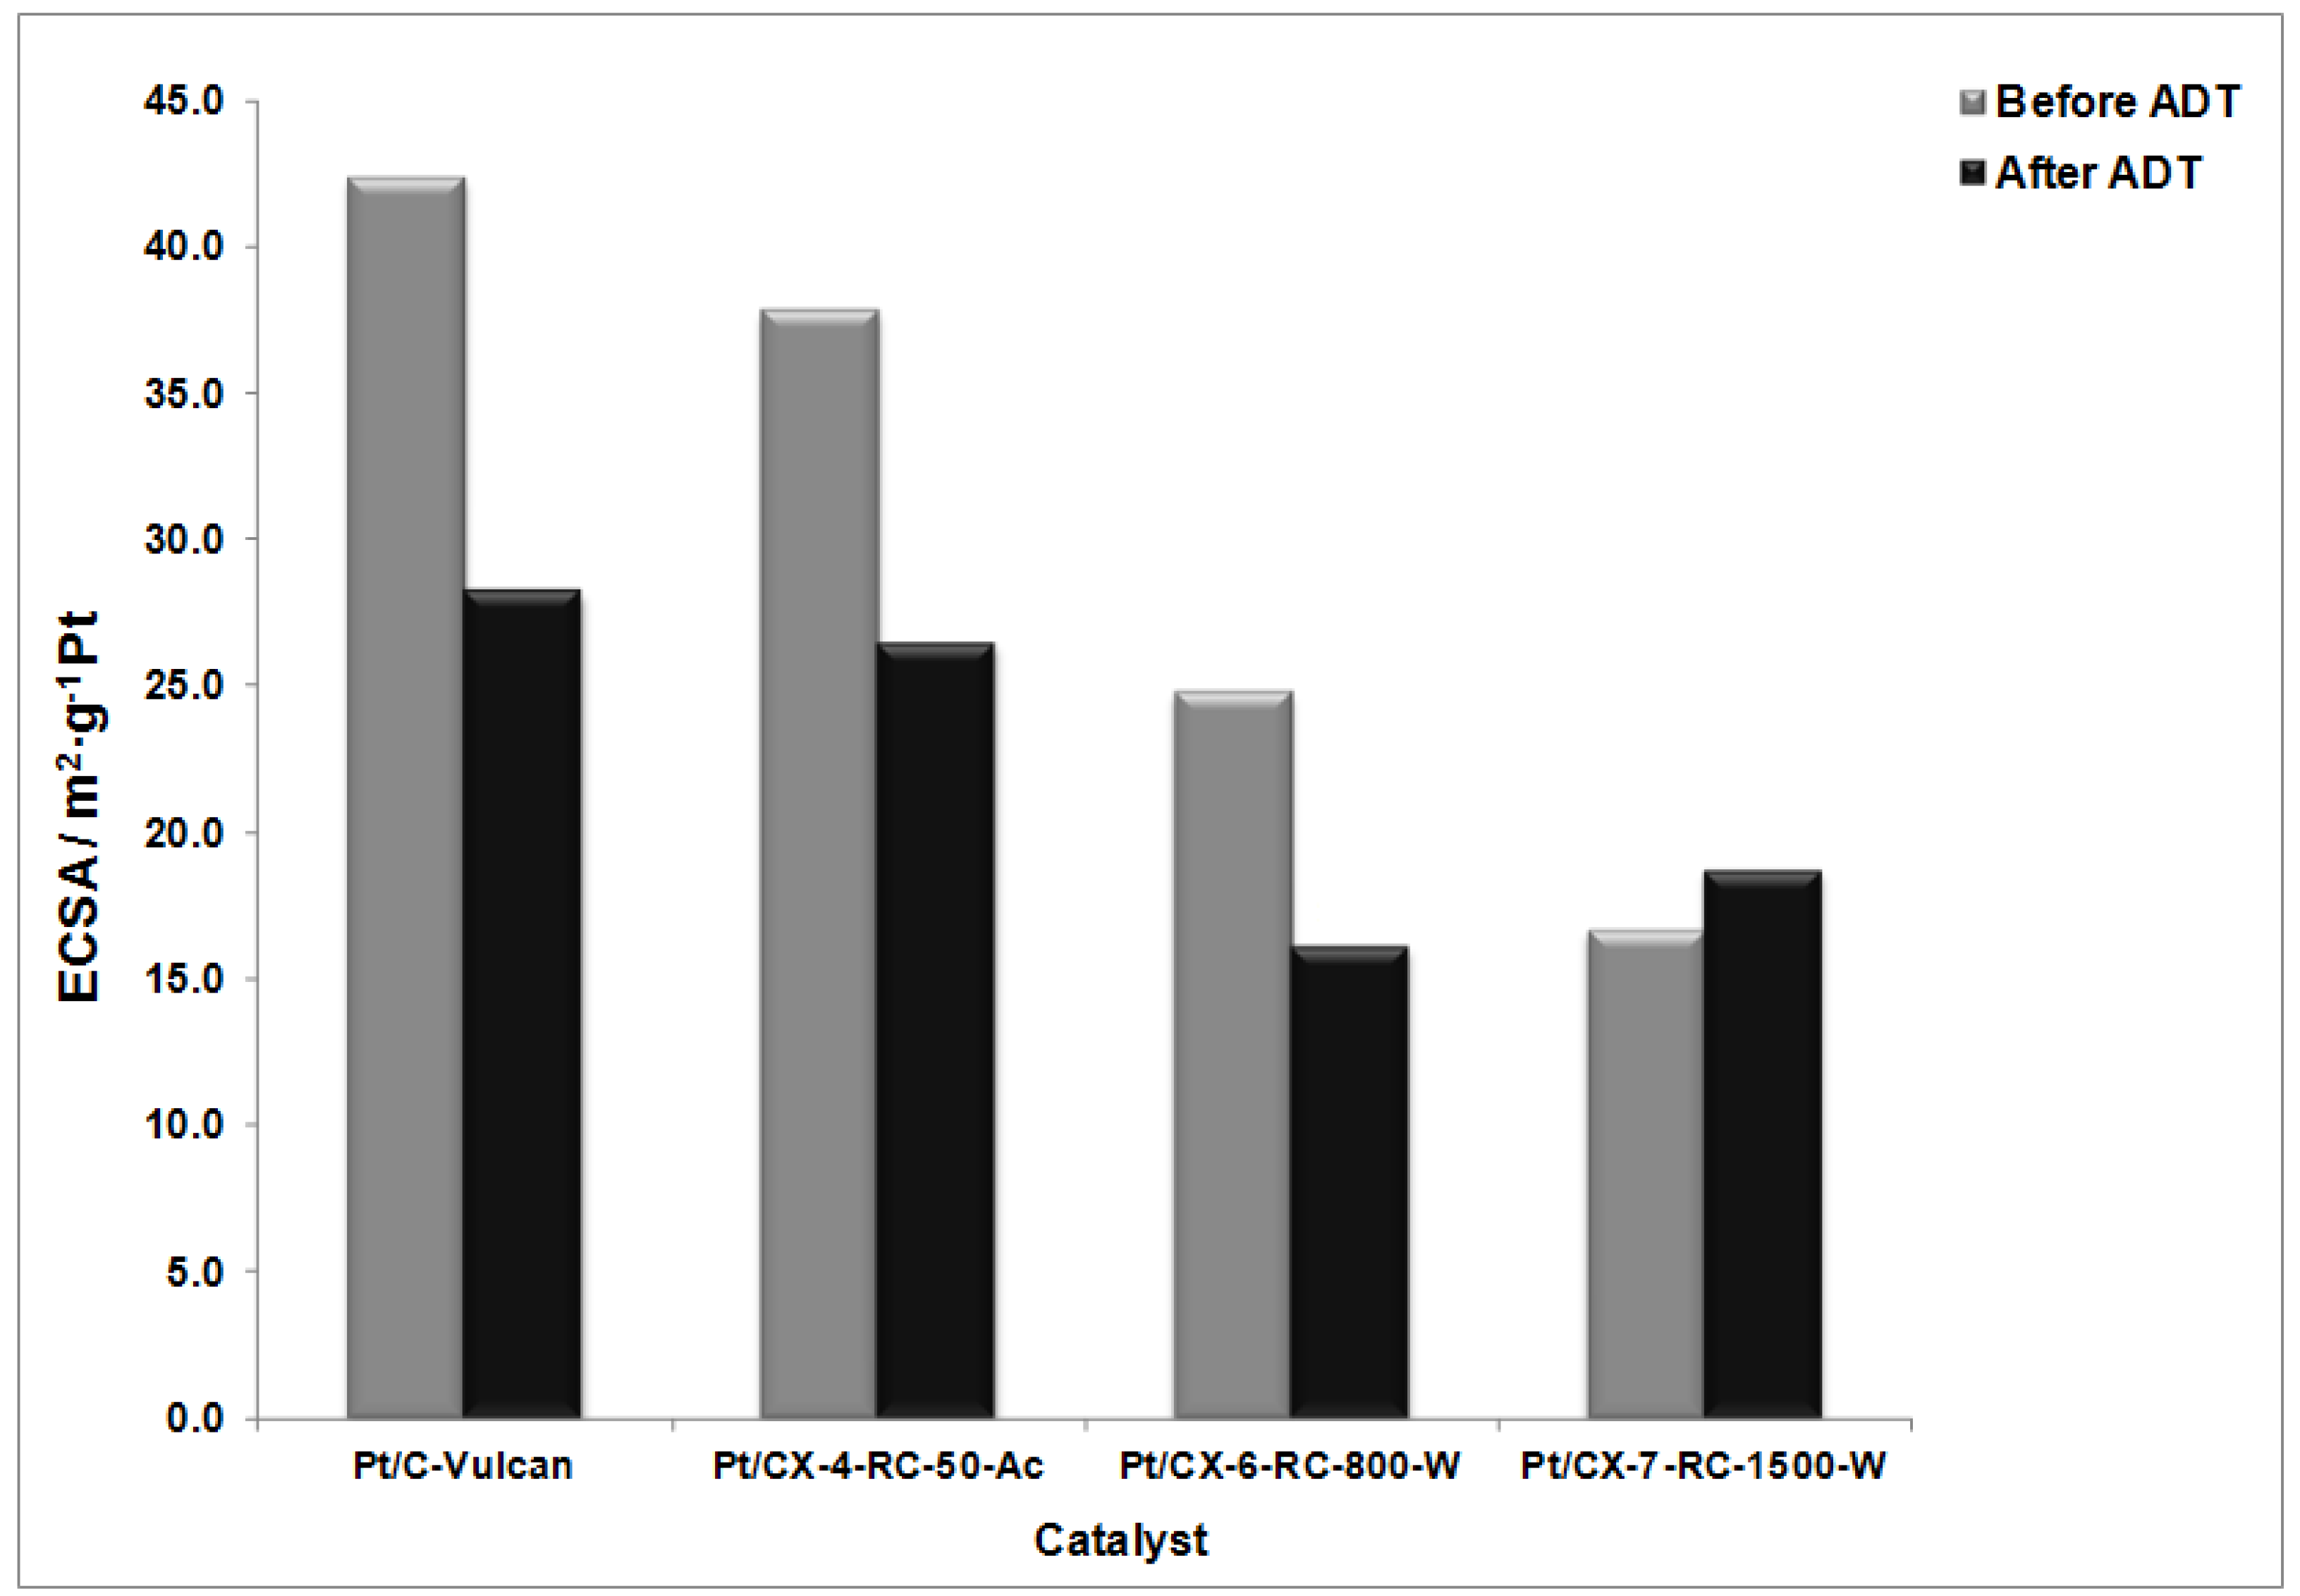
Figure 9 shows the values of ECSA before and after the degradation procedures. The highest ECSA was found for Vulcan as support and a clear tendency for the decrease of surface area from CX-4-RC-50-Ac to CX-7-RC-1500-W was observed. These results are interpreted in terms of the distribution of Pt particles on the support, as all of them present very similar Pt particle size as evidenced from XRD (
Table 5) of about 3.5 nm, and similar metal concentration. Comparing carbon black and carbon xerogels, platinum dispersion is not favored by the BET surface area of the support but by the presence of a moderate concentration of surface functional groups that act as particle agglomeration centers rather than properly dispersing the metal particles [
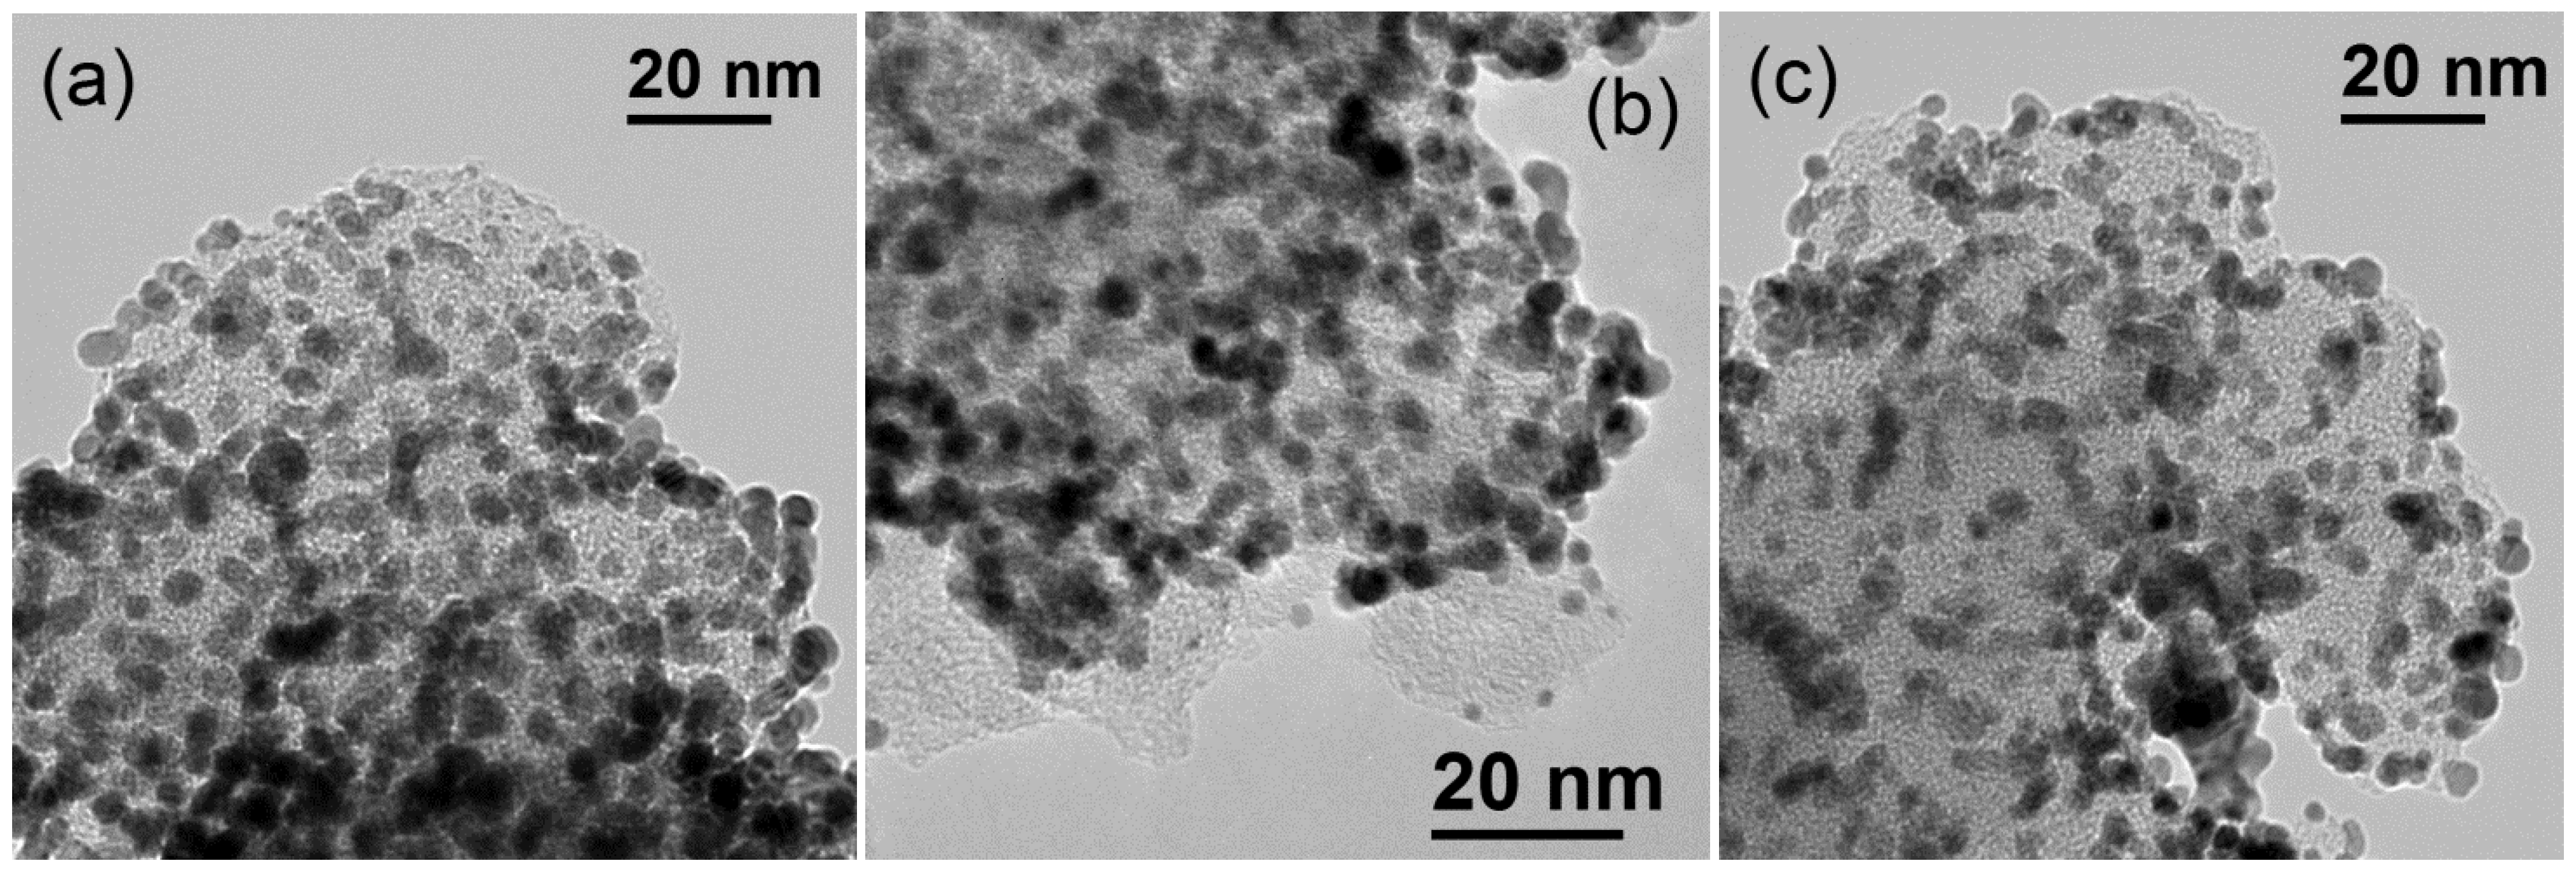
32]. However, the presence of surface defects on carbon xerogels seems to better distribute Pt particles on the surface. This is also evidenced in TEM observations. Representative TEM captions can be observed in
Figure 10. The catalysts presented a unimodal Pt particle size distribution very close to that determined by XRD, but significant differences were encountered among them with respect to the distribution of particles. Whereas the catalyst based on the less structured support, this is CX-4-RC-50-Ac presents a rather homogeneous distribution of particles, some agglomerates were formed, also evidenced by carbon surface not covered by Pt, with the increase of carbon ordering, in good agreement to the variation previously discussed of ECSA values.
After the degradation tests, the relative decrease of ECSA is the lowest for the sample based on the carbon xerogel with the highest ordering degree, this is, CX-7-RC1500-W where the ECSA not only does not decrease but it is slightly higher after the ADT. The ripening effect, this is, the dissolution and reprecipitation of Pt particles may cause an increase of metal available Pt atoms in surface which is in practice translated into the improvement of ECSA for this particular sample. Catalysts based on less ordered carbon xerogel supports experience a notably decrease of ECSA. This evidences the need of using ordering support surface to maximize Pt stability under severe cyclic potential corrosion.
Figure 9.
Electrochemically active surface area (ECSA) before and after accelerated degradation tests (ADT).
Figure 9.
Electrochemically active surface area (ECSA) before and after accelerated degradation tests (ADT).
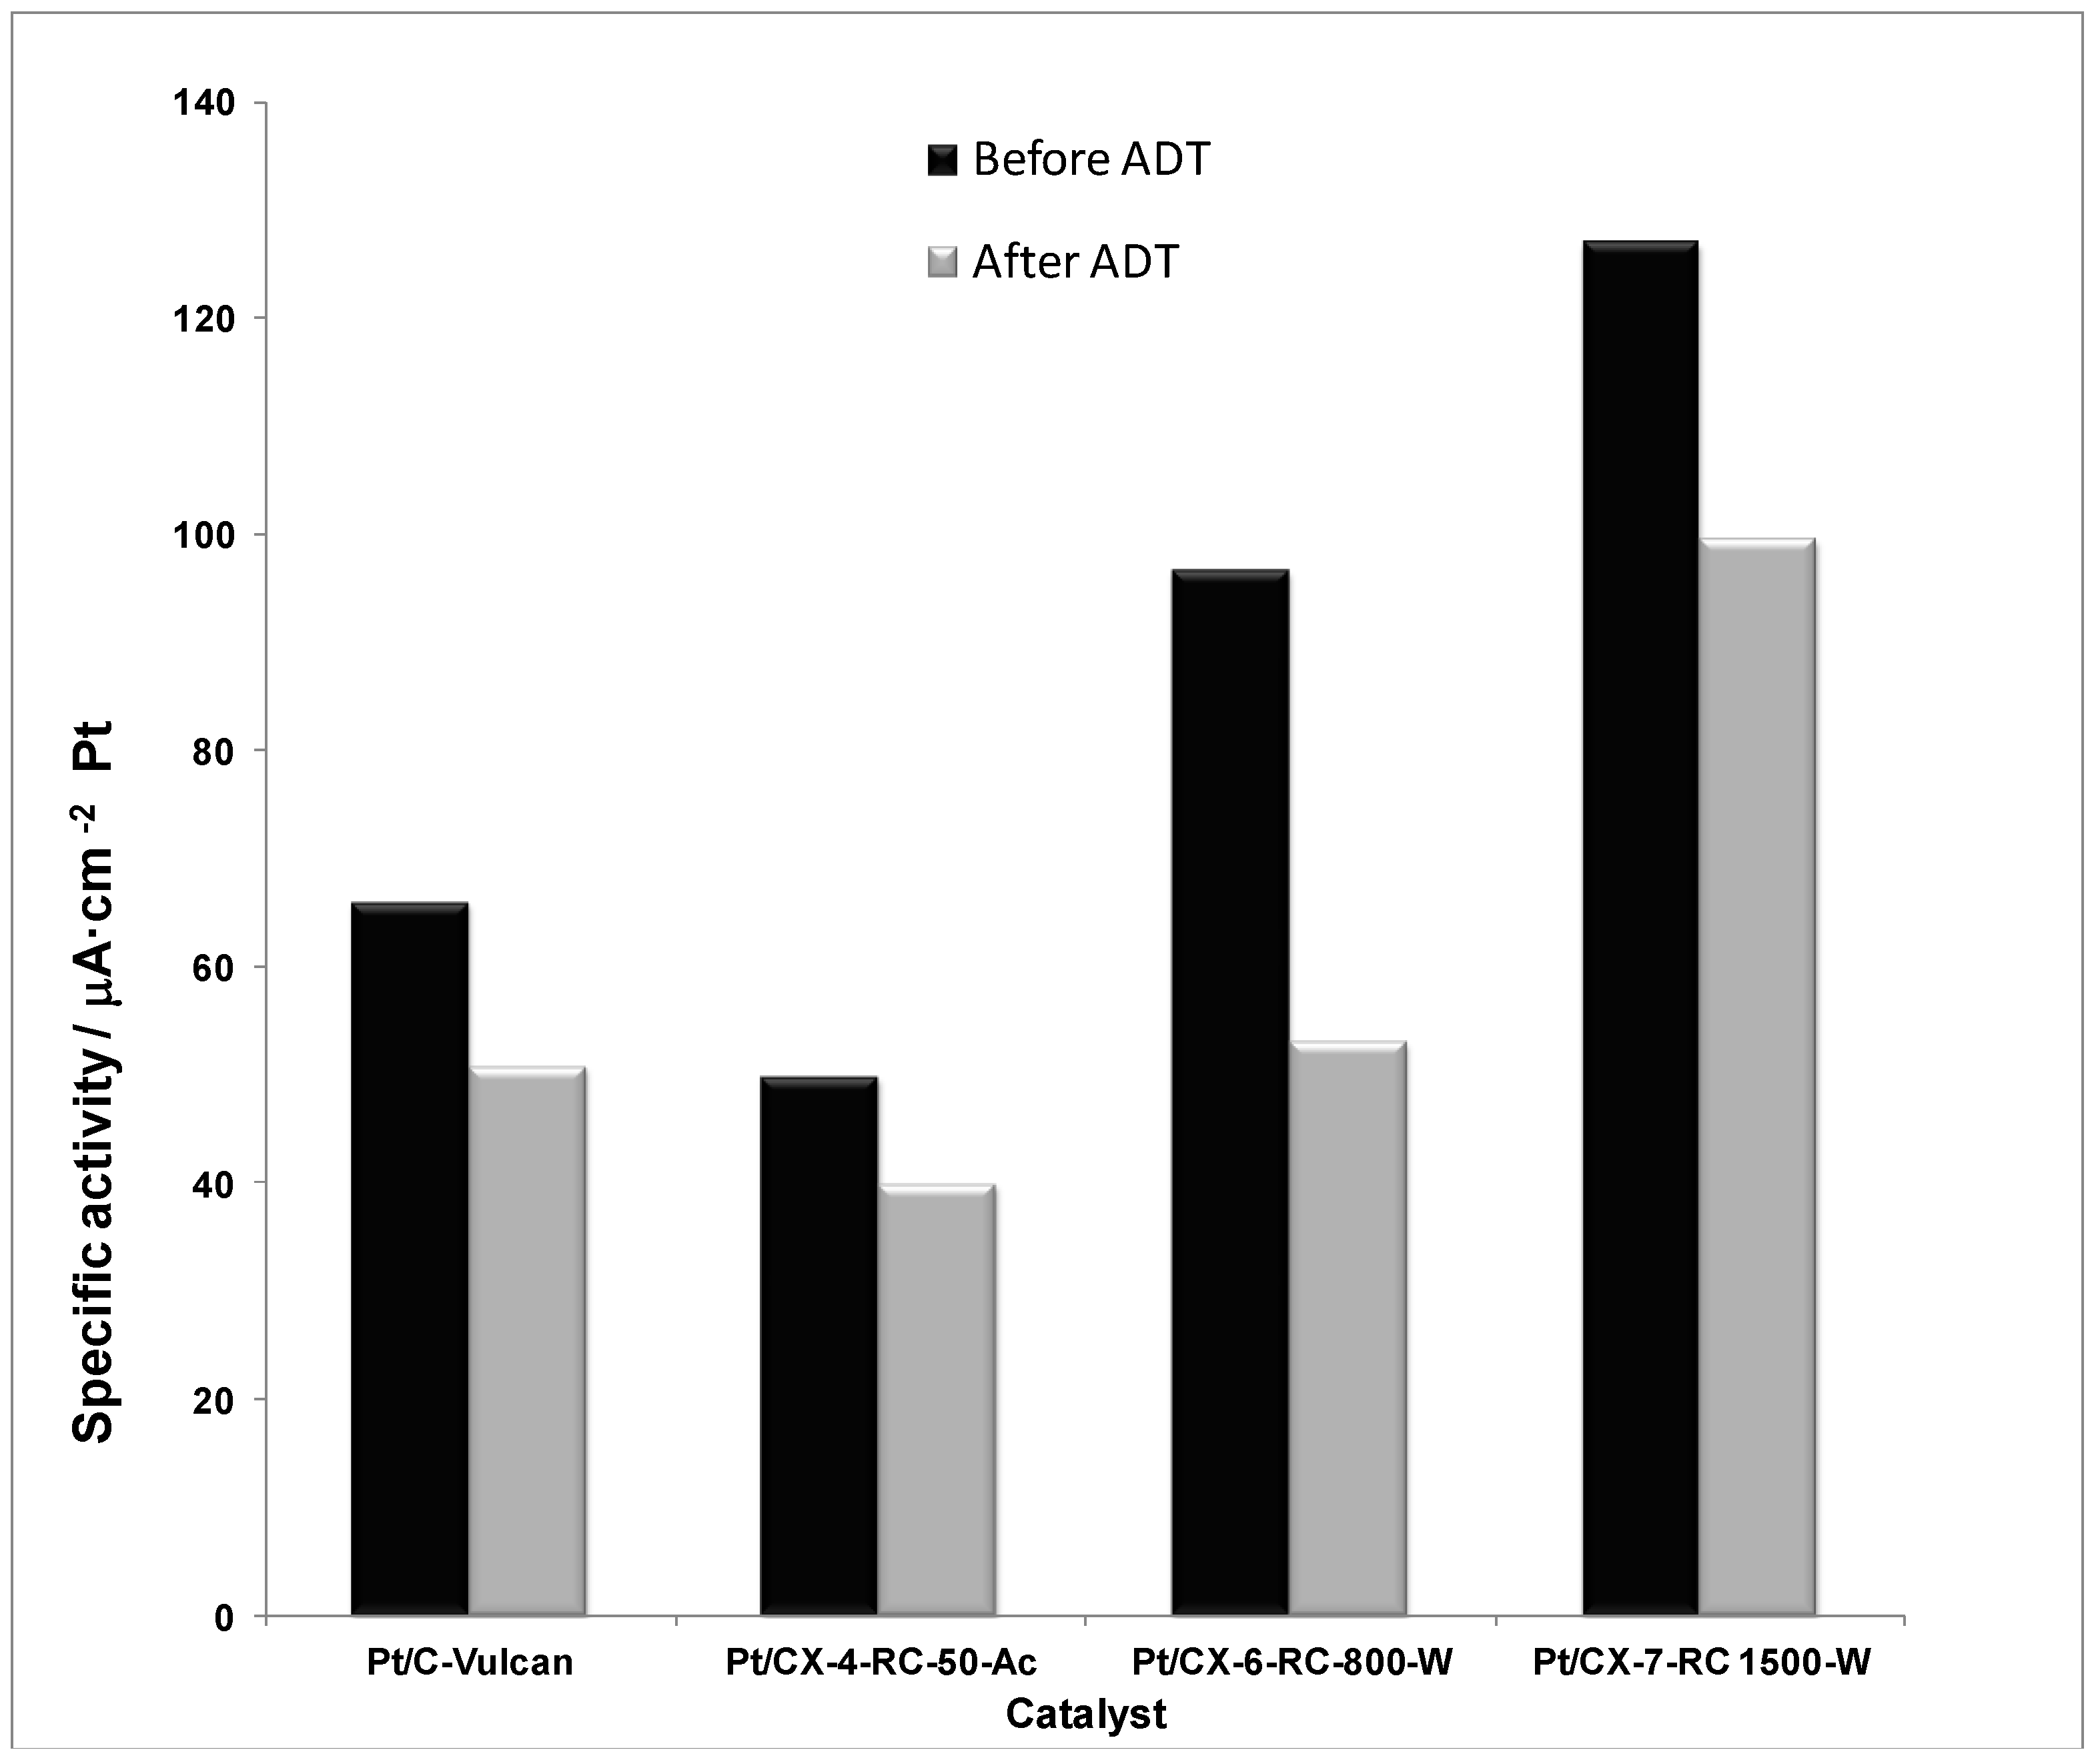
Figure 11 shows the specific or intrinsic activity for all the catalysts in the activation controlled region of the polarization curves, this is, at low current densities and/or high potential (0.80 V
vs. RHE). The current values were normalized with respect to the Pt electrochemically active surface area obtained from the hydrogen desorption region in the cyclic voltammograms. According to the Kinoshita theory, the specific activity increases as the relative number of faceted (111) Pt atoms increases, which is directly related to the particle size. The higher the Pt particle size, the higher the specific activity. Nevertheless, the catalysts studied present very similar Pt particle size (
ca. 3.5 nm), being slightly shifted in the right branch of the Kinoshita’s volcano-shaped curve [
30]. This suggests that the encountered differences in specific activity must be attributed to different metal-support interaction when varying the support features. Indeed, the specific activity progressively increases with the surface ordering of carbon xerogels, being maximized for the catalyst based on CX-7-RC-1500-W, characterized by a less defected structure, evidenced by means of XPS C 1s signal and Raman spectroscopy. Moreover, the specific activity is almost two-fold higher for the catalyst based on CX-7-RC-1500-W compared to the catalyst based on the conventional carbon black (Vulcan). Pt oxidation state, see deconvolution of XPS Pt 4f
7/2 signal presented in
Table 4, might be also playing a certain role,
i.e., Pt
0 content in these catalysts follows the same trend than their specific activity: 59.2% for Pt/C-Vulcan, 57.8% for Pt/CX-4-RC-50-Ac, 65.6% for Pt/CX-6-RC-800-W and 66.8% for Pt/CX-7-RC-1500.
Figure 10.
Representative TEM micrographs of the various electrocatalysts (a) Pt/CX-4-RC-50-Ac (b) Pt/CX-6-RC-800-W and (c) Pt/CX-7-RC-1500-W.
Figure 10.
Representative TEM micrographs of the various electrocatalysts (a) Pt/CX-4-RC-50-Ac (b) Pt/CX-6-RC-800-W and (c) Pt/CX-7-RC-1500-W.
Figure 11.
Specific activity at 0.80 V vs. RHE (half-cell, oxygen fed, 0.5 M H2SO4, 25 °C) before and after accelerated degradation tests (ADT).
Figure 11.
Specific activity at 0.80 V vs. RHE (half-cell, oxygen fed, 0.5 M H2SO4, 25 °C) before and after accelerated degradation tests (ADT).
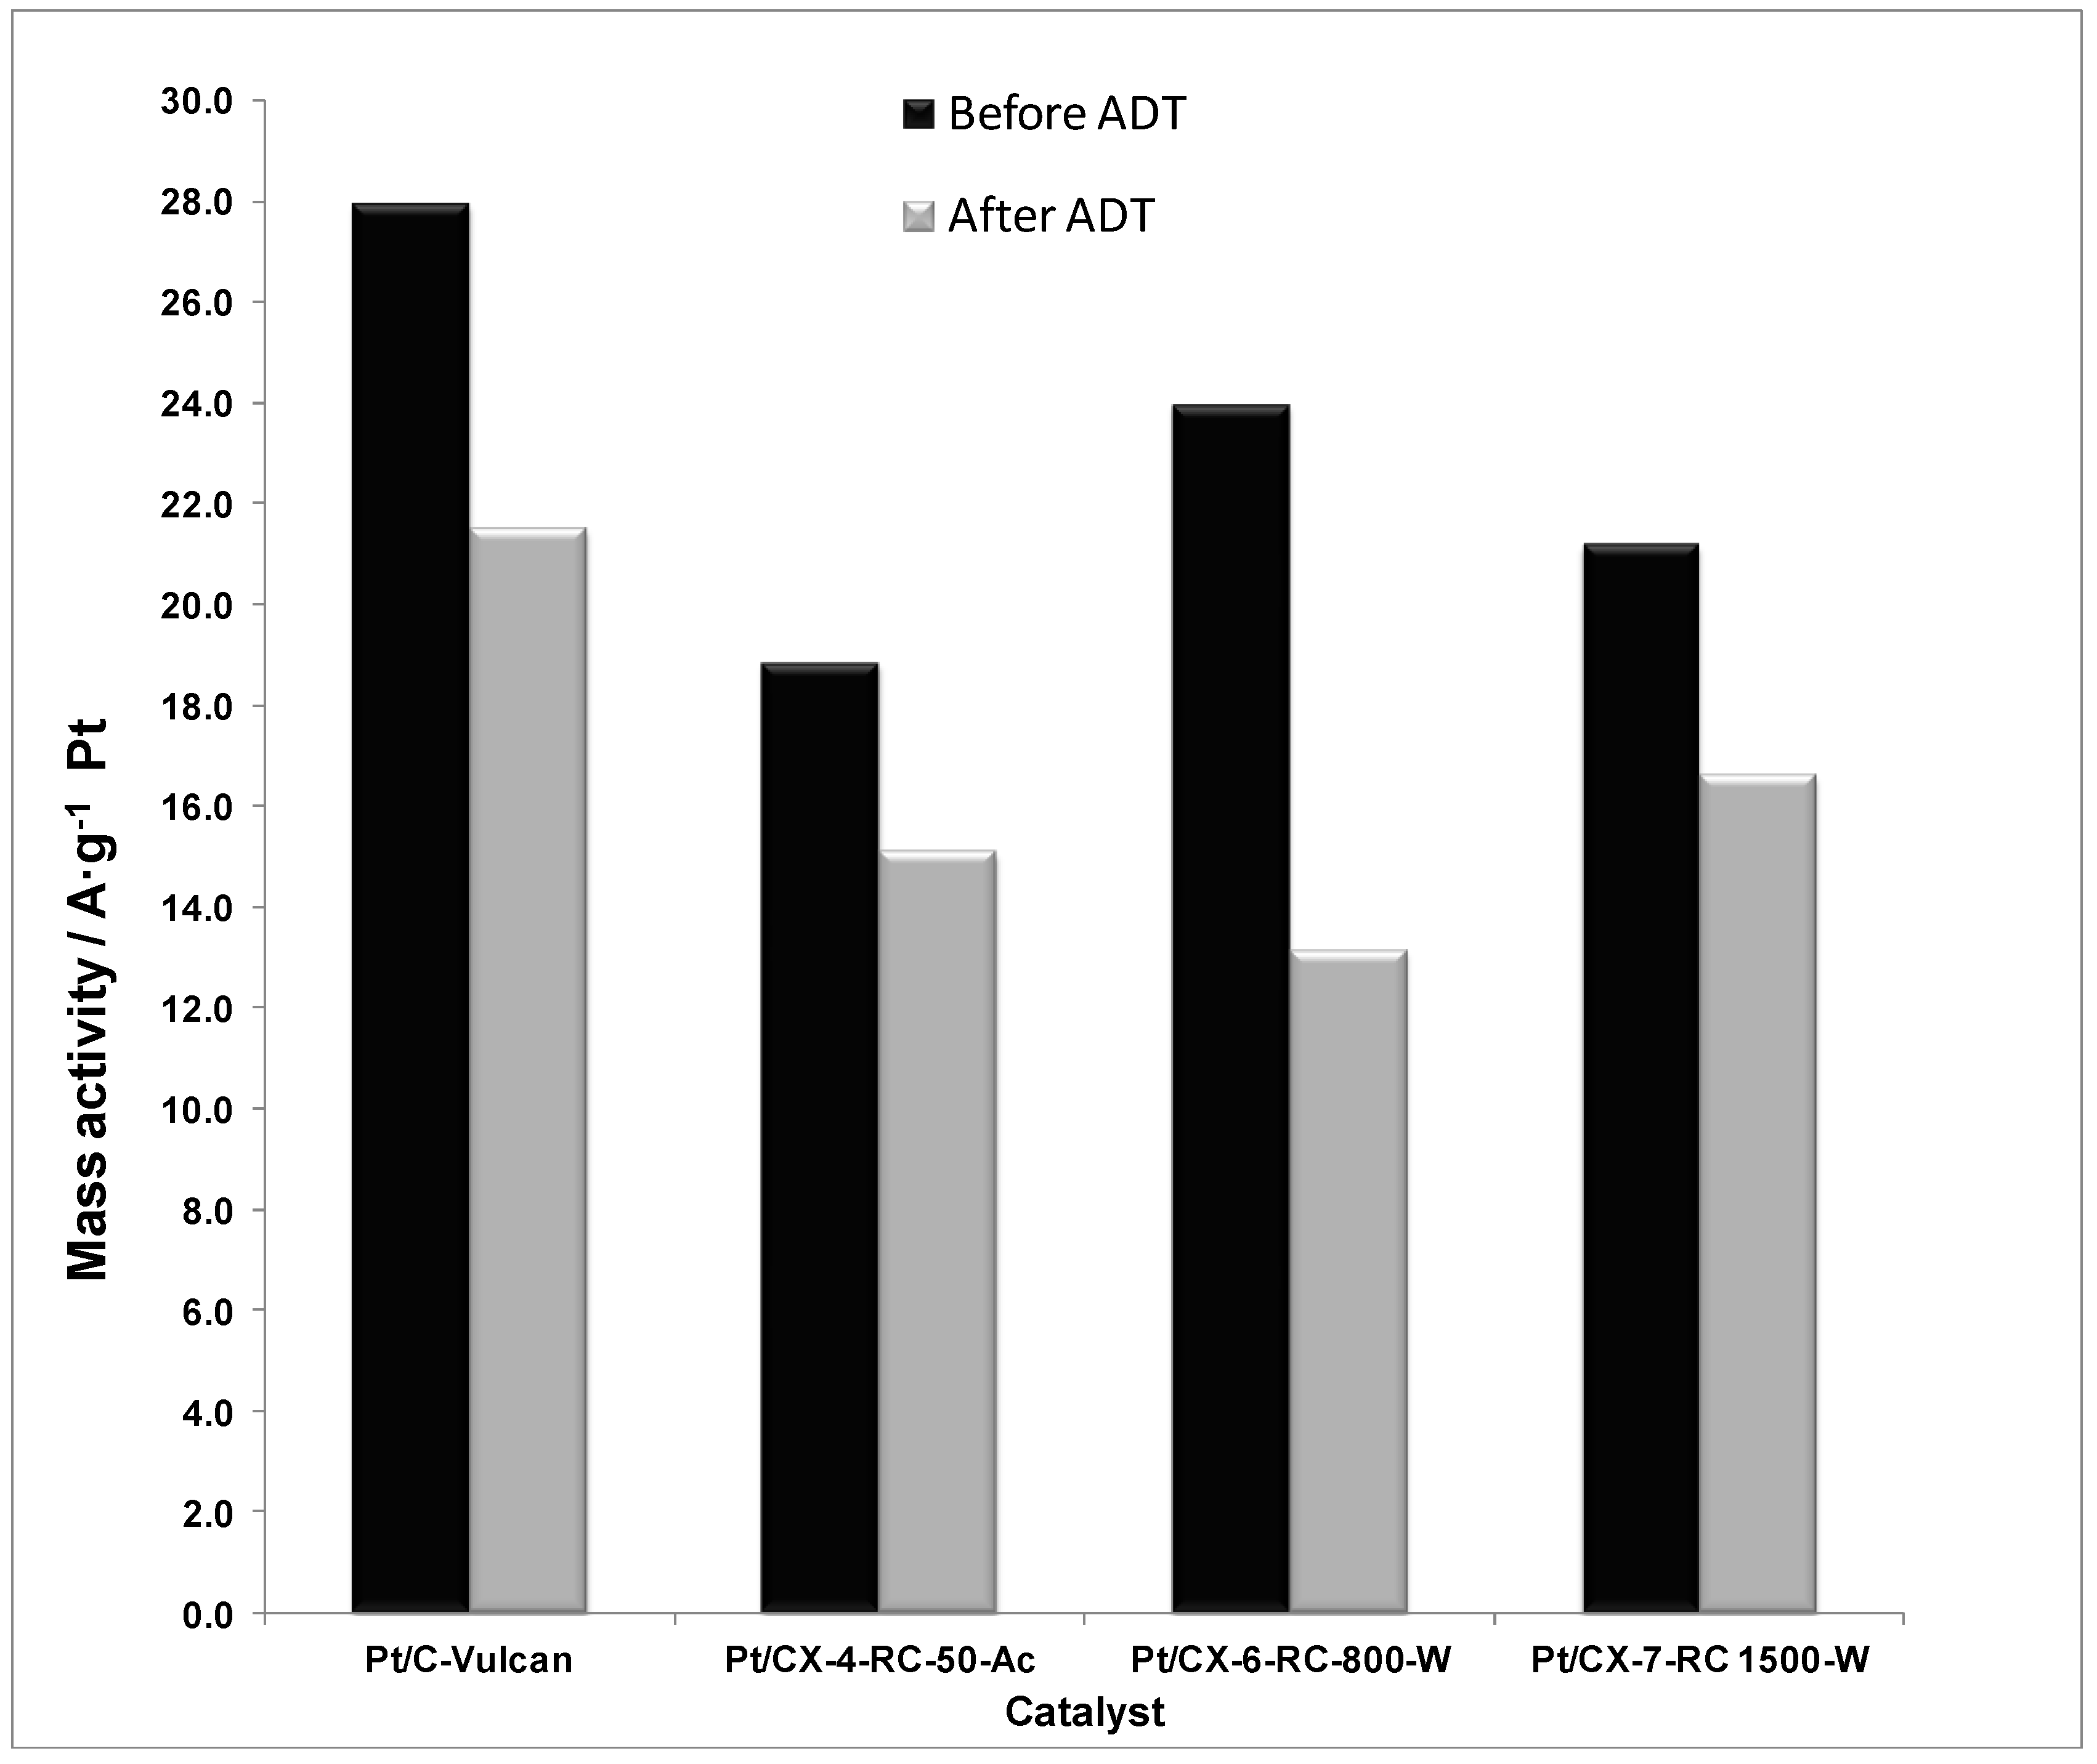
The mass activities, this is, the current values normalized by the Pt mass content, are reported in
Figure 12. As a result of combining the effect of ECSA and specific activity, the mass activity is maximized when using a carbon xerogel with intermediate properties. This is the case of CX-6-RC-800-W. On one hand, the electrochemical surface area is favored by using carbon xerogels characterized by a higher density of surface defects, which may presumably favor the average number of Pt active sites for the electroreduction of oxygen. On the other hand, the low electrochemical surface area is in part compensated by a high specific activity. The ordering degree of carbon favors the metal-support interaction, as evidenced by XPS results, considerably increasing the intrinsic activity. As a result, carbon xerogels with intermediate properties result of high interest for both distribution of particles and activity reasons.
Figure 12.
Mass activity at 0.80 V vs. RHE (half-cell, oxygen fed, 0.5 M H2SO4, 25 °C) before and after accelerated degradation tests (ADT).
Figure 12.
Mass activity at 0.80 V vs. RHE (half-cell, oxygen fed, 0.5 M H2SO4, 25 °C) before and after accelerated degradation tests (ADT).
When considering the relative activity loss after ADT procedures, the catalyst based on the carbon xerogel with high ordering degree presented the lowest loss of activity, attributed both to the slight increase of electrochemical surface area and the stabilization of Pt particles as evidenced from the lower relative loss of specific activity. Consequently, the appropriate carbon support must not be selected only in terms of its initial activity, but considering also the expected life-time of the fuel cell.


 ,
, 
