Article

CO2 Methanation over Rh/CeO2 Studied with Infrared Modulation Excitation Spectroscopy and Phase Sensitive Detection

Department of Chemistry and Chemical Engineering and Competence Centre for Catalysis, Chalmers University of Technology, 412 96 Gothenburg, Sweden
*
Author to whom correspondence should be addressed.
Catalysts 2020, 10(6), 601; https://doi.org/10.3390/catal10060601
Submission received: 11 May 2020 / Revised: 25 May 2020 / Accepted: 26 May 2020 / Published: 29 May 2020
(This article belongs to the Special Issue In Situ and Operando Vibrational Spectroscopy in Catalysis)

Abstract

:
Methane is a well-established fuel molecule whose production from CO 2 through methanation garners increasing interest as an energy storage solution. While often produced with Ni based catalysts, other metals are of interest thanks to higher robustness and activity-selectivity numbers. The Rh/CeO 2 catalyst has shown appreciable properties for CO 2 methanation and its structural dynamics has been studied in situ. However, the reaction pathway is unknown. Here, we present infrared modulation excitation spectroscopy measurements with phase sensitive detection of a Rh/CeO 2 catalyst adsorbate composition during H 2 pulsing (0–2 vol.%) to a constant CO 2 (0.5 vol.%) feed. Various carbonyl (CO) and carbonate (b-CO 3 /p-CO 3 ) ad-species clearly respond to the hydrogen stimulus, making them potential reaction intermediates. The different CO ad-species are likely intermediates for product CO and CH 4 but their individual contributions to the respective formations are not unambiguously ascertained. As for the carbonate dynamics, it might be linked to the reduction/oxidation of the CeO 2 surface upon H 2 pulsing. Formate (HCOO) ad-species are clearly visible but appear to be, if not spectators, linked to slow side reactions possibly also affected by CeO 2 redox processes.

Graphical Abstract

1. Introduction

One of the grand challenges for building sustainable societies is to develop energy systems that are independent from fossil energy sources and can couple to different energy storage solutions. In response, researchers steer their efforts towards how to utilize alternative energy sources and energy vectors in closed cycle operation, i.e., in a manner that neither consumes resources nor produces waste [1]. Hitherto, the so-called hydrogen economy is probably the most well-known effort in this respect. Hydrogen (H 2 ) can be sustainably produced by water splitting if driven by electrical power generated from sources deemed green such as biomass, hydro, solar, and wind power. It shows great promise when integrated with electrical systems by the use of fuel cells. Hydrogen, however, may cause equipment embrittlement. Further, its handling poses safety concerns due to its low ignition energy [2,3,4] and brings high costs for storage [5], which overall decreases its applicability as a combustion fuel. To circumvent these problems, hydrogen gas can be chemically transformed into more dense energy vectors. One such solution is to react hydrogen with carbon oxides (CO x ) in a hydrogenation reaction to form alkanes or alcohols, which also suit combustion processes much better for the reasons mentioned above. Among the available CO x precursors, carbon dioxide (CO 2 ) from flue gases including those from biorefineries and sequestration would present green carbon sources in the shorter and longer perspective, respectively. Even if long alkanes and alcohols are preferred for storage and handling thanks to their liquid state of aggregation, their production require multi-step processing and/or high-pressure reaction systems. Hence, sacrificing some energy density in order to achieve a simpler and less demanding system, especially for small off-grid systems, one might instead opt for simpler reactions such as the Sabatier reaction, i.e., formation of methane (CH 4 ) from CO 2 and H 2 (Equation (1)):
CO 2 + 3 H 2 CH 4 + H 2 O .
Catalytic reactions depend on temperature such that elevated temperature usually increases the catalytic activity at the expense of product selectivity because more reaction pathways become possible. Methanation catalysts typically include metallic nickel thanks to its high catalytic activity and good selectivity as well as low price. Nickel-based catalysts, however, suffer from deactivation processes such as irreversible oxidation, coking, and formation of poisonous volatile nickel carbonyls, which shortens the lifetime of the catalyst [6,7]. An interesting alternative element is rhodium (Rh). Although expensive, rhodium-based methanation catalysts suffer less from deactivation and show high activity and very high CH 4 selectivity [8,9,10,11]. A catalyst formulation that has shown a good middle ground between activity and CH 4 selectivity is ceria (CeO 2 ) supported rhodium where small Rh nanoparticles are dispersed onto high surface area CeO 2 . In terms of both activity and CH 4 selectivity, the Rh/CeO 2 catalyst has been reported to surpass the corresponding Ni/CeO 2 catalyst for which CO from the reverse water–gas shift reaction (Equation (2)) is a main side product (although not without value) that forms at temperatures above 300–350 °C [9]:
CO 2 + H 2 CO + H 2 O .
To improve Rh-based catalysts, a deeper understanding of the catalyst structure–function relationship and the mechanism behind the methanation reaction is welcome. We employed X-ray absorption spectroscopy and high-energy X-ray diffraction in situ to study the dynamics in Rh oxidation state and crystal structure of the Rh and the support phases during transient CO 2 methanation reaction conditions for different Rh/MO catalysts where MO = SiO 2 , Al 2 O 3 , and CeO 2 [12,13]. An important finding was that CeO 2 is partially reduced during methanation, but the removal of H 2 from the feed gas, leaving the sample under a flow of only CO 2 and Ar, leads to its oxidation. This suggests that CO 2 , or a remaining intermediate, re-oxidizes the surface either by decomposition or as a part of the reaction pathway. Furthermore, both in situ diffuse reflectance infrared Fourier transform spectroscopy (DRIFTS) and ambient pressure X-ray photoemission spectroscopy (AP-XPS) show that CO, formates (HCOO), and carbonates (CO 3 ) are present on the Rh/CeO 2 catalyst during methanation conditions. Whether they participate in the reaction sequence or appear just as spectators could, however, not be ascertained. Experimentally, transient in situ DRIFTS measurements hold promise for elucidating the role of CO, HCOO and CO 3 species in the methanation reaction as their dynamics can be probed during modulation excitation spectroscopy (MES) conditions. In the MES approach, which was used here, a controlling parameter of the reaction is periodically changed (modulated) and the spectroscopic response by the system is recorded. Reaction intermediates are expected to respond to the stimulus but spectators are not because their contribution is (nearly) static and independent on the catalytic reaction [14]. The observed spectroscopic signals can be further analyzed in great detail either by deconvolution methods or, as here, by phase sensitive detection (PSD) that builds on a lock-in amplifier to extract information nearly hidden in the rich spectroscopic data.
In this study, we aimed at elucidating whether HCOO, CO, and CO 3 surface species are likely reaction intermediates in the CO 2 methanation reaction over Rh/CeO 2 . We employed transient in situ DRIFTS measurements by modulation of the H 2 gas concentration while recording the spectroscopic responses caused by adsorbate changes. The periodic responses were thoroughly analyzed by use of PSD. It is clear that carbonyls, in the form of adsorbed CO, and CO 3 are responding to the stimulus, whereas observed HCOO species are nearly unaffected.

2. Results and Discussion

For this study a Rh/CeO 2 catalyst with 5.9 wt.% Rh and a total specific surface area of 130 m 2 /g was prepared using incipient wetness impregnation. The chosen synthesis route is known to give well dispersed Rh particles. This is supported by XRD measurements (cf. Figure S1) that clearly show reflections from the CeO 2 but none for the Rh phase suggesting small and possibly amorphous Rh particles. The following sections present the CO 2 adsorption and hydrogenation over this Rh/CeO 2 catalyst, first for steady-state conditions, to show the total amount of adsorbates, and then for dynamic conditions, i.e., modulation excitation spectroscopic measurements, to visualize the response of adsorbates to the H 2 stimulus by use of phase sensitive detection.

2.1. Catalyst Adsorbates during Steady-State Conditions

Figure 1 shows the steady-state IR spectra for the Rh/CeO 2 catalyst when exposed to a flow of 0.5 vol.% CO 2 (Figure 1a) and a hydrogenation reaction mixture of 0.5 vol.% CO 2 and 2 vol.% H 2 (Figure 1b,c) in both cases with Ar as carrier gas. Upon exposure to CO 2 , several absorption peaks corresponding to carbonates are formed. The peaks at 1587 and 1301 cm 1 are the most prominent. Based on their positions with relatively large splitting ( Δ ν as s ) and considering their rather high thermal stability, these peaks are presumably attributed to bidentate carbonates (b-CO 3 ) formed on the CeO 2 surface [15]. At 300 °C, the relative amplitudes for the b-CO 3 and the central peaks clearly decrease. As such, one can expect the central peaks to correspond to a surface complex that is even more thermostable, possibly a polydentate carbonate (p-CO 3 ).
During steady-state hydrogenation conditions, additional absorption peaks arise. With the exception of the peak at 2350 cm 1 , which is due to gaseous CO 2 , the peak at 1744 cm 1 is the most distinct one. This peak is proposed to be due to CO at the rim of the Rh particles in contact with CeO 2 , here denoted as ν Rh CeO 2 (C=O), which has previously been assigned to a peak at 1725 cm 1 [16]. Its high amplitude relative to peaks at temperatures above 250 °C corresponds well with observed CO production over Rh/CeO 2 and thus supports this assignment [9]. The shift of the ν Rh CeO 2 (C=O) peak towards higher wavenumbers with increasing temperature suggests that this peak is a convolution of several different vibrations, which may explain the deviation by approximately 20 cm 1 from the previous study [16]. The additional peaks observed in the region of 2114–1895 cm 1 correspond to CO on Rh [17]. As for the peaks in the 1600–1300 cm 1 region, carbonates are expected to be present during hydrogenation as well. Interestingly, their amplitudes are significantly higher during hydrogenation conditions compared to those of pure CO 2 adsorption, which signifies that these peaks arise mainly due to hydrogenation products. Based on our AP-XPS data [13] and previous literature assignments [18], these peaks should be, at least in part, due to surface HCOO out of which the bidentate coordination on CeO 2 is the most likely [18]. As such, an initial peak assignment for the steady-state spectra could include the two twin peaks at 1560/1510 and 1373/1327 cm 1 to correspond to two kinds of bidentate HCOO: one that is adsorbed at a non-reduced site (CeO 2 ) giving rise to the pair at 1560( ν as )/1327( ν s ) cm 1 with a high Δ ν as s of 233 cm 1 and one that is adsorbed at, or in the vicinity of, a reduced site (CeO 2 δ ) resulting in the pair at 1510( ν as )/1373( ν s ) cm 1 with a low Δ ν as s of 137 cm 1 [18]. The ratio between the two kinds of bidentate HCOO in regards to log ( 1 / R ) shifts with increased temperature showing a decreasing amount of adsorbates at non-reduced CeO 2 . This is likely caused by a more reduced CeO 2 surface at the higher temperatures. However, due to the very weak ν s (C−H) vibration at the 2900–2800 cm 1 region (Figure 1c, zoomed inset), it is unlikely that the peaks between 1600 and 1300 cm 1 are fully composed of HCOO but instead include some additional convoluted species.

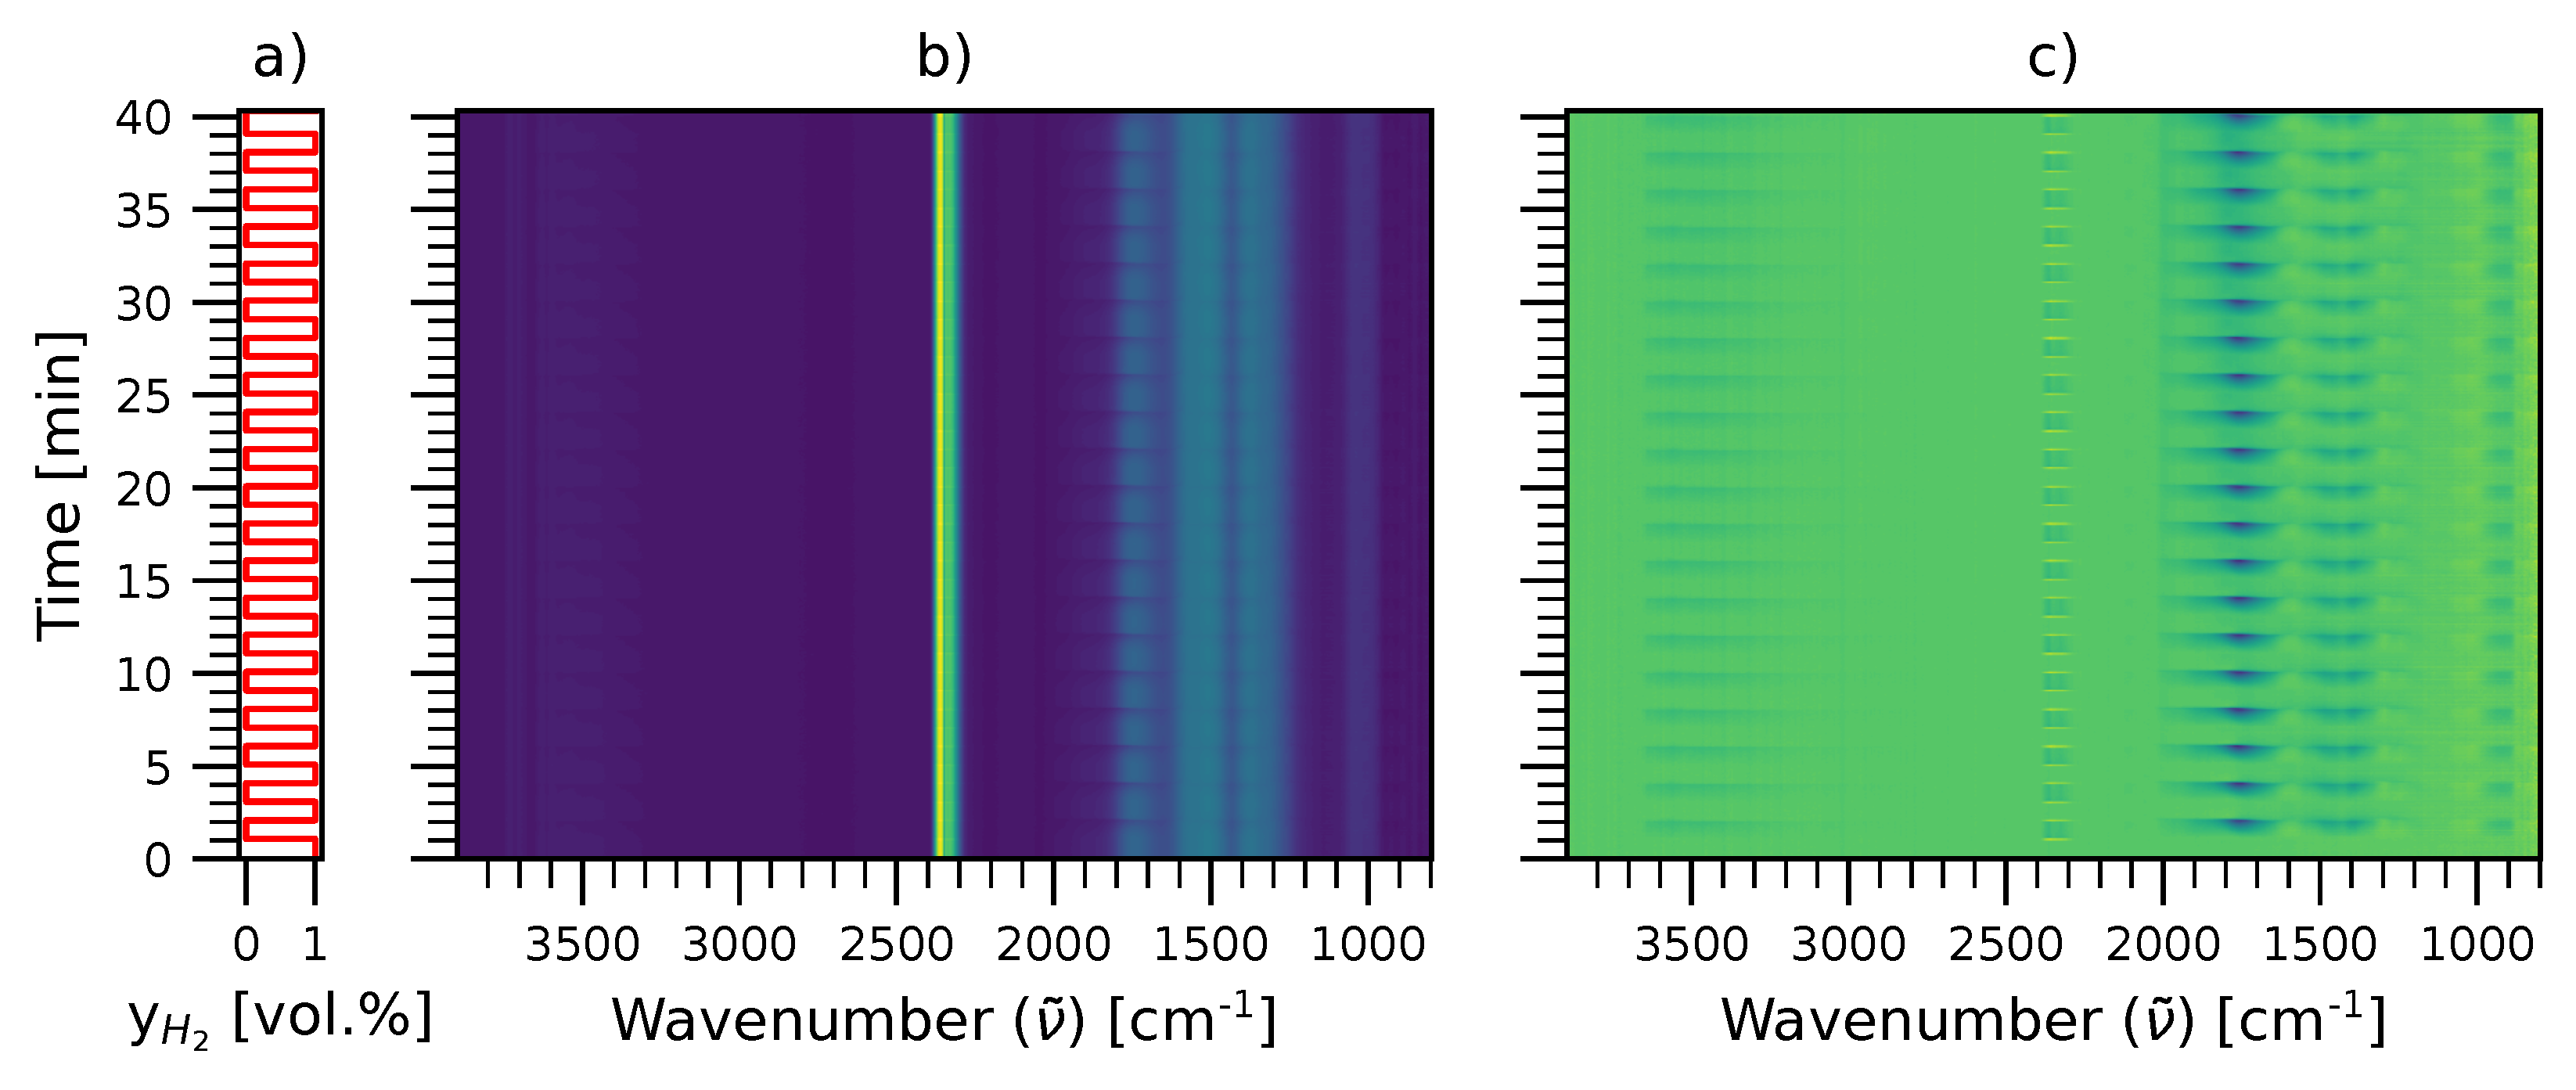
2.2. Time-Resolved DRIFTS and MES-PSD

As both sufficiently long-lived intermediates and spectators are observed concurrently at steady-state conditions, complementary transient measurements are needed to distinguish the intermediates from the (nearly) static spectators and elucidate their roles in the hydrogenation mechanism. The steady-state measurements were therefore followed by a series of MES measurements in which the reaction was modulated by changing the feed gas concentration of H 2 in a step-wise manner between 0 and 2 vol.%. As an example, one such measurement carried out at 300 °C with a modulation period ( τ ) of 120 s is shown in Figure 2. The figure shows the imposed modulated H 2 gas concentration (Figure 2a) and the resulting spectroscopic data as a contour plot (Figure 2b). In addition, it shows the difference spectra for which the steady-state hydrogenation spectrum has been subtracted from each individual spectrum also as a contour plot (Figure 2c). We mention that for the measurements with long pulse period ( τ = 120 s), several adsorbates reach steady-state during the H 2 exposure. This is most apparent at 300 °C. In contrast, for the measurements with short periods ( τ = 30 s), the catalytic system shows only a weak response to the modulation and no species reach steady-state plateaus. Further, many of the hydrogenation products are not depleted from the surface. This is, at least partially, due to the dead volume of the reaction chamber that counteracts a complete purge of the H 2 during the CO 2 /Ar feed such that the H 2 gas concentration of 0 vol.% in the feed gas is not reached in the chamber. However, this (artifactual) discrepancy between inlet and desired chamber gas concentrations decreases with increased modulation period.
An initial look at Figure 2c reveals that the peaks attributed to CO in the steady-state case actually exhibit a response to the stimulus whereas those presumed to be HCOO remain constant. Instead, two peaks in the 1500–1400 cm 1 region that were previously hidden due to convolution are responding. To refine the data of the MES measurements and to simplify the determination of response times for the adsorbates with respect to the modulation, so-called phase sensitive detection (PSD) was employed. The PSD is carried out by use of a lock-in amplifier that is integrated over several periods after the point where the studied system reaches a repeatable oscillation as detailed below. Figure 3 shows the PSD results for τ equal to 120 (Figure 3a), 60 (Figure 3b), and 30 s (Figure 3c) for the three temperatures 200, 250, and 300 °C. The three graphs in each top row show the amplitude ( A ϕ PSD ) versus wavenumber for demodulated spectra within 0 ° θ PSD 180 ° referred to as PSD plots. Each graph in the bottom row shows the maximum amplitude ( A ϕ PSD , max ) at each wavenumber in the period of 0 ° θ PSD 360 ° , here called composite plot, together with the phase delay ( φ ) for the most distinct peaks in the spectra represented with filled circles.

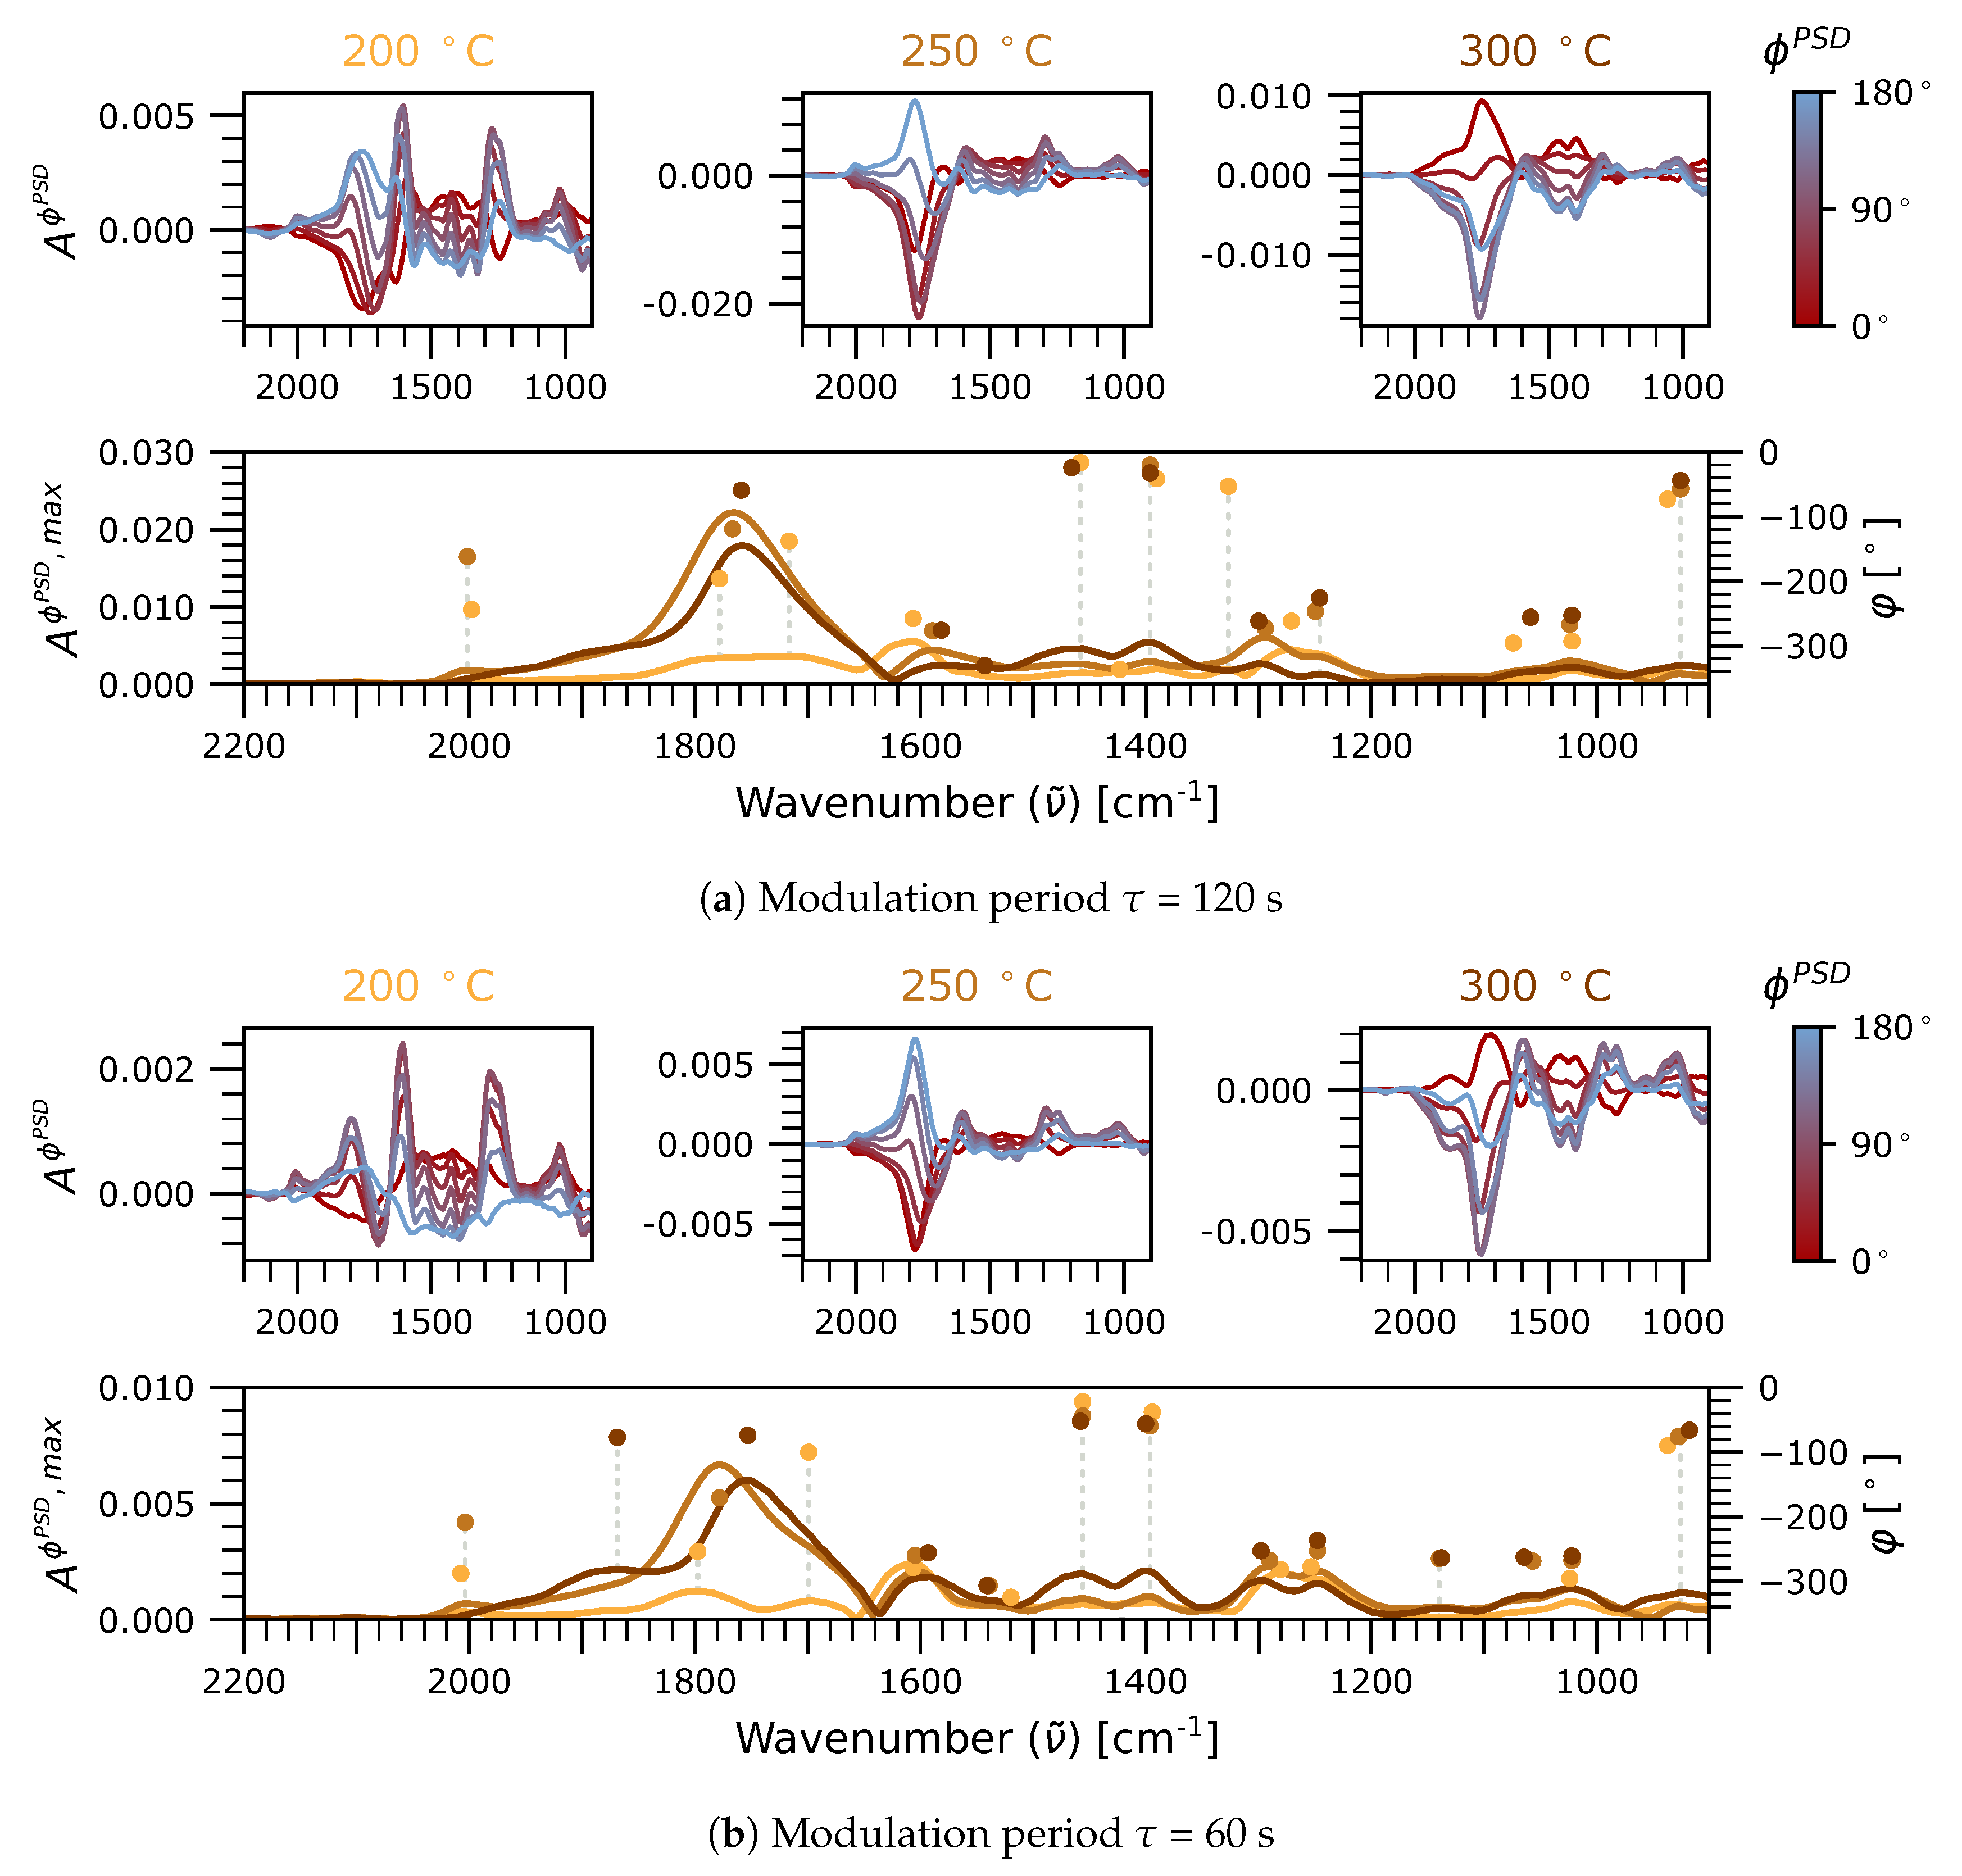
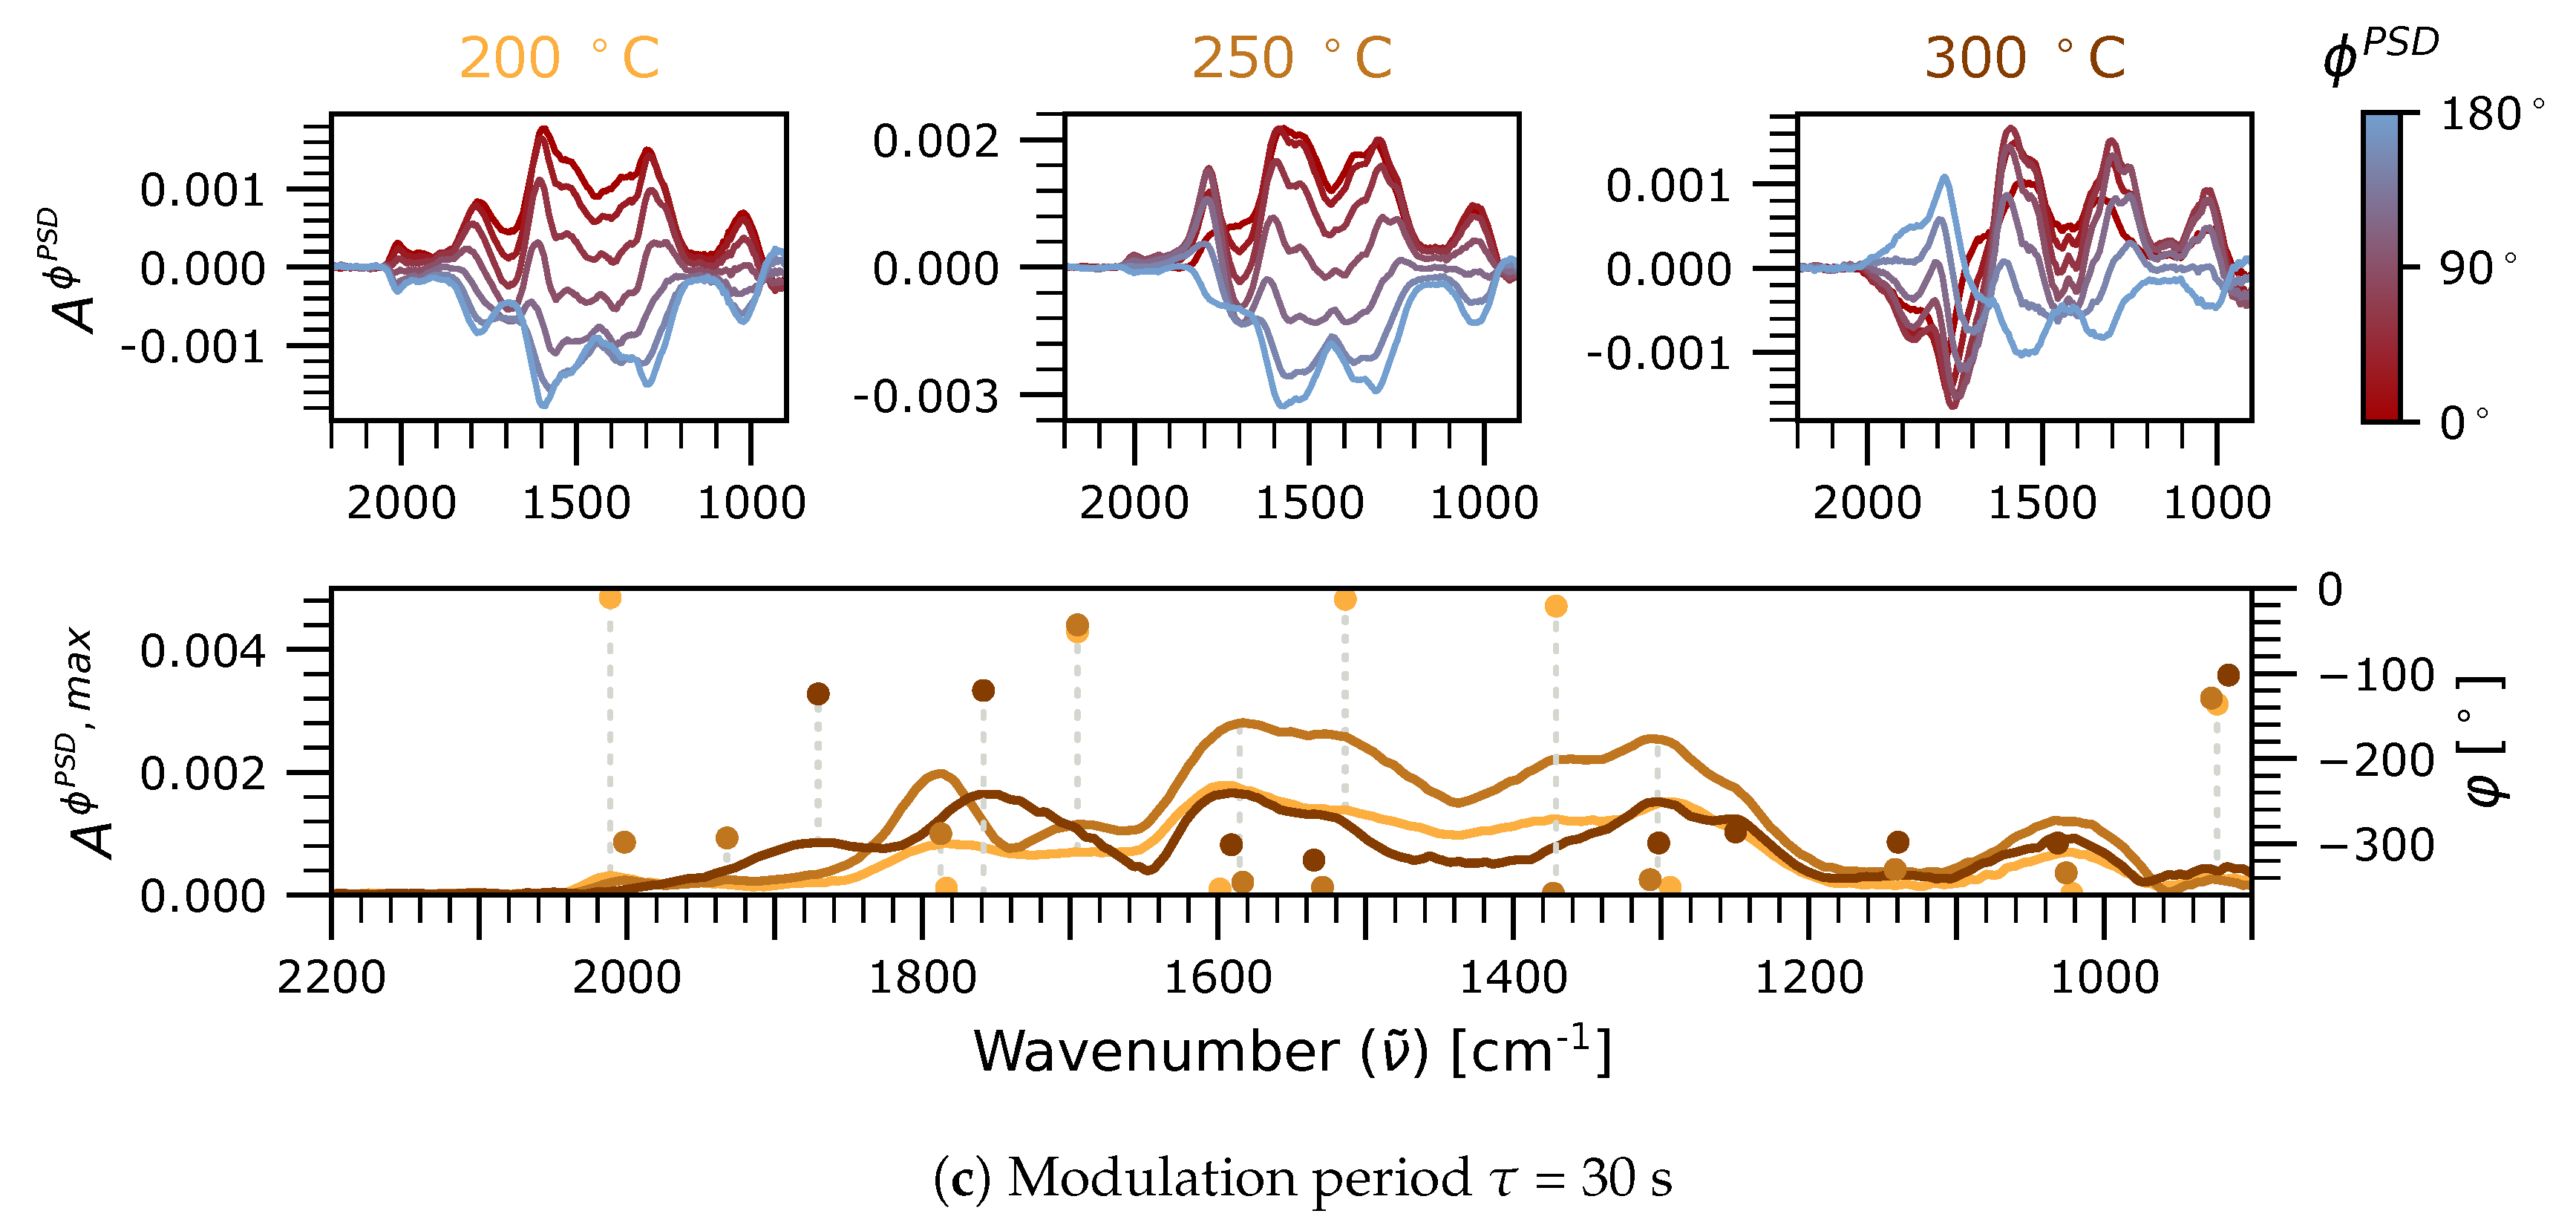
2.2.1. Phase-Resolved Spectra in the 2100–1700 cm 1 Region: Carbonyls

The ν Rh CeO 2 (C=O) vibration ascribed to the peak at 1744 cm 1 during steady-state conditions (see Figure 1b) is presumably observed in all MES experiments around 1750 cm 1 , with a prominent amplitude for temperatures above 200 °C. However, in the PSD plots a clear split of the peak is seen. Furthermore, the composite plots show either several distinct peaks, for example at 200 °C in Figure 3b, or a broad combined peak with or without clear shoulder peaks. This evidences that the peak appearing as a single vibration in the steady-state hydrogenation measurements actually consists of at least two separate vibrations, giving rise to peaks approximately at 1800 and 1700 cm 1 that are out of phase with each other. Presumably, these vibrations belong to two separate species of which the one at 1700 cm 1 is the one previously assigned to be ν Rh CeO 2 (C=O) [16]. As for the peak at 1800 cm 1 , due to its low wavenumber, it is expected to correspond to CO in a hollow [19,20] or hollow-like site (h-CO). Considering the convoluted peak in more detail, it seems that it is primarily composed of the h-CO species. The peak increases when the temperature is increased from 200 to 250 °C and declines upon further increase to 300 °C compared to the ν Rh CeO 2 (C=O). One mechanistic interpretation is that CO accumulates on Rh due to an increasing rate of formation when the temperature is increased from 200 to 250 °C but the further increase to 300 °C governs the CO desorption rate more, which results in a decreasing coverage of h-CO. Supportingly, this coincides with the formation of CO (g) at 300 °C. This suggests that h-CO on Rh, possibly via a short lived monodentate CO ad-species (m-CO), is the precursor for product CO. However, the h-CO peak shows a minor shift towards lower wavenumbers when the temperature is increased from 200 to 250 °C, whereas the further increase to 300 °C results in a major shift. This is most apparent for the shorter modulation periods of 30 and 60 s (Figure 3b,c). In contrast to h-CO on an extended ideal Rh surface such as the Rh(111), the peak shifts towards lower wavenumber with increasing coverage. This suggests that the Rh-CeO 2 system with small Rh nanoparticles present hollow-like Rh environments sufficiently separated from each other such that lateral adsorbate–adsorbate interactions are less pronounced. Instead, the shift could be due to changes of the Rh site environment possibly linked to change in cerium oxidation state or changed (relative) population of different hollow-like Rh sites. Another mechanistic explanation is the formation of a hydroxycarbonyl species on Rh, i.e., CO−Rh−OH [21]. The assignments for carbonyl vibrations are given in Table 1.
Regarding the phase delay of the carbonyls, i.e., their relative time to reach maximum accumulation, the convolution of the peaks makes the sequencing of formation events complicated. As the amplitude of a peak is affected by its neighboring peaks, the true phase delays can hardly be obtained. Despite this, a few conclusions are still possible to draw. At 200 °C, the ν Rh CeO 2 (C=O) appears before h-CO, which could be interpreted as CO forms at Rh-CeO 2 sites and then moves to Rh sites. However, as the Rh and Rh-CeO 2 sites are of two separate kinds, the carbonyl accumulation rates may be non-correlated. Even if the CO formation on the Rh and Rh-CeO 2 sites both might origin from an initial reaction step, the phase delay of the ν Rh CeO 2 (C=O) could be lower due to several reasons, e.g., a fewer number of such sites to occupy, a higher CO 2 uptake, and/or a relatively higher catalytic activity. Although it is intuitively possible that CO forms more easily at the Rh-CeO 2 sites and later migrates to Rh sites, further evidence would be needed to conclude (or disregard) this interpretation.

2.2.2. Phase-Resolved Spectra in the 1700–800 and 3700–2700 cm 1 Regions: Formates, Hydroxyls, and Carbonates

While present on the catalyst, formates show no clear response to the modulation for the 120 and 60 s period measurements in the 1700–800 cm 1 region, putting their participation in the hydrogenation reaction pathway into question. However, in the PSD plots for τ = 120 s, minor peaks at approximately 1550 and 1300 cm 1 can be seen in Figure 3 and the C−H bond vibrations ν (CH) at ∼2850 cm 1 and a combination band of δ (CH)+ ν as (OCO) at ∼2950 cm 1 are visible in Figure 4. Together, these could correspond to HCOO at (non-reduced) CeO 2 [18]. The HCOO on the CeO 2 δ seems to occur during all temperatures for the 30 s measurement. Keeping in mind the weak C−H band(s) at steady-state conditions (Figure 1), this possibly signifies either a low coverage of formates or that only a minor part of the formates are active species. The weak formate peaks would then become obscured by the larger peaks at approximately 1460 and 1390 cm 1 that either has a more pronounced extinction or represents a larger population of responding molecules.
The mentioned two peaks at around 1460 and 1390 cm 1 are challenging to assign. According to Li et al., peaks at 1489 and 1390 cm 1 may arise due to formation of inorganic carboxylates [23]. This assignment is questionable due to the small splitting and in fact the authors previously assigned carboxylates to one peak at 1506 cm 1 for its asymmetric vibration and a (weak) peak at 1310 cm 1 for the symmetric vibration [15] referencing to studies on Pt/ceria catalysts by Jin et al. [24]. Instead, the peaks could correspond to monodentate carbonate (m-CO 3 ) or polydentate carbonate (p-CO 3 ), for which the low ν a s s split would rather suggest the polydentate configuration [25,26,27,28]. As shown in our previous study, CeO 2 is expected to alternate between a partially reduced and oxidized state during the H 2 modulation [13]. As such, the removal of surface oxygen may cause some of the b-CO 3 to lose coordination and reconfigure into m-CO 3 while some achieve a higher coordination creating p-CO 3 . Hypothetically, the response from the b-CO 3 consumption is expected to occur prior the response for m-CO 3 /p-CO 3 formation, which should appear as a lower phase delay for b-CO 3 consumption than for m-CO 3 /p-CO 3 formation. However, this is not the case. Based on the experiment with τ = 120 s, the phase delay for b-CO 3 formation ( φ (b-CO 3 )) is ≈ 260°. To represent b-CO 3 consumption, this value should be corrected with half a period as φ (b-CO 3 )-180°. Thus, the phase delay for b-CO 3 consumption is ≈ 80° for b-CO 3 , which should be compared with the phase delay for p-CO 3 formation ( φ (p-CO 3 )) of ≈ 30°. Hence, it is likely that p-CO 3 originates from CO 2 adsorption rather than b-CO 3 reconfiguration. The assignments for carbonyl vibrations are given in Table 2.

2.3. Significance of Adsorbed HCOO, CO, and CO 3 as Reaction Intermediates

The two most common reaction pathways proposed for the CO 2 methanation over supported metal catalysts are the formate and carbon monoxide routes where HCOO and CO ad-species constitute the primary reaction intermediate, respectively. Without claiming a definite answer to whether these, or another species, is the more likely intermediate for methanation over Rh/CeO 2 , the presented MES-PSD results advance the understanding of these species and provide useful insights to the behavior of the catalyst, which may inspire further explorations.
It is clear that, during hydrogenation conditions, a couple of formates and a variety of carbon monoxide and carbonate ad-species are present on the catalyst. As they all respond to the H 2 stimulus, no one species should at first sight be ruled out as potential intermediate in the methanation reaction. However, with reference to previous studies, the observed response of the HCOO ad-species is surprisingly weak. Instead of being part of the reaction sequence, the formate responses could well stem from removal and regeneration of HCOO adsorption sites during CeO 2 redox processes. Thus, one cannot unambiguously state whether the adsorbed HCOO are important reaction intermediates although present measurements suggest they are more likely associated with (slow) side reactions. Likewise, for the different carbonates whose coordination changes with varying oxidation state of CeO 2 , their observed responses may also be related primarily to CeO 2 redox processes. Further, as for the potential of carbonates being involved in the reaction, these are often considered too stable to show any significant participation. As expected from previous studies, though, CO 2 or some hydrogenation products can re-oxidize the CeO 2 phase of the Rh/CeO 2 catalyst [13]. Overall, this suggests that carbonates should not be ruled out as species directly involved in the hydrogenation mechanism. A plausible reaction step is that a ceria surface vacancy alleviated by the hydrogenation reaction is filled by an oxygen from a dissociating carbonate species. Similar mechanisms have been proposed for other catalysts [30].
Finally, as for the case of CO surface complexes, their strong responses to the H 2 stimulus strengthens the idea of them being important reaction intermediates. Potentially, the reaction could follow the carbide pathway, which is commonly attributed to Ni based methanation catalysts [5]. In this pathway, CO 2 first dissociates to form adsorbed CO that then decomposes and forms carbon (C) on the surface. The carbon is then sequentially hydrogenated into CH 4 . However, this pathway cannot in full be followed by IR spectroscopy and would need to be strengthened by complementary techniques. One should be careful, however, and take into account that CO (g) is also formed as a side product over the catalyst. Hence, the activity of CO ad-species is at least in part related to formation CO (g) rather than desired CH 4 (g). The start of the CO (g) formation when the temperature is raised to 300–350 °C [9] may simply be due to a decrease in CO adsorption strength.

3. Materials and Methods

3.1. Catalyst Preparation and Characterization

A Rh/CeO 2 catalyst with 5.9 wt.% Rh was prepared by incipient wetness impregnation using a precursor of 10 wt.-% Rh(NO 3 ) in nitric acid (Sigma-Aldrich, Saint Louis, MO, USA) and CeO 2 powder (99.5 H.S.A 514, Rhône-Polenc, La Rochelle, France). The sample was calcined in static air at 550 °C for 1 h (5 °C/min).
The specific surface area of the catalyst was determined by nitrogen adsorption at 77 K (Micromeritics Tristar 3000, Norcross GA, USA) using the Brunauer–Emmett–Teller (BET) method. Prior to the measurement, the sample was dried under nitrogen flow at 100 °C for 1 h and then at 250 °C for 4 h. The specific BET area was measured to be 130 m 2 /g.
The crystal structure of the catalyst was studied by powder X-ray diffraction (XRD) using a Bruker AXS D8 ADVANCE diffractometer (Billerica, MA, USA) with Cu-K α radiation equivalent to 0.15418 nm. The diffraction data were recorded in the 2 θ range of 20–70° with incremental steps of 0.041° for 30 min.
X-ray fluorescence spectrometry was performed using a PANalytical Axios spectrometer (Malvern Panalytical B.V., Almelo, the Netherlands), using a Rh Anode, to determine the content of elemental Rh in the as-prepared sample. The powder sample was analyzed in He atmosphere in a plastic cup (P1) on a 6 μ m polypropylene foil. For quantification, a calibration with solid standard samples from PANnalytical (Omnian package) was used. The Rh content of the sample was measured to be 5.9 wt.-% with an absolute error of 0.07%.

3.2. Modulation Excitation Spectroscopy (MES) Measurements

The Rh/CeO 2 catalyst was diluted to 5 wt.% in KBr in order to increase the infrared transmissivity. The sample was pre-treated at 350 °C with a flow consisting of 2 vol.% O 2 for 10 min, followed by 5 vol.% H 2 for 10 min to remove carbonaceous contaminants and reduce the Rh phase.
The MES measurements were carried out by exposing the sample to a constant flow of 0.5 vol.% CO 2 while pulsing H 2 into the feed in a square wave fashion (0–2 vol.%) by the use of fast-switch valves (Valco, VICI). Two factors were varied: temperature (T = 200, 250 and 300 °C) and period time of the H 2 pulses ( τ = 30, 60 and 120 s). A rather high total flow of 200 mLn/min was used to compensate for the cell’s dead volume and achieve a reasonable low residence time. The pulse sequence were initiated at two different starting conditions: (i) with no prior hydrogenation reaction but only CO 2 adsorption; and (ii) with prevailing steady-state CO 2 hydrogenation with 2 vol.% H 2 . In all measurements, Ar was used as carrier gas.
During the pulse sequence, infrared spectra were recorded by diffuse reflectance infrared spectroscopy (DRIFTS) using a Praying Mantis cell with a high-temperature reaction chamber (Harrick), equipped with KBr windows, and a VERTEX v80 spectrometer (Bruker). To achieve a high time resolution (0.476 s), the scanner velocity was set to 80 kHz, and each spectrum consisted of four accumulations with a spectral resolution of 4 cm 1 . The low amount of accumulations was compensated for in the PSD study by the accumulation and averaging of repeating steps.

3.3. Data Analysis by Phase Sensitive Detection (PSD)

To handle shifts in the spectral baseline caused by the sample redox processes, a baseline correction was performed on the obtained spectra using the asymmetric linear least squares method [31]. Then, phase demodulation was applied to separate active species from spectators and to more easily place their responses in a sequential order. The phase demodulation was performed by using an offline lock-in amplifier mathematically described by Equation (3) [32,33,34]. Here, A ( ν ˜ , t ) is the amplitude of the recorded IR data in regards to its wavenumber, ν ˜ , and point in time, t. The sine function corresponds to the modulation out of which k ω is the frequency of the modulation and τ is the modulation period. The so-called control angle, θ k PSD , is an operator added to deduce the out-of-phase angle of the response.
A k ϕ k PSD ( ν ˜ ) = 2 τ 0 τ A ( ν ˜ , t ) sin ( k ω t + ϕ k PSD ) d t
The initial build-up of adsorbates was excluded from the analysis by only treating data for repeatable periodic oscillation of the amplitudal signals with Equation (3). Furthermore, the signal-to-noise ratio was improved by performing the integration over several periods after the constant oscillation was first obtained. Finally, the phase delays ( φ ) of the responses were obtained by Equation (4).
φ = 2 π arg max ϕ k PSD A k ϕ k PSD ( ν ˜ )
Given that a square-wave can be expressed as an infinite number of odd harmonics (see Equation (5)), one may study several harmonics from a single square wave experiment. However, as only the fundamental frequency ( k = 1 ) is presented in this work, A k = 1 ϕ k = 1 PSD is implicitly referred to as A ϕ PSD . A correction for the square-wave to sinusoidal is given by Equations (6) and (7) [34].
x ( t ) = 4 π n = 1 sin [ ( 2 n 1 ) ω t ] 2 n 1 , k = 2 n 1
π 4 ( 2 n 1 ) A 2 n 1 SW = A sin | ω = ( 2 n 1 ) ω
φ 2 n 1 SW = φ sin | ω = ( 2 n 1 ) ω

4. Conclusions

The employed infrared MES-PSD approach shows that, for a Rh/CeO 2 catalyst, several carbonyl, carbonate, and formate ad-species respond to varying degree upon H 2 modulation during CO 2 methanation conditions. The different CO ad-species are likely intermediates for the reaction products CO (g) and CH 4 (g) but their individual contributions to the respective formations can at this stage not be unambiguously ascertained. However, the presence of active CO species even at temperatures without CO (g) formation suggests that CH 4 is formed by a carbonyl based reaction route, such as the carbide pathway. The consumption/formation of carbonates may primarily be linked to the reduction and oxidation of the CeO 2 surface, although their participation as reaction intermediates should not be ruled out. While formate is present on the catalyst during CO 2 hydrogenation, its weak response to the modulation provides no evidence for it being a plausible reaction intermediate.

Supplementary Materials

The following are available online at https://www.mdpi.com/2073-4344/10/6/601/s1, Figure S1: XRD.

Author Contributions

Conceptualization, P.-A.C.; methodology, F.H.; formal analysis, A.S. and F.H.; resources, A.S.; writing—original draft preparation, F.H.; writing—review and editing, A.S., M.S., and P.-A.C.; and supervision, P.-A.C. All authors have read and agreed to the published version of the manuscript.

Funding

This research was funded by the Knut and Alice Wallenberg foundation through the project “Atomistic design of Catalysts” (No. 2015.0058) and the Swedish Research Council through the Röntgen-Ångström collaboration “Synergistic development of X-ray techniques and applicable thin oxides for sustainable chemistry” (No. 2017-06709).

Acknowledgments

Competence Centre for Catalysis, which is hosted by Chalmers University of Technology and financially supported by the Swedish Energy Agency and the member companies: AB Volvo, ECAPS AB, Johnson Matthey AB, Preem AB, Scania CV AB, Umicore AG & Co. KG, and Volvo Car Corporation AB.

Conflicts of Interest

The authors declare no conflict of interest.

References

  1. Orecchini, F. The era of energy vectors. Int. J. Hydrog. Energy 2006, 31, 1951–1954. [Google Scholar] [CrossRef]
  2. Utgikar, V.P.; Thiesen, T. Safety of compressed hydrogen fuel tanks: Leakage from stationary vehicles. Technol. Soc. 2005, 27, 315–320. [Google Scholar] [CrossRef]
  3. Pasman, H.J.; Rogers, W.J. Safety challenges in view of the upcoming hydrogen economy: An overview. J. Loss Prev. Process Ind. 2010, 23, 697–704. [Google Scholar] [CrossRef]
  4. San Marchi, C.; Hecht, E.; Ekoto, I.; Groth, K.; LaFleur, C.; Somerday, B.; Mukundan, R.; Rockward, T.; Keller, J.; James, C. Overview of the DOE hydrogen safety, codes and standards program, part 3: Advances in research and development to enhance the scientific basis for hydrogen regulations, codes and standards. Int. J. Hydrog. Energy 2017, 42, 7263–7274. [Google Scholar]
  5. Vogt, C.; Monai, M.; Kramer, G.J.; Weckhuysen, B.M. The renaissance of the Sabatier reaction and its applications on Earth and in space. Nat. Catal. 2019, 2, 188–197. [Google Scholar]
  6. Frontera, P.; Macario, A.; Ferraro, M.; Antonucci, P. Supported catalysts for CO2 methanation: A review. Catalysts 2017, 7, 59. [Google Scholar] [CrossRef]
  7. Barrientos, J.; Lualdi, M.; Suárez París, R.; Montes, V.; Boutonnet, M.; Järås, S. CO methanation over TiO2-supported nickel catalysts: A carbon formation study. Appl. Catal. A Gen. 2015, 502, 276–286. [Google Scholar]
  8. Karelovic, A.; Ruiz, P. CO2 hydrogenation at low temperature over Rh/γ-Al2O3 catalysts: Effect of the metal particle size on catalytic performances and reaction mechanism. Appl. Catal. B Environ. 2012, 113–114, 237–249. [Google Scholar] [CrossRef]
  9. Martin, N.M.; Velin, P.; Skoglundh, M.; Bauer, M.; Carlsson, P.A. Catalytic hydrogenation of CO2 to methane over supported Pd, Rh and Ni catalysts. Catal. Sci. Technol. 2017, 7, 1086–1094. [Google Scholar] [CrossRef] [Green Version]
  10. Jacquemin, M.; Beuls, A.; Ruiz, P. Catalytic production of methane from CO2 and H2 at low temperature: Insight on the reaction mechanism. Catal. Today 2010, 157, 462–466. [Google Scholar]
  11. Luo, L.; Li, H.; Peng, Y.; Feng, C.; Zeng, J. Rh-Based Nanocatalysts for Heterogeneous Reactions. ChemNanoMat 2018, 4, 451–466. [Google Scholar] [CrossRef]
  12. Martin, N.M.; Hemmingsson, F.; Wang, X.; Merte, L.R.; Hejral, U.; Gustafson, J.; Skoglundh, M.; Meira, D.M.; Dippel, A.C.; Gutowski, O.; et al. Structure–function relationship during CO2 methanation over Rh/Al2O3 and Rh/SiO2 catalysts under atmospheric pressure conditions. Catal. Sci. Technol. 2018, 8, 2686–2696. [Google Scholar] [CrossRef] [Green Version]
  13. Martin, N.M.; Hemmingsson, F.; Schaefer, A.; Ek, M.; Merte, L.R.; Hejral, U.; Gustafson, J.; Skoglundh, M.; Dippel, A.C.; Gutowski, O.; et al. Structure–function relationship for CO2 methanation over ceria supported Rh and Ni catalysts under atmospheric pressure conditions. Catal. Sci. Technol. 2019, 9, 1644–1653. [Google Scholar] [CrossRef] [Green Version]
  14. Müller, P.; Hermans, I. Applications of Modulation Excitation Spectroscopy in Heterogeneous Catalysis. Ind. Eng. Chem. Res. 2017, 56, 1123–1136. [Google Scholar] [CrossRef]
  15. Li, C.; Sakata, Y.; Arai, T.; Domen, K.; Maruya, K.i.; Onishi, T. Carbon monoxide and carbon dioxide adsorption on cerium oxide studied by Fourier-transform infrared spectroscopy. Part 1.—Formation of carbonate species on dehydroxylated CeO2, at room temperature. J. Chem. Soc. Faraday Trans. 1 1989, 85, 929–943. [Google Scholar] [CrossRef]
  16. Kiennemann, A.; Breault, R.; Hindermann, J.P.; Laurin, M. Ethanol promotion by the addition of cerium to rhodium–silica catalysts. J. Chem. Soc. Faraday Trans. 1 1987, 83, 2119–2128. [Google Scholar]
  17. Trautmann, S.; Baerns, M. Infrared Spectroscopic Studies of CO Adsorption on Rhodium Supported by SiO2, Al2O3, and TiO2. J. Catal. 1994, 150, 335–344. [Google Scholar] [CrossRef]
  18. Araiza, D.G.; Gómez-Cortés, A.; Díaz, G. Reactivity of methanol over copper supported on well-shaped CeO2: A TPD-DRIFTS study. Catal. Sci. Technol. 2017, 7, 5224–5235. [Google Scholar] [CrossRef]
  19. Beutler, A.; Lundgren, E.; Nyholm, R.; Andersen, J.; Setlik, B.; Heskett, D. Coverage- and temperature-dependent site occupancy of carbon monoxide on Rh(111) studied by high-resolution core-level photoemission. Surf. Sci. 1998, 396, 117–136. [Google Scholar] [CrossRef]
  20. Krenn, G.; Bako, I.; Schennach, R. CO adsorption and CO and O coadsorption on Rh(111) studied by reflection absorption infrared spectroscopy and density functional theory. J. Chem. Phys. 2006, 124, 144703. [Google Scholar] [CrossRef]
  21. Kusama, H.; Bando, K.K.; Okabe, K.; Arakawa, H. Effect of metal loading on CO2 hydrogenation reactivity over Rh/SiO2 catalysts. Appl. Catal. A Gen. 2000, 197, 255–268. [Google Scholar] [CrossRef]
  22. Fisher, I.A.; Bell, A.T. A Comparative Study of CO and CO2 Hydrogenation over Rh/SiO2. J. Catal. 1996, 162, 54–65. [Google Scholar] [CrossRef]
  23. Li, C.; Sakata, Y.; Arai, T.; Domen, K.; Maruya, K.i.; Onishi, T. CO disproportionation at mild temperatures over partially reduced cerium oxide. J. Chem. Soc. Chem. Commun. 1991, 410–411. [Google Scholar] [CrossRef]
  24. Jin, T.; Okuhara, T.; Mains, G.J.; White, J. Temperature-programmed desorption of carbon monoxide and carbon dioxide from platinum/ceria: An important role for lattice oxygen in carbon monoxide oxidation. J. Phys. Chem. 1987, 91, 3310–3315. [Google Scholar] [CrossRef]
  25. Li, C.; Sakata, Y.; Arai, T.; Domen, K.; Maruya, K.i.; Onishi, T. Adsorption of carbon monoxide and carbon dioxide on cerium oxide studied by Fourier-transform infrared spectroscopy. Part 2.—Formation of formate species on partially reduced CeO2 at room temperature. J. Chem. Soc. Faraday Trans. 1 1989, 85, 1451–1461. [Google Scholar] [CrossRef]
  26. Lin, L.; Yao, S.; Liu, Z.; Zhang, F.; Li, N.; Vovchok, D.; Martínez-Arias, A.; Castañeda, R.; Lin, J.; Senanayake, S.D.; et al. In Situ Characterization of Cu/CeO2 Nanocatalysts for CO2 Hydrogenation: Morphological Effects of Nanostructured Ceria on the Catalytic Activity. J. Phys. Chem. C 2018, 122, 12934–12943. [Google Scholar] [CrossRef]
  27. Binet, C.; Daturi, M.; Lavalley, J.C. IR study of polycrystalline ceria properties in oxidised and reduced states. Catal. Today 1999, 50, 207–225. [Google Scholar] [CrossRef]
  28. King, J.; Liu, C.; Chuang, S.S.C. In situ infrared approach to unravel reaction intermediates and pathways on catalyst surfaces. Res. Chem. Intermed. 2019, 45, 5831–5847. [Google Scholar] [CrossRef]
  29. Li, C.; Domen, K.; ichi Maruya, K.; Onishi, T. Spectroscopic identification of adsorbed species derived from adsorption and decomposition of formic acid, methanol, and formaldehyde on cerium oxide. J. Catal. 1990, 125, 445–455. [Google Scholar] [CrossRef]
  30. Ye, J.; Liu, C.; Mei, D.; Ge, Q. Active Oxygen Vacancy Site for Methanol Synthesis from CO2 Hydrogenation on In2O3(110): A DFT Study. ACS Catal. 2013, 3, 1296–1306. [Google Scholar] [CrossRef]
  31. Eilers, P.H.; Boelens, H.F. Baseline correction with asymmetric least squares smoothing. Leiden Univ. Med. Cent. Rep. 2005, 1, 5. [Google Scholar]
  32. Baurecht, D.; Fringeli, U.P. Quantitative modulated excitation Fourier transform infrared spectroscopy. Rev. Sci. Instrum. 2001, 72, 3782–3792. [Google Scholar]
  33. Baurecht, D.; Porth, I.; Fringeli, U. A new method of phase sensitive detection in modulation spectroscopy applied to temperature induced folding and unfolding of RNase A. Vib. Spectrosc. 2002, 30, 85–92. [Google Scholar]
  34. Urakawa, A.; Bürgi, T.; Baiker, A. Sensitivity enhancement and dynamic behavior analysis by modulation excitation spectroscopy: Principle and application in heterogeneous catalysis. Chem. Eng. Sci. 2008, 63, 4902–4909. [Google Scholar] [CrossRef]
Figure 1. Steady-state in situ infrared spectra for a Rh/CeO 2 catalyst at different temperatures in the C−O bond region 2200–800 cm 1 during (a) CO 2 adsorption and (b) hydrogenation and in the full measured region with a zoom at the C−H bond region 3000–2550 cm 1 during hydrogenation (c).
Catalysts 10 00601 g001
Figure 2. Modulation excitation spectroscopic measurement of CO 2 hydrogenation over a Rh/CeO 2 catalyst at 300 °C showing: (a) the imposed H 2 concentration stimulus with period τ = 120 s; (b) collected background subtracted in situ infrared spectra; and (c) collected background subtracted in situ infrared difference spectra where the first spectrum was subtracted from each remaining spectrum in the full measured range 3900–800 cm 1 .
Catalysts 10 00601 g002
Figure 3. Graphical representation of phase sensitive detection (PSD) analysis results for CO 2 hydrogenation over Rh/CeO 2 at 200, 250, and 300 °C and different H 2 modulation period lengths ( τ ) of 120, 60, and 30 s (a, b and c respectively). Top rows: PSD plots showing amplitude ( A ϕ PSD ) versus wavenumber for demodulated spectra within 0 ° θ PSD 180 ° . Bottom rows: Composite plots showing maximum amplitude ( A ϕ PSD , max ) at each wavenumber in the period of 0 ° θ PSD 360 ° (▬) together with the phase delay ( φ ) of the peaks (•) and visual guides (---).
Catalysts 10 00601 g003aCatalysts 10 00601 g003b
Figure 4. Phase resolved spectra in the 3800–2700 cm 1 region ( 0 ° θ PSD 180 ° ), showing responding hydroxyl and C−H vibrations.
Catalysts 10 00601 g004
Table 1. Infrared peak assignments for the transient experiments in the 2100–1700 cm 1 region. The wavenumber values are approximated (±10 cm 1 ) due to fluctuations during the time series and between the different experiments.
SpeciesSiteVibrationWavenumberReference
[cm 1 ]
RhCe-CORh-CeO 2 ν (C=O)1700[16]
h-CORh ν (C=O)1800[20]
br-CORh ν (C=O)1875[22]
m-CORh ν (C=O)2010[22]
Table 2. Infrared peak assignments for the transient experiments in the 1700–800 cm 1 region. The wavenumber values are approximated (±10 cm 1 ) due to fluctuations during the time series and between the different experiments.
SpeciesSiteVibrationWavenumberReference
[cm 1 ]
p-CO 3 CeO 2 ν as (OCO)1460[27]
ν s (OCO)1390[27]
b-CO 3 CeO 2 ν as (OCO)1590[15]
ν s (OCO)1280[15]
b-HCOOCeO 2 δ ν as (OCO)1550[18]
ν s (OCO)1300[18]
ν (CH)2850[18]
δ (CH)+ ν as (OCO)2950[18,27,29]

