The Characterisation of Electrodeposited MoS2 Thin Films on a Foam-Based Electrode for Hydrogen Evolution


1
Faculty of Chemistry and Geosciences, Vilnius University, Naugarduko str. 24, 03225 Vilnius, Lithuania
2
Institute of Applied Physics of ASM, 5 Academiei str., 2028 Chisinau, Moldova
*
Author to whom correspondence should be addressed.
Catalysts 2020, 10(10), 1182; https://doi.org/10.3390/catal10101182
Submission received: 21 September 2020
/
Revised: 2 October 2020
/
Accepted: 6 October 2020
/
Published: 14 October 2020
(This article belongs to the Special Issue Novel Extended Surface Electrocatalysts)
Abstract
:Molybdenum sulphide is an emerging precious-metal-free catalyst for cathodic water splitting. As its active sites catalyse the Volmer hydrogen adsorption step, it is particularly active in acidic media. This study focused on the electrochemical deposition of MoS2 on copper foam electrodes and the characterisation of their electrocatalytic properties. In addition, the electrodeposition was modified by adding a reducing agent—sodium hypophosphite—to the electrolyte. To reveal the role of hypophosphite, X-ray photoelectron spectroscopy (XPS) analysis was carried out in addition to scanning electron microscopy (SEM) and energy-dispersive X-ray spectroscopy (EDX). MoS2 films, electrodeposited at various charges passed through the cell (catalyst loadings), were tested for their catalytic activity towards hydrogen evolution in 0.5 M H2SO4. Polarisation curves and Tafel slope analysis revealed that the electrodeposited MoS2 films are highly active. Namely, Tafel slopes fell within the 40–50 mV dec−1 range. The behaviour of as-deposited films was also evaluated by electrochemical impedance spectroscopy over a wide overpotential range (0 to −0.3 V), and two clear time constants were distinguished. Through equivalent electrical circuit analysis, the experimental data were fitted to the appropriate model, and the obtained values of the circuit components were examined as a function of overpotential. It was found that the addition of NaH2PO2 into the electrodeposition solution affects the intrinsic activity of the material. Finally, a method is proposed to approximate the number of active sites from impedance data.
1. Introduction
Within the field of renewable energy generation, storage and transportation, H2 is considered a feasible energy carrier due to its significant gravimetric energy density when compared to carbon-based fuels [1]. However, the most widely used industrial-scale hydrogen production method currently is the steam reforming process, where hydrocarbons react with steam, yielding H2 and CO2 [2]. An excellent alternative—electrochemical water splitting—is a phenomenon that has been observed since as early as 1789 [3,4]. With the application of sufficient overpotential on an electrode in an aqueous solution, the H2O molecules spontaneously split into H2 and O2. The cathodic half-reaction is called the hydrogen evolution reaction (HER) [5].
The mechanism of HER in acidic solutions consists of three steps: electrochemical hydrogen adsorption (Volmer reaction), followed by electrochemical (Heyrovsky reaction) and/or chemical (Tafel reaction) hydrogen desorption [6]. The rate of HER therefore depends on the adsorption energy of atomic hydrogen. The so-called “volcano plots” were the first attempt to systemically show correlation between M-H bond energy and HER rate, in terms of exchange current density, and explained the empirically-observed fact that platinum is the best heterogeneous HER catalyst [7,8,9]. Contemporary volcano plots exchange the M-H bond energy for adsorption energy (ΔGad), calculated by density function theory (DFT) [10], but show the same general trend. Although the theory is sound, difficulties arise, for example, when characterising easily oxidising metals [11].
With this knowledge-based approach in mind, research into feasible alternatives to platinum for HER electrocatalysis has focused on noble-metal-free catalysts: transition metal sulphides, selenides, phosphides, nitrides and carbides, all of which have been comprehensively covered in multiple review papers [12,13,14,15]. In particular, it was found that the free adsorption energy of hydrogen onto MoS2 was close to that of Pt [16]. This led to further application of MoS2 as a HER catalyst. The catalytically active sites were found to be the edge sites (ΔG0H ~ 0.115 eV), sulphur vacancies (ΔG0H ~ −0.095 eV) and grain boundaries [17,18]. Nanoclusters of [Mo3S13]2− demonstrated excellent HER catalytic activity [19]. The structure of amorphous MoS2−x was later elucidated to consist of such [Mo3S13]2− building blocks, joined into a polymeric chain; the implications of this structure are that amorphous MoS2−x can corrode cathodically, shortening the polymeric chain, but also creating new unsaturated MoIV active sites for H2 evolution [20].
MoS2 films and structures can be obtained by numerous methods, the pros and cons of which have been considered extensively in review papers [21,22]. Among those methods, electrochemical deposition is of particular interest, as it is a relatively inexpensive and fast way to obtain MoS2 films on electrode surfaces. Cathodic electrodeposition from an ammonium tetrathiomolybdate ((NH4)2MoS4) solution yields amorphous MoS2−x films, which can attain crystallinity upon annealing [23,24]. Crystalline MoS2 materials are typically more electrochemically stable [25], but amorphous films have greater HER electrocatalytic activity due to their rough, nanostructured surface morphology, and consequently higher density of defect (active) sites [26,27].
Different methods to improve the catalytic activity of transition metal dichalcogenides such as MoS2 have been proposed. Doping with lithium, transition metals or even anionic nitrogen has been shown to have various effects on MoS2, including an enhanced catalytic activity when compared with the unmodified material [28,29,30,31]. Some methods focus on nanostructurisation to reveal a maximum amount of active sites [32], while others combine MoS2 with electro- or photoactive materials to form functional composites with combined properties [33].
Earlier, our group reported on the HER electrocatalytic activity of electrodeposited MoS2−x films and the application of electrochemical impedance spectroscopy (EIS) to characterise them [34]. EIS can provide kinetic information additional to steady-state measurements and allows the determination of reaction rate constants [6], charge transfer kinetics [35] and double layer capacitance, which is proportional to the electrocatalytically active surface area [36,37]. As the method itself is non-destructive, it excels in the characterisation of heterogeneous electrocatalysis.
As a continuation of our previous investigations on MoS2 synthesis and application for HER electrocatalysis, this study focused on the aspects of engineering of an electrode with a relatively large geometric surface area and increasing the intrinsic per-site activity. In addition, we investigated the influence of sodium hypophosphite (NaH2PO2) as a chemical reducing agent on electrodeposition, the films’ structure and their HER activity.
2. Results
2.1. MoS2 Electrodeposition
The electrodeposition of MoS2 films in both solutions (without and with hypophosphite) was investigated by cyclic voltammetry to establish a working potential range, where the dominating cathodic reaction is MoS42− reduction to MoS2. Firstly, CV scans were taken on a 1 cm2 surface area copper rod electrode, at potentials from −1.2 to 0.2 V vs. Ag/AgCl (Figure 1). No prominent cathodic peaks are present in these cycles due to overlaying of MoS42− reduction peaks with hydrogen evolution, which occurs across the entire potential range. At about −1 V, the cathodic current begins to increase more rapidly, which reveals that MoS42− reduction and hydrogen evolution are occurring. The addition of NaH2PO2 does not change the profile of the cycles, nor do any peaks become apparent. There is a small difference in the anodic part of the cycles, but in this system the anodic current is entirely dominated by the corrosion of the copper substrate, and the oxidation of electrodeposited MoS2. CVs performed on the Cu-foam electrodes have a slight difference in the cathodic profile of the curves. A minor increase in the current is observed with the addition of hypophosphite, but no distinguishable reductive peaks appear. A small anodic peak at −0.68 V is seen in both cases and is likely caused by rapid hydrogen desorption from the large surface area and catalyst-covered electrode. The sharp increase in oxidative current at higher anodic potentials again occurs due to above-discussed reasons.
All further research was conducted on the Cu-foam electrodes, prepared as described in Section 3.2. Galvanostatic conditions were chosen for the electrodeposition, because reductive peaks were not visible in CV, and the geometrical surface area of the substrates is uncertain. Therefore, a cathodic current of 10 mA corresponding to a potential, where intense hydrogen evolution does not yet occur, was selected. At this current, the potential settles at ~1.05 V, which is almost identical to the one we used for potentiostatic deposition in the precluding research [34]. The films were electrodeposited at increasing charges passed through the cell (from 10 to 40 C). This range was selected to encompass a wider array of film thicknesses: thinner MoS2 films (10–20 C) were expected to have better adhesion to the substrate, more resistance to delamination and more favourable electron transfer kinetics from the catalyst/solution interface to the substrate. In contrast, thicker films may exhibit poorer physical stability due to internal stresses and weaker chemical bonding to the substrate. However, the increased catalyst loading (higher charged passed) should result in better HER catalytic activity.
To relate electrodeposition parameters to catalyst loading, the films, electrodeposited for discrete amounts of charge passed, were weighed, thus measuring the mass of the MoS2 deposits. The reductive deposition of MoS2 conforms to Faraday’s law—there is a linear correlation between charge passed and mass of the electrodeposited film. Up to 0.25 mg of material is deposited per 1 C. In terms of current efficiency, this corresponds to ~32%, which is a known limit for MoS42− electroreduction [24]. However, a decrease in current efficiency was observed with increasing charge up to 40 C. This can be caused by the formation of an active electrocatalytic film, which catalyses simultaneous hydrogen evolution, and in turn inhibits MoS2 electrodeposition. The current efficiency then drops to ~23%. It must be noted that the amount of material deposited without and with NaH2PO2 is almost identical. The calculated efficiencies are slightly lower for the electrolyte with hypophosphite, but not by any significant degree. Therefore, the addition of NaH2PO2 has no effect on the kinetics or mechanism of reductive MoS2 deposition. The actual catalyst loading for films, electrodeposited for a similar amount of charge without or with hypophosphite, can be assumed to be identical. For that reason, the changes in the films’ structure, morphology and catalytic activity discussed below have to be attributed to changes in the intrinsic properties of the MoS2 films and not extrinsic parameters, e.g., catalyst loading.
2.2. Composition and Surface Morphology
The MoS2 films, electrodeposited without and with NaH2PO2 were examined by SEM, and their chemical composition was determined by EDX. A visible effect of hypophosphite is observed on the morphology of the electrodeposited MoS2 films. The deposits grow more evenly and with less apparent roughness (Figure 2). In the base electrolyte, MoS2 appears to grow in clusters of nodules, protruding from the surface and away from the substrate, but often not connecting amongst each other. This leaves empty gaps in the film and creates disorder in the structure. In contrast, the addition of NaH2PO2 causes the formation of more compact films. There are fewer disconnected nodules, and MoS2 growth occurs homogenously over a larger surface area. Overall, this change in morphology would certainly cause a decrease in the micro-level roughness of the deposits. Some cracks can be seen in the thicker MoS2 films (e.g., deposited at 30 C), which have also been observed in our previous studies, and are directly related to the thickness and consequent tensile stress of the electrodeposited films. Fewer cracks are seen for the films, electrodeposited with hypophosphite, feasibly due to the lower stress of the deposits.
Interestingly, sodium hypophosphite provides a similar effect on the electrodeposition of various transition metal alloys. For example, when depositing a Fe-W-P film, a certain concentration of NaH2PO2 in the deposition solution resulted in lower stress of the film and smaller crystallite sizes; the grain sizes decreased when the NaH2PO2 concentration was increased [38]. Similarly, for Co-Ni-P electrodeposits, the amount of NaH2PO2 in the electrodeposition solution was observed to affect the surface morphology—the surface appeared smooth and less nodular [39].
The elemental analysis showed that deposited MoS2 films are rather thin; therefore, a strong signal from the substrate material (Cu) is present in the EDX spectra (Table 1). A significant amount of oxygen is also detected in all samples, which may be due to surface oxidation that has been documented to occur, as MoS2 active sites readily oxidise when the film is left to dry in the open air.
There is no direct correlation between electrodeposition conditions and composition of MoS2 films. The deposits are sulphur-deficient, and, for those obtained from the base solution, the MoS2−x stoichiometry ranges from MoS1.72 to MoS1.87. Some difference in composition is observed for the films, electrodeposited with hypophosphite. The amount of Mo and S in atomic per cent increases with passed charge, and the background signal of the copper substrate consequently decreases. In MoS2 films, electrodeposited with hypophosphite, the Mo:S ratios are closer to the stoichiometric. The film deposited for 10 C even exhibits a sulphur surplus, which may be caused by a chemical reaction, for example the formation of copper sulphide. A small amount of phosphorus is present in the EDX spectra, but, in some cases, it was smaller than the reliable detection limit deviation. It must be concluded that there exists a possibility of phosphide incorporation into the MoS2 structure, but, if so, its amount is near the detection limit. Because the active sites of MoS2 for HER catalysis are sulphur vacancies, it can be suspected that the stoichiometry difference will have an effect on the electrocatalytic activity of these deposited films. Indeed, the research has shown that there is an optimal amount of point defects (active sites) that results in best HER catalytic activity [40].
2.3. X-ray Photoelectron Spectroscopy
X-ray photoelectron spectra were obtained for the MoS2 films, electrodeposited with and without NaH2PO2, to investigate the possible differences in their structure (Figure 3). The sulphur 2p region is determined by a single doublet corresponding to S 2p1/2 and S 2p3/2 lines that is characteristic for the presence of the 2H-MoS2 phase. For the MoS2 films, electrodeposited without NaH2PO2 (Figure 3b), the 2p3/2 maximum is seen at a binding energy of 161.9 eV, whereas deposition with hypophosphite leads to the shift of the peak position towards slightly higher energies at 162.1 eV. Another S 2p doublet was added in the model for better fitting of the spectra. A second doublet in the S 2p region has been attributed to the existence of different S-S bonds in the material (terminal and bridging bonds) [19,20]. However, in our case, the second S 2p doublet appears more similar to those that have been reported to be caused by sulphur residuals from polysulphide that may have formed in the deposition solution. Thus, it can be inferred from the spectra that the near-surface sulphur atoms exist almost entirely in one oxidation state.
Deconvolution of the Mo 3d region revealed that Mo exists in multiple oxidation states, and is coordinated by different elements (Figure 3a,c). The films electrodeposited without hypophosphite (Figure 3a) show a spectrum that is almost entirely decided by two peaks at 231.7 eV and 234.8 eV. Judging by these binding energies, these peaks likely belong to Mo6+ oxides (3d5/2 232.3–232.5 eV; 3d3/2 235.4–235.7 eV [41,42,43]). These oxides may have been electrodeposited from residual MoO42− in the deposition solution, or appeared through oxidation of uncoordinated Mo sites on the surface. The peaks deconvolute into two doublets marked Mo6+-O and Mo6+-iO in Figure 3, which also suggests that the oxide exists in different states.
The peaks at binding energies of 229.35 and 232.3 eV have been reported to correspond to Mo4+ 3d5/2 and 3d3/2 components of 2H-MoS2 (marked Mo4+-S) [44]. This, along with the previously discussed characteristic S 2p peaks, confirms the presence of the 2H-MoS2 phase. The origin of the doublet (3d5/2 230.2 eV; 3d3/2 233.2 eV) is ambiguous. Such binding energies correspond well to Mo4+ oxides [41,42], which may exist in the electrodeposited film due to reasons discussed above related to Mo6+ oxides. However, a very similar binding energy (230.76 eV) may also be attributed to an intermediate Mo oxidation state (e.g., 5+) that is only partially coordinated by sulphur (with a sulphur vacancy—active site) [20,45]. The depressed, wide peaks at a very high binding energies (234.5–237.8 eV) could not be attributed to any state of Mo and are assumed to be caused by some residual compound from the solution.
XPS analysis showed that within films, electrodeposited without NaH2PO2, molybdenum is widely coordinated by oxygen, i.e., the film contains a lot of molybdenum oxide. This is also supported by EDX analysis, where the amount of oxygen in these films was relatively large. When electrodeposition is carried out with hypophosphite, a much stronger Mo4+-S bond signal is observed. Because the S 2p signal does not change in any major way, it is assumed that the material retains the same 2H-MoS2 structure, and that the effect of NaH2PO2 on the electrochemical deposition of MoS2 is mainly targeting the suppression of Mo-O bond formation, or, conversely, the assistance of Mo-S bond formation.
2.4. Electrocatalytic Activity for HER
The most common and conventionally informative way to characterise the electrocatalytic activity of an electrode is linear sweep voltammetry (LSV) in a wide overpotential range. As MoS2 is a catalyst in acidic media, the electrodeposited films were studied by LSV in 0.5 M H2SO4. The initial potential was set close to thermodynamic equilibrium (0 V vs. SHE), and a scan rate of 2 mV s−1 was applied. A cut-off condition of 100 mA of cathodic current was set to end the scan. In this way, three scans were recorded, and the third scan was selected for analysis (Figure 4a). Note that the cathodic current on the ordinate axis has not been normalised into geometrical surface area, because it would be incorrect for such an electrode, where current density distribution does not guarantee equal HER turnover over the entire electrochemically active surface area. More discussion on this issue follows in the Section 2.5. It can be seen that MoS2 films, electrodeposited for increased passed charge (higher catalyst loading) predictably have better total activity. The onset overpotential (arbitrary, where the HER current would begin to sharply rise) is also lower for higher-loading electrodes. Thus, a MoS2 film electrodeposited from the base MoS42− solution for 10 C could reach a HER cathodic current of 100 mA at an overpotential of −0.227 V. In comparison, a film electrodeposited for 10 C in the presence of NaH2PO2 could reach −100 mA at −0.21 V, representing a 17-mV improvement. The effect of adding sodium hypophosphite into the electrodeposition solution has a prominent effect on the electrocatalytic activity of the films—their total activity generally increases. On LSV curves, this results in lower overpotentials, required to reach the same HER current. A smaller, but similar difference is observed in all cases. Because the mass of the Cu-foam MoS2 electrodes (catalyst loading) is alike, this must be caused by changes of the intrinsic activity of the film.
Two more important parameters characterising the electrocatalytic HER activity of the MoS2 films are the Tafel slope and exchange current. The Tafel slopes are shown in Figure 4b, and the corresponding values are presented in Table 2. The determined values for slopes (40–50 mV dec−1) are commonly reported for MoS2-based electrodes and materials, where HER undergoes via mixed Volmer–Heyrovsky kinetics. MoS2 films, electrodeposited with hypophosphite, have slightly lower Tafel slopes. For exchange current, only a small change of this parameter is seen upon addition of NaH2PO2 as I0 decreases in most cases. However, due to the potential variance in the geometrical surface area of Cu-foam electrodes, these values are not necessarily correct representations of the intrinsic activity of the electrodeposited films.
The electrochemical stability of electrodeposited MoS2 films was tested by a galvanostatic step technique: the cathodic current was set at incrementally increasing values (from −10 to −100 mA), and the potential response was measured for 500 s in order to approach a steady state value (Figure 5). In terms of stability, all films are stable at lower applied currents (up to −40 mA), and a slight decrease in overpotential is observed over each 500-s step. Furthermore, MoS2 films electrodeposited from the solution with hypophosphite possess worse catalytic activity at lower currents than in the absence of it, as they reach the same current density at higher overpotentials. However, at cathodic currents higher than −50 mA, the curves overlap, and the films electrodeposited with hypophosphite exhibit improved catalytic activity. These results are in line with the Tafel analysis discussed above, because these films were found to have lower Tafel slopes values, and, as a result, their catalytic activity reaches its full ability only at high applied currents or overpotentials. However, at higher cathodic currents (over −50 mA), a rapid drop in measured overpotential is observed, which indicates a loss in catalytic activity. This is likely due to the cathodic corrosion, i.e., shortening of the polymeric S-Mo-S chains by cleavage of Mo-S bonds, as described in [20]. Experimental observations support this theory, because the colourless sulphuric acid solution attained a faint yellow hue, likely due to sulphide ions dissolving into the solution.
2.5. HER Study by EIS
EIS can be an informative and non-destructive method to characterise a heterogeneous catalyst-solution interface. This method is especially useful to characterise electrodes that have an uncertain geometric surface area (such as metallic foams) based on the parameters of double-layer (Cdl) and polarisation (Cp) capacitance that are directly proportional to the electrochemically and electrocatalytically active surface area. The spectra were registered at increasingly cathodic overpotentials (0, −0.1, −0.15, −0.175, −0.2, −0.25 and −0.3 V) to obtain more data (in addition to Tafel analysis) on the kinetics of HER catalysis. Based on the results of Kramers–Kronig procedure, the system was found to be linear and stable, and spectra obtained even at high overpotentials were of good quality. The impedance of the system decreases dramatically with the increase of the overpotential (Figure 6), owing to the intensity of HER. Two semicircles become especially pronounced from −0.15 V, when hydrogen evolution begins to occur at an increasing rate (Figure 6a). At higher overpotentials, the semicircles become similar in magnitude (Figure 6b). If the spectra were to be registered at even higher overpotentials, only the high-frequency semicircle could be distinguished. The Bode plots (Figure 6c) also show two distinguishable peaks, with the low-frequency peak shrinking in magnitude when the overpotential is increased. Such behaviour of the system can be described by equivalent electric circuit (EEC) containing two time constants in the system: τHF and τLF shown in Figure 7. This EEC is commonly used to interpret EIS data for electrode processes containing adsorbed intermediate compounds, and it is often applied to model HER in both acidic and alkaline media [46]. Here, the double layer capacitance Cdl and polarisation capacitance Ca are represented by constant phase elements that account the inhomogeneity of the surface. In agreement with the previously discussed spectra, this model contains two time constants: τHF = CdlRct and τLF = CaRa. Values of CPE were recalculated into capacitance by Brug et al.’s Equation [47]:
Here, Tdl and Ta are values of the CPEdl and CPEa elements, respectively.
Although at lower overpotentials the system behaves in a moderately blocking manner (Figure 6d), the rate of HER increases rapidly, reactive resistance decreases and the system becomes almost conductive.
EIS spectra vary with amount of charge used for MoS2 film electrodeposition from the solutions with and without hypophosphite ions (Figure 8). At the same overpotential, the shape of the spectra remains identical, and two semicircles can be distinguished for all films. It means that the mechanism of HER does not change. The magnitude of the impedance spectra, however, decreases with increasing charge used for electrodeposition of MoS2. The most significant difference is obtained for the low-frequency semicircle, which, as discussed below, is correlated to the polarisation resistance and capacitance. The spectra also show that the MoS2 films which were electrodeposited with hypophosphite have lower impedance magnitudes and are thus more catalytically active.
All of the parameters of the EEC are correlated to the material’s electrocatalytic activity towards HER, and therefore their relation to the applied overpotential reveals important information about kinetics. The inverse of charge transfer resistance (1/Rct) is directly proportional to the reaction rate, assuming a simplified Volmer–Heyrovsky mechanism. The 1/Rct−ŋ plots for all studied MoS2 films (Figure 9) show that the rate of HER is generally higher when the films were electrodeposited at more charges passed for MoS2 deposition. Furthermore, addition of hypophosphite to the electrodeposition solution increases the catalytic activity of the films. The tendencies in terms of HER activity as a function of deposition charge correspond to the polarisation curves seen in Figure 4.
The measured double layer capacitance Cdl is directly proportional to the electrochemically active surface area of the electrode, and it is especially important to approximate when the geometrical surface area is uncertain. The values of Cdl also vary as a function of overpotential (Figure 10) and reach a peak at ~−0.2 V. Overall, the Cdl values of the MoS2 films, electrodeposited with hypophosphite, are larger throughout the entire overpotential range, meaning that the observed smoother surface morphology in fact results in a larger electrochemically active surface area in contact with the electrolyte. The apparent values of Cdl are on the order of 10–100 mF, which is a conceivably large value, given the vast surface area of the Cu-foam electrode and the affinity of MoS2 to adsorb H+ under these experimental conditions.
As discussed above, the low-frequency RC-element in the equivalent circuit used to fit the impedance data causes the formation of a large depressed semicircle that is strongly correlated to the applied overpotential (Figure 6 and Figure 8). It is therefore expected that the values of Ca and Ra should also change significantly. Ca, which can also be imagined as a pseudocapacitance that arises from the modulating surface coverage by adsorbed hydrogen Hads, is relatively constant until −0.2 V, after which it increases linearly with applied overpotential (Figure 11a). As it is generally assumed that with increasingly negative overpotential the surface coverage ΘH approaches to 1 [6], Ca could be expected to plateau at even larger overpotentials, but that was not observed in this experimental series. When considering the effect of hypophosphite on the electrodeposited MoS2 films, it can be seen that the values of Ca are lower than for the respective films from the base solution. This suggests that there is a change in the surface coverage by Hads when the films act electrocatalytically, but the precise kinetic reason is difficult to establish from these data alone. In addition, as the difference seems to exist only in the intermediate overpotential range and at −0.3 V, the Ca values for the respective compared MoS2 films overlap. The other component in the low-frequency RC-element—an adsorption resistance, Ra—decreases exponentially with applied overpotential, and it is the most significantly affected parameter of the system (Figure 11b). Note that here the data from 0 V are not presented, but Ra can be imagined to trend towards infinity. Ra values decrease by several magnitudes over the measured overpotential range (for example, for a MoS2 film, deposited for 30 C, a decrease from 26.1 Ω at −0.1 V to 0.09 Ω at −0.3 V is seen). Ra as a function of η begins to plateau at overpotentials larger than −0.2 V and could conceivably reach a constant value. Here, it can also be seen that the MoS2 films, electrodeposited with NaH2PO2, exhibit lower Ra values than those electrodeposited in the base solution.
All the data from the EIS fitting and calculations can be summed up in terms of time constants and their dependence on the HER overpotential. Because the time constant is a measure of the system response rate to an applied overpotential perturbation, the τHF and τLF values will be correlated to HER kinetics. The high frequency time constant τHF = Rct⋅Cdl rises until it reaches a peak value, after which it begins to decrease (Figure 12a). This tendency was also seen for the double layer capacitance (Figure 10) and is likely related to the surface coverage by Hads. At a certain overpotential, the two capacitances diverge: Ca increases, while Cdl begins to drop, and this point corresponds to the highest value of τHF. It is interesting to note that the high frequency response at low and high overpotentials is similar; the peak only occurs at ~−0.2 V, at which point hydrogen evolution is already intense with a current of up to −100 mA, as seen from polarisation experiments. The low-frequency time constant is a product of Ca and Ra, and, because of the small changes of Ca, it is completely determined by the Ra component. Like Ra, τLF decreases exponentially with overpotential by several magnitudes over the measured range (Figure 12b). At high overpotentials of −0.3 V, both τHF and τLF become comparable for all samples. For example, for the MoS2 film, electrodeposited for 10 C with NaH2PO2, τLF is 0.029 s−1, τHF is 0.0078 s−1 and τLF/τHF = 3.7. It is also apparent that films with less catalyst loading (i.e., less electrodeposition charge used for MoS2 deposition) have a faster response to perturbation (lower τLF values). In fact, these results correlate directly to the Tafel slopes presented in Table 2: the film with the lowest Tafel slope also has the lowest τLF values at the entire overpotential range. The results provide an insightful observation: although higher catalyst loading does result in increased total electrode activity, the intrinsic activity is degraded.
2.6. Turnover Frequency and Active Site Calculations
In a previous attempt to apply EIS for the approximation of the number of active sites on a MoS2 electrocatalyst, it has been shown that with certain assumptions the values of Ca obtained from impedance fitting could be used in calculations [28]. However, there the number was likely underestimated due to the low applied overpotential (−0.1 V). In theory, the surface coverage by adsorbed hydrogen approaches ΘH = 1 at highly negative overpotentials [6]. Therefore, the same analysis was done in this study in order to approximate the number of active sites on the MoS2 deposited on the Cu-foam electrodes, and to calculate the turnover frequencies.
It must be noted that both physically and mathematically the number of active sites will depend on the applied overpotential, so the following calculations were performed using the most cathodic overpotential for which experimental data were obtained in this study: −0.3 V. The following assumptions were made: hydrogen adsorption is a one-electron process, one active site adsorbs one H+ and ΘH ~≈ 1. Then, the charge needed to attain a monolayer of Hads is:
where Ca is the adsorption capacitance, η is the applied overpotential (−0.3 V).
The number of active sites is calculated from Equation (4):
It may then be inferred, from the results in Figure 11a, that at sufficiently negative overpotentials the compared MoS2 films that were electrodeposited with and without hypophosphite will have the same number of active sites. Indeed, no significant difference is seen in the values, as presented in Table 3. Na increases with electrodeposition charge as more material is deposited. The values in total for the whole electrode are on the order of 1018, which, accounting for the large geometrical surface area of the substrate, are within range of commonly reported values. In comparison, the previous application of this method resulted in Na of up to 2.8 × 10¹⁶ sites cm−2 for MoS2, electrodeposited on a Cu rod electrode [28].
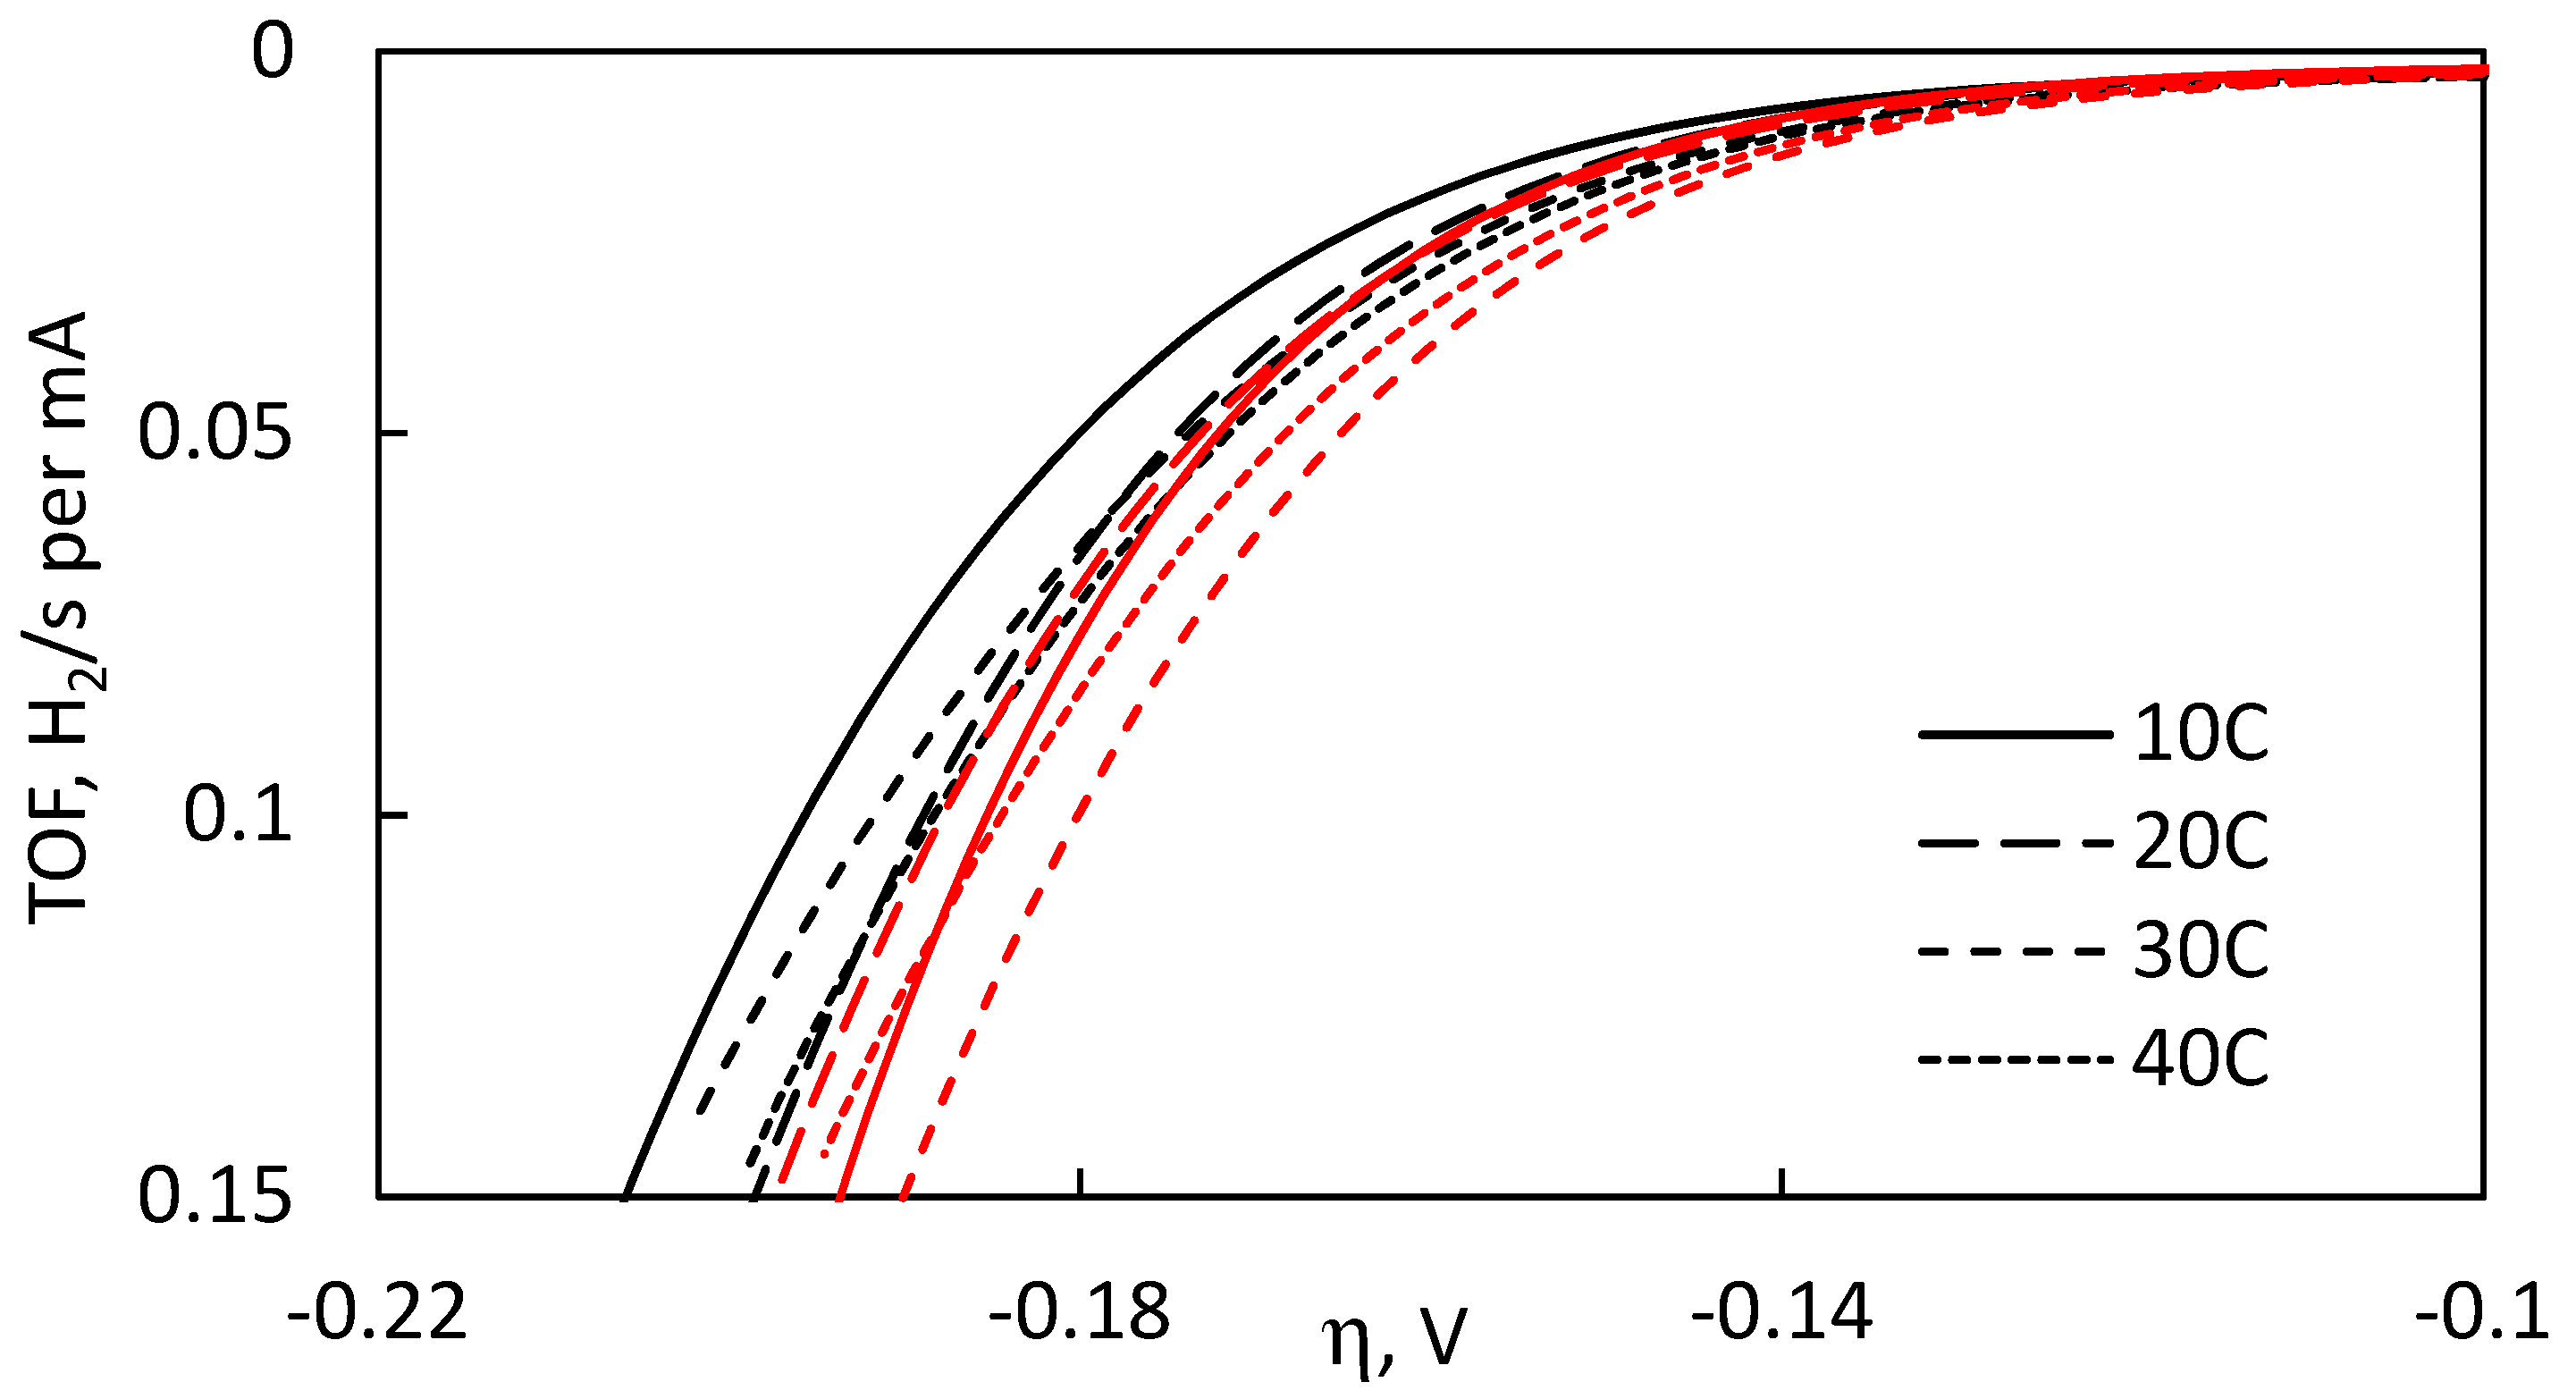
The turnover frequencies (number of hydrogen molecules evolved per site per second) were then calculated using the obtained number of active sites (Table 3). For comparison, TOFs at overpotential of −0.19 V (where experimental data were available for all measurements) are also given. Even though hydrogen evolution is vigorous and large cathodic currents are observed at this overpotential (see Figure 4a), the actual TOFs are fairly small owing to the large number of active sites. However, the turnover frequencies of MoS2 films electrodeposited with NaH2PO2 are marginally higher than those of MoS2 electrodeposited from the base solution. This again suggests that incorporation of hypophosphite into the electrodeposition solution results in catalytic MoS2 films that exhibit higher per-site activity, as the enhanced HER performance can no longer be attributed to changes in surface morphology alone.
It has been suggested that the ideal way to compare catalysts regardless of geometrical surface area is plotting the turnover frequency as a function of overpotential [48]. Therefore, Figure 13 presents these dependencies for all catalytic films examined in this study. It can be seen that the MoS2 films, electrodeposited with NaH2PO2, exhibit distinctly better electrocatalytic activity. They reach higher TOF values at lower overpotentials, which signals a more rapid hydrogen evolution performance of their active sites. The TOF values may be susceptible to error due to the method used in approximation of the number of active sites. However, regardless of possible errors in calculations, the general tendency is that using hypophosphite in the electrodeposition bath did result in enhanced catalytic performances of the deposited MoS2 films.
3. Materials and Methods
3.1. Electrolyte Preparation
Molybdenum disulphide films were electrodeposited from a tetrathiomolybdate (MoS42−/TTM) solution, containing 25 mM MoS42− and 0.1 M Na2SO4. This base solution was prepared via a chemical four-step sulphidation of molybdate reaction, as described in our previous work [34], but without additional surfactants. The pH of the solution was kept neutral at ~pH 7, to prevent precipitation of insoluble MoS3 and suppress hydrogen evolution during electrodeposition. To study the effect of a chemical reducer, 0.1 M of sodium hypophosphite (NaH2PO2) was added to the base solution. The pH was again adjusted to pH 7 prior to an electrodeposition.
3.2. MoS2 Electrodeposition
All electrochemical measurements (galvanostatic electrodeposition, linear sweep voltammetry (LSV), electrochemical impedance spectroscopy (EIS), cyclic voltammetry (CV)) were performed in a standard three-electrode cell set-up using a potentiostat/galvanostat Autolab 302N (Metrohm, Utrecht, The Netherlads). Unless specified otherwise, the potentials are in reference to an Ag/AgCl electrode. Commercial open-cell copper foam was used as the deposition substrate. The foam had a density of 1.02 g cm−3, a porosity of 87.6% and an approximate ligament diameter of 150–200 µm. Electrodes for deposition were prepared from a 2 cm × 2 cm × 0.13 cm cut-out of the copper foam sheet, shaped into a cylinder to promote equal current density distribution across the entire geometrical surface area. The substrates were degreased in acetone in an ultrasonic bath for 5 min. Before electrodeposition, they were immersed into a 2 M H2SO4 solution to remove surface oxides, and then rinsed well with distilled water. Cyclic voltammetry measurements were used to assess the working potential range for MoS2 electrodeposition in both solutions. The electrodeposition was carried out for four values of passed charge, namely 10, 20, 30 and 40 C (at a galvanostatic current of −10 mA), to evaluate the effect of catalyst loading on HER activity. The electrodes were weighed before electrodeposition and after characterisation. Current efficiencies were calculated from the obtained data, assuming that MoS2 electrodeposition is a two electron reaction (Equation (5)) [24].
MoS42− + 2e− + 2H2O → MoS2 + 2SH− +2OH−
The surface morphology and chemical composition of the electrodeposited MoS2 films were evaluated using a scanning electron microscope (SEM, Hitachi TM 3000, Tokyo, Japan) with an integrated energy-dispersive X-ray module (EDS, Oxford Instruments, Buckinghamshire, UK).
The XPS analyses were carried out with a Kratos Axis Supra spectrometer (Kratos Analytical Limited, Manchester, UK) using a monochromatic Al K(alpha) source (25 mA, 15 kV). The Kratos charge neutraliser system was used on all specimens. Survey scan analyses were carried out with an analysis area of 300 µm × 700 µm and a pass energy of 160 eV. High resolution analyses were carried out with an analysis area of 300 µm × 700 µm and a pass energy of 20 eV. The XPS signal due to adventitious carbon located at 284.8 eV was used as a binding energy (BE) reference.
3.3. Electrocatalytic Activity Measurements
The deposited films were rinsed with distilled water, and immediately transferred into a 0.5 M H2SO4 electrolyte for HER electrocatalysis experiments. A typical characterisation procedure consisted of the following steps: (1) settling of open circuit potential (OCP) for 120 s; (2) LSV at a rate of 2 mV s−1 from 0 V vs. RHE to a cut off condition of −100 mA, for 3 curves; and (3) EIS measurements at increasingly cathodic overpotentials (0, −0.1, −0.15, −0.175, −0.2, −0.25 and −0.3 V). The EIS spectra were measured in the frequency range from 10 kHz to 10 MHz, with an amplitude of 20 mV. The system had satisfactory linearity, causality and stability, and therefore this amplitude provided excellent electrochemical impedance spectra. The EIS data were interpreted in the frame of equivalent electric circuit (EEC). The determined solution resistance (Rs) was used to correct the iR drop in the recorded voltammetric data. The values of the pseudocapacitance, attributed to the adsorption time constant process, were used for an approximation of the number of active sites.
4. Conclusions
In this study electrodes for efficient HER catalysis were prepared by electrodepositing thin MoS2 films onto 3D copper-foam substrates. MoS2 was deposited cathodically from a solution with or without the reducing agent NaH2PO2. It was found that sodium hypophosphite had no influence on the mechanism of MoS2 formation, but a decrease in the micro-level roughness of the deposited films was observed. XPS study showed that, when electrodeposition is carried out with hypophosphite, a much stronger Mo4+-S bond signal is observed. Thus, the effect of NaH2PO2 on the electrochemical deposition of MoS2 is mainly targeting the suppression of Mo-O bond formation or, conversely, the assistance of Mo-S bond formation. The catalytic effect for HER from 0.5 M H2SO4 was determined, and total electrode activity increased with higher catalyst loading. MoS2 films, electrodeposited with hypophosphite, exhibited greater catalytic activity and had slightly lower Tafel slopes. The lowest slope (42.5 mV dec−1) was observed for a MoS2 film, electrodeposited with NaH2PO2, with low loading (equivalent to 10 C charge passed for electrodeposition of MoS2). The films were stable at low overpotentials, but lost activity rapidly when operating at high currents. The results of the polarisation experiments, Tafel and EIS analyses of HER show that addition of sodium hypophosphite into the electrodeposition solution results in MoS2 films with better intrinsic per-site activity. Films, electrodeposited with NaH2PO2, had lower Rct, larger Cdl values and smaller Ra values, indicating faster charge transfer, a larger electrochemically active surface area and more rapid hydrogen adsorption/desorption. A method for the approximation of the number of active sites based on the calculated pseudocapacitance is proposed. The calculations resulted in values of about 1018, which is comparable to those found in our previous research on thin plane MoS2 films. The number of active sites was identical for films, electrodeposited from both solutions, which meant that, in terms of turnover frequency, the films, deposited with hypophosphite, were conclusively more catalytically active.
Author Contributions
Methodology, R.L.; investigation, R.L.; writing—original draft preparation, R.L.; writing—review and editing, R.L., N.T. and H.C.; visualisation, R.L.; and supervision, N.T. and H.C. All authors have read and agreed to the published version of the manuscript.
Funding
This study received (partial) funding from the European Union’s Horizon 2020 research and innovation programme under the Marie Skłodowska-Curie grant agreement No. 778357 and the Research Council of Lithuania project No. 09.3.3-LMT-K-712-08-0003.
Conflicts of Interest
The authors declare no conflict of interest.
References
- Holade, Y.; Servat, K.; Tingry, S.; Napporn, T.W.; Remita, H.; Cornu, D.; Kokoh, K.B. Advances in Electrocatalysis for Energy Conversion and Synthesis of Organic Molecules. ChemPhysChem 2017, 18, 2573–2605. [Google Scholar] [CrossRef] [PubMed] [Green Version]
- Rostrup-Nielsen, J.R. Fuels and energy for the future: The role of catalysis. Catal. Rev. Sci. Eng. 2004, 46, 247–270. [Google Scholar] [CrossRef]
- Salem, R.R. Theory of the electrolysis of water. Prot. Met. 2008, 44, 120–125. [Google Scholar] [CrossRef]
- Trasatti, S. Water electrolysis: Who first? J. Electroanal. Chem. 1999, 476, 90–91. [Google Scholar] [CrossRef]
- Krstajic, N. Hydrogen Evolution Reaction. Encycl. Appl. Electrochem. 2014, 1039–1044. [Google Scholar] [CrossRef]
- Lasia, A. Mechanism and kinetics of the hydrogen evolution reaction. Int. J. Hydrogen Energy 2019, 44, 19484–19518. [Google Scholar] [CrossRef]
- Trasatti, S. Work function, electronegativity, and electrochemical behaviour of metals. III. Electrolytic hydrogen evolution in acid solutions. J. Electroanal. Chem. 1972, 39, 163–184. [Google Scholar] [CrossRef]
- Petrii, O.A.; Tsirlina, G.A. Electrocatalytic activity prediction for hydrogen electrode reaction: Intuition, art, science. Electrochim. Acta 1994, 39, 1739–1747. [Google Scholar] [CrossRef]
- Conway, B.E.; Jerkiewicz, G. Relation of energies and coverages of underpotential and overpotential deposited H at Pt and other metals to the ‘volcano curve’ for cathodic H2 evolution kinetics. Electrochim. Acta 2000, 45, 4075–4083. [Google Scholar] [CrossRef]
- Nørskov, J.K.; Bligaard, T.; Logadottir, A.; Kitchin, J.R.; Chen, J.G.; Pandelov, S.; Stimming, U. Trends in the Exchange Current for Hydrogen Evolution. J. Electrochem. Soc. 2005, 152, J23. [Google Scholar] [CrossRef] [Green Version]
- Quaino, P.; Juarez, F.; Santos, E.; Schmickler, W. Volcano plots in hydrogen electrocatalysis-uses and abuses. Beilstein J. Nanotechnol. 2014, 5, 846–854. [Google Scholar] [CrossRef] [PubMed] [Green Version]
- Yan, Y.; Xia, B.Y.; Zhao, B.; Wang, X. A review on noble-metal-free bifunctional heterogeneous catalysts for overall electrochemical water splitting. J. Mater. Chem. A 2016, 4, 17587–17603. [Google Scholar] [CrossRef] [Green Version]
- Wang, J.; Yue, X.; Yang, Y.; Sirisomboonchai, S.; Wang, P.; Ma, X.; Abudula, A.; Guan, G. Earth-abundant transition-metal-based bifunctional catalysts for overall electrochemical water splitting: A review. J. Alloys Compd. 2020, 819, 153346. [Google Scholar] [CrossRef]
- Wang, T.; Xie, H.; Chen, M.; D’Aloia, A.; Cho, J.; Wu, G.; Li, Q. Precious metal-free approach to hydrogen electrocatalysis for energy conversion: From mechanism understanding to catalyst design. Nano Energy 2017, 42, 69–89. [Google Scholar] [CrossRef]
- Zou, X.; Zhang, Y. Noble metal-free hydrogen evolution catalysts for water splitting. Chem. Soc. Rev. 2015, 44, 5148–5180. [Google Scholar] [CrossRef] [PubMed]
- Hinnemann, B.; Moses, P.G.; Bonde, J.; Jørgensen, K.P.; Nielsen, J.H.; Horch, S.; Chorkendorff, I.; Nørskov, J.K. Biomimetic hydrogen evolution: MoS2 nanoparticles as catalyst for hydrogen evolution. J. Am. Chem. Soc. 2005, 127, 5308–5309. [Google Scholar] [CrossRef] [PubMed]
- Jaramillo, T.F.; Jørgensen, K.P.; Bonde, J.; Nielsen, J.H.; Horch, S.; Chorkendorff, I. Identification of active edge sites for electrochemical H2 evolution from MoS2 nanocatalysts. Science 2007, 317, 100–102. [Google Scholar] [CrossRef] [Green Version]
- Li, G.; Zhang, D.; Qiao, Q.; Yu, Y.; Peterson, D.; Zafar, A.; Kumar, R.; Curtarolo, S.; Hunte, F.; Shannon, S.; et al. All the Catalytic Active Sites of MoS2 for Hydrogen Evolution. J. Am. Chem. Soc. 2016, 138, 16632–16638. [Google Scholar] [CrossRef]
- Kibsgaard, J.; Jaramillo, T.F.; Besenbacher, F. Building an appropriate active-site motif into a hydrogen-evolution catalyst with thiomolybdate [Mo3S13]−2 clusters. Nat. Chem. 2014, 6, 248–253. [Google Scholar] [CrossRef] [Green Version]
- Tran, P.D.; Tran, T.V.; Orio, M.; Torelli, S.; Truong, Q.D.; Nayuki, K.; Sasaki, Y.; Chiam, S.Y.; Yi, R.; Honma, I.; et al. Coordination polymer structure and revisited hydrogen evolution catalytic mechanism for amorphous molybdenum sulfide. Nat. Mater. 2016, 15, 640–646. [Google Scholar] [CrossRef]
- Huo, J.; Ge, R.; Liu, Y.; Guo, J.; Lu, L.; Chen, W.; Liu, C.; Gao, H.; Liu, H. Recent advances of two-dimensional molybdenum disulfide based materials: Synthesis, modification and applications in energy conversion and storage. Sustain. Mater. Technol. 2020, 24. [Google Scholar] [CrossRef]
- Merki, D.; Hu, X. Recent developments of molybdenum and tungsten sulfides as hydrogen evolution catalysts. Energy Environ. Sci. 2011, 4, 3878–3888. [Google Scholar] [CrossRef] [Green Version]
- Zhang, L.; Wu, L.; Li, J.; Lei, J. Electrodeposition of amorphous molybdenum sulfide thin film for electrochemical hydrogen evolution reaction. BMC Chem. 2019, 13, 1–9. [Google Scholar] [CrossRef]
- Ponomarev, E.A.; Neumann-Spallart, M.; Hodes, G.; Lévy-Clément, C. Electrochemical deposition of MoS2 thin films by reduction of tetrathiomolybdate. Thin Solid Films 1996, 280, 86–89. [Google Scholar] [CrossRef]
- Benck, J.D.; Hellstern, T.R.; Kibsgaard, J.; Chakthranont, P.; Jaramillo, T.F. Catalyzing the hydrogen evolution reaction (HER) with molybdenum sulfide nanomaterials. ACS Catal. 2014, 4, 3957–3971. [Google Scholar] [CrossRef]
- Benck, J.D.; Chen, Z.; Kuritzky, L.Y.; Forman, A.J.; Jaramillo, T.F. Amorphous molybdenum sulfide catalysts for electrochemical hydrogen production: Insights into the origin of their catalytic activity. ACS Catal. 2012, 2, 1916–1923. [Google Scholar] [CrossRef]
- Merki, D.; Vrubel, H.; Rovelli, L.; Fierro, S.; Hu, X. Fe, Co, and Ni ions promote the catalytic activity of amorphous molybdenum sulfide films for hydrogen evolution. Chem. Sci. 2012, 3, 2515–2525. [Google Scholar] [CrossRef] [Green Version]
- Wu, L.; Dzade, N.Y.; Yu, M.; Mezari, B.; van Hoof, A.J.F.; Friedrich, H.; de Leeuw, N.H.; Hensen, E.J.M.; Hofmann, J.P. Unraveling the Role of Lithium in Enhancing the Hydrogen Evolution Activity of MoS2: Intercalation versus Adsorption. ACS Energy Lett. 2019, 4, 1733–1740. [Google Scholar] [CrossRef] [Green Version]
- Tedstone, A.A.; Lewis, D.J.; O’Brien, P. Synthesis, Properties, and Applications of Transition Metal-Doped Layered Transition Metal Dichalcogenides. Chem. Mater. 2016, 28, 1965–1974. [Google Scholar] [CrossRef]
- Mosconi, D.; Till, P.; Calvillo, L.; Kosmala, T.; Garoli, D.; Debellis, D.; Martucci, A.; Agnoli, S.; Granozzi, G. Effect of Ni Doping on the MoS2 Structure and Its Hydrogen Evolution Activity in Acid and Alkaline Electrolytes. Surfaces 2019, 2, 531–545. [Google Scholar] [CrossRef] [Green Version]
- Liu, Q.; Liu, Q.; Kong, X. Anion Engineering on Free-Standing Two-Dimensional MoS2 Nanosheets toward Hydrogen Evolution. Inorg. Chem. 2017, 56, 11462–11465. [Google Scholar] [CrossRef] [PubMed]
- Huang, H.; Chen, L.; Liu, C.; Liu, X.; Fang, S.; Liu, W.; Liu, Y. Hierarchically nanostructured MoS2 with rich in-plane edges as a high-performance electrocatalyst for the hydrogen evolution reaction. J. Mater. Chem. A 2016, 4, 14577–14585. [Google Scholar] [CrossRef]
- Kosmala, T.; Mosconi, D.; Giallongo, G.; Rizzi, G.A.; Granozzi, G. Highly Efficient MoS2/Ag2S/Ag Photoelectrocatalyst Obtained from a Recycled DVD Surface. ACS Sustain. Chem. Eng. 2018, 6, 7818–7825. [Google Scholar] [CrossRef]
- Levinas, R.; Tsyntsaru, N.; Cesiulis, H. Insights into electrodeposition and catalytic activity of MoS2 for hydrogen evolution reaction electrocatalysis. Electrochim. Acta 2019, 317, 427–436. [Google Scholar] [CrossRef]
- Vrubel, H.; Moehl, T.; Grätzel, M.; Hu, X. Revealing and accelerating slow electron transport in amorphous molybdenum sulphide particles for hydrogen evolution reaction. Chem. Commun. 2013, 49, 8985–8987. [Google Scholar] [CrossRef] [Green Version]
- Tremblay, M.L.; Martin, M.H.; Lebouin, C.; Lasia, A.; Guay, D. Determination of the real surface area of powdered materials in cavity microelectrodes by electrochemical impedance spectroscopy. Electrochim. Acta 2010, 55, 6283–6291. [Google Scholar] [CrossRef]
- Reid, O.; Saleh, F.S.; Easton, E.B. Determining electrochemically active surface area in PEM fuel cell electrodes with electrochemical impedance spectroscopy and its application to catalyst durability. Electrochim. Acta 2013, 114, 278–284. [Google Scholar] [CrossRef]
- Thangaraj, N.; Tamilarasan, K.; Sasikumar, D. Effect of current density on electrodeposited ferrous tungsten thin films. Indian J. Pure Appl. Phys. 2014, 52, 395–398. [Google Scholar]
- Park, D.Y.; Myung, N.V.; Schwartz, M.; Nobe, K. Nanostructured magnetic CoNiP electrodeposits: Structure-property relationships. Electrochim. Acta 2002, 47, 2893–2900. [Google Scholar] [CrossRef]
- Li, L.; Qin, Z.; Ries, L.; Hong, S.; Michel, T.; Yang, J.; Salameh, C.; Bechelany, M.; Miele, P.; Kaplan, D.; et al. Role of sulfur vacancies and undercoordinated Mo regions in MoS2 nanosheets toward the evolution of hydrogen. ACS Nano 2019, 13, 6824–6834. [Google Scholar] [CrossRef]
- Choi, J.G.; Thompson, L.T. XPS study of as-prepared and reduced molybdenum oxides. Appl. Surf. Sci. 1996, 93, 143–149. [Google Scholar] [CrossRef]
- Baltrusaitis, J.; Mendoza-Sanchez, B.; Fernandez, V.; Veenstra, R.; Dukstiene, N.; Roberts, A.; Fairley, N. Generalized molybdenum oxide surface chemical state XPS determination via informed amorphous sample model. Appl. Surf. Sci. 2015, 326, 151–161. [Google Scholar] [CrossRef]
- Vernickaite, E.; Lelis, M.; Tsyntsaru, N.; Pakštas, V.; Cesiulis, H. XPS studies on the Mo-oxide based coatings electrodeposited from highly saturated acetate bath. Chemija 2020, 31, 203–209. [Google Scholar]
- Eda, G.; Yamaguchi, H.; Voiry, D.; Fujita, T.; Chen, M.; Chhowalla, M. Photoluminescence from chemically exfoliated MoS2. Nano Lett. 2011, 11, 5111–5116. [Google Scholar] [CrossRef]
- Syari’Ati, A.; Kumar, S.; Zahid, A.; el Yumin, A.A.; Ye, J.; Rudolf, P. Photoemission spectroscopy study of structural defects in molybdenum disulfide (MoS2) grown by chemical vapor deposition (CVD). Chem. Commun. 2019, 55, 10384–10387. [Google Scholar] [CrossRef] [Green Version]
- Lasia, A. Electrochemical Impedance Spectroscopy and Its Applications, 1st ed.; Springer: New York, NY, USA, 2014; ISBN 9781461489337. [Google Scholar]
- Brug, G.J.; van den Eeden, A.L.G.; Sluyters-Rehbach, M.; Sluyters, J.H. The analysis of electrode impedances complicated by the presence of a constant phase element. J. Electroanal. Chem. 1984, 176, 275–295. [Google Scholar] [CrossRef]
- Voiry, D.; Chhowalla, M.; Gogotsi, Y.; Kotov, N.A.; Li, Y.; Penner, R.M.; Schaak, R.E.; Weiss, P.S. Best Practices for Reporting Electrocatalytic Performance of Nanomaterials. ACS Nano 2018, 12, 9635–9638. [Google Scholar] [CrossRef] [Green Version]
Figure 1.
First CV cycles at scan rate of 2 mV s−1 for MoS2 electrodeposition on Cu rod electrode (geometrical area of 1 cm2) and 3D-foam.
Figure 1.
First CV cycles at scan rate of 2 mV s−1 for MoS2 electrodeposition on Cu rod electrode (geometrical area of 1 cm2) and 3D-foam.
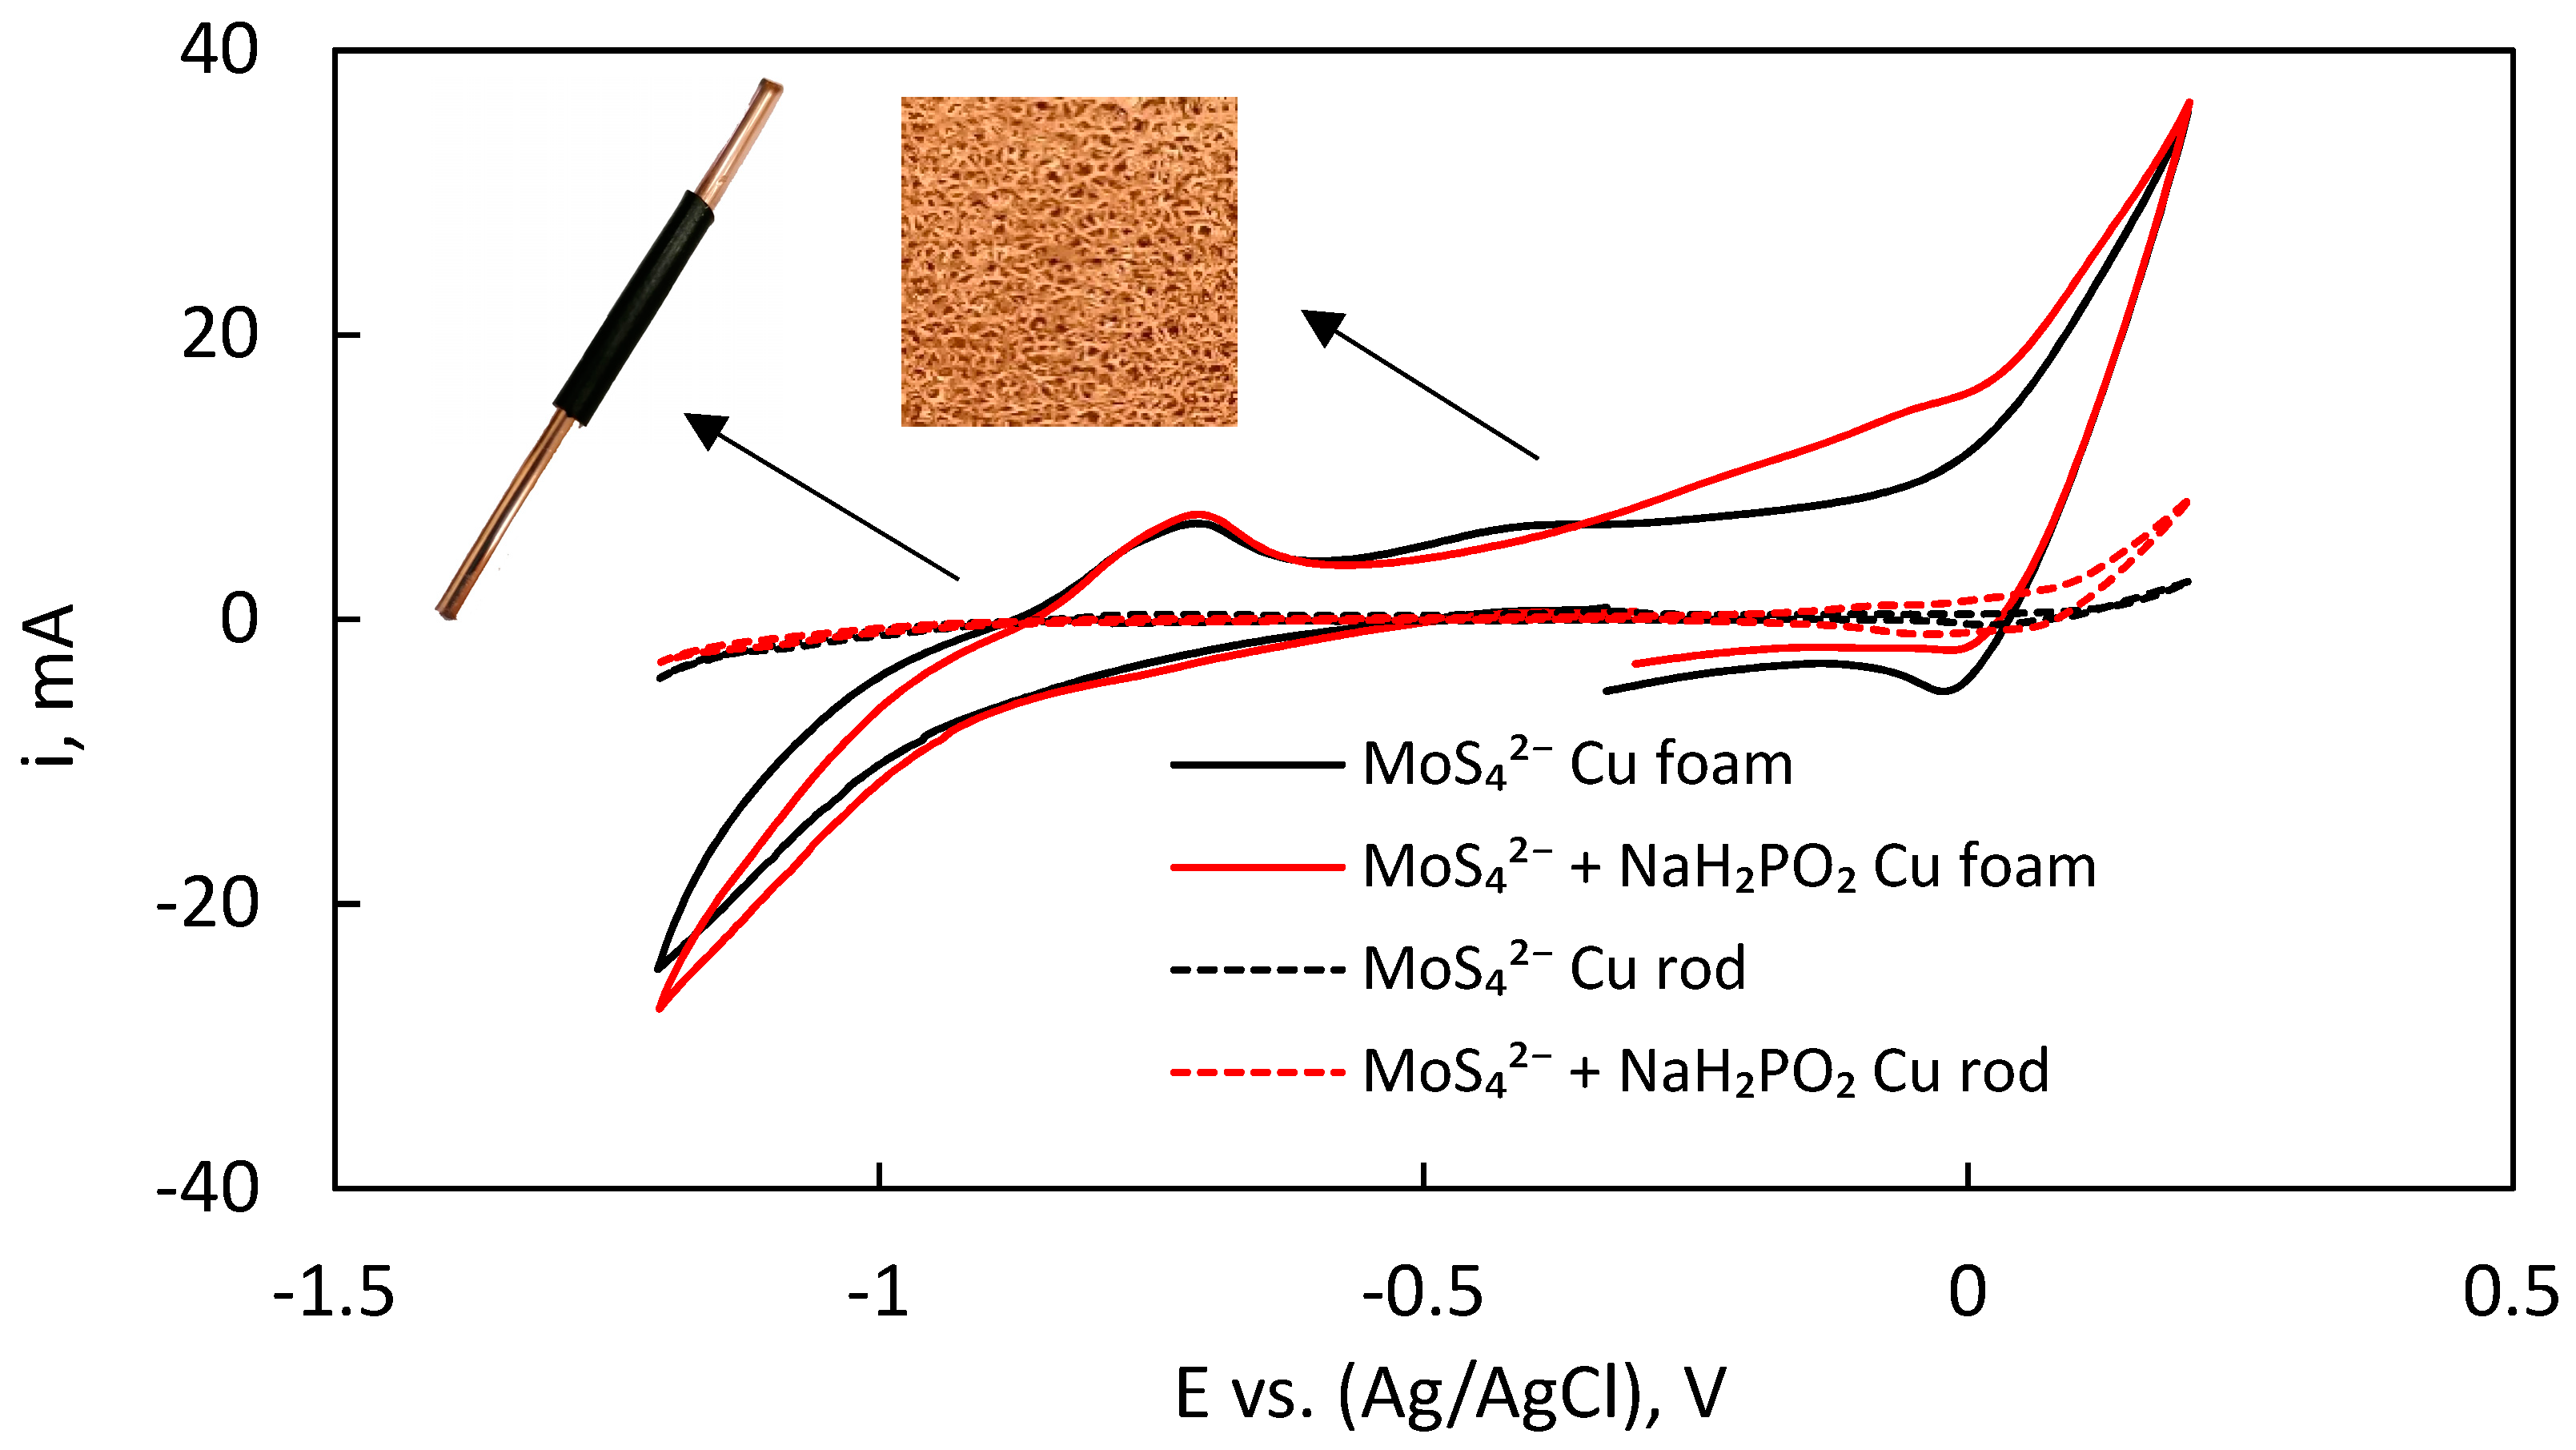
Figure 2.
SEM images (low and high magnifications) of electrodeposited MoS2 films at cathodic current of 10 mA on Cu-foam electrodes from electrolytes: (a) without sodium hypophosphite; and (b) with sodium hypophosphite. Here, Q marks the cathodic charge in coulombs for which the films were electrodeposited (10 and 30 C).
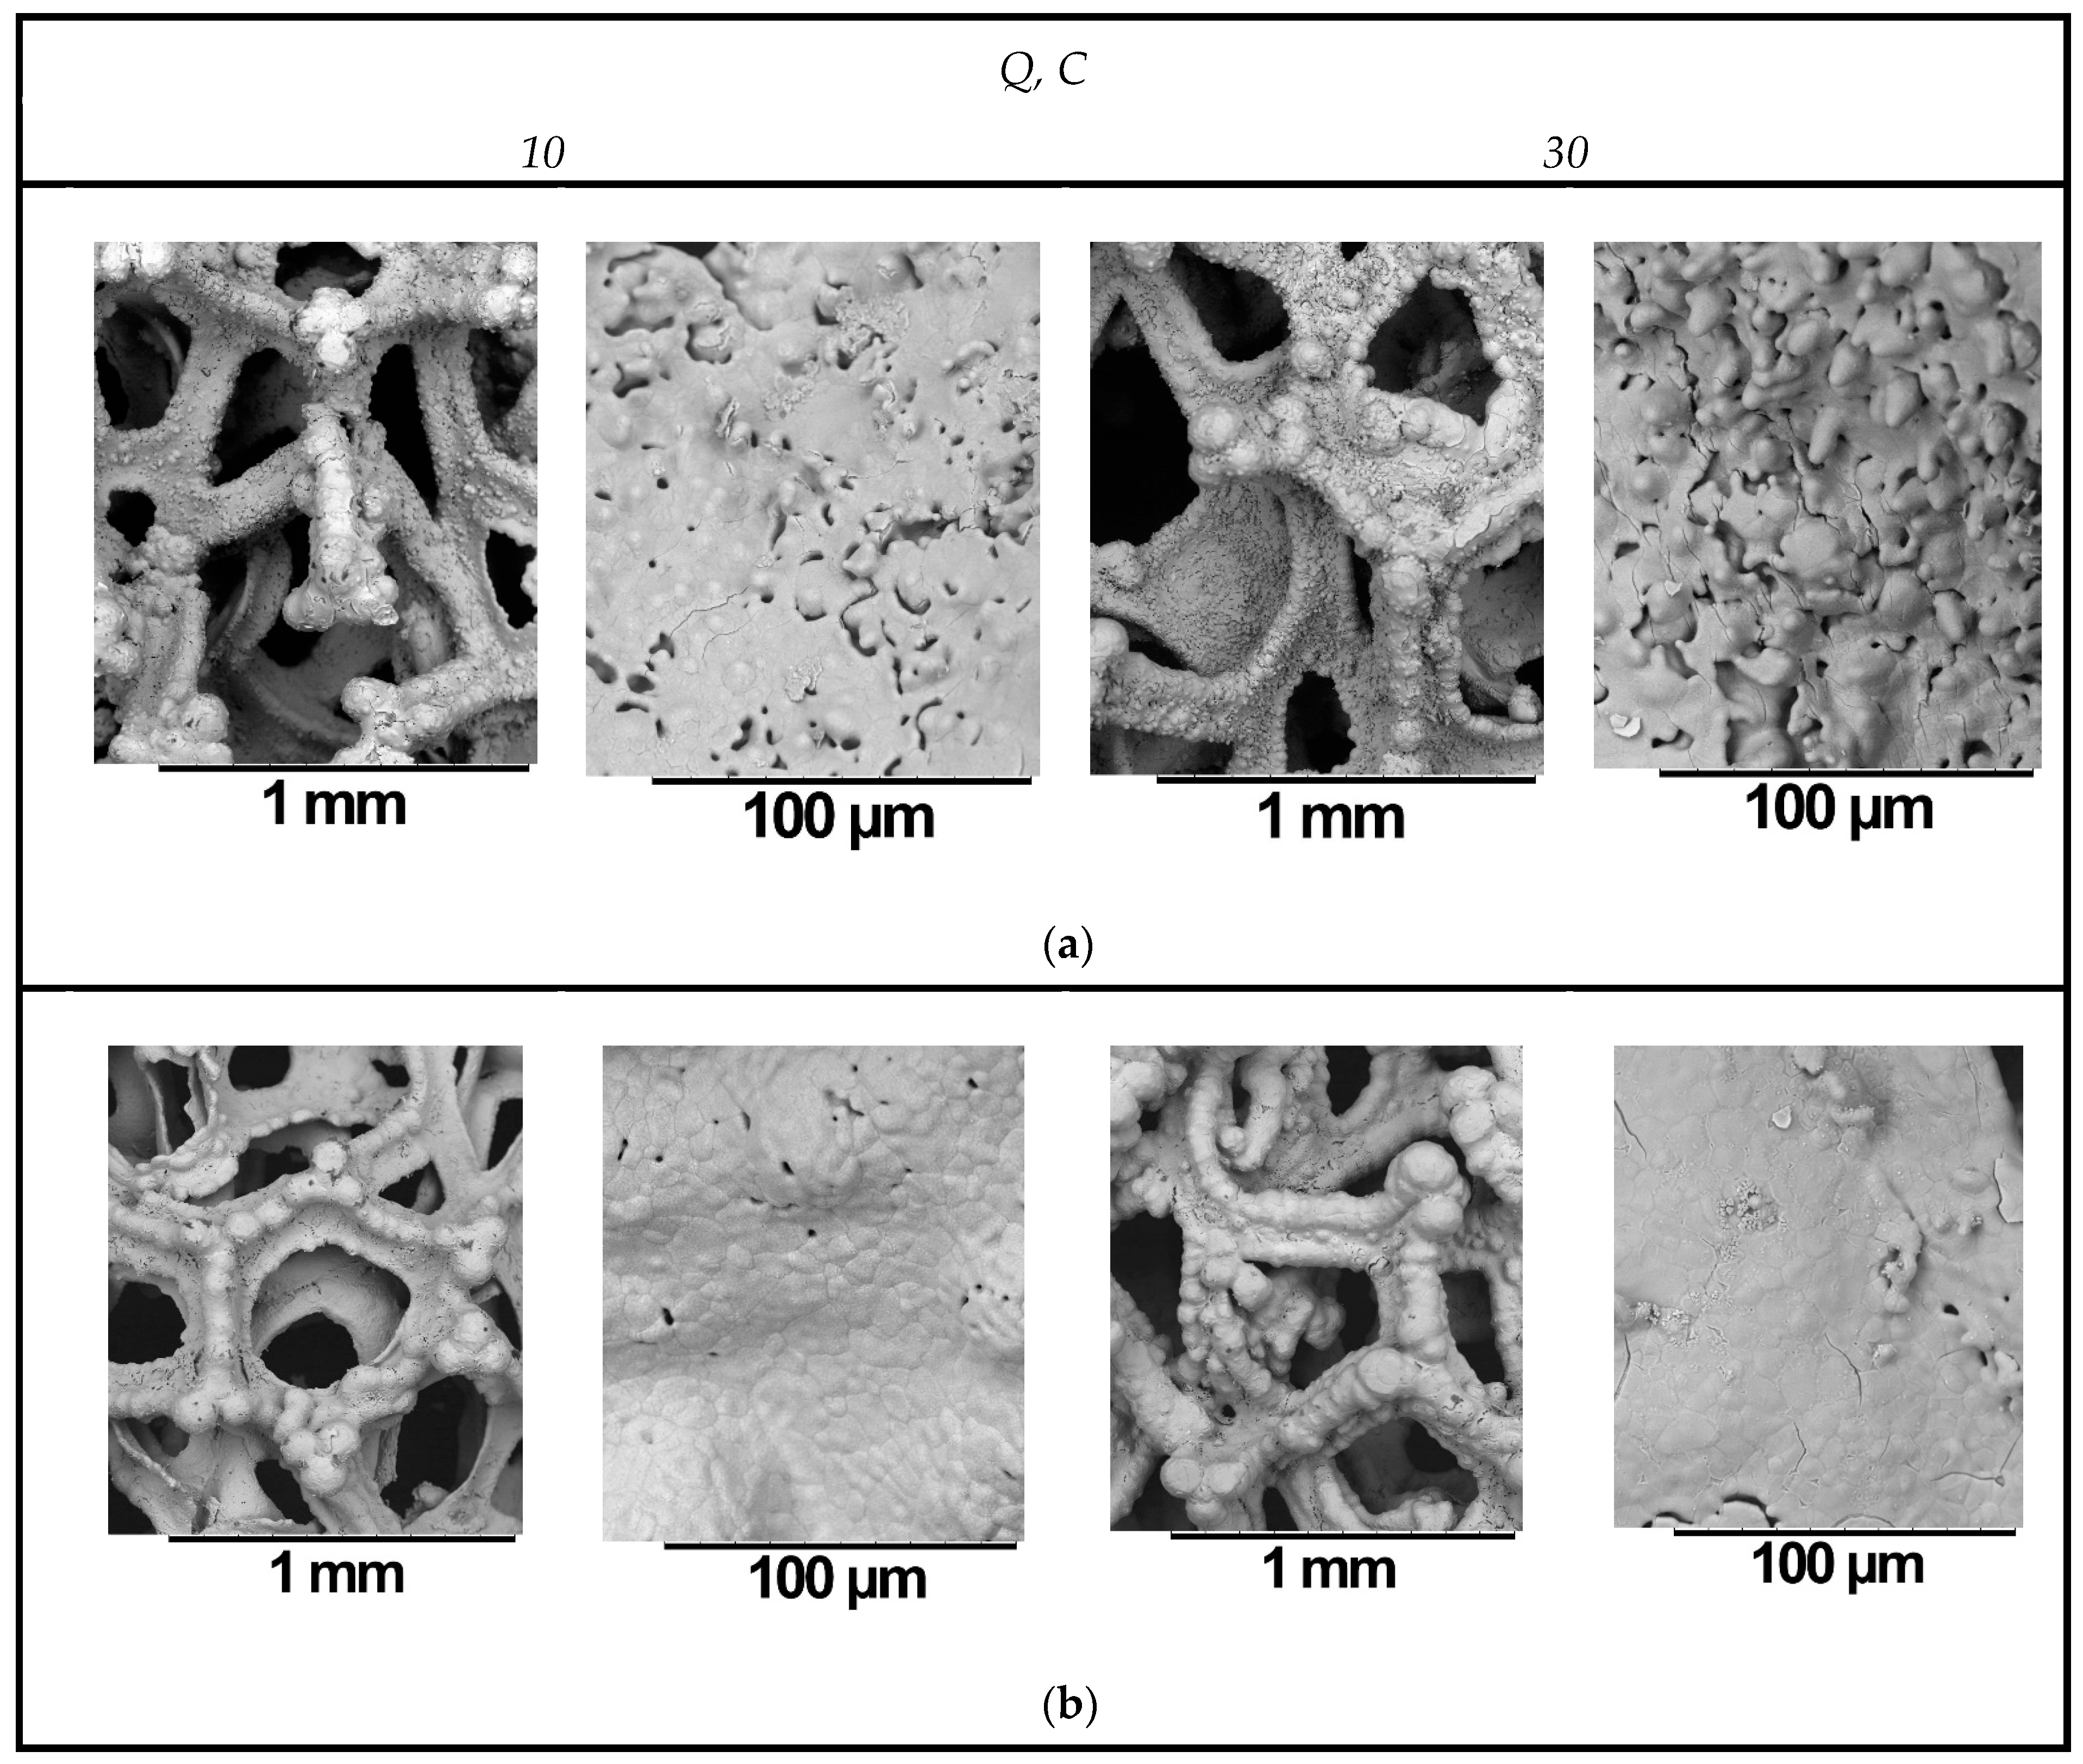
Figure 3.
XPS spectra and fitted peaks of MoS2 films, electrodeposited on copper foams: (a,b) without NaH2PO2; and (c,d) with NaH2PO2.
Figure 3.
XPS spectra and fitted peaks of MoS2 films, electrodeposited on copper foams: (a,b) without NaH2PO2; and (c,d) with NaH2PO2.


Figure 4.
(a) iR-corrected polarisation curves of electrodeposited MoS2 films in 0.5 M H2SO4; and (b) Tafel slopes of the respective films, with scan rate −2 mV s−1. (Red lines correspond to samples, deposited with NaH2PO2).
Figure 4.
(a) iR-corrected polarisation curves of electrodeposited MoS2 films in 0.5 M H2SO4; and (b) Tafel slopes of the respective films, with scan rate −2 mV s−1. (Red lines correspond to samples, deposited with NaH2PO2).
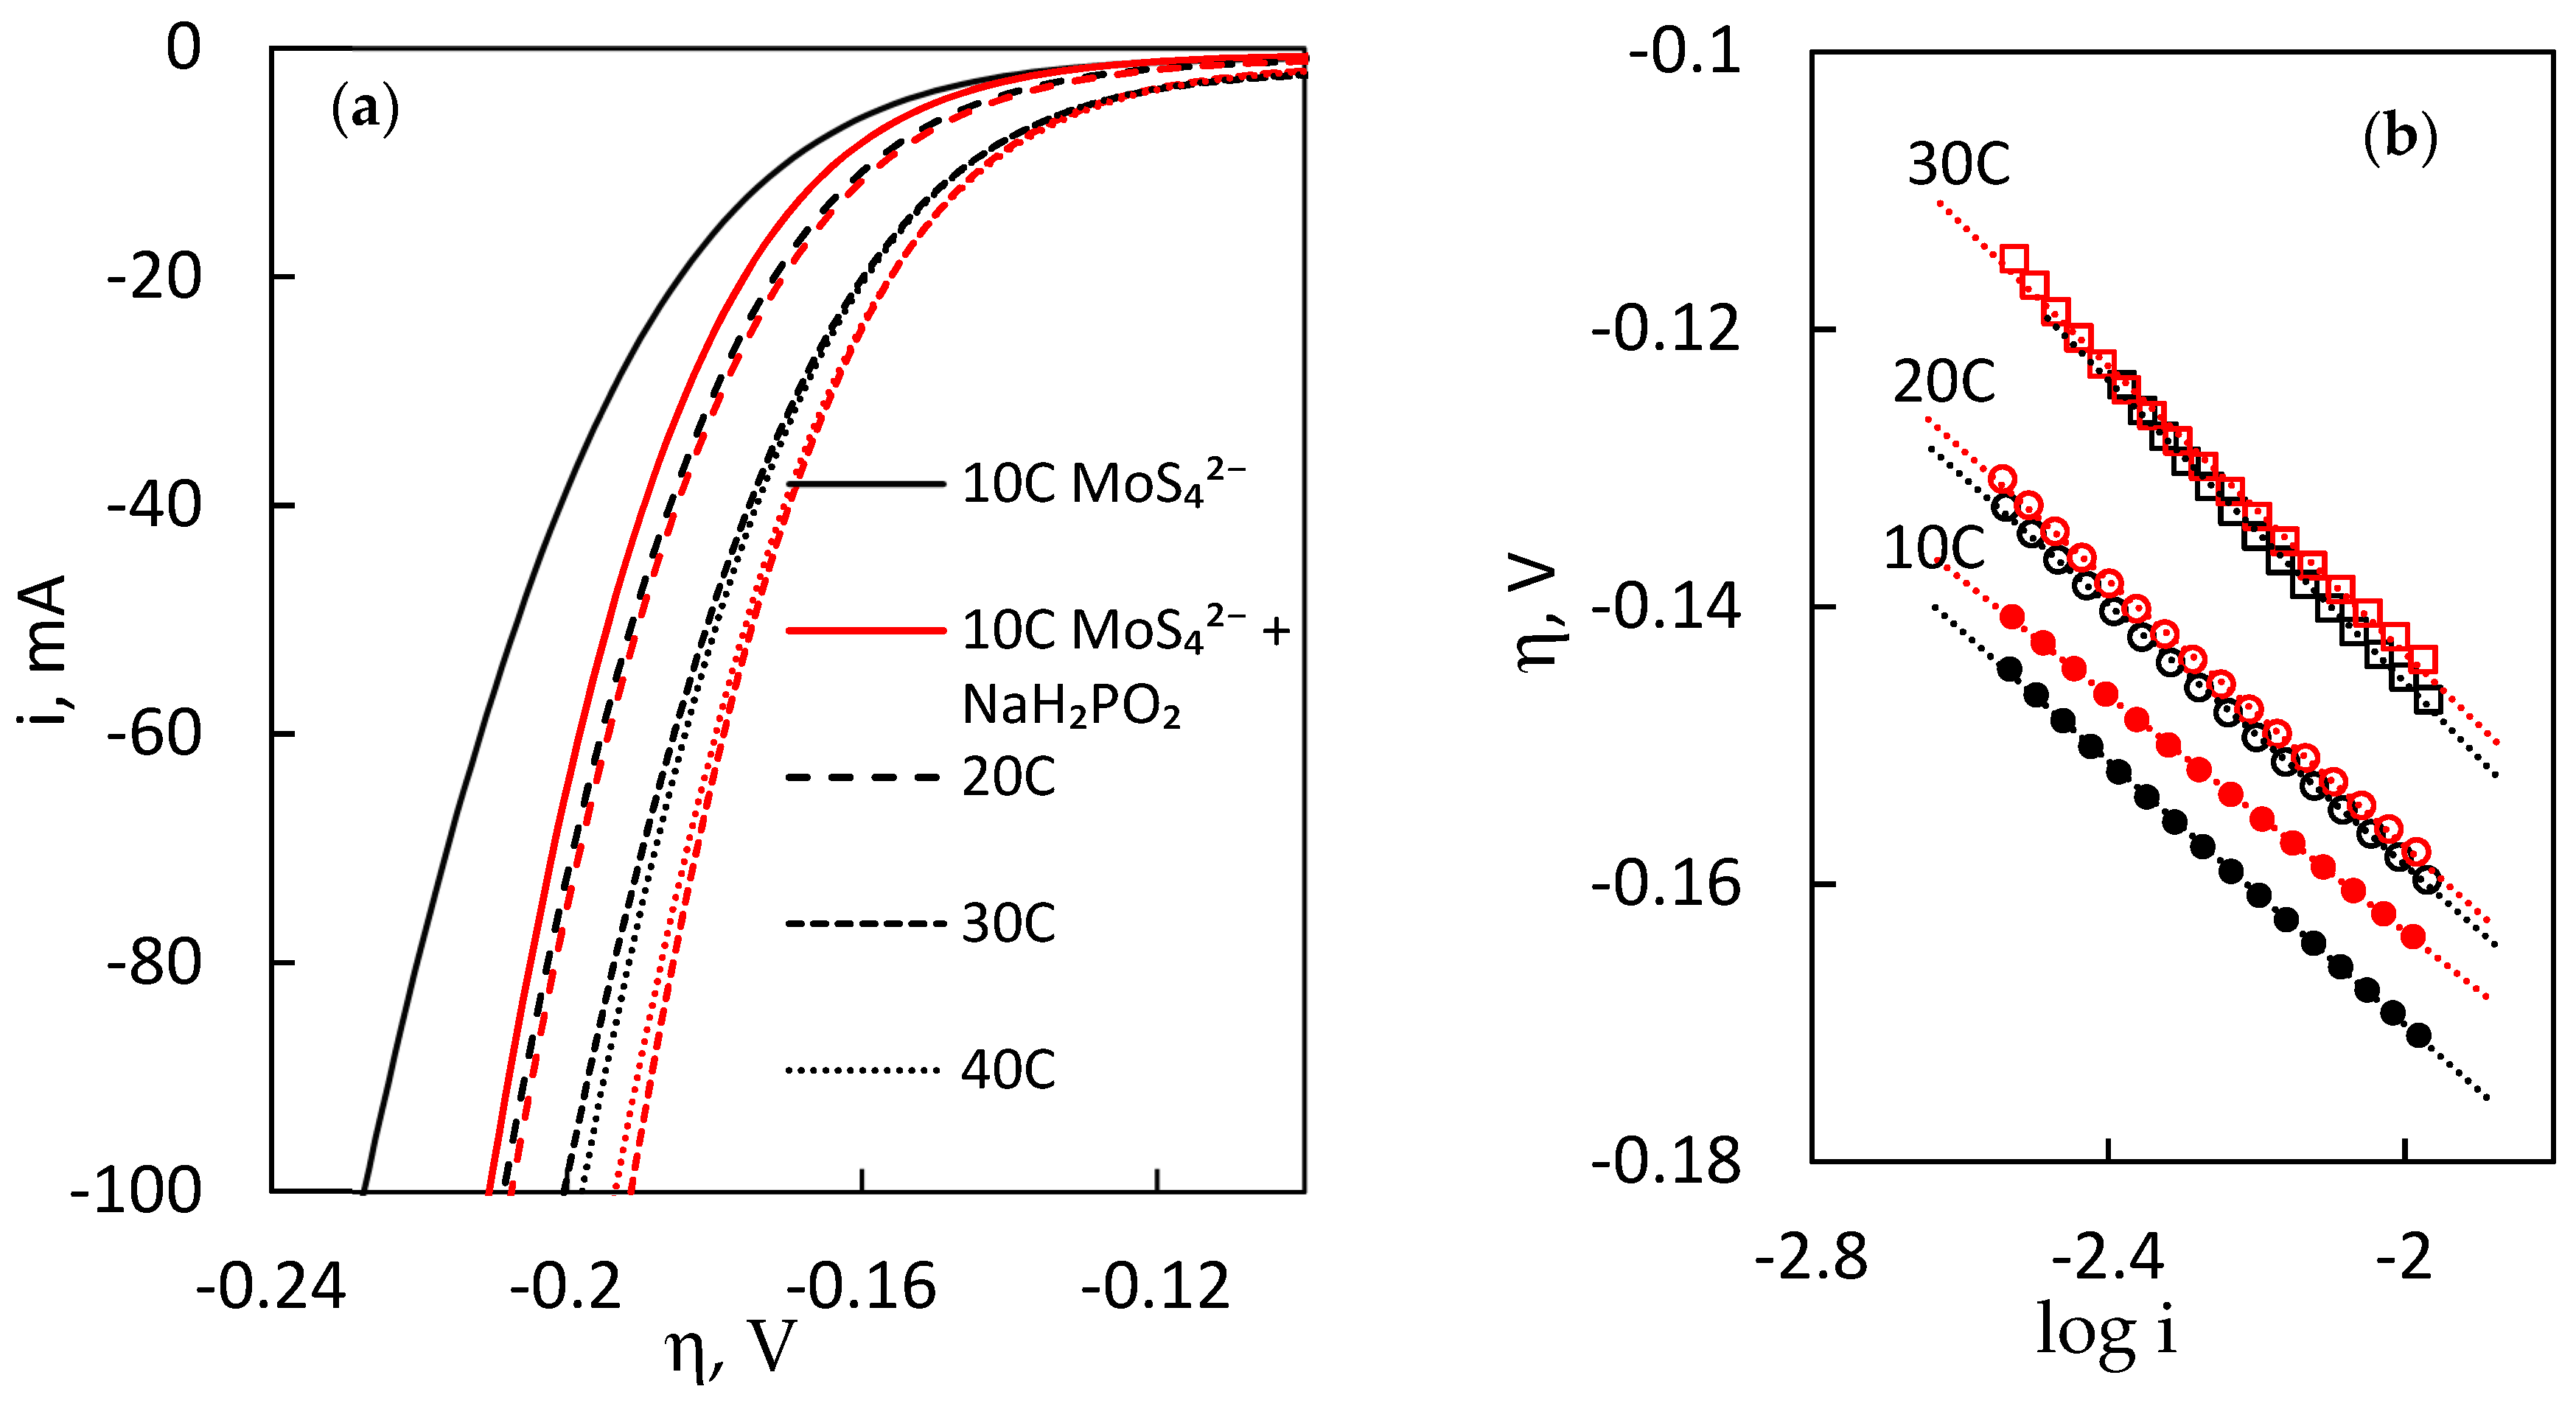
Figure 5.
Galvanostatic stability curves of MoS2 films, electrodeposited with and without NaH2PO2.

Figure 6.
EIS spectra of HER from 0.5 M H2SO4 on the electrodeposited MoS2 film (Q = 10 C): (a) Nyquist plots obtained at various overpotentials; (b) spectra, obtained at higher overpotentials; and (c,d) Bode plots of respective overpotentials. Points are experimental data, while lines represent fitting to EEC shown in Figure 7.

Figure 7.
Equivalent electrical circuit, used to model impedance data. Rs, solution resistance; Cdl, constant phase element related to double layer capacitance; Rct, charge transfer resistance; Ca, polarisation capacitance; Ra, polarisation resistance.
Figure 7.
Equivalent electrical circuit, used to model impedance data. Rs, solution resistance; Cdl, constant phase element related to double layer capacitance; Rct, charge transfer resistance; Ca, polarisation capacitance; Ra, polarisation resistance.
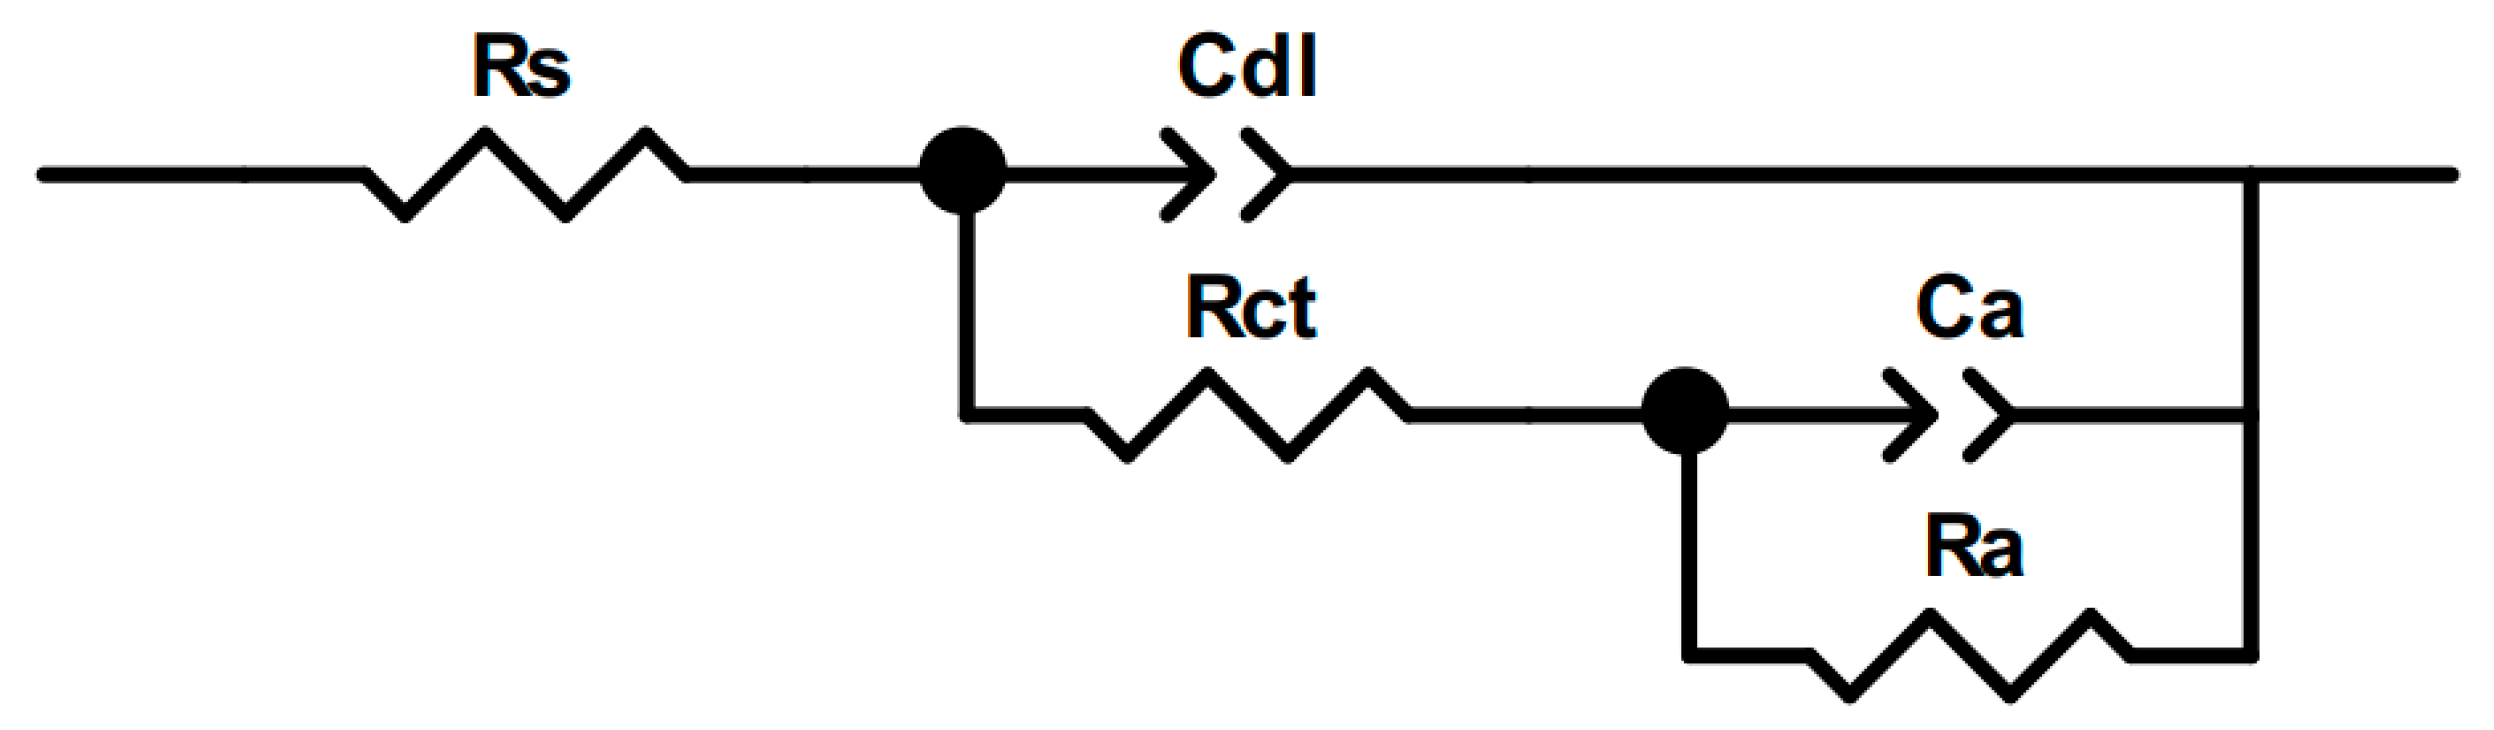
Figure 8.
Nyguist plot of EIS for films, electrodeposited with and without NaH2PO2, for a different amount of charge. Points are experimental data, while lines represent fitting to EEC shown in Figure 7.
Figure 8.
Nyguist plot of EIS for films, electrodeposited with and without NaH2PO2, for a different amount of charge. Points are experimental data, while lines represent fitting to EEC shown in Figure 7.
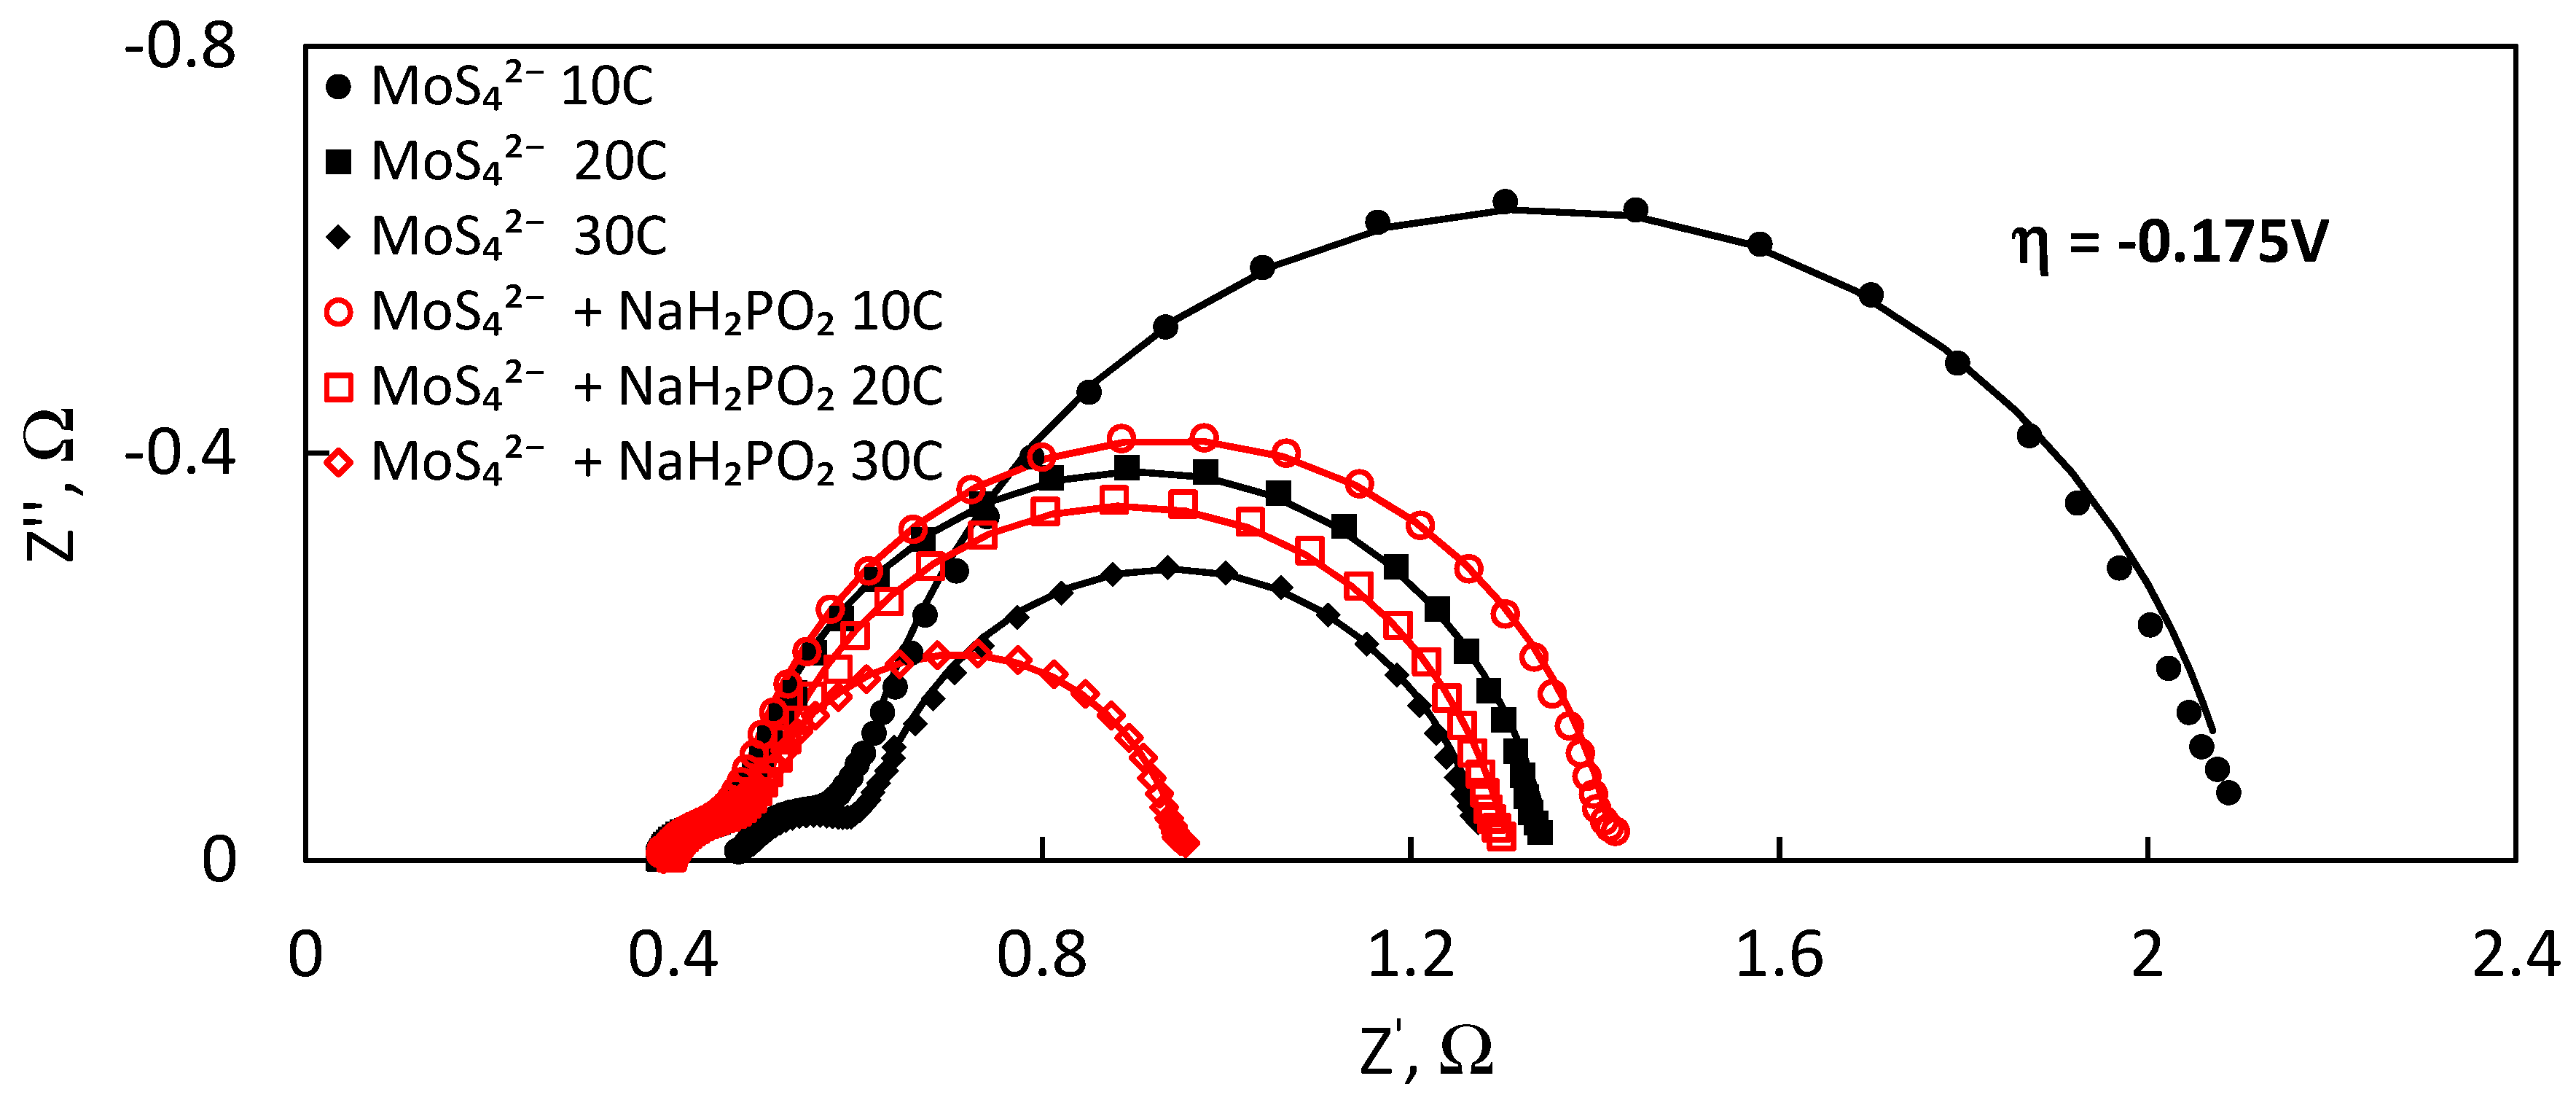
Figure 9.
The dependence of 1/Rct on overpotential. (Red lines correspond to samples, deposited with NaH2PO2).
Figure 9.
The dependence of 1/Rct on overpotential. (Red lines correspond to samples, deposited with NaH2PO2).
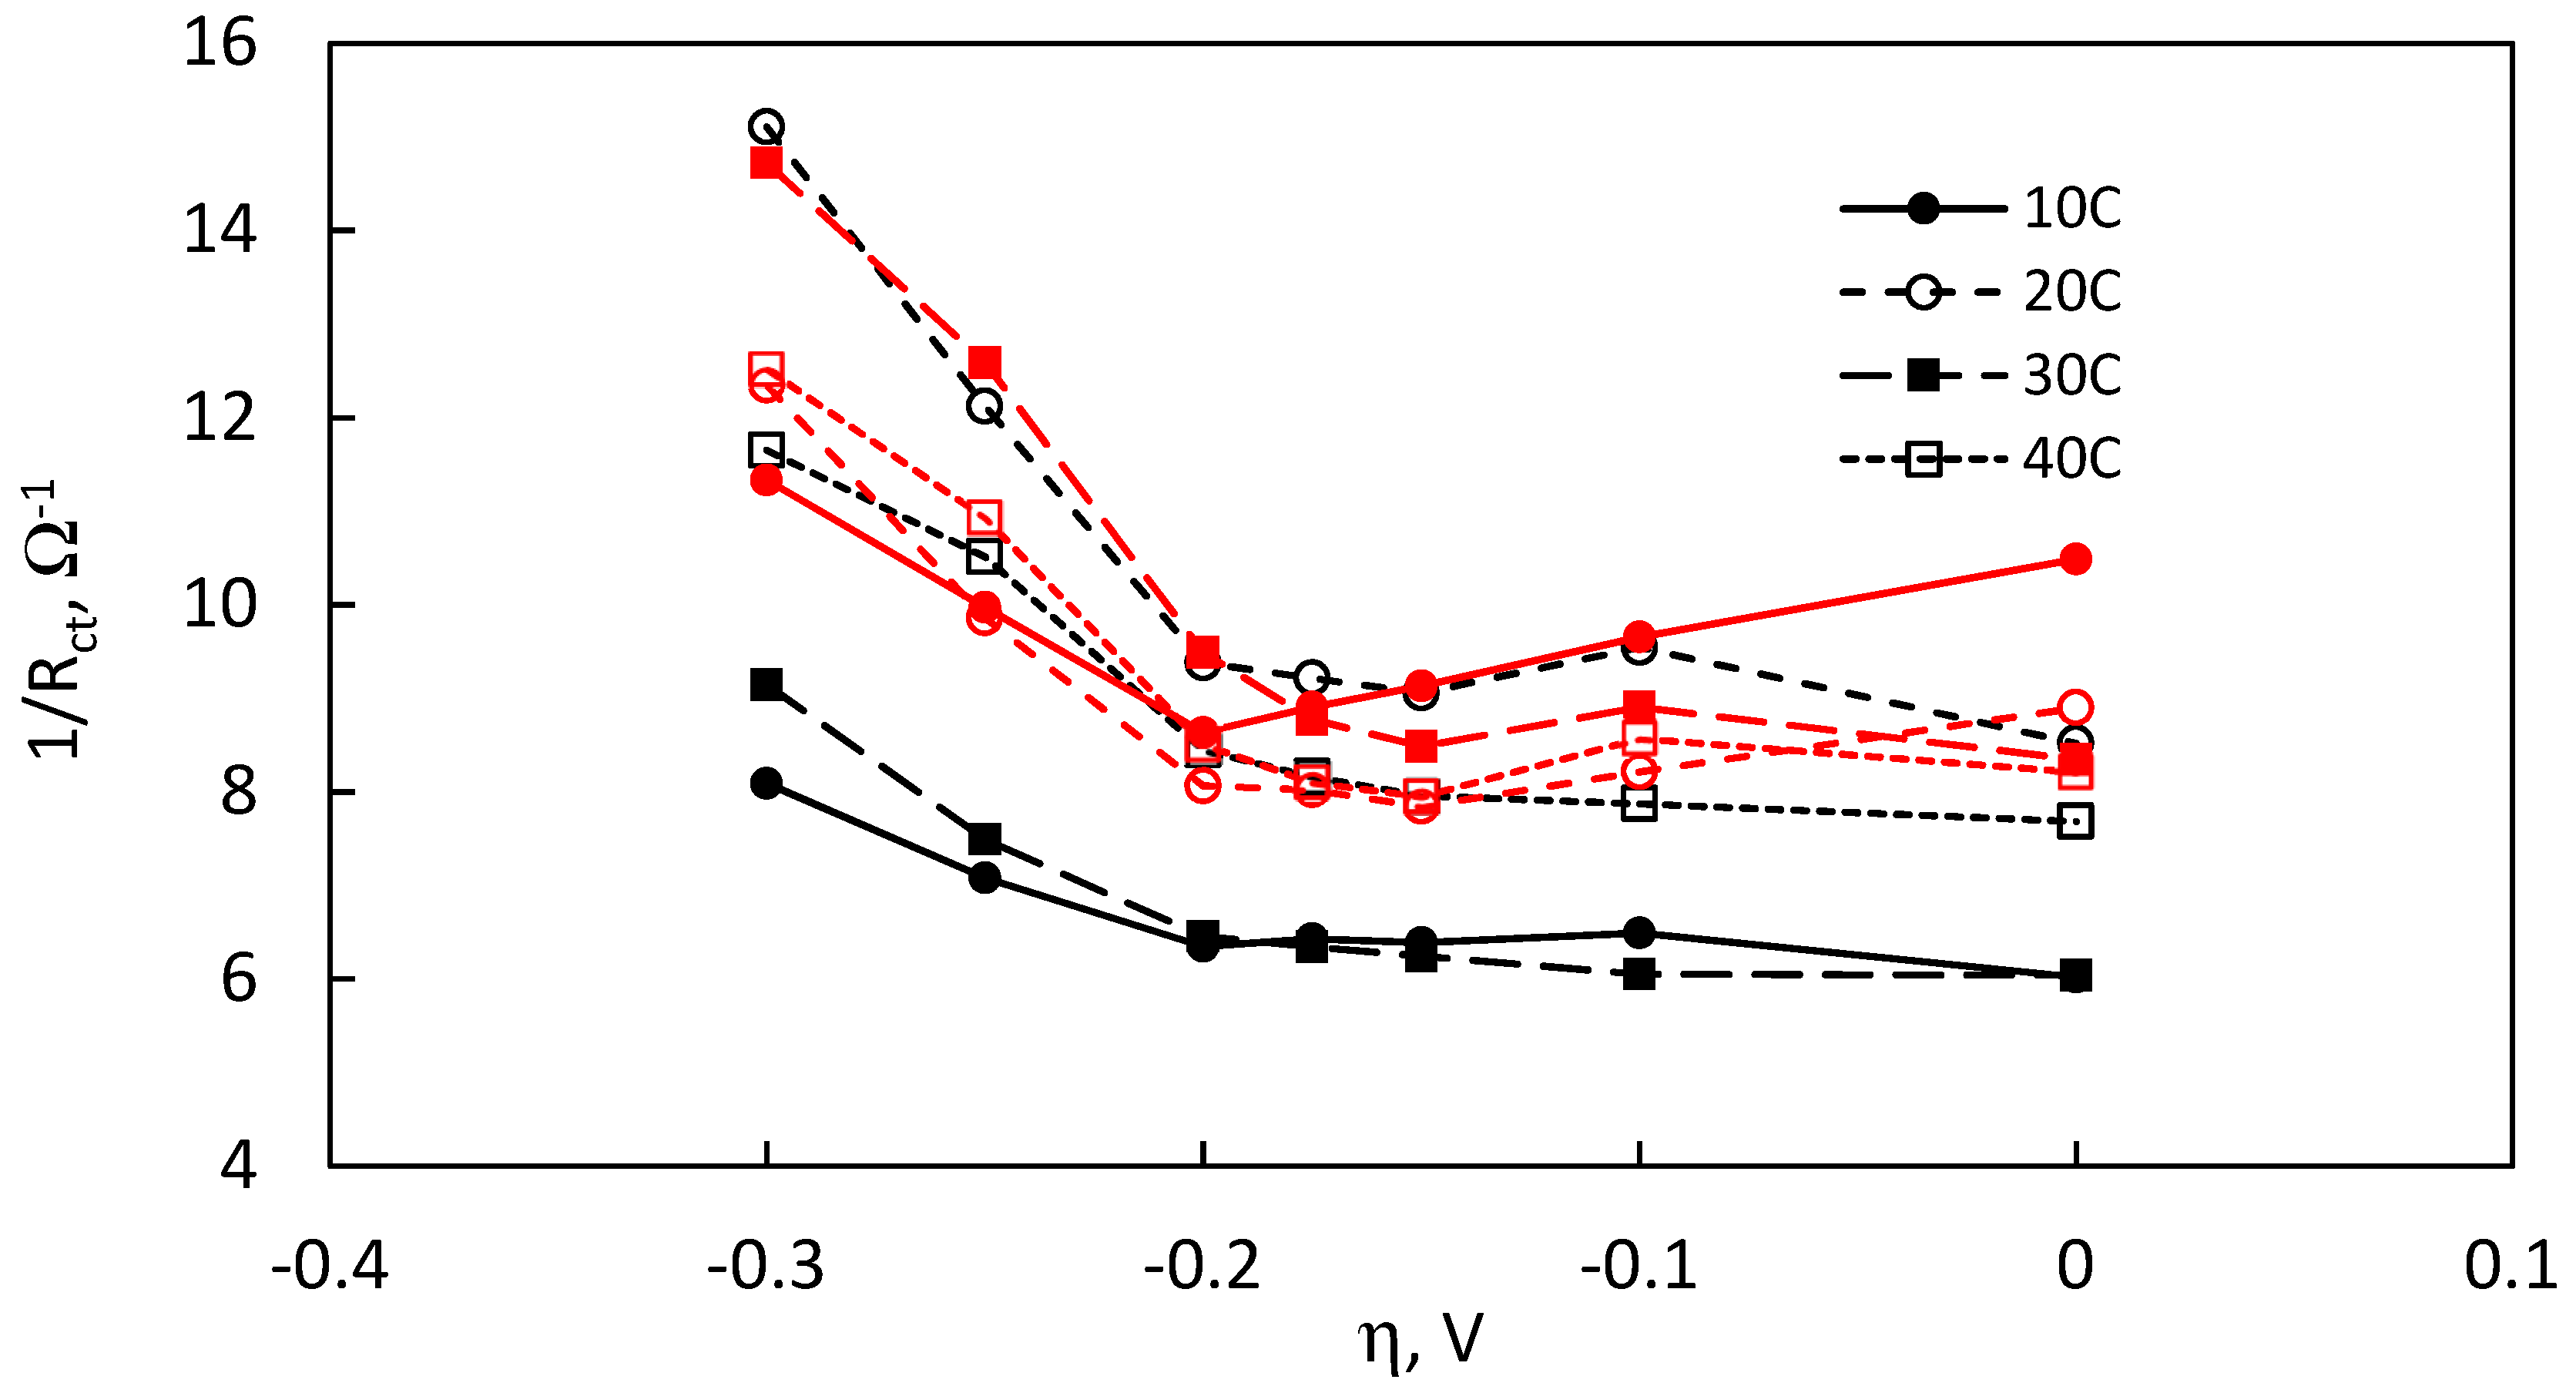
Figure 10.
The dependence of double layer capacitance on overpotential. (Red lines correspond to samples, deposited with NaH2PO2).
Figure 10.
The dependence of double layer capacitance on overpotential. (Red lines correspond to samples, deposited with NaH2PO2).

Figure 11.
Values of the low-frequency RC circuit as a function of overpotential (red lines correspond to samples, deposited with NaH2PO2): (a) capacitance, related to hydrogen adsorption and desorption, and (b) hydrogen adsorption resistance.
Figure 11.
Values of the low-frequency RC circuit as a function of overpotential (red lines correspond to samples, deposited with NaH2PO2): (a) capacitance, related to hydrogen adsorption and desorption, and (b) hydrogen adsorption resistance.
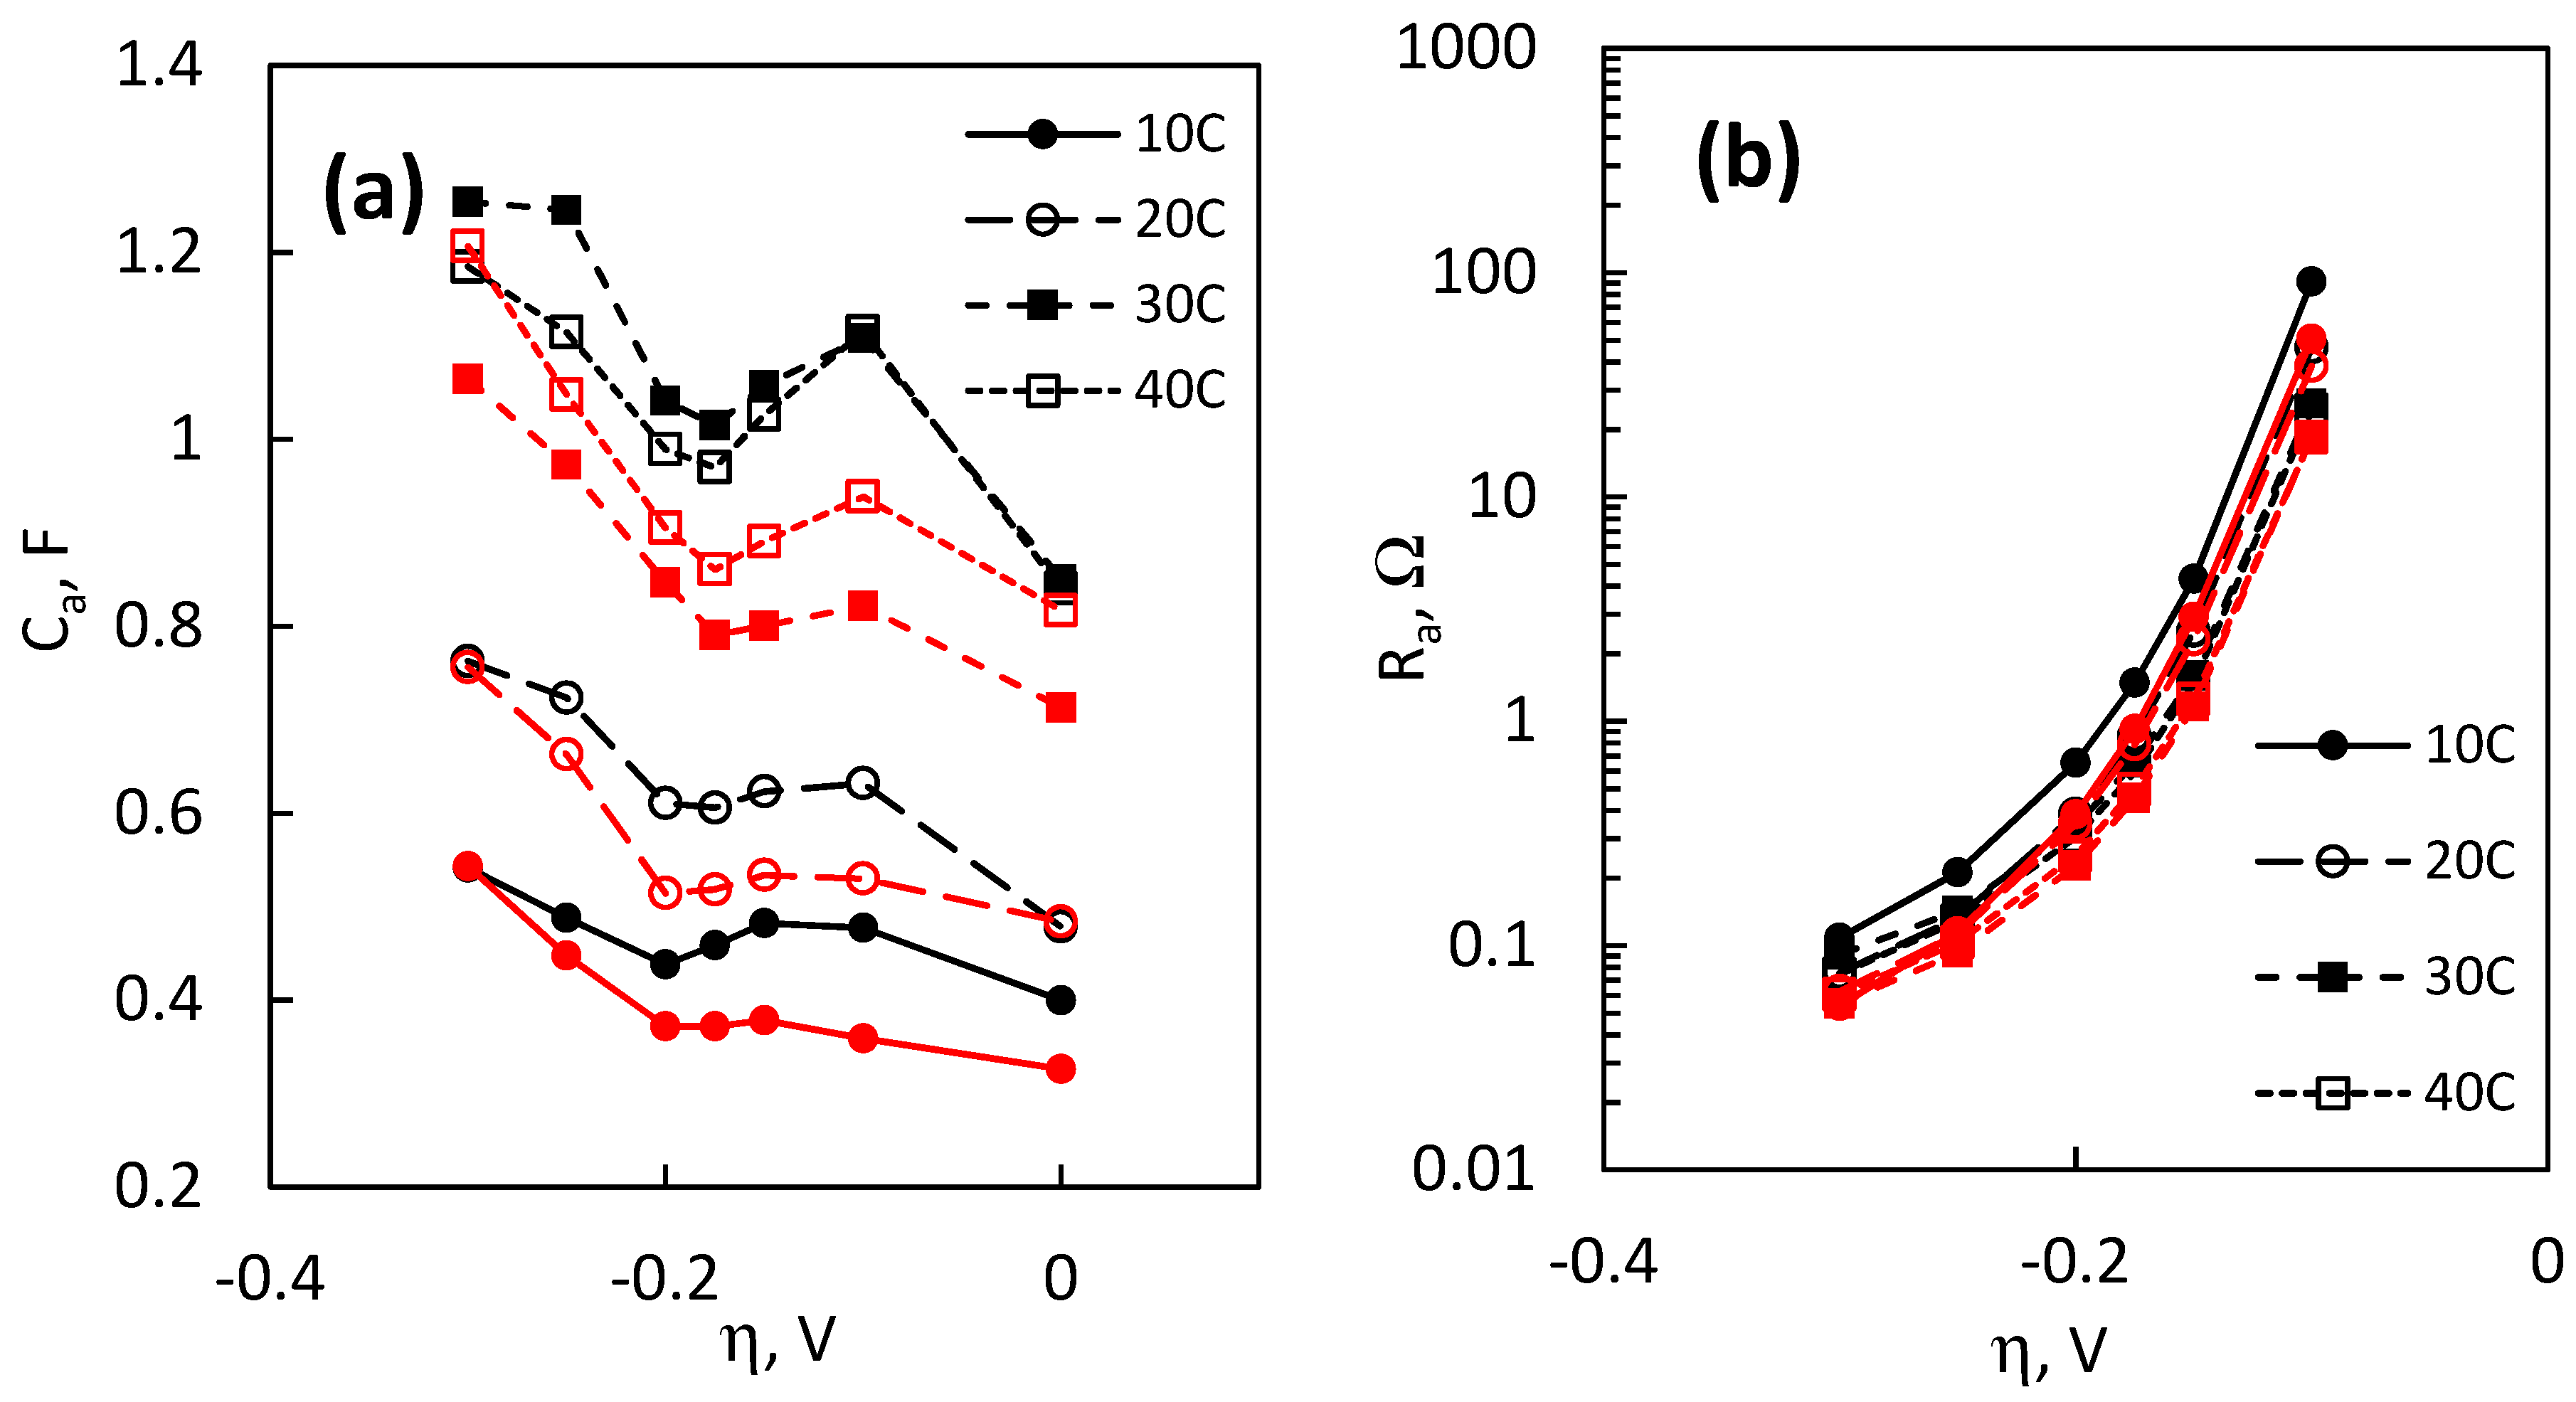
Figure 12.
The dependence of (a) the high frequency time constant and (b) the low frequency time constant on overpotential. (Red lines correspond to samples, deposited with NaH2PO2).
Figure 12.
The dependence of (a) the high frequency time constant and (b) the low frequency time constant on overpotential. (Red lines correspond to samples, deposited with NaH2PO2).

Figure 13.
TOF values plotted as a function of overpotential for MoS2 films, electrodeposited without and with NaH2PO2. (Red lines correspond to samples, deposited with NaH2PO2).
Figure 13.
TOF values plotted as a function of overpotential for MoS2 films, electrodeposited without and with NaH2PO2. (Red lines correspond to samples, deposited with NaH2PO2).

Table 1.
Dependence of chemical composition of MoS2 films on the passed charge at a cathodic current of 10 mA; films electrodeposited from electrolytes containing MoS42−, and MoS42− + NaH2PO2 (denoted with *).
Table 1.
Dependence of chemical composition of MoS2 films on the passed charge at a cathodic current of 10 mA; films electrodeposited from electrolytes containing MoS42−, and MoS42− + NaH2PO2 (denoted with *).
| Q, C | Composition, at % | Mo: S Ratio | ||||||||
|---|---|---|---|---|---|---|---|---|---|---|
| Mo | Mo * | S | S * | O | O * | P | P * | * | ||
| 10 | 9.60 | 6.63 | 17.99 | 13.90 | 72.40 | 79.41 | - | 0.047 | 1.87 | 2.10 |
| 20 | 8.15 | 7.26 | 13.81 | 14.25 | 78.04 | 78.38 | 0.11 | 1.72 | 1.98 | |
| 30 | 9.06 | 8.14 | 15.92 | 16.06 | 75.0 | 75.73 | 0.065 | 1.75 | 1.96 | |
| 40 | 8.12 | 9.54 | 14.69 | 15.86 | 77.18 | 74.47 | 0.13 | 1.83 | 1.66 | |
Table 2.
Electrocatalytic activity parameters of the electrodeposited MoS2 films from electrolytes containing MoS42−, and MoS42− + NaH2PO2 (denoted with *).
Table 2.
Electrocatalytic activity parameters of the electrodeposited MoS2 films from electrolytes containing MoS42−, and MoS42− + NaH2PO2 (denoted with *).
| Q, C. | 10 | 20 | 30 | 40 | |
|---|---|---|---|---|---|
| Tafel slope η, mV dec−1 | 47.5 | 47 | 54.5 | 51.4 | |
| * | 42.5 | 47.9 | 51.7 | 49.0 | |
| Exchange current I0, µA | 2.62 | 4.22 | 21.5 | 14.9 | |
| * | 1.43 | 5.23 | 16.8 | 12.3 |
Table 3.
Calculated numbers of active sites and turnover frequencies (at −0.2 V) for the electrodeposited MoS2 films from electrolytes containing MoS42− and MoS42− + NaH2PO2 (denoted with *).
Table 3.
Calculated numbers of active sites and turnover frequencies (at −0.2 V) for the electrodeposited MoS2 films from electrolytes containing MoS42− and MoS42− + NaH2PO2 (denoted with *).
| Q, C | Na × 1018, Total Sites | Na × 1018, Total Sites * | TOFη = −0.19 V × 10−2, s−1 | TOFη = −0.19 V × 10−2, s−1 * |
|---|---|---|---|---|
| 10 | 1.01 | 1.02 | 7.81 | 12.5 |
| 20 | 1.43 | 1.42 | 10.8 | 11.0 |
| 30 | 2.35 | 1.99 | 9.7 | 14.7 |
| 40 | 2.22 | 2.26 | 10.7 | 12.4 |
Publisher’s Note: MDPI stays neutral with regard to jurisdictional claims in published maps and institutional affiliations. |
© 2020 by the authors. Licensee MDPI, Basel, Switzerland. This article is an open access article distributed under the terms and conditions of the Creative Commons Attribution (CC BY) license (http://creativecommons.org/licenses/by/4.0/).
Share and Cite
MDPI and ACS Style
Levinas, R.; Tsyntsaru, N.; Cesiulis, H. The Characterisation of Electrodeposited MoS2 Thin Films on a Foam-Based Electrode for Hydrogen Evolution. Catalysts 2020, 10, 1182. https://doi.org/10.3390/catal10101182
AMA Style
Levinas R, Tsyntsaru N, Cesiulis H. The Characterisation of Electrodeposited MoS2 Thin Films on a Foam-Based Electrode for Hydrogen Evolution. Catalysts. 2020; 10(10):1182. https://doi.org/10.3390/catal10101182
Chicago/Turabian StyleLevinas, Ramunas, Natalia Tsyntsaru, and Henrikas Cesiulis. 2020. "The Characterisation of Electrodeposited MoS2 Thin Films on a Foam-Based Electrode for Hydrogen Evolution" Catalysts 10, no. 10: 1182. https://doi.org/10.3390/catal10101182
Note that from the first issue of 2016, this journal uses article numbers instead of page numbers. See further details here.