1. Introduction
Experimental ultimatum game studies consistently generate evidence refuting the joint hypothesis that participants are concerned solely with own monetary rewards and play according to the subgame perfection solution concept. While bargaining positions in these experiments are typically endowed, in naturally-occurring settings people commonly acquire bargaining positions through some market allocation of resources. Some examples are a building owner negotiating a lease with a medical practice, an aircraft manufacturer negotiating with subcontractors, a telecommunication firm negotiating with another to purchase bandwidth licenses, and a law school graduate negotiating with a law firm over terms of employment. When analyzing situations like these we should understand if behavioral anomalies, like those consistently found in ultimatum game experiments, remain relevant. We investigate this issue through an experiment in which scarce participation rights to play an ultimatum game are allocated by auctions.
In the standard version of the ultimatum game there are two players, the Proposer and the Responder, who have the opportunity to share ten one-dollar bills. The Proposer offers
x dollars to the Responder, implicity demanding he keeps
dollars. The Responder can then either Accept, implementing the implied division, or Reject, resulting in both players receiving zero dollars. Formally, the Proposer’s strategy set is
and the Responder’s strategy set is the set of functions that map elements of
X to elements of the action set {Accept, Reject}. In the unique strict subgame perfect equilibrium, the Responder accepts any offer of one or greater and the Proposer chooses to offer one dollar. While this subgame perfect equilibrium is the focus of most researchers’ attention
1 there are a multiplicity of pure strategy Nash equilibria. Any division of
and
x for the Proposer and Responder, respectively, is supported by the Nash equilibrium in which the Proposer’s strategy is
x and the Responder’s strategy is to reject all offers strictly less than
x and accept all others.
2 We call these
threshold Nash equilibria.
The literature on ultimatum game experiments is extensive but has a common theme: Proposers make diverse offers between an even split and the smallest positive offer, and Responders often reject offers that are less generous than an even split (Camerer [
1], Güth and Kocher [
2]). This behavior is inconsistent with any pure strategy Nash equilibrium, let alone subgame perfection. So why should we expect the auctioning of limited participation rights to affect play in the ultimatum game?
Auction prices allow participants to forward induce the payoff expectations of other players, helping resolve the coordination problem when there are multiple Nash equilibria. Van Huyck
et al. [
3] provide a seminal investigation of the empirical validity of forward induction through pre-game auctions. They report an experiment with nine-person symmetric median effort games. In these games, a player’s payoff is increasing in the median effort level of the group, and decreasing in the absolute difference between the player’s effort level and that median. These games have a set of Pareto-ranked pure strategy Nash equilibria, one for each possible effort level. After repeatedly playing the game ten times in their experiment, play almost always converges to the initial median effort level of four or five. Then in another treatment, eighteen subjects participate in a multiple-unit English clock auction each period to determine the nine subjects who will play in the game. Strikingly, the auction prices rise to just below the game payoff and play correspondingly rises to the Pareto dominant equilibrium associated with maximum effort.
3Our study differs from Van Huyck
et al. [
3] in two fundamental ways. First, the asymmetric nature of the ultimatum game leads us to have two populations rather than one: a group of potential Proposers and a group of potential Responders. In our Auction treatment, we use two simultaneous multi-unit English clock auctions to allocate the scarce rights to play both ultimatum game positions. Final prices are the only auction information revealed between populations. Hence, and in contrast to Van Huyck
et al. [
3], forward induction requires coordination of payoff expectations between the Proposer and Responder populations. Second, the Nash equilibria of the ultimatum game do not have a strict Pareto ranking. Correspondingly, the Pareto-dominance equilibrium selection criterion is unable to play a role in forward induction. Because of these differences, we are
a priori hesitant to assume that the results of Van Huyck
et al. [
3] extend to our setting.
We conduct a control treatment in which we remove the endogenous allocation of participation rights and determination of participation fees. In what we call the Random treatment, for each period and each game role we randomly select four out of the eight possible participants to play the game. We match the payoff opportunities to those in the Auction treatment by imposing a sequence of entry fees identical to those generated in a paired Auction session. The Random treatment allows us to separate the effects of endogenous participation, and thus forward induction, from those resulting from the auction price impact upon the payoff structure of the ultimatum game.
The change in the payoff structure of the game created by the auction prices in itself can impact play according to the loss avoidance equilibrium selection principle. Cachon and Camerer [
9] argue that players wish to avoid equilibrium play that results in a loss (possibly relative to a reference point) and appreciate that other players wish the same. Thus, the loss avoidance principle refines away any Nash equilibrium that involves a loss for a player if there is an alternative equilibrium offering non-losses to all players. They demonstrate the loss avoidance principle by conducting experiments with the same median effort coordination game as Van Huyck
et al. [
3]. However, instead of an auction they introduce exogenous entry fees. While the participation fee does not reflect an endogenous expectation of game payoffs, Cachon and Camerer [
9] find play coordinates on higher effort levels.
A second reason why we should expect auctioning off limited participation rights to affect ultimatum game play is that competing and winning in an auction creates a stronger sense of entitlement than simply endowing participation rights. Researchers conjecture this stronger sense of entitlement should move play closer to the strict subgame perfect equilibrium. The influential work of Hoffman
et al. [
10] measures the impact of earned entitlement by awarding Proposer positions to subjects scoring in the top fifty percent of a general knowledge quiz. In sessions with Proposers earning their position, one-shot game offers are substantially reduced while Responders maintain a low rejection rate.
Perhaps the most closely related work to the current study is Güth and Tietz [
11], who also use auctions to allocate scarce rights to play the ultimatum game. In their experiment, subjects participate in three rounds of decision making. In each round of play, subjects are randomly partitioned into six subgroups and each subgroup is informed that they have been randomly selected to play as either a Proposer or Responder in an ultimatum game with a pie size of either fifteen, fifty-five or one hundred Deutsche Marks. Then each subgroup participates in a different second-price sealed bid auction to determine the one member who will ultimately play. Finally the winners of the auctions are appropriately paired and proceed to play the ultimatum games. Perhaps the most important difference with our study is that subjects in the Güth and Tietz [
11] experiment only know their own auction price. Hence, coordination based upon forward induction or loss avoidance is not possible. Game play differs from typical studies. Proposers’ average price is forty-eight percent of the pie size while the Responders’ average price is twenty-seven percent of the pie size. Proposers’ average offer in the game is thirty five-percent of the pie, and Responders only rejected four out of thirty-six offers. While this is a very low rejection rate, it is hard to argue that a Nash equilibrium is reached because of heterogeneity in both Proposer play and the auction prices for both roles.
A third reason we can expect more Nash Equilibrium play in our experimental design is the impact of learning. We allow for fifteen periods in each of our sessions because a common and important feature of markets is repetition. Markets often require multiple repetitions prior to converging to competitive equilibrium even in the simplest settings (Smith [
12]), and thus one can conjecture we are most likely to obtain competitive prices and allocations through repetition.
However, we note previous studies of simple repeated ultimatum games have provided mixed evidence on whether players learn to play a Nash equilibrium.
4 Slonim and Roth [
13] conduct a ten round experiment with a random rematching of players each round. They have three treatments: low, medium, and high stakes. For all three stake levels, Proposers offer over forty percent of the pie, but there is a significant reduction in rejection rates going from the high- to the low-stakes treatment. The only significant play adjustment over time is that high-stakes Proposers learn to decrease their offers. Cooper
et al. [
14] examine a much longer sequence of plays–typically fifty rounds–and find nonsignificant growth in offer size and dispersion over time, but more importantly they observe reduced rejection rates over time for offers of less than thirty percent of the pie. List and Cherry [
15] adopt a 10 period random matching protocol, but first determine whether a Proposer negotiates over a twenty or one hundred dollar pie size by relative performance on a set of GMAT exam questions. Consistent with their design goals, the entitlements lead to less generous distributions of offers and greater rejection rates than found in the other repeated ultimatum game experiments. However, in the high stakes treatments these rejection rates fall significantly and are below fifteen percent the last three periods.
2. Experimental Procedures
Our experiment consists of ten sessions, with sixteen subjects in each session. Half of the subjects within a session are randomly assigned to the Proposer group, and the other half to the Responder group. In each of the 15 rounds of a session, four subjects from each of the two groups are selected to play a single iteration of the ultimatum game and these selected subjects pay a price for the right to play.
5The procedure to assign participation rights and determine participation fees differs by treatment, and the treatments are across subjects. In the Auction treatment, we conduct two multi-unit uniform price English clock auctions at the beginning of each round: one to determine the four Proposers and their participation fee, and another to determine the four Responders and their participation fee. We conduct five sessions of the Auction treatment, followed by five sessions of the Random treatment. In the Random treatment, we select four subjects at random from each of the Proposer and Responder groups at the beginning of each round. For the participation fees, we link each Random session to a different Auction session, and impose the sequence of auction prices as the sequence of exogenous participation fees for the Random session.
Every ultimatum game in our experiment has a pie size of ten dollars, and with positive participation prices it’s possible for a subject to have negative profits in a round. Hence, every subject is endowed with an initial fifteen dollar currency balance. This is not a loan. Any subject who participates in none of the games will exit the lab with twenty dollars.
6 We chose the endowed budget not so small it would be immediately binding, but it may become a binding constraint if a subject repeatedly makes decisions resulting in losses. We feel binding liquidity constraints arising from repeatedly poor outcomes is a natural part of a market allocation process.
7The multi-unit uniform price English auction commences with an initial clock price of zero, and all eight bidders are “in” the auction. As the auction price ticks upward, bidders can make an irreversible decision to exit the auction. The price clock remains at the opening price of zero for five seconds (giving an ample exit opportunity for those with a strong desire not to participate) and subsequently rises ten cents ($0.10) every second thereafter. As soon as at least four subjects exit the auction, the auction ends and the current clock price is paid by the four winning subjects.
8A subject typically exits an auction by clicking a button displayed on the computer screen. However, there are two instances in which the software automatically exits a subject. First, the software enforces a liquidity constraint; if the clock price exceeds a subject’s currency balance he is automatically exited from the auction. Second, if the auction price reaches the maximum price of ten dollars then four winners are randomly selected from the remaining bidders.
Both auction prices are announced to all subjects prior to the ultimatum game. During an auction, a subject receives information only about his own auction, including the number of bidders remaining. Also, the complete history of all auction prices from previous rounds is always shown on the screen, making the history of auction prices public information for all subjects.
In the Random treatment sessions, we allocate the scarce participation rights by randomly selecting four Proposers and four Responders each round. Each Random session is linked to a different Auction session. The imposed participation prices each round are the same prices realized in the matched Auction session. However, we don’t explain or suggest the source of these prices to the subjects in the Random treatment. Further, we want to ensure these subjects believe these prices are exogenous and in no way determined by their actions. To this end, We state the following in the instructions:
…Prices can vary across periods. These prices have been pre-selected, and your decisions today will have no influence on them. We have placed a list of the 15 group A prices and group B prices in the sealed envelope you see taped on the whiteboard at the front of the room. At the conclusion of this experiment, we will open this envelope and project this list of prices on the screen. Please use this opportunity to verify that the prices were in fact selected beforehand.
The ultimatum game phase protocols are the same in both our treatments. The four Proposers and four Responders are randomly formed into game pairs. A proposer chooses a division of ten one dollar bills (i.e., only integer proposals). This proposal is presented to the Responder who chooses to either accept or reject the proposal. After resolution of the ultimatum bargaining, the subjects’ currency balances are adjusted to reflect the prices paid for the participation rights and the game outcomes. In our experiment, the game outcomes are private information. Thus the decisions and outcomes of a pair are not revealed in anyway to the other participants. To summarize, a subject knows all the prices of completed auctions (or past exogenous participation fees) and also the outcomes of the games in which he participated.
We conducted this experiment at the Experimental Economics Center in the Andrew Young School of Policy Studies at Georgia State University. We recruited subjects by sending e-mail invitations to a random selection of undergraduate students who had previously expressed a willingness to participate in experimental studies by registering in a database consisting of approximately 2000 undergraduate students. We excluded any students who had previously participated in any ultimatum game studies.
3. Results
In this section we show the extent to which play converges to a session-specific threshold Nash equilibrium and corresponding auction prices support this equilibrium. With respect to Proposer play in the ultimatum game, the distribution of offers is characterized by low variance and a high frequency mode. Further, as we condition on time and session the frequency of the modal offer increases, indicating cross-session heterogeneity. Responders overwhelmingly accept modal or greater offers and at the same time reject offers below the mode at a high rate. In the Auction treatment, prices converge to levels such that forward induction accurately predicts the observed Nash Equilibrium. In matched Random and Auction treatment sessions, the same Nash equilibrium is typically played, providing support for the loss avoidance selection criterion. Specifically, in three matched session pairs we observe Nash equilibrium play corresponding to an offer of 3, and in the other two matched session pairs we see Nash equilibrium play corresponding to offer sizes of 2 and 4. We never observe play at the subgame perfect equilibrium.
Before considering subjects’ strategic choices, we examine whether the economic outcomes of our experiment are consistent with coordination on a threshold Nash equilibrium. Such equilibrium play should generate no change in the wealth endowment of subjects.
Table 1 reports the final average currency holdings by player role and treatment. The theoretical prediction is that these values should all be $15. Note that we have a strong rejection of this hypothesis only for the Responders in the Auction treatment. In a series of two sample
t-tests for treatment and role effects, there is only one case where we reject the absence of such effects. We reject that the Responder’s average balance is the same in both treatments with a
t-stat of −3.11.
9 We revisit the source of this treatment effect at the end of the section.
Table 1.
Average final currency balances of subjects by role and treatment.
Table 1.
Average final currency balances of subjects by role and treatment.
| Role | Auction | Random | Pooled |
|---|
| Proposer | 17.32 ** | 16.57 * | 16.94 ** |
| Responder | 10.82 *** | 14.32 | 12.57 *** |
| Pooled | 14.07 | 15.44 | 14.75 |
3.1. Play in the Ultimatum Game
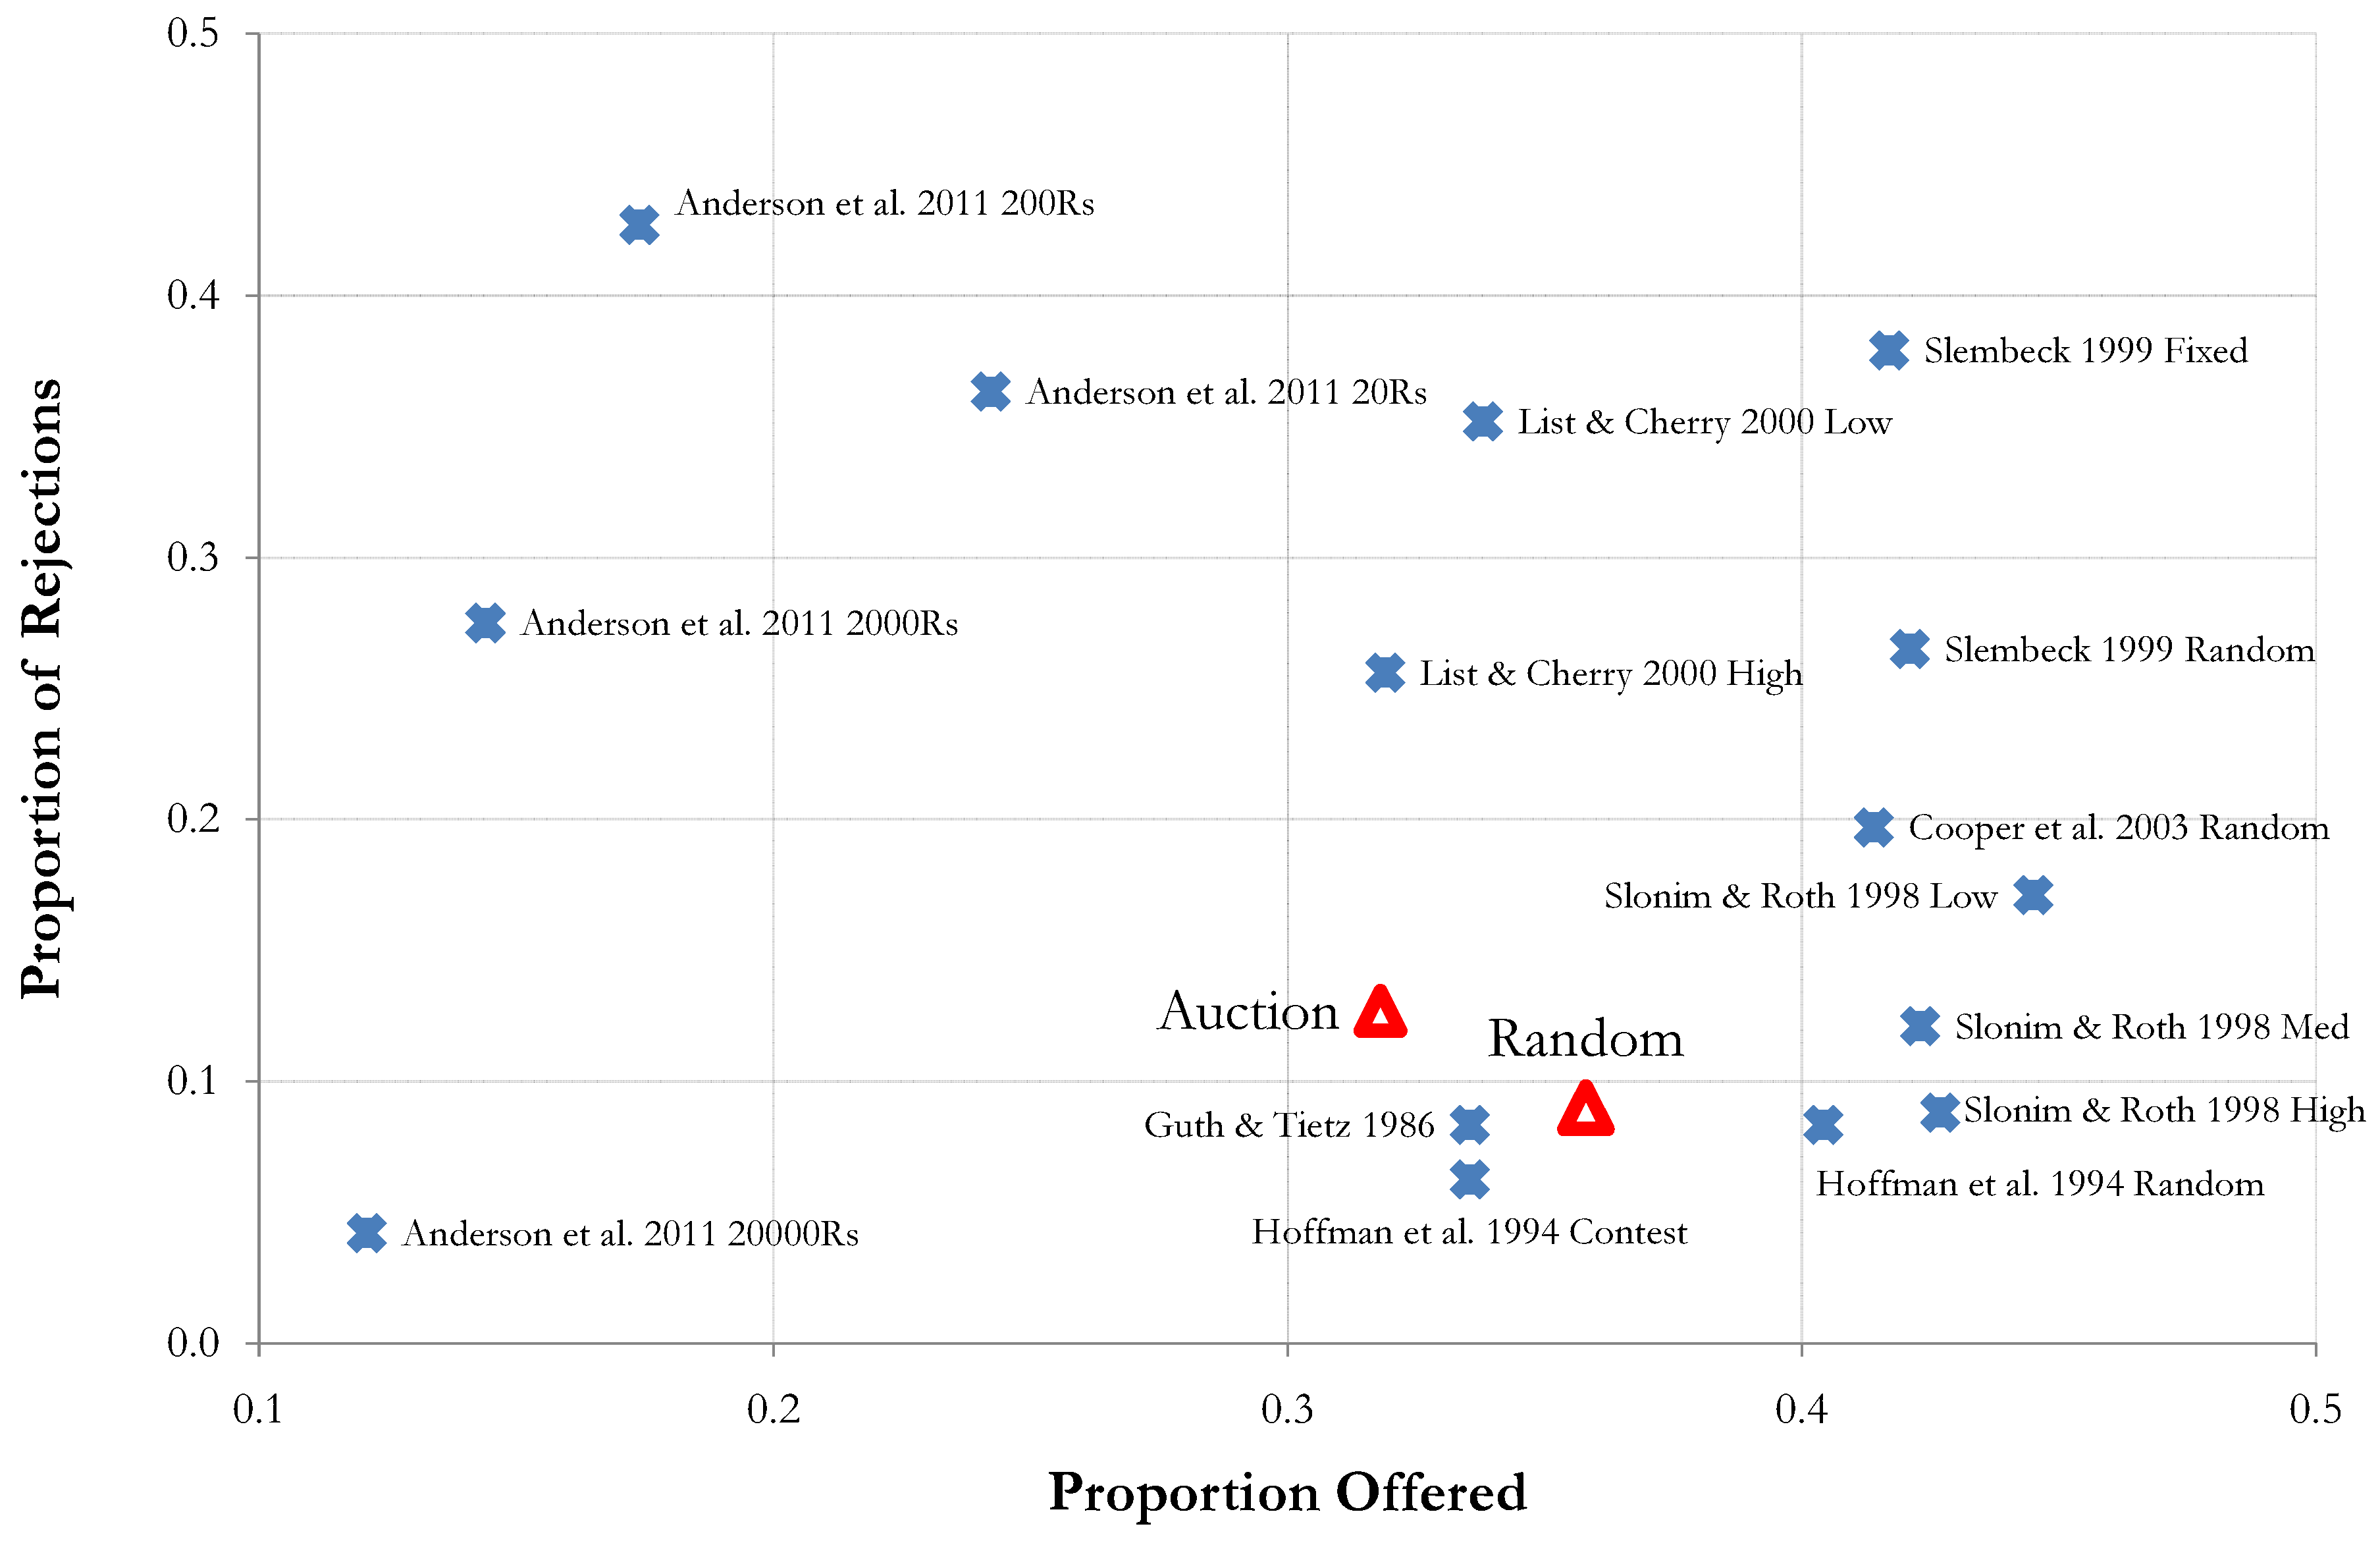
The average Proposer’s offer and Responder’s rejection rate are $3.18 and 12.7%, respectively, in the Auction treatment, and $3.58 and 9.0%, respectively, in the Random treatment. While clearly inconsistent with the subgame perfect prediction, these values are close to the observed minimum values seen in several experiments that attempt to facilitate subgame perfect play using treatments such as earned entitlement of role (Hoffman
et al. [
10], Güth and Tietz [
11]), suggestive framing and stake size (Andersen
et al. [
18]), and repetition with random matching (List and Cherry [
15], Slonim and Roth [
13], Cooper
et al. [
14]) or fixed matching (Slembeck [
19]).
Figure 1 presents a scatter plot of the results of various treatments from these studies; the
x-axis is the average proportion of the pie offered, and the
y-axis is the total proportion of offers rejected. We mark the observations from our Auction and Random treatments with triangles. Our low rejection rates are roughly consistent with Nash equilibrium play by Responders even at this highly aggregated level. However, we need to consider a more disaggregated view of the data to make conclusions regarding Proposer play.
Figure 1.
Proportions offered and rejection rates across studies and treatments.
Figure 1.
Proportions offered and rejection rates across studies and treatments.
One sees closer adherence to threshold Nash equilibrium play by inspecting the distribution of offers and the conditional rejection rates in
Table 2. In the Auction treatment, we see the distribution of offers is quite narrow. Over 92% of the offers are between 2 and 4 with a pronounced modal offer of 3 chosen 48.3% of the time. Offers in the Random treatment also have a narrow distribution; over 91% are between 3 and 5, with a less pronounced mode of 4. There is a significant treatment effect as we reject that the mean offer is the same in both the Auction and Random treatments at any reasonable level of significance.
10 With respect to Responder behavior, conditional rejection rates are suggestive of threshold Nash behavior: rejection rates are very low for offers greater than or equal to the mode, and rejection rates increase dramatically for offers less than the mode.
Table 2.
Gross offer distributions, conditional rejection rates, and basic statistics.
Table 2.
Gross offer distributions, conditional rejection rates, and basic statistics.
| Offer | Auction | Random |
|---|
| % Offered () | % Rejected () | % Offered () | % Rejected () |
|---|
| 0 | 0.3 (1) | 100.0 (1) | 0.0 (0) | – |
| 1 | 2.0 (6) | 66.7 (4) | 0.3 (1) | 100.0 (1) |
| 2 | 15.7 (47) | 23.4 (11) | 7.7 (23) | 39.1 (9) |
| 3 | 48.3 (145) | 12.4 (18) | 38.3 (115) | 10.4 (12) |
| 4 | 28.3 (85) | 4.7 (4) | 41.3 (124) | 4.0 (5) |
| 5 | 5.3 (16) | 0.0 (0) | 12.0(36) | 0.0 (0) |
| 6 | 0.0 (0) | – | 0.3 (1) | 0.0(0) |
| All | 100.0 (300) | 12.7 (38) | 100.0 (300) | 9.0 (27) |
| Mean | 3.18 | | 3.58 | |
One reason to expect that play may be more consistent with a Nash equilibrium is that forward induction based on the auction prices reduces strategic uncertainty. However, the formation of auction prices leading subjects to coordinate on a Nash equilibrium may take time. So we disaggregate the data in
Table 2 into five-period time blocks: periods 1–5, periods 6–10, and periods 11–15.
Table 3 provides this summary of early, middle, and late session play. The Proposers’ modal offer, highlighted for each sub-sample by bold-faced entries, decreases in the latter time blocks while the frequency of modal play correspondingly grows. We also see the Responders’ rejection rate for offers greater than or equal to the mode fall to very low levels, and rejection rates for offers strictly less than the mode are consistently much higher. While this time disaggregated view shows stronger Nash consistent play over time, this consistency is still understated by the aggregation across individual sessions. Shortly we show how different sessions are consistent with alternative threshold Nash equilibria. But for now we simply state the average frequency of the modal offer within a period and session is over 75% –
i.e., on average three out of the four Proposers’ offers are the same in the last five periods of a session.
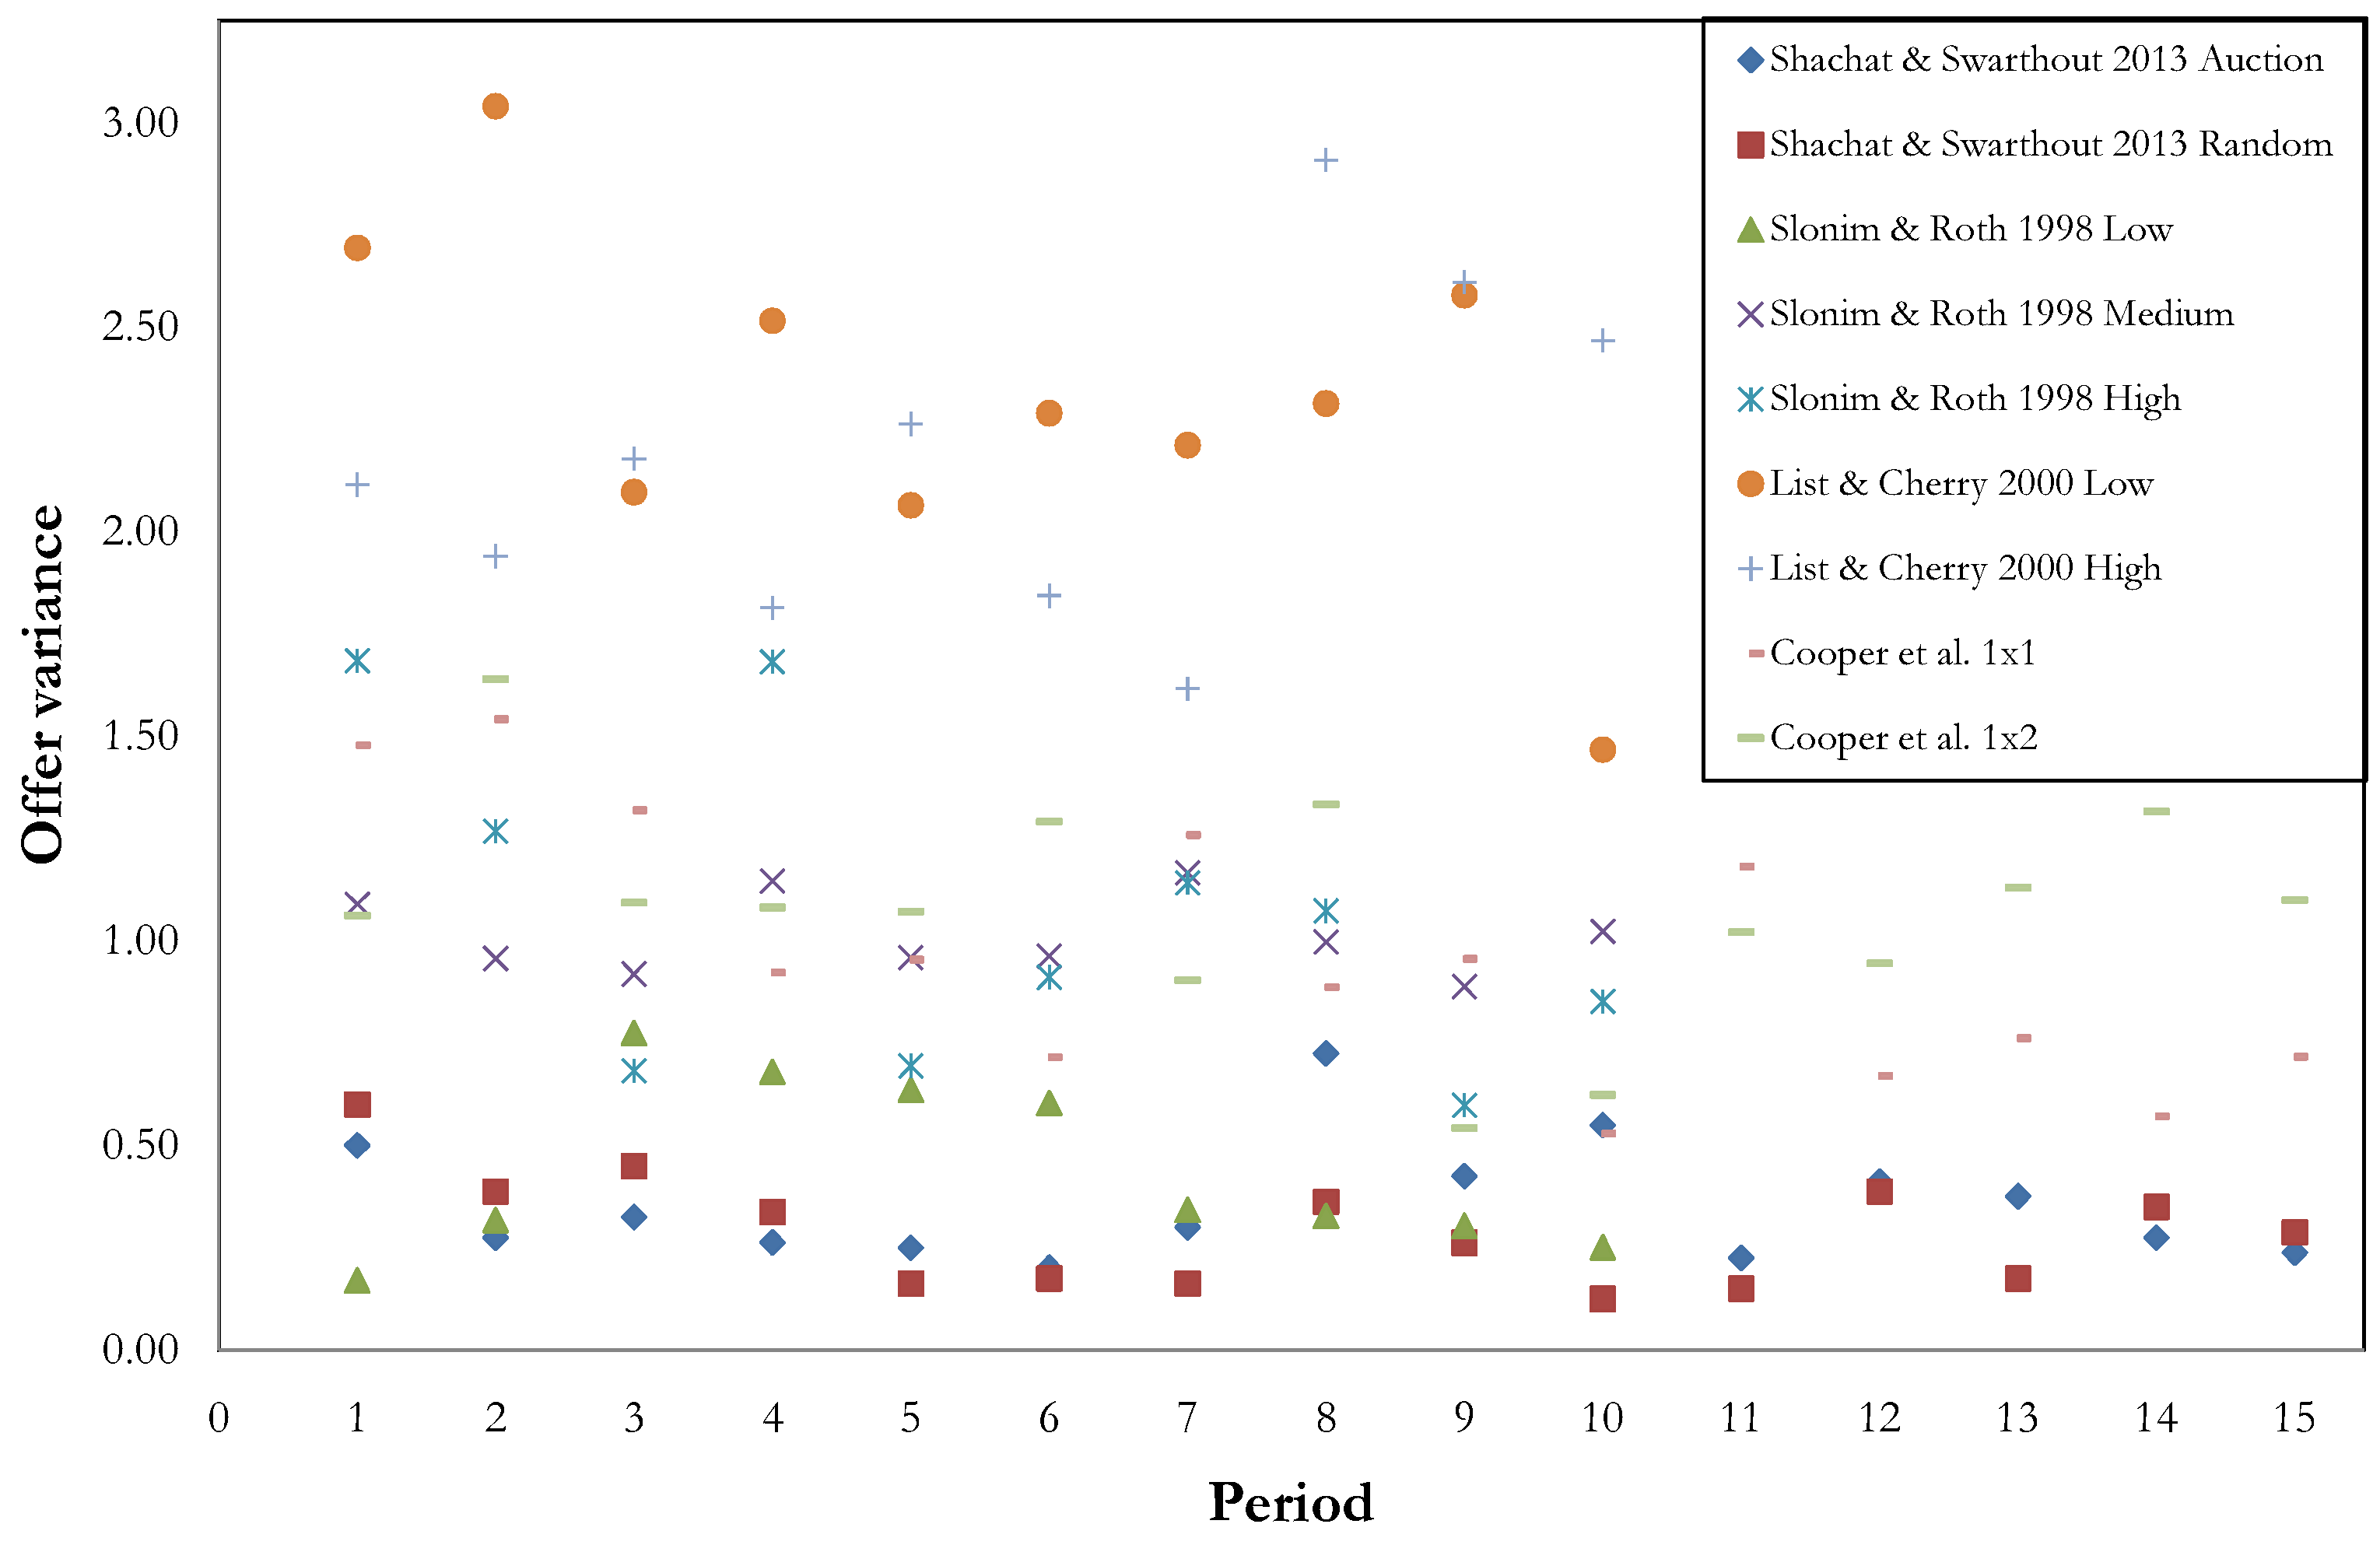
We further explore whether Proposers’ offer profiles converge within a session, especially relative to other studies, by considering the sample variance of the four offers within a specific period and session. In
Figure 2, we plot by treatment the time series of this statistic averaged across the five sessions. We also plot the comparable time series from the treatments of other repeated ultimatum game experiments which employed a random rematching protocol.
11 This figure clearly shows lower offer sample variances in our treatments, indicating more Nash equilibrium coordination than studies with simple repetition with random rematching.
Table 3.
Gross offer distributions, conditional rejection rates, and basic statistics over blocks of five periods.
Table 3.
Gross offer distributions, conditional rejection rates, and basic statistics over blocks of five periods.
| | Auction | Random |
|---|
| | Rounds 1–5 | Rounds 6–10 | Rounds 11–15 | Rounds 1–5 | Rounds 6–10 | Rounds 11–15 |
|---|
| | Off | Rej | Off | Rej | Off | Rej | Off | Rej | Off | Rej | Off | Rej |
|---|
| Offer | (%) | (%) | (%) | (%) | (%) | (%) | (%) | (%) | (%) | (%) | (%) | (%) |
|---|
| 0 | 0.0 | – | 0.0 | – | 1.0 | 100.0 | 0.0 | – | 0.0 | – | 0.0 | – |
| 1 | 0.0 | – | 3.0 | 33.3 | 3.0 | 100.0 | 0.0 | – | 0.0 | – | 1.0 | 100.0 |
| 2 | 9.0 | 44.4 | 10.0 | 30.0 | 28.0 | 14.3 | 5.0 | 60.0 | 4.0 | 50.0 | 14.0 | 28.6 |
| 3 | 36.0 | 22.2 | 50.0 | 10.0 | 59.0 | 8.5 | 27.0 | 25.9 | 33.0 | 12.1 | 55.0 | 1.8 |
| 4 | 42.0 | 2.4 | 34.0 | 8.8 | 9.0 | 0.0 | 46.0 | 6.5 | 51.0 | 3.9 | 27.0 | 0.0 |
| 5 | 13.0 | 0.0 | 3.0 | 0.0 | 0.0 | – | 22.0 | 0.0 | 12.0 | 0.0 | 2.0 | 0.0 |
| 6 | 0.0 | – | 0.0 | – | 0.0 | – | 0.0 | – | 0.0 | – | 1.0 | 0.0 |
| All | 100.0 | 13.0 | 100.0 | 12.0 | 100.0 | 13.0 | 100.0 | 13.0 | 100.0 | 8.0 | 100.0 | 6.0 |
| Mean | 3.59 | | 3.24 | | 2.72 | | 3.85 | | 3.71 | | 3.18 | |
Figure 2.
Within session offer variances across studies and treatments.
Figure 2.
Within session offer variances across studies and treatments.
3.2. Auction Prices and Equilibrium Selection
We now turn our attention to the realized Proposer and Responder auction prices. Our analysis focuses on whether, within a session, prices emerge that are consistent with a threshold Nash equilibrium. Let be the price from the Proposer auction, and be the price from the Responder auction. Recall, according to forward induction, an auction winner expects an ultimatum game payoff at least as large as the incurred auction price. For an auction-winning Proposer this implies making an offer no greater than . For an auction-winning Responder this implies receiving an ultimatum offer no less than . We define a payoff expectation consistent (PEC hereafter) offer as any offer between and .
We conjecture Proposers make PEC offers when feasible, and Responders accordingly accept. According to the refinement concepts of forward induction and loss avoidance, a Nash equilibrium in the ultimatum game is selected when there is a unique PEC offer. However, when
exceeds
, then the sum of the prices is greater than 10. This not only reflects uncoordinated beliefs, but also results in a
negative net pie size, which means no offer can provide both players with non-negative period payoffs.
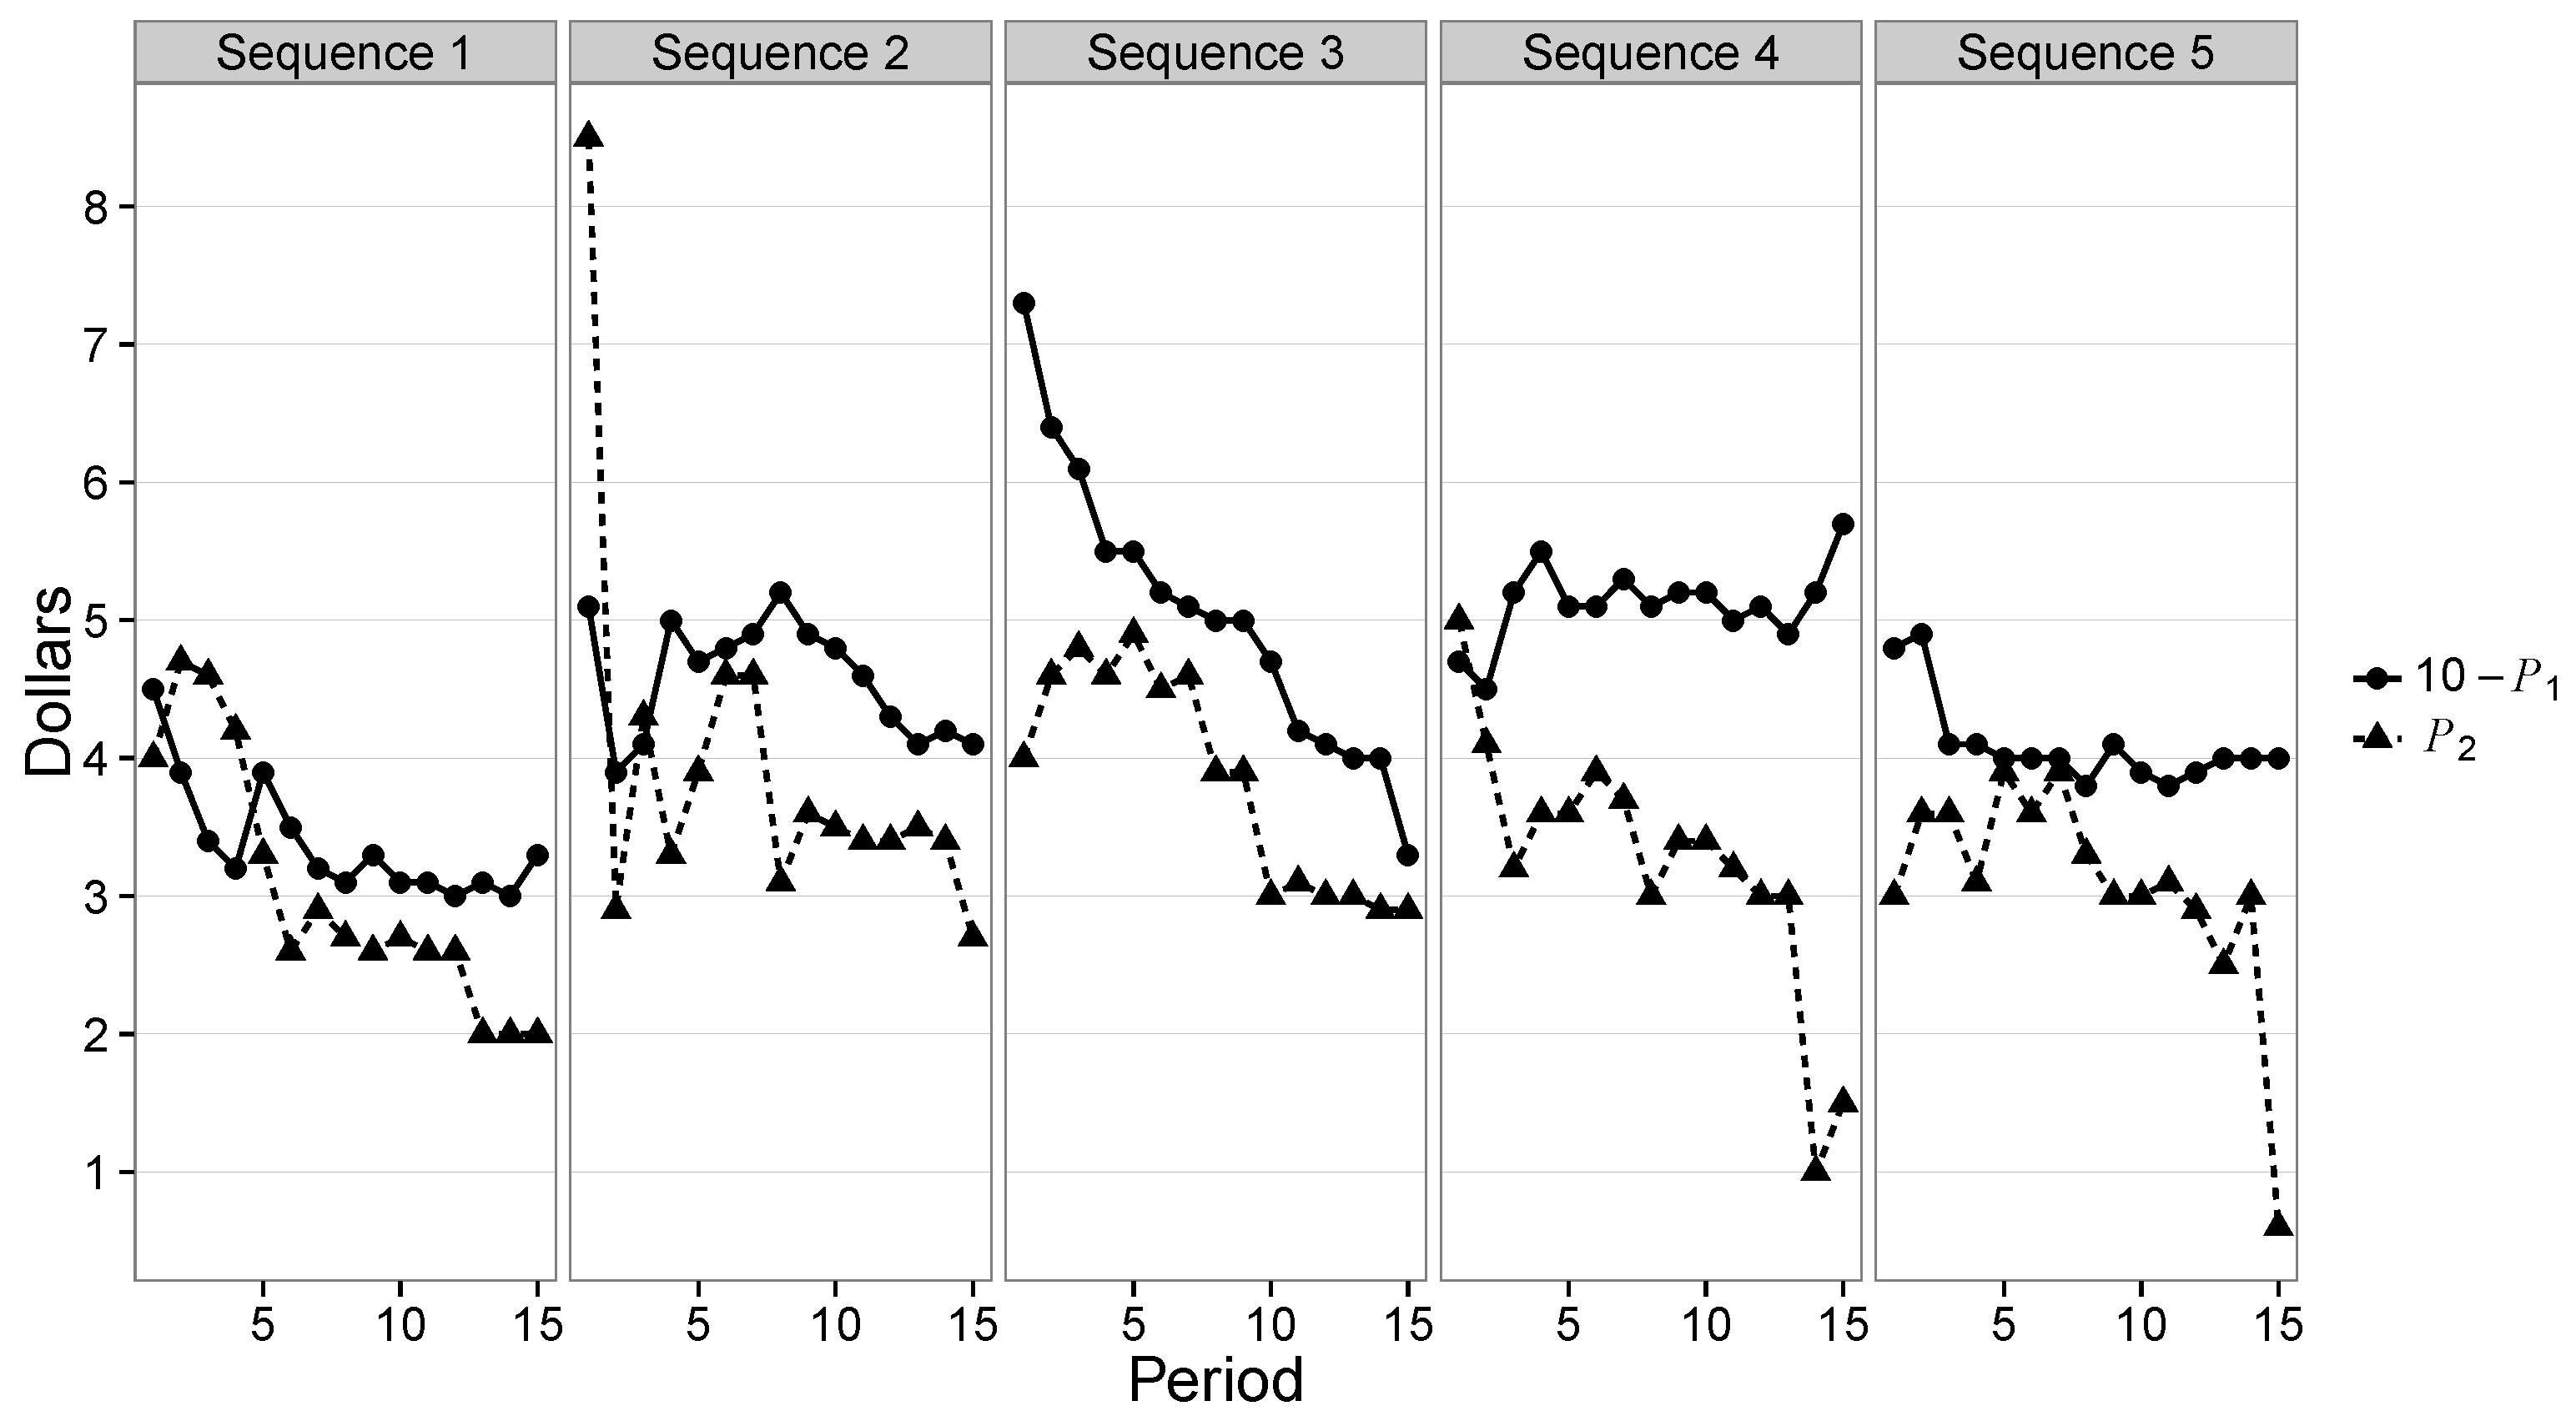
12At the beginning of a session there is little reason to expect such equilibrium beliefs and corresponding prices. So we examine the evolution of
and
in each Auction session by plotting these time series in
Figure 3. In four out of five Auction sessions, early period prices reflect non-equilibrium beliefs. In price sequences 1, 2, and 4 we observe one or more early periods in which
exceeds
, and in sequence 3 we observe initial prices that allow for multiple possible mutually-profitable offer levels. In each sequence we observe prices reach and maintain values that support a unique offer level. One confound is a possible end-of-experiment effect in three sessions. In Price Sequences 1, 4, and 5 we see sudden price drops leading to multiple PEC offer levels.
Figure 3.
Plots of and for the Five Price Sequences.
Figure 3.
Plots of and for the Five Price Sequences.
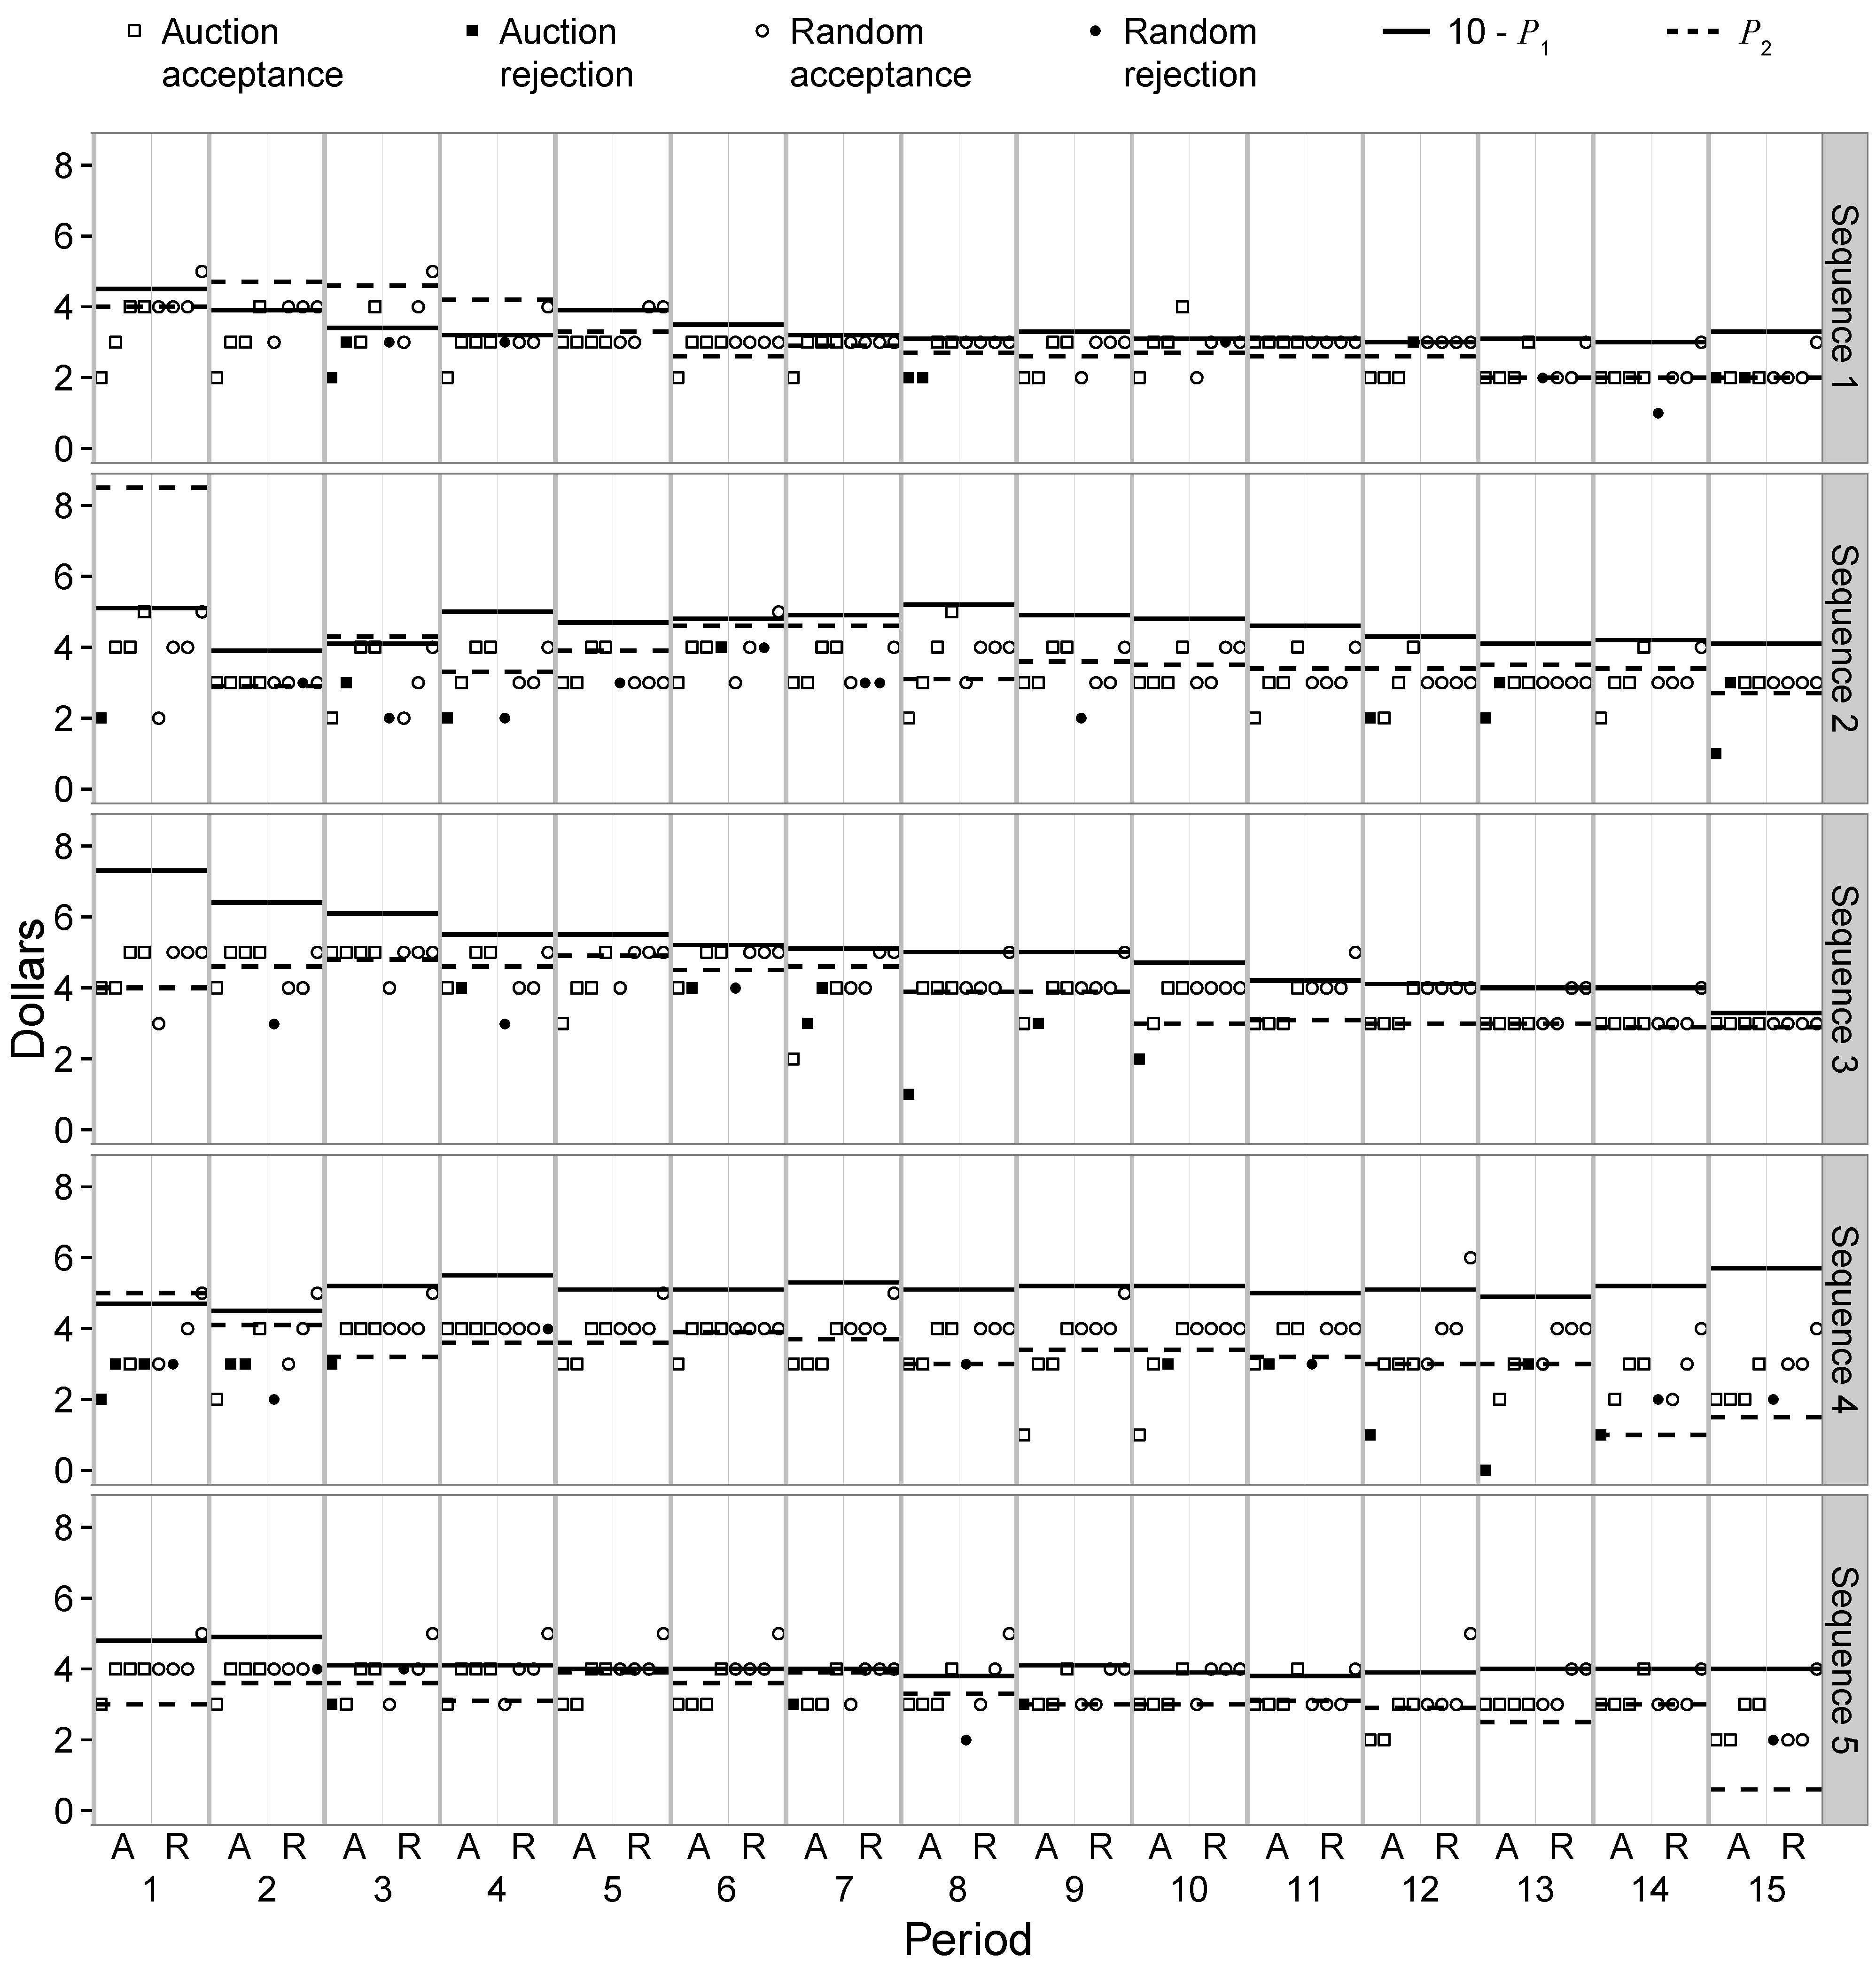
Given a set of realized auction prices (or participation fees, in the case of the Random treatment), does the subsequent sequence of ultimatum game outcomes consist of accepted PEC offers? We first address this question with a visualization of the fully disaggregated data of ultimatum game play overlayed with the price variables
and
in
Figure 4. This figure consists of five plots, one for each price sequence. The
y-axis in each plot is price and the
x-axis is period. Notice that each period is separated into halves by a light grey vertical line. Offers from the Auction treatment are plotted on the left side of this line with squares, and offers from the matched Random treatment are plotted on the right side of the line with circles. An open marker shows an accepted offer, and a filled marker indicates a rejected offer. Two horizontal lines span each period: the solid line is
and the dashed line is
.
Figure 4.
All play in Ultimatum Games with and superimposed.
Figure 4.
All play in Ultimatum Games with and superimposed.
Each price sequence generates distinct patterns of behavior. We briefly discuss each of these.
Price Sequence 1: Initial high prices and negative net pies in periods 2 through 4 correspond to high varying offers. However, in the middle periods, offers and prices coordinate on the offer size of 3. Interestingly, the Proposers’ auction price in period 12 is exactly 7 and then prices and play start to adjust to an equilibrium offer of 2 as the sequence ends.
Price Sequence 2: A very high initial Responder auction price results in strategic uncertainty and a lack of PEC offers available in five of the first seven periods. Correspondingly, there is significant variance in the chosen offers. In periods 9 through 14, only the offer of 4 is PEC with the auction prices, but 3 is the modal offer in both treatments. In the final period, the Responder’s price drops below 3, making the offer of 3 a PEC offer.
Price Sequence 3: Prices and play show a very clear trend of a decreasing selection of the offer from 5 to 3.
Price Sequence 4: Initial prices do not provide a PEC offer and quickly adjust to give varying support for the offer level of 4. Game play is largely consistent with this until period 9. Then we start to see some very low offers in the Auction treatment, a number of which are rejected. This is followed by diverging prices and an increasing spread in offers, in both treatments, as strategic uncertainty increases.
Price Sequence 5: Price and play quickly settle on the offer of 4. But then Proposers in the auction treatment increasingly make offers of 3. This leads to Responders’ auction prices falling to just below 3. In the last period the large drop in the Responders’ price creates multiple PEC offer amounts and consequently a wider range of offers.
We summarize the coordination between auction prices and game play by reporting, for the stage games having feasible PEC outcomes, the frequency of PEC offers and corresponding rejections.
Table 4 summarizes play from the 252 games in each treatment with prices resulting in the availability of PEC offers. We classify offers made in these games according to whether they are PEC, strictly less than
, or strictly greater than
. We also report the same counts for the subset of 120 games that have a unique feasible PEC outcome. Our first observation is that when Proposers can make PEC offers they do so 64% of the time in the Auction treatment, and 77% of the time in the Random treatment. When a unique PEC offer exists, these respective proportions fall to 48% and 63%. In each case, a binomial test rejects these proportions as the same across the two treatments at any reasonable level of significance.
PEC offers are rarely rejected. Responders only reject 1 out of 162 PEC offers in the Auction treatment and only 4 out of 194 PEC offers in the Random treatment. However, in the case of offers less than there is a striking increase in the rejection rates: 27 out 88 cases in the Auction treatment and 14 out of 46 cases in the Random treatment.
The greater likelihood of PEC offers in the Random treatment provides insight into the treatment effect of higher offers in the Random treatment than in the Auction treatment. The greater propensity of PEC offers in the Random treatment suggests that exogenous sunk participation costs bolster loss avoidance behavior more so than endogenous sunk costs from auctions. This willingness of Auction Responders to reject non PEC offers is a possible source of their statistically significant lower earnings. One explanation for this behavior is that market allocation of participation rights may cause subjects to be less averse to imposing losses on others. Alternatively, the auction process may lead to self-selection of subjects who are more likely to impose losses on others. We conclude the paper with a discussion of this issue.
Table 4.
Counts of PEC offers, non-PEC offers, and corresponding rejections conditional on in the 300 stage games of each treatment.
Table 4.
Counts of PEC offers, non-PEC offers, and corresponding rejections conditional on in the 300 stage games of each treatment.
| | Auction treatment | Random treatment |
|---|
| PEC Offers Available | Unique PEC Offer | PEC Offers Available | Unique PEC Offer |
|---|
| Count | Rejections | Count | Rejections | Count | Rejections | Count | Rejections |
|---|
| PEC Offer | 162 | 1 | 58 | 1 | 194 | 4 | 75 | 4 |
| Offer | 88 | 27 | 60 | 11 | 46 | 14 | 35 | 4 |
| Offer | 2 | 0 | 2 | 0 | 12 | 0 | 10 | 0 |
| Sum | 252 | 28 | 120 | 12 | 252 | 18 | 120 | 8 |
4. Discussion
At the outset we offered two distinct motivations why auctioning participation rights may impact behavior in the ultimatum game. On one hand, the game-theoretic equilibrium selection concepts of forward induction and loss avoidance provide a basis for auction prices to reduce strategic uncertainty and encourage the play of a threshold Nash equilibrium. On the other hand, behavioral economics suggests that introducing the auction phase can influence the norms or social preferences players hold, by moving from endowed to earned entitlements of player positions. If these factors indeed accurately characterize human behavior, we should see movement towards–and in the extreme case complete convergence to–subgame perfect play. We observe stronger coordination on offers by Proposers than seen previously, as well as Responder behavior consistent with the associated threshold Nash equilibrium. Thus, we conclude the more game-theoretic story holds, since a Nash equilibrium is selected. While it is never the subgame perfect one, the offers are quite low and we observe less demand for fairness by responders. So why are the selected equilibria associated with larger shares for the Proposer but never the subgame perfect one?
We conjecture the selection of equilibria with game payoff profiles such as (8,2) and (7,3) rather than (9,1) could arise from a lemons market phenomenon. Specifically, the market allocation of participation rights leads to an endogenous separation of different social preferences types rather than alteration of preferences by changing the decision context. Imagine one potential Responder who has a rather strong preference for equal splits in the bargaining phase and a second potential Responder who has concern only for his own monetary payoff. If a history of auction prices align such that there is a likely expectation of an offer of 7, then the second responder is likely to have a higher willingness-to-pay than the first in the auction.
In the selection of a threshold Nash equilibrium, it’s crucial that the set of Responder auction winners contain only those who will accept the Proposers’ offer. Thus, a selected equilibrium must include an offer large enough that it generates a correspondingly high enough price to sort out the “lemon” Responders whose preferences would lead them to reject the equilibrium offer. At the subgame perfect equilibrium where the offer is 9, the supporting auction prices would be greater than $8 for the Proposers and less $1 for the Responders. At such a low participation price for Responders, it’s likely that someone with preferences consistent with rejecting an offer 9 – even when he has a high expectation of that offer – could be selected to the bargaining phase. So we can see that the market allocation of participation rights can facilitate the selection of a Nash equilibrium, but it must be one in which the Responder’s price is high enough to provide enough separation of social preference types so that all auction winners will accept the equilibrium offer.
13While this lemons market conjecture is intuitive, unfortunately it is difficult to test. One of the primary difficulties is the formulation of an individual’s certainty equivalent to play the ultimatum game. When deciding upon a bid, which in theory is this certainty equivalent, the potential player must formulate a subjective probability distribution over the joint payoff outcomes in the subsequent game. Then if his preferences are over joint payoff earnings, how does that translate into a certainty equivalent which is defined solely over his own wealth? Future efforts will be made to answer these questions and design an experiment to directly address these issues.

