1. Introduction
Brain Electroencephalogram (EEG) signals are widely used for constructing Brain Computer Interfaces (BCI) with applications in motor rehabilitation, gaming and diagnosing brain disorders [
1,
2,
3,
4,
5,
6]. Most of the BCIs use EEGs signals collected from the user when he/she images hand or foot movement (motor imagery) [
7,
8]. Gamification and virtual environments are used nowadays to build motor imagery-based BCI’s [
9]. There are BCIs that use Steady State Visual Evoked Potentials (SSVEP) [
10,
11,
12,
13], where a larger number of control signals can be extracted to interface the user with a BCI application called PathSpeller [
14,
15,
16,
17]. EEG-based BCI’s can also be built with very few channels for gathering brain electrical activity [
18,
19]. EEG is collected by the placement of electrodes using an electrode cap over the subject’s head, and conductive gel is used to improve the contact of the electrodes on the scalp. This technology is noninvasive, with minimal risk that makes them affordable and comfortable to use [
20]. Most of the current EEG-based applications have used only one sensory motor function such as the motor imagery function, or visual imagery. Other cognitive functions such as audition (hearing) and olfaction (smell) have not been used in medical diagnosis for disorders such as early stages of cognitive impairment. It has been shown that EEG signals in response to auditory signals received in the left and right ear are better discriminable than the EEG responses to auditory signals received from the front and back directions of the head [
21]. However, the discriminatory power of audition (hearing) and olfactory (smelling) EEG signals have not been studied in different age groups. Also, there is no classifier built or tested that can discriminate between auditory, olfactory, motor imagery, and motor movement brain EEG responses. First, we have to determine how reliable are brain electrical responses to auditory and olfactory stimulus and how well they can be discriminated against motor imagery or motor movement responses [
7,
22]. In this paper, we present a deep network to classify the brain’s EEG responses to each of these stimulus, as well as analyze how well the EEG responses to the four sensory motor stimulus are discriminable in different age groups between 20 to 40 years, 40 to 60 years, above 60 years, and also a group of participants with a mild memory dysfunction. Mild memory dysfunction is a symptom of Mild Cognitive Impairment (MCI) and is a key to the early diagnosis of progressive brain disorders. Below is a literature review on detecting MCI using different neuroimaging techniques.
2. Literature Review
Progressive neural brain disorders such as Alzheimer’s Disease (AD), a type of dementia, causes cognitive and functional deterioration in the aging brain, and it is a leading cause of deaths, estimated to reach 7.1 million in 2025, with a 61% mortality rate if the patient is age 70 or older [
23]. Brain structural and functional connectivity using graphs shows patterns of differences in these disorders [
24]. Most of these disorders affect cognition and result in a long duration of dependency on caregivers [
25]. Cognitive functions such as memory, thinking, and behavior decline at a rapid rate as the disease progresses. At an early stage, the cognitive decline is not significant and may not hinder daily activities. This stage is called Mild Cognitive Impairment (MCI), which is difficult to distinguish from aging-related cognitive dysfunctionality. It is important to detect MCI in the early stages, which is a key to rapid interventions and clinical attention. The current clinical diagnosis methods consist of a battery of cognitive tests and brain imaging. The brain imaging methods include Computed Tomography (CT), Magnetic Resonance Imaging (MRI) and Positron Emission Tomography (PET). Many researches focus on MCI detection using state-of-the-art time-frequency and deep learning techniques. An early detection of deterioration of these functions is a key to rapid interventions and clinical attention. Resting-state brain networks from functional MRI (fMRI) images are constructed and used to train an autoencoder network to distinguish between normal aging and MCI [
23]. Other brain functional network and machine learning methods are found in [
24,
25]. Graph Convolution Networks (GCNs) are trained with functional connectivity maps from fMRI images, which are then used to predict MCI [
26,
27]. A feature-based deep Convolutional Neural Network is used in [
28] to distinguish between Early MCI (EMCI), Late MCI (LMCI), Normal Control (NC), and AD. Tissue measurement differences from Diffusion Tomography Images (DTI) have been used to train a Recurrent Neural Network (RNN) [
29] for identification of prodromal MCI cases, who are likely to develop AD. Statistical
t-test features extracted from MRI and projected on to a partial least squares subspace multiclass classifier is used to classify MCI against AD [
30]. All of the above methods have used the collected and integrated multi-modal brain image database (ADNI) [
31]. The accuracies for detection of early Alzheimer’s from fMRI images are about 72% with a Minimum Mean Square Error (MMSE) of about 28%. The GCN and CNN methods show an improvement in accuracy to about 84% and 94%, they require a lot of data and images for training, and do not provide results in real time for early detection of MCI. While 2D and 3D brain imaging is widely used as a diagnostic method for MCI and AD, it is expensive, not readily available, static, does not have temporal resolution, and is not affordable by many patients.
Multi-channel Electroencephalogram (EEG) is a non-invasive, rapid, cost-effective brain imaging method that records electrical brain activity with a very high temporal resolution when the subject is at a resting state or performing certain tasks. Cognitive tasks and EEG Fourier transform features of power spectral density, variance, fractal dimension, and Tsallis entropy have been fused and a kNN classifier is used to distinguish early and mild dementia from normal subjects [
32]. A biomarker from the changes in the EEG amplitude [
33], and EEG relative power [
34] have been proposed for the early detection of AD. The EEG brainwaves can be divided into alpha, theta, beta, gamma, and delta bands depending on the frequencies of the components. These brainwave subbands are projected onto 2D images and used to train a CNN classifier for early detection of AD in [
23]. While Fourier transform frequency domain features have been found to be useful for EEG based classification of medical conditions, EEG is more amenable to time–frequency analysis as the frequency components in these signals change considerably over time. There are different methods for time-frequency feature extraction such as Short Time Fourier Transform (STFT) and Continuous Wavelet Transform (CWT) [
35]. Epoched time frequency representation of EEG signals are used to train a deep CNN, which is then used to distinguish between MCI and AD subjects [
36]. Both Fast Fourier Transform (FFT) and CWT features have been used to train a classifier, which is used to identify dementia in [
37]. All of the above EEG-based methods for early diagnosis are based on recorded resting state EEG. There are some methods that use visual and memory tasks for early detection of MCI [
38]. There is one research where the subjects are required to perform a visual memory task and EEG is recorded during the performance of this task. Event Related Potential (ERP) analysis of the EEG is used as an early biomarker on working memory task for early diagnosis of MCI [
39]. MCI related to vascular dementia can also be diagnosed using EEG recorded during an oddball experiment in [
40]. ERP analysis of EEG recorded during a sound stimulus has been used to detect dementia in subjects with diabetes [
41]. The literature above show that EEG is a promising tool for early detection of MCI. However, they have not studied or presented a method for discrimination of EEG collected during performance of audition, olfaction, motor movement, and motor imagery tasks, and how it can be used for early detection of MCI.
Early dementia implies impairment of cognitive functions such as sensory perceptual (visual, auditory, olfactory, tactile) and memory functions. Especially olfactory dysfunction has links to early cognitive impairment and can be effectively used for early screening for MCI, and conditions that can progress to MCI [
42]. It has been shown that olfaction, audition functional biomarkers can serve as detectors in screening for cognitive impairment, as well as for interventions. Current healthcare equipment does not detect small changes in sensory motor functions, thus, not allowing an early diagnosis of mental cognitive decline. Also, olfaction and audition have associations in age-related deterioration of cognitive ability. Hence, in this study, olfactory, auditory, motor imagery, and motor imagery functions are considered in healthy subjects of different age groups in comparison to mildly demented subjects. Nowadays, EEG and EMG equipment are available at a very low price that can be afforded by patients with no means for costly brain imaging methods. In this paper, we present a Deep Bidirectional Long Short-Term Memory Recurrent Neural Network architecture that integrates and evaluates EEG/EMG sensory motor responses to auditory, olfactory, and motor stimuli to detect early cognitive deterioration caused by Mild Cognitive Impairment (MCI) and discriminate early MCI from normal aging.
Section 3 presents an overview of the Materials and Methods used including a description of the different age groups and MCI group of human study subjects, equipment used, experimental procedure, data processing, and deep learning architecture for classification.
Section 4 presents and discusses the EEG from sensory motor function classification results, and
Section 5 presents the conclusions.
3. Materials and Methods
This section describes the equipment used, subjects, data acquisition and preprocessing, and the Bidirectional Long Short Term Memory (BLSTM) network used for EEG classification.
3.1. Subjects
A total of 35 subjects participated in the experiments, with seven in each age group of 20 to 40, 40 to 60, and 60 and above. Eighteen were female subjects, and 17 were male subjects. Twenty-eight normal healthy subjects and seven subjects with mild memory dysfunction, an indication of MCI were recruited. In total, 35 subjects participated in the study. All the subjects come from the same demographic background, are educated and employed. Participation was voluntary, and prior Institutional Review Board (IRB) approval from the University of Puerto Rico, Mayaguez (UPRM) was obtained before conducting the experiments.
3.2. Data Acquisition
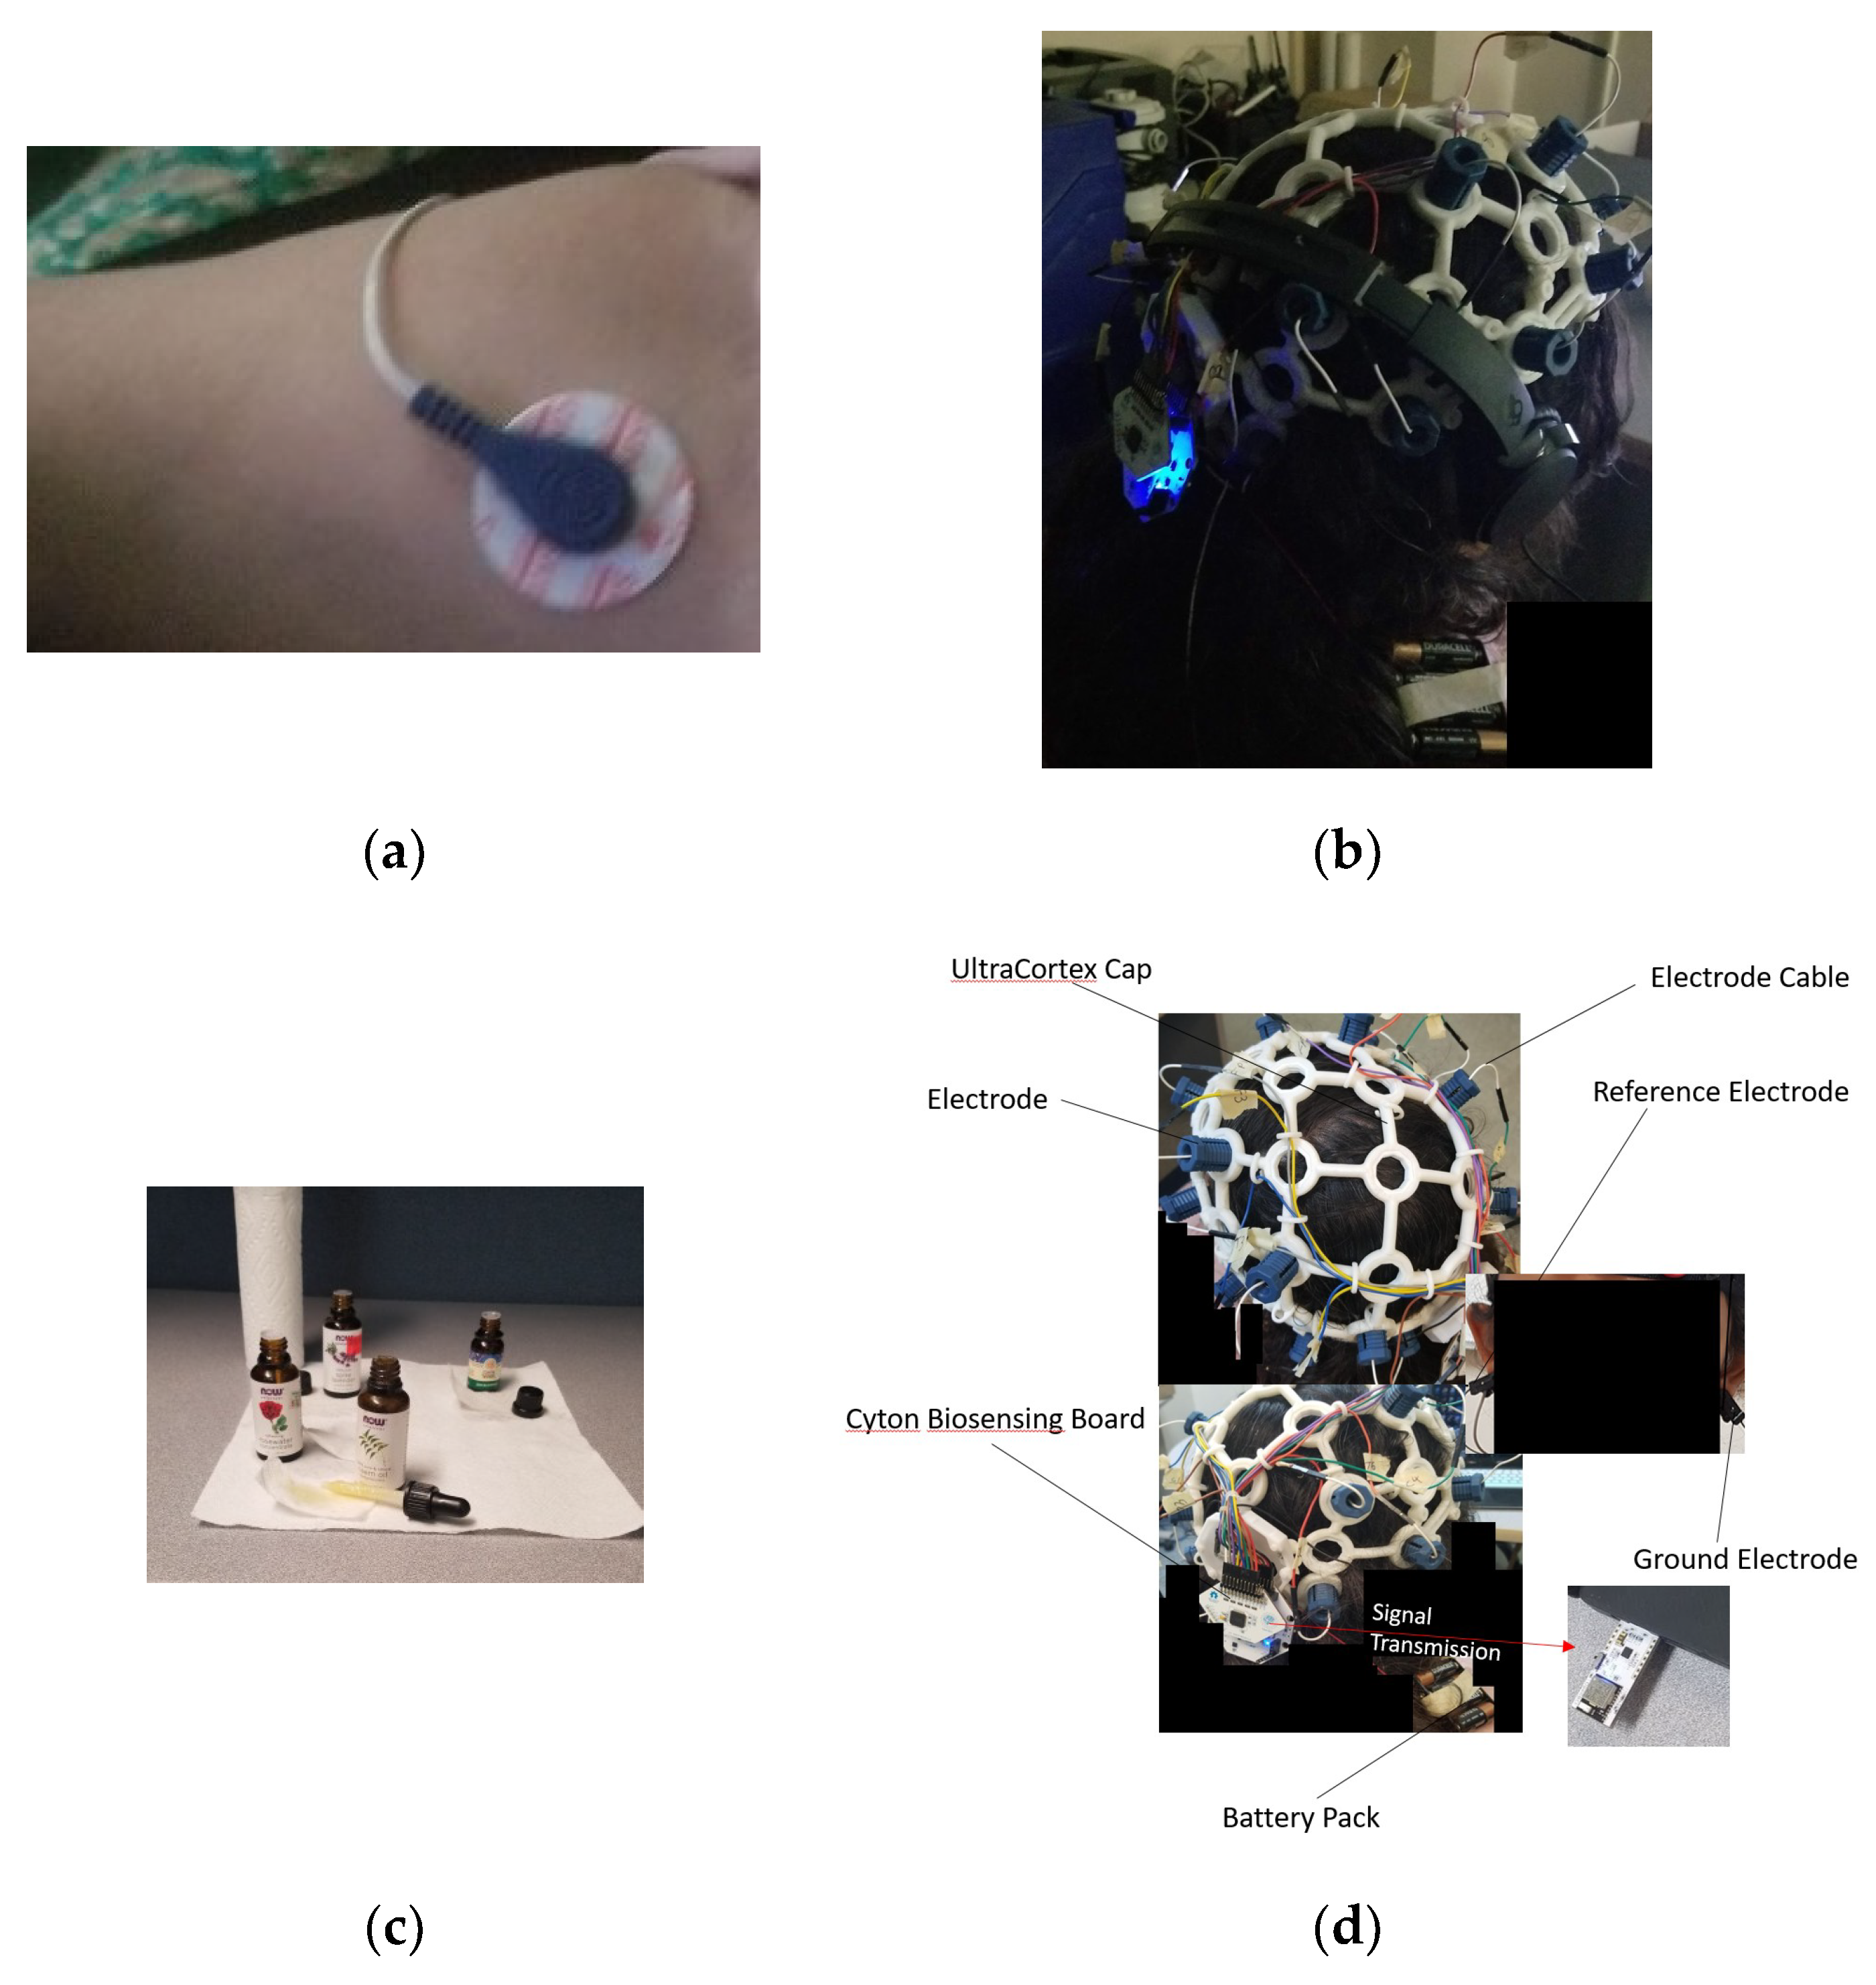
EEG data is recorded using the Ultracortex openBCI headset electrode system with 16 electrodes. One electrode is used to record Electromyogram (EMG) during hand movement from the left arm and right arm. The 16 electrode EEG cap records EEG from the following channels in the 10–20 system: Fp1, Fp2, F3, F4, F7, F8 from the frontal lobe; C3 and C4 from the motor area; T3, T4, T5, T6 from the temporal lobe; O1 and O2 in the occipital lobe; and P3 and P4 from the parietal lobe.
3.3. Task Description
Each subject participated in a session with five trials per task, for four tasks. Each trial lasts 60 s. There are four tasks, which includes collecting (1) EEG/EMG data during left hand followed by right hand movement, (2) EEG data collection during left hand and right hand motor imagery tasks, (3) EEG data collection while presenting auditory stimulus through headphones, and (4) EEG data collection during smelling of four types of perfumes (lavender, eucalyptus, rosewater, and neem) presented using a sniff strip. EEG data is collected for auditory, olfactory, motor imagery functions, and EEG/EMG data for motor movement functions. There is a break of 10 seconds between each trial, and a break of 2 minutes between each task. For recording auditory EEG response, the subject is presented with auditory stimulus through headphones in the left and right ear. The 16-channel EEG cap is worn by the subject and is connected to the cyton biosensing board. The board transmits the EEG signal wirelessly to the openBCI v5.0.1 software in the computer. The stimulus consists of eight-directional sound beeps produced at random from eight different directions (East, West, North, South, North-East, North-West, South-East, and South-West) using the HRTF (Head Related Transfer Function), a method for simulating the direction of sound arrival. The subject has the eyes closed and pays attention to the sound stimulus for the duration of the trials, while the 16 channel EEG signal is recorded by the openBCI GUI in the computer. The olfactory stimulus consists of four different odors (Eucalyptus oil, Lavender oil, Neem oil, and Rosewater) presented on strips of paper placed under the nose of each subject during the duration of the trial. The subject is asked to close the eyes and focus on the smell while the 16-channel EEG is recorded. The motor imagery experiment consists of imagining movement of the left arm away from the body, and the EEG data is recorded. This is followed by recording of the EEG during the imagination of movement of the right arm away from the body. For the hand movement task, the subject is asked to open and close the fist of each of the right and left arm when 15-channel EEG and 1 channel EMG signals are recorded. The P4 channel of the openBCI 16-channel board is replaced with the signal from the Electromyogram (EMG), which is recorded from the EMG electrode placed on the arm of the subject. The multi-modal EEG/EMG signals for each of the tasks are epoched in time intervals and organized in to training, validation, and testing matrices.
3.4. Data Collection Procedure
Figure 1 shows the equipment used for data collection. The subject is asked to sit comfortably in a chair. The subject is fitted with the ultracortex headset, and the EMG electrode is placed on the left arm as shown in
Figure 1a. During data collection, the subject has the eyes closed. This reduces noise in the EEG due to eye blinks. The subject opens and closes the left fist for 1 min five times with a break of 10 s between each minute. During this time, EEG and EMG data are collected using the 16 channel Cyton biosensing board (
Figure 1d), and the data is transmitted wirelessly to the computer through the dongle. The data collection is manually synchronized with the commencement of the task. The same procedure is repeated for collecting EEG and EMG data for right hand movement. The second task is motor imagery, the EMG electrode is removed and the P4 channel is connected to the ultracortex and the Cyton board. The subject closes the eyes and imagines movement of the left hand away from the body for five trials, followed by imagining movement of the right hand for five trials. The subject is then fitted with the headphones as shown in
Figure 1b. The subject closes the eyes and the sound stimulus is presented, and the subject is asked to focus on hearing the sound. The EEG data collection is started manually and is recorded for 5 minutes with a break of 10 seconds between trials. The olfaction task consists of four subtasks that include sniffing the perfumed sniff trips. Four sniff strips are perfumed each with lavender, eucalyptus, rose water, and neem scents. The final task is presentation of the sniff strips scented with each of the four oils. The subject is asked to close the eyes, the sniff strips are placed under the nose of the subject, and the subject is asked to focus on the smell. The EEG data is collected simultaneously for five trials with a break of 10 seconds between trials for each of the four sniff strip presentations. The data collected for each of the task are labeled with the subject’s initials, name of the task and the trial number. The data is a matrix of 16 columns with rows being the samples.
3.5. BLSTM-Recurrent Neural Network
A Recurrent Neural Network (RNN) uses a hidden state vector to represent context based on prior inputs and outputs, to be considered along with the current state when generating an output. The input vector undergoes a series of transformations to produce a series of output vectors. Because this is advantageous in terms of network accuracy, RNNs are useful for analyzing time-series data [
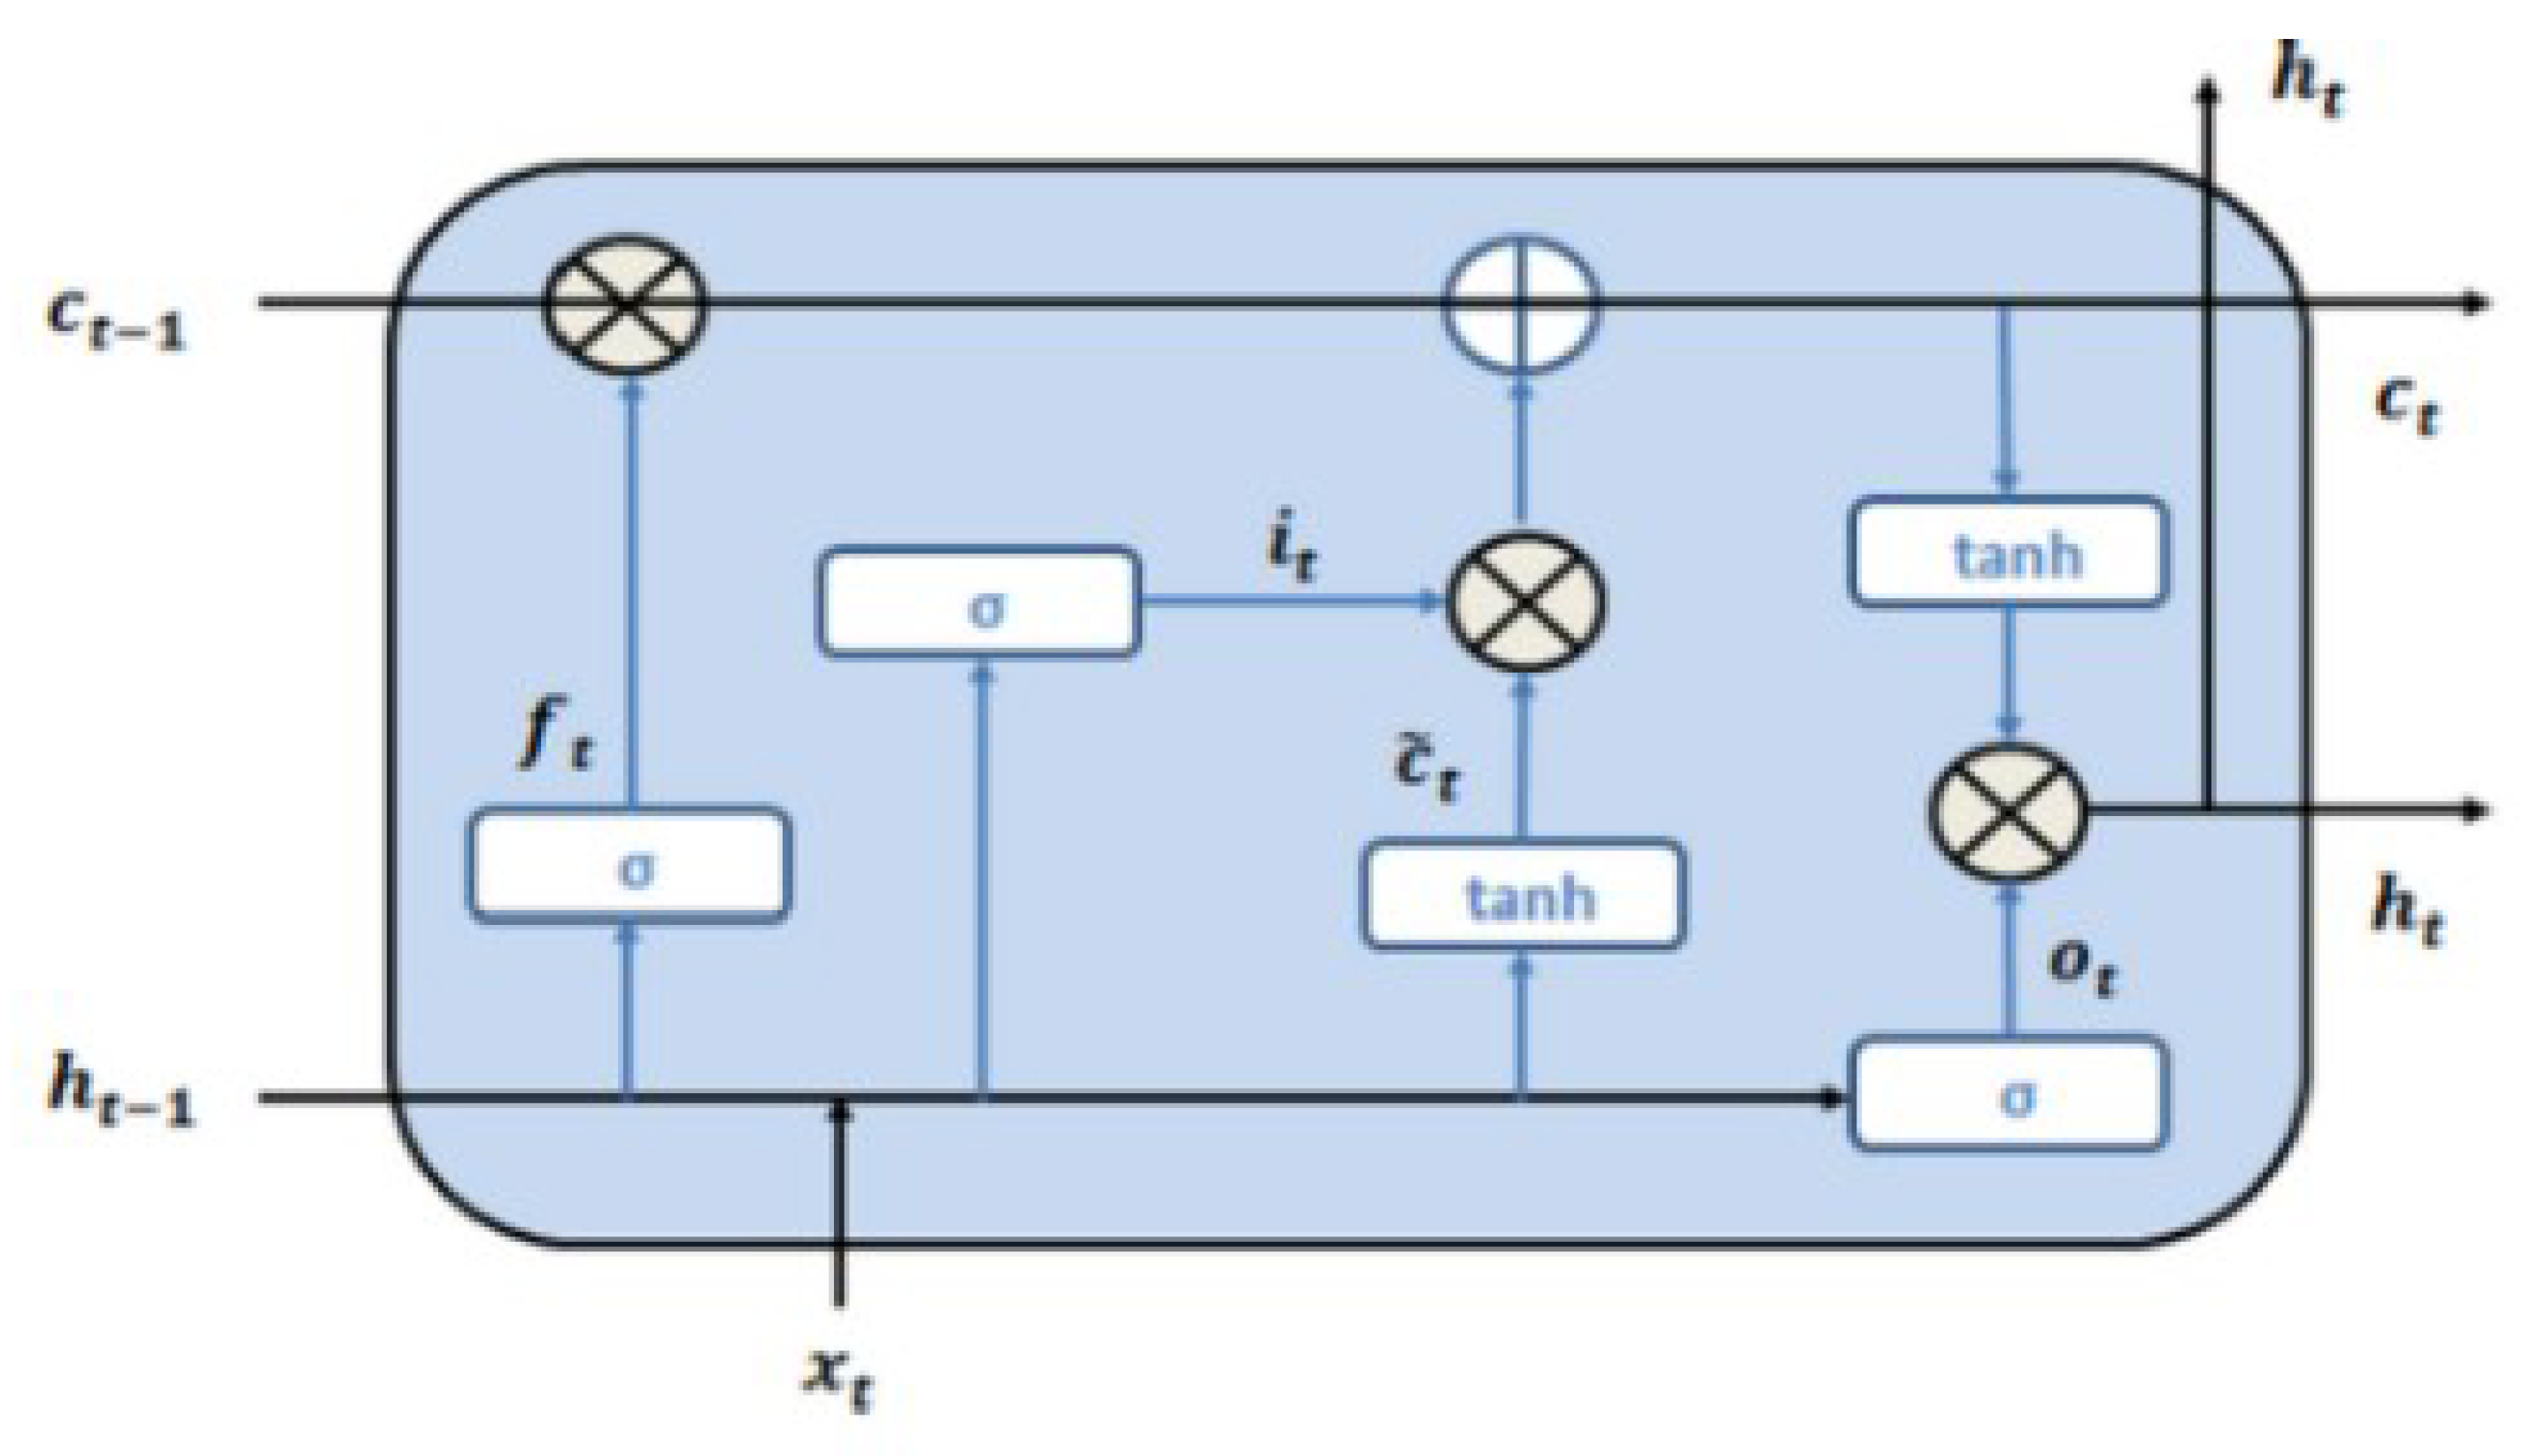
43]. Long Short-Term Memory (LSTM) Neural Networks are a type of RNN that attempts to solve the “vanishing gradient” (very small gradients don’t allow distant input nodes to be considered) problem. The basic unit of an LSTM network is a memory cell, which has an input gate, an output gate, and a forget gate, which control information flow into the system. The cell itself then determines the fate of the information it holds. This is determined by an independent set of weights pertaining to the memory cell, which are adjusted by gradient descent and backpropagation. The Bidirectional Long Short-Term Memory (BLSTM) learns from data in both forward and backward directions, improving the accuracy and speed of the network. It uses two hidden layers running in opposite directions from the same input, as the network simultaneously gains information from past and future states [
44]. The LSTM model is shown in
Figure 2. The LSTM cell learns the input signal features based on the following mathematical Equation (1):
where
xt is the input at time t, and
ct and h
t are the cell state and hidden state, respectively. W and b denote weights and biases, respectively.
σ is the sigmoid function, and ° is the Hadamard product operator.
dct is a candidate for updating c
t through the input gate. The input gate i
t decides whether to update the cell state
ct, while the forget gate
ft decides what to keep and what to forget from the previous cell state, and output gate decides on how much information is passed to the next cell [
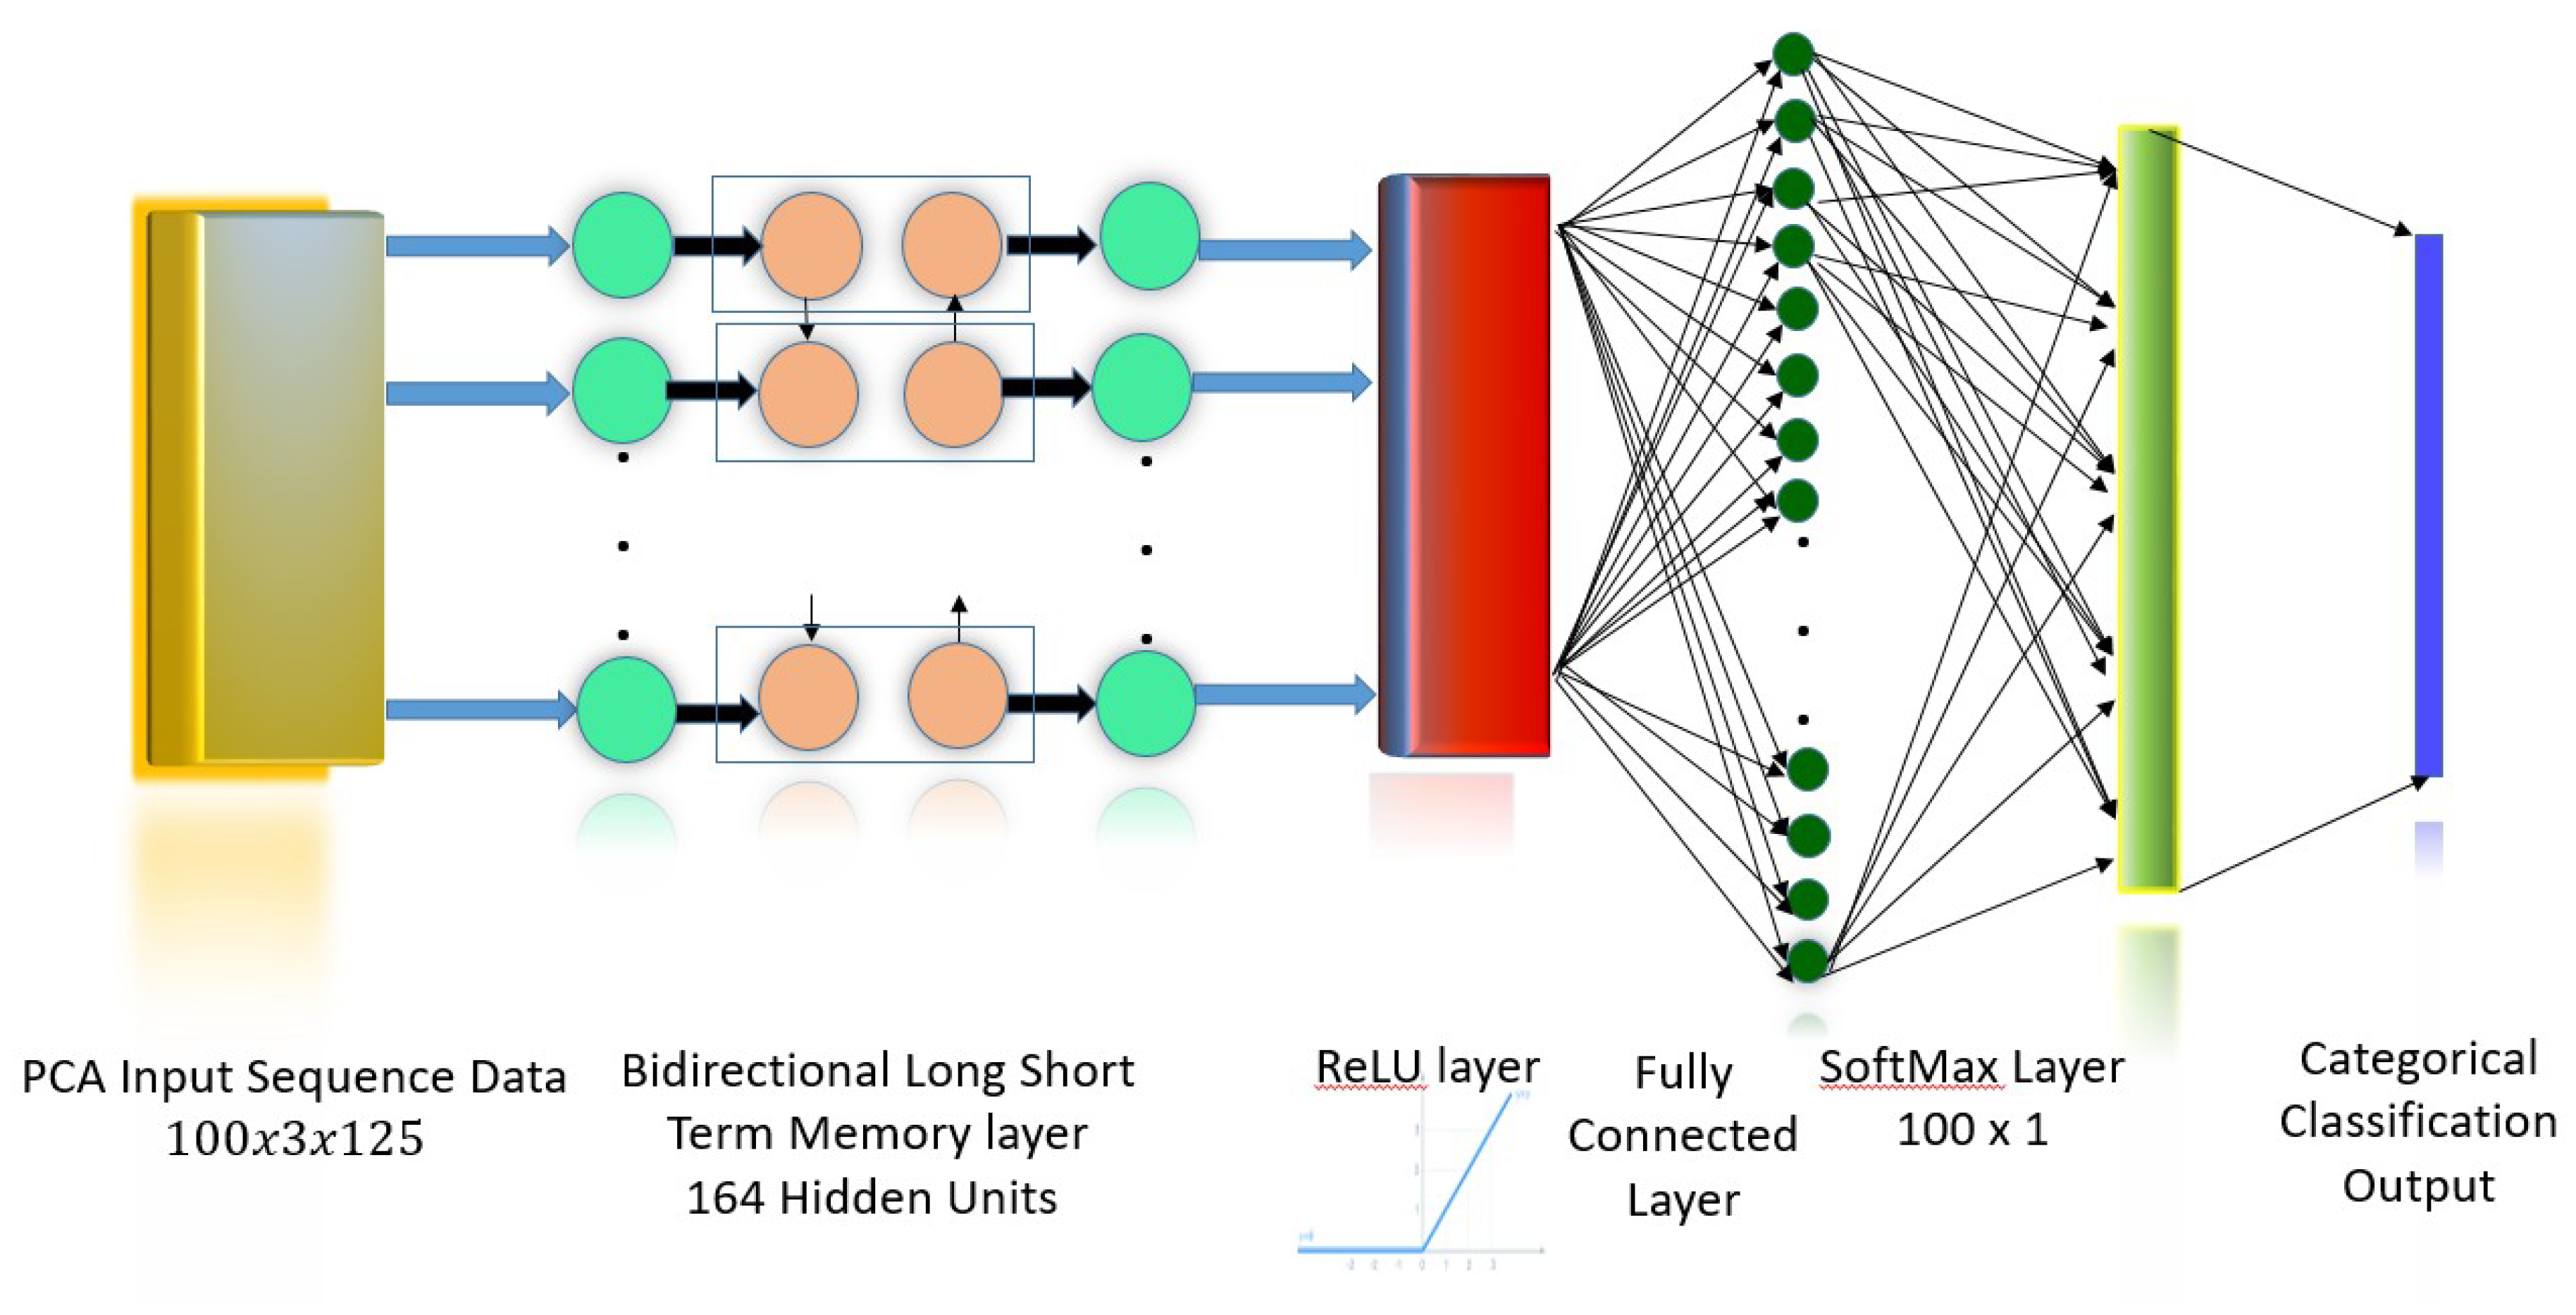
45]. The BLSTM model used in this work is shown in
Figure 3. The input to the network is the three principal component features obtained from the Principal Component Analysis (PCA) transformation of the 16 channel EEG/EMG signal. The
BLSTM layer consists of one forward and one backward layer of a Long Short-Term Memory (LSTM) network, with a total of 164 hidden units (nodes). This layer learns bidirectional long-term dependencies between time intervals of the data. These dependencies are useful as the data collected from experiments pertaining to sensory motor functions are continuous, and the network learns the complete time series at each interval. A Rectifying Linear Unit (ReLu) Layer, defined as y = max(0,x), serves as an activation layer that outputs the original input if the input is positive, and outputs 0 if the input is negative. This function does not saturate (network values reach an asymptote and stagnate within a range), and the difference between successive weights is always high whenever a neuron activates. This permits the network to converge to the accurate value in a shorter period of time. The next layer is a
fully connected layer where all nodes are connected to every other node. This layer is used to label inputs. The
softmax layer limits the output of the function to a 0–1 range, to be interpreted as a probability. These probabilities are then mapped to a categorical label or symbol by the
classification layer. The categorical or classification label is an integer value assigned to each class, which represents the set of five sensory motor functions, which serve as classes in which the input feature matrices are classified.
3.6. Training and Testing of BLSTM Network
A BLSTM model is trained to discriminate between normal aging-related changes in sensory motor function and MCI-related changes. The model is subject-agnostic and it can detect progressive changes in a single subject, as well as identify the level of sensory motor function in a subject, who could be a new candidate for MCI diagnosis compared to subjects with normal aging-related changes.
The EEG/EMG data matrix is first filtered from noise such as interference using a Butterworth bandpass filter in the frequency range 3 to 30 Hz. The filtered data is then reduced dimensionality using Principal Component Analysis (PCA). The three principal components from the PCA constitute the feature matrix for each sensory motor task, which is used to train the BLSTM network.
The BLSTM is trained with the feature matrix for intra-subject (within subject) as well as inter-subject classification of the sensory motor function categories. Three combinations of five categories are made, in order to determine which function shows better or worst discriminability among the different age groups and the MCI group. One combination consists of auditory and olfactory functions, the second combination is auditory, olfactory and motor imagery function. The third combination tests all functions and consists of features from auditory, olfactory, motor imagery, and motor movement functions.
The five trials of data are averaged into one trial for a duration of 1 minute, in order to smooth out variations due to noise. The network is trained in batches of 20 epochs/class; each epoch corresponds to 1 s of data, with 125 samples per second. Hence, the sample vectors used for training comprise 20 epochs, totaling 2500 sample points, which corresponds to 26.67% of training data. The trained network weights and parameters are saved and loaded during testing. For intra-subject trained networks, the testing is done with 54 batches per class, which corresponds to 73.3% of the data. Eighty epochs per class from four subjects corresponding to 27.49% of the feature data are used to train the network for inter-subject training, and the remaining 72.5% of the feature data are used for testing the model. This corresponds to 211 epochs with 125 samples in each epoch. 10-fold cross-validation is conducted to obtain the final classification accuracies.
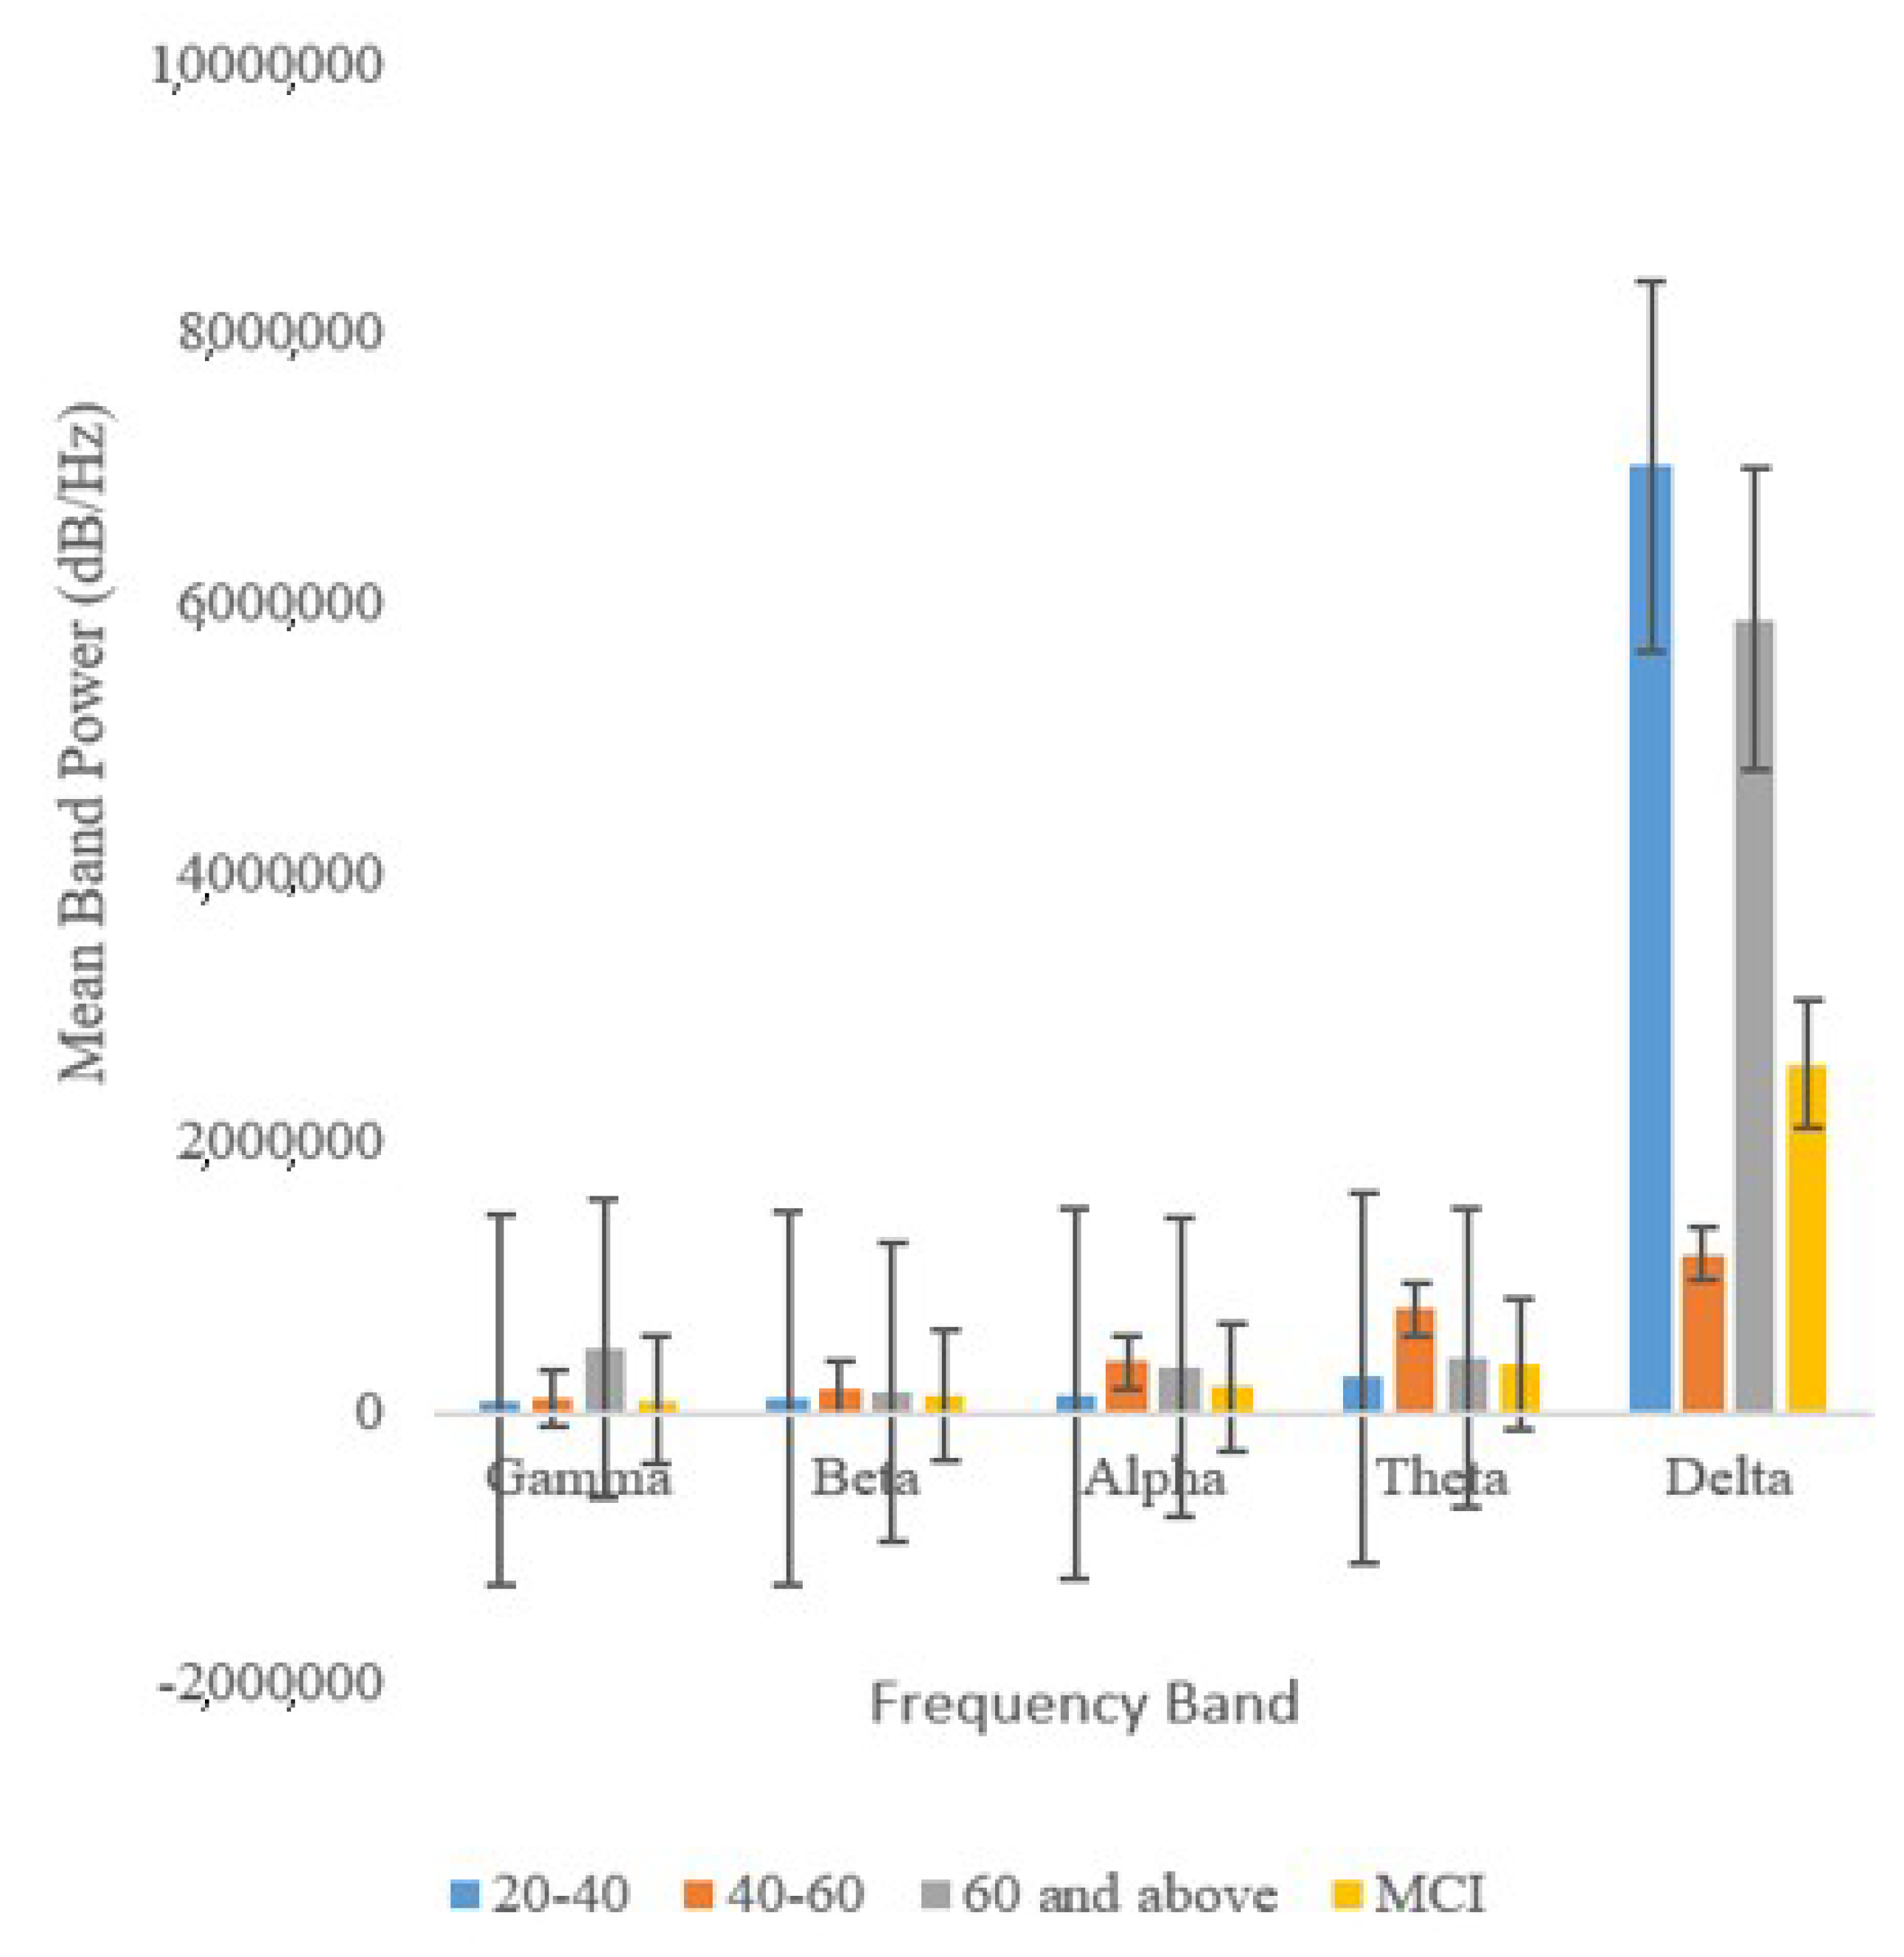
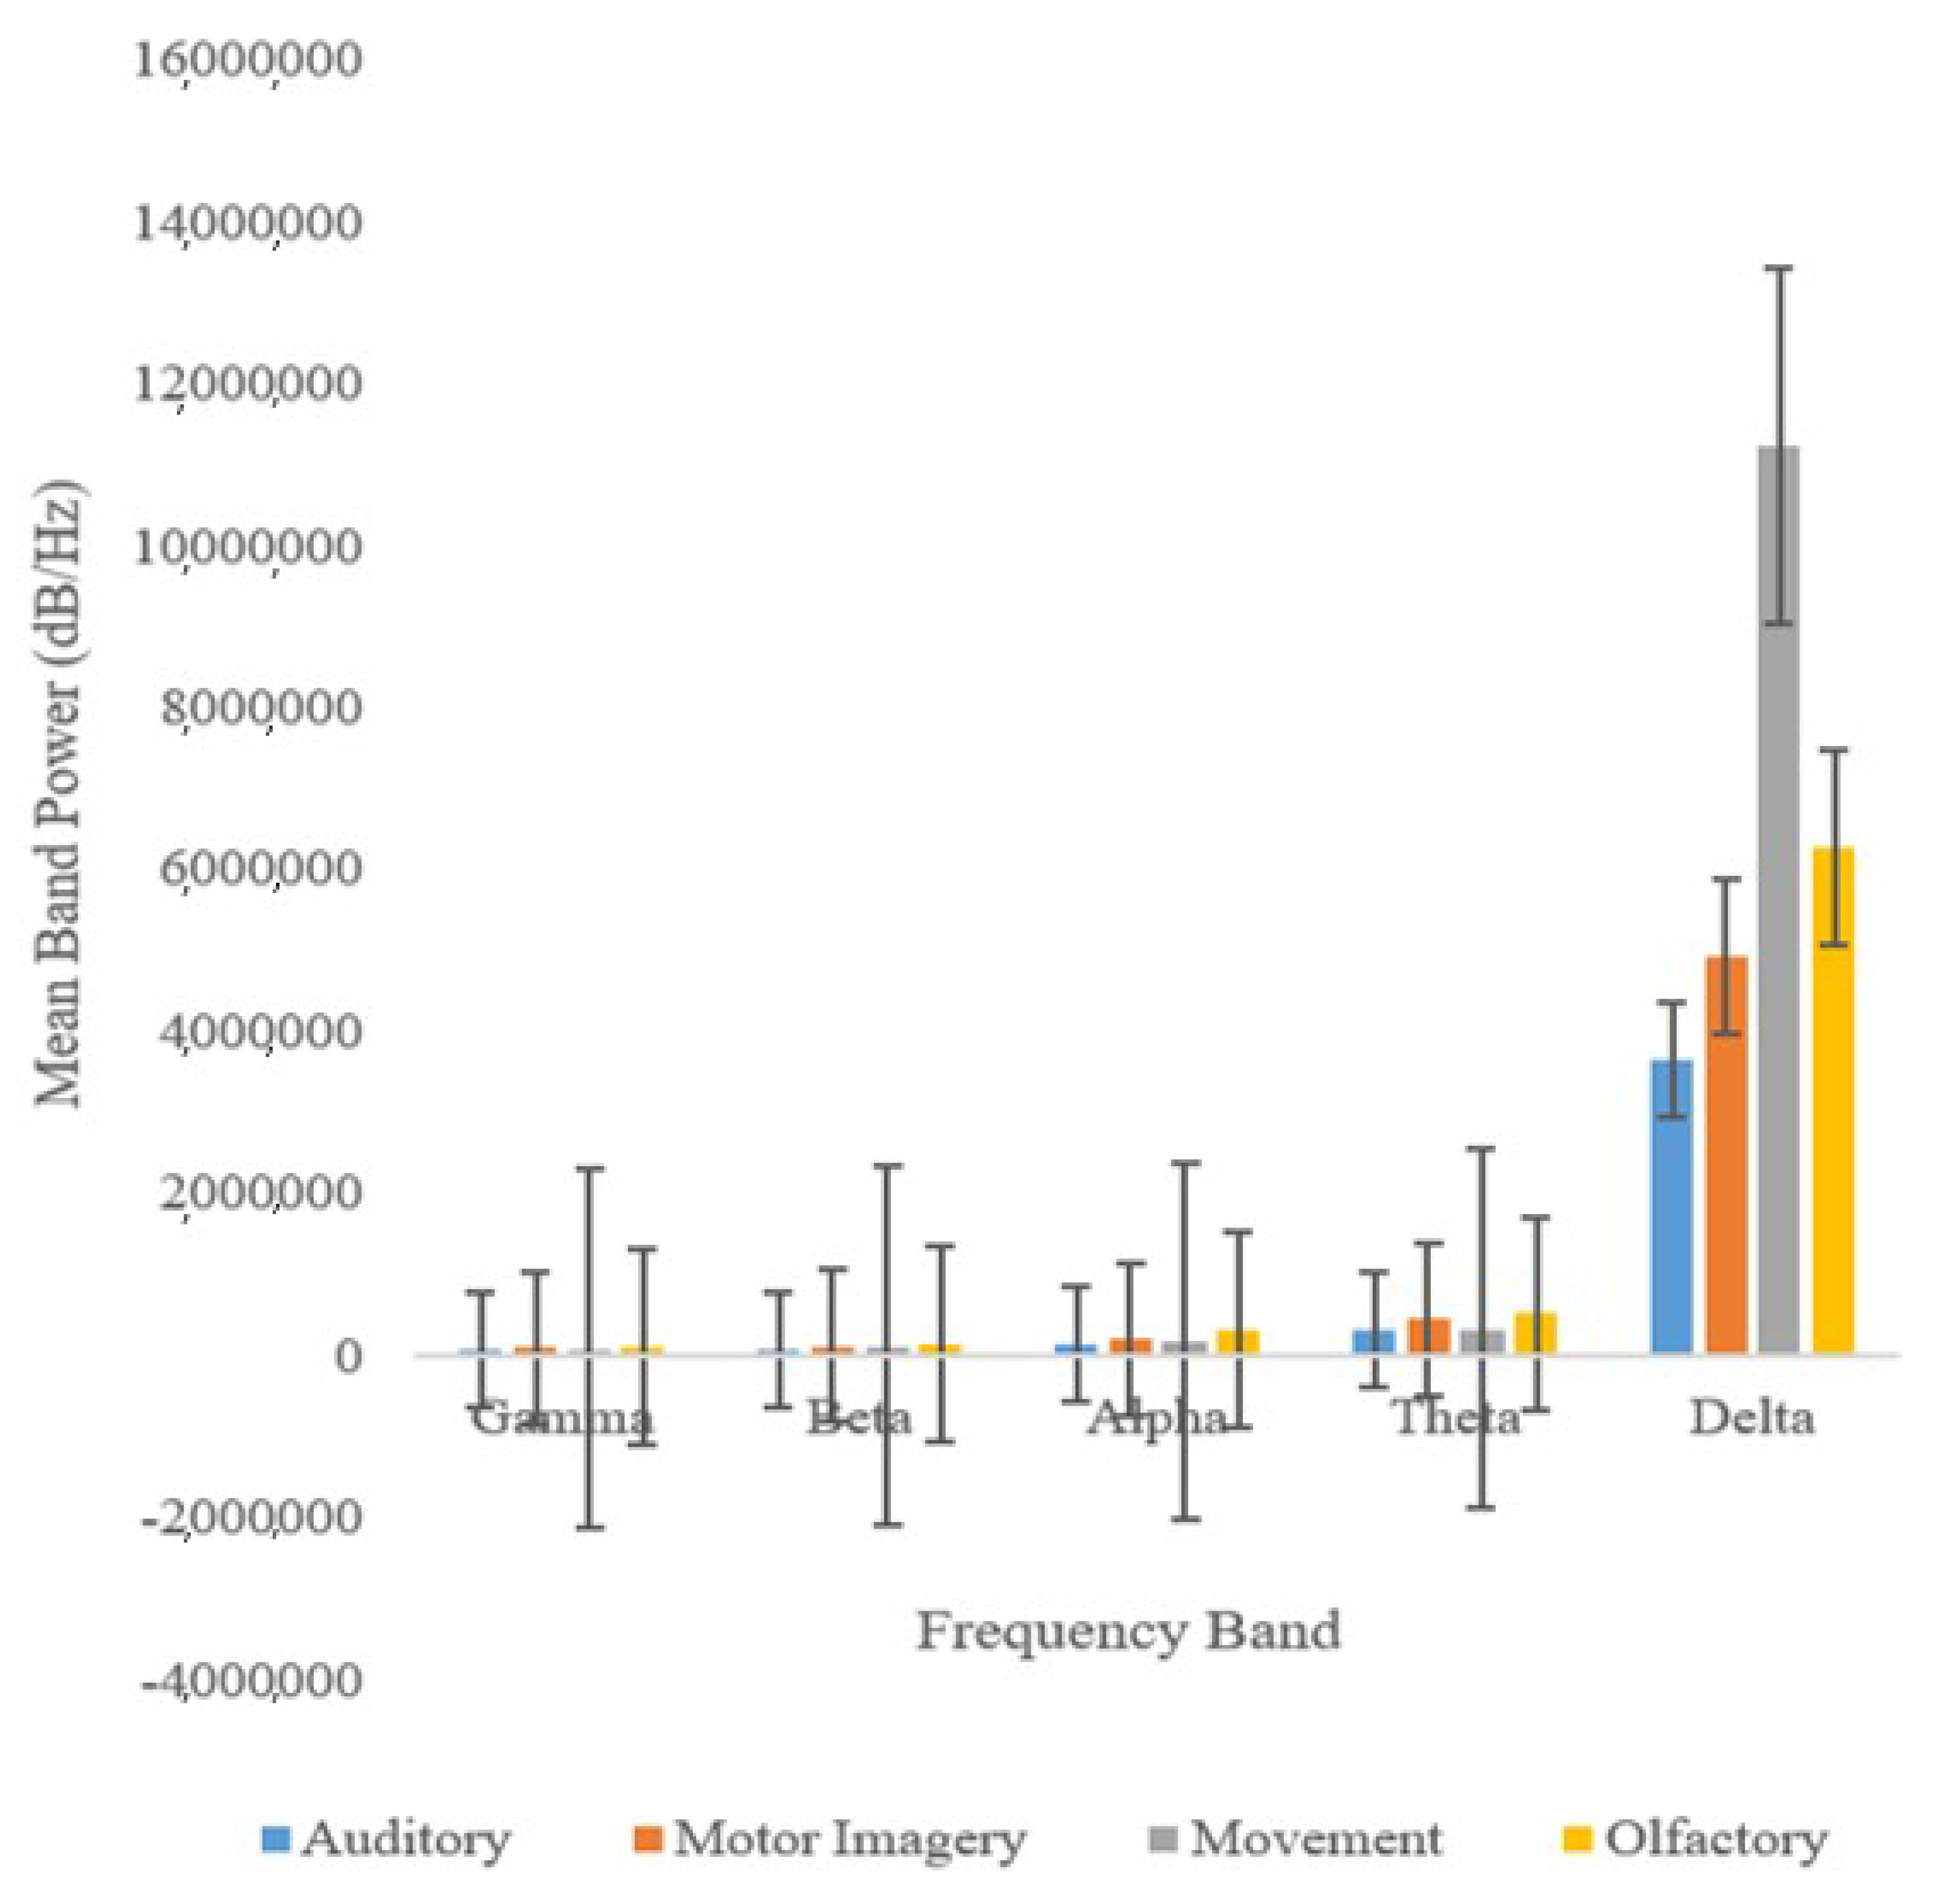
3.7. Brain Wave Band Power Analysis
The EEG channel data corresponding to the brain regions are analyzed in to the brain wave bands: Delta (0.5–4 Hz), Theta (4–8 Hz), Alpha (8–13 Hz), Beta (13–30 Hz), and Gamma (>30 Hz) using an eight-level wavelet decomposition with the Daubechies scaling and wavelet functions [
46]. The band power in each of these frequency bands is calculated.
4. Results and Discussion
The BLSTM network utilized responses to sensory motor stimuli in order to produce an accurate assessment of cognitive function. The BLSTM model is employed in the study comprised of healthy subjects of varying age and subjects that suffered from Mild Cognitive Impairment (MCI), to determine its ability to detect and distinguish between cognitive aging and pathological cognitive deterioration. It was aimed to identify the effect of cognitive deterioration on key signal features, such as the network’s classification accuracy of the sensory motor potentials or rhythms (which is an indicator of the brain’s ability to process the stimuli), and signal band power. The results of this study suggest that the BLSTM model is more effective than current models in evaluating cognitive decline; furthermore, most elements of sensory motor functionality tested were reliable indicators of cognitive aging as well as promising biomarkers of early dementia. It was hypothesized that these elements would indicate consistent cognitive decline as a function of age and would demonstrate lower sensory motor health for subjects suffering from MCI than for those pertaining to any other test group.
The BLSTM classification accuracy of evoked signals determines the extent to which the brain discriminates and processes the stimulus presented.
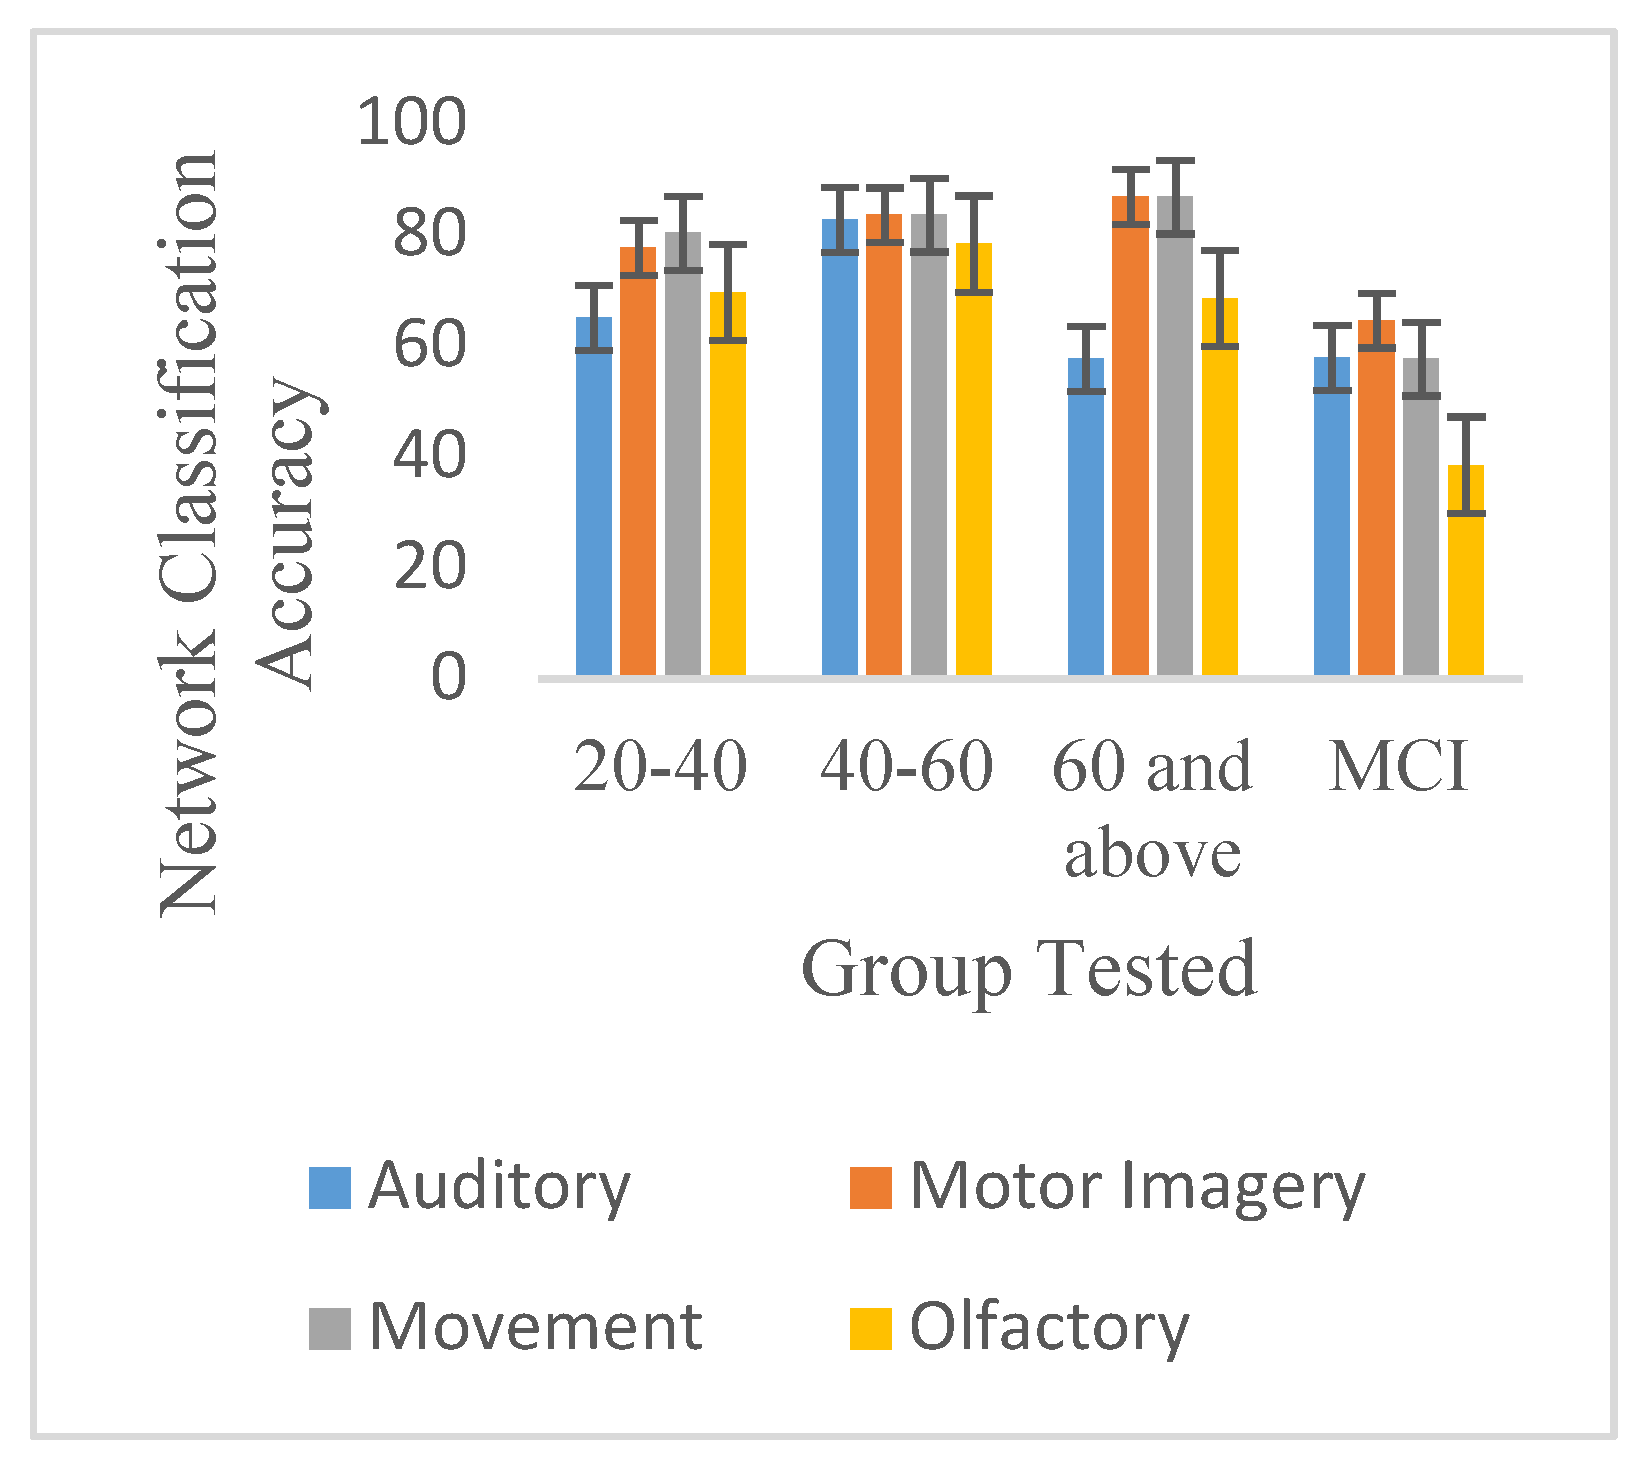
Table 1 shows the discriminability of evoked responses to sensory motor stimuli (auditory, olfactory, motor imagery, and movement) as defined by network classification accuracy (%) of evoked signals for test groups studied. These results were obtained through intra-subject training and testing (data pertaining to the same subject were used for both training and testing).
Table 2 shows the mean inter-subject (data pertaining to more than one subject used for both training and testing) classification accuracies of combined sensory motor potentials per age group.
Table 1 and
Table 2 suggests that the classification accuracy of the evoked potentials pertaining to all sensory motor stimuli peaks at age range 40–60 and declines thereafter, as demonstrated by responses elicited by auditory stimuli, right motor imagery, and two of the four olfactory stimuli utilized (neem and rosewater). This result is consistent with previous studies [
47,
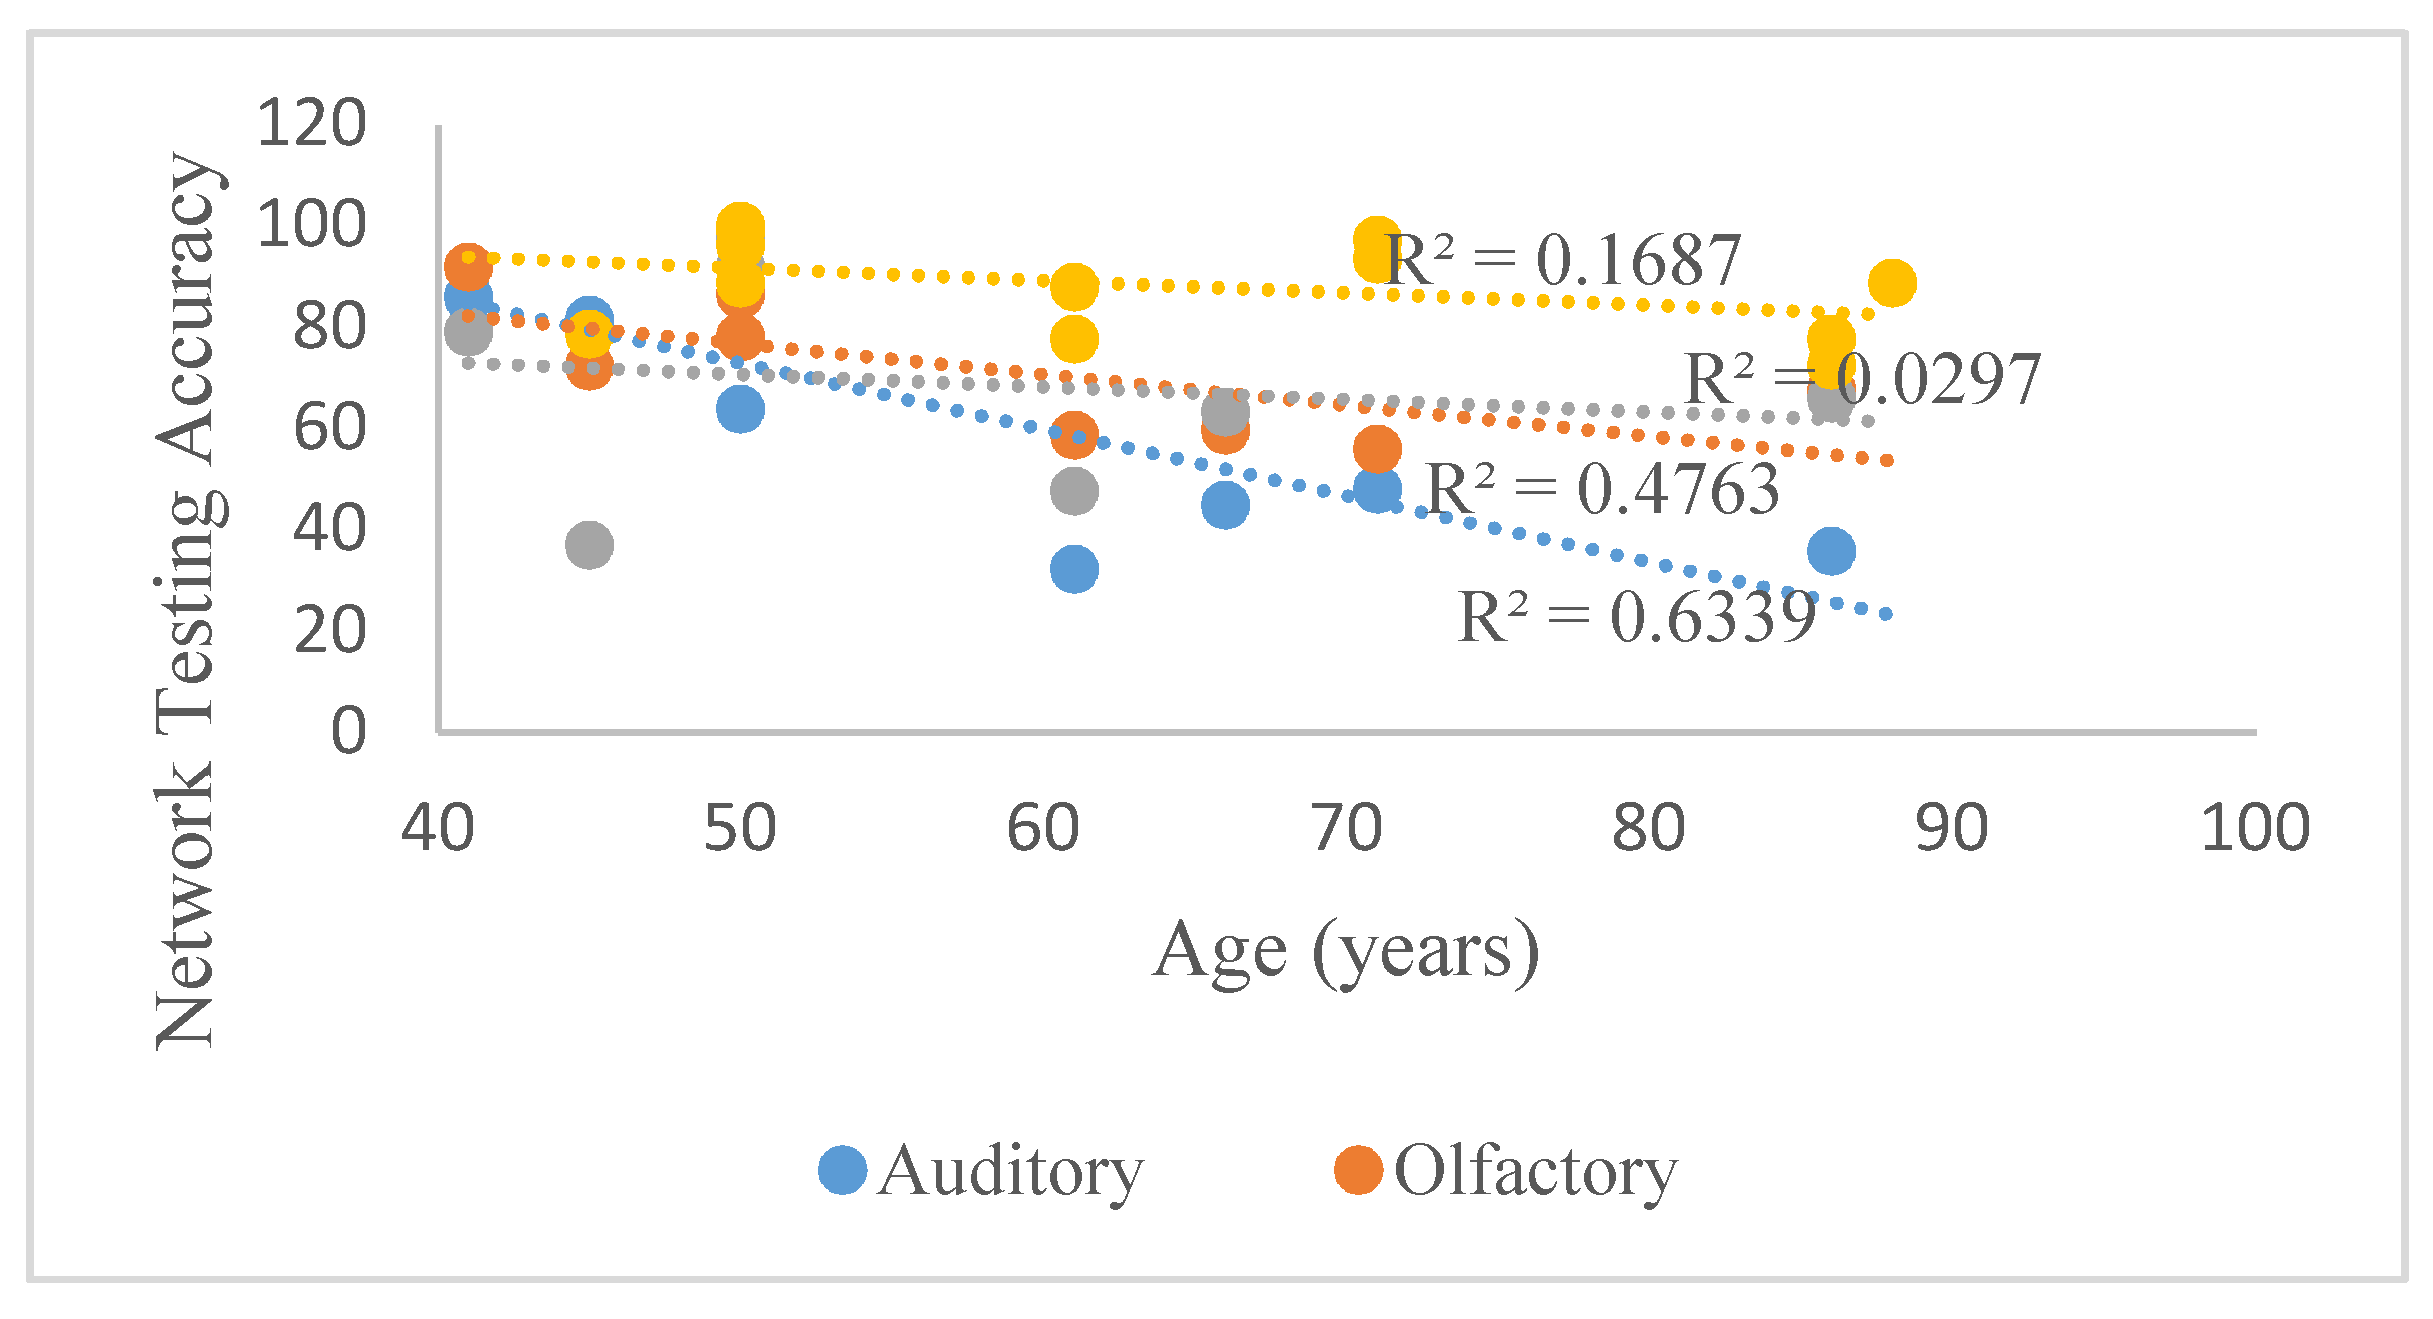
48], concluding that key sensory motor functions such as audition, olfaction and gait peak in one’s 40’s or 50’s, resulting in deficiencies that are evident in one’s 60’s. According to
Figure 4, which illustrates the aforementioned trends beginning at 40, the classification accuracy of auditory responses best reflected this trend, with an R
2-value of 0.63. In contrast,
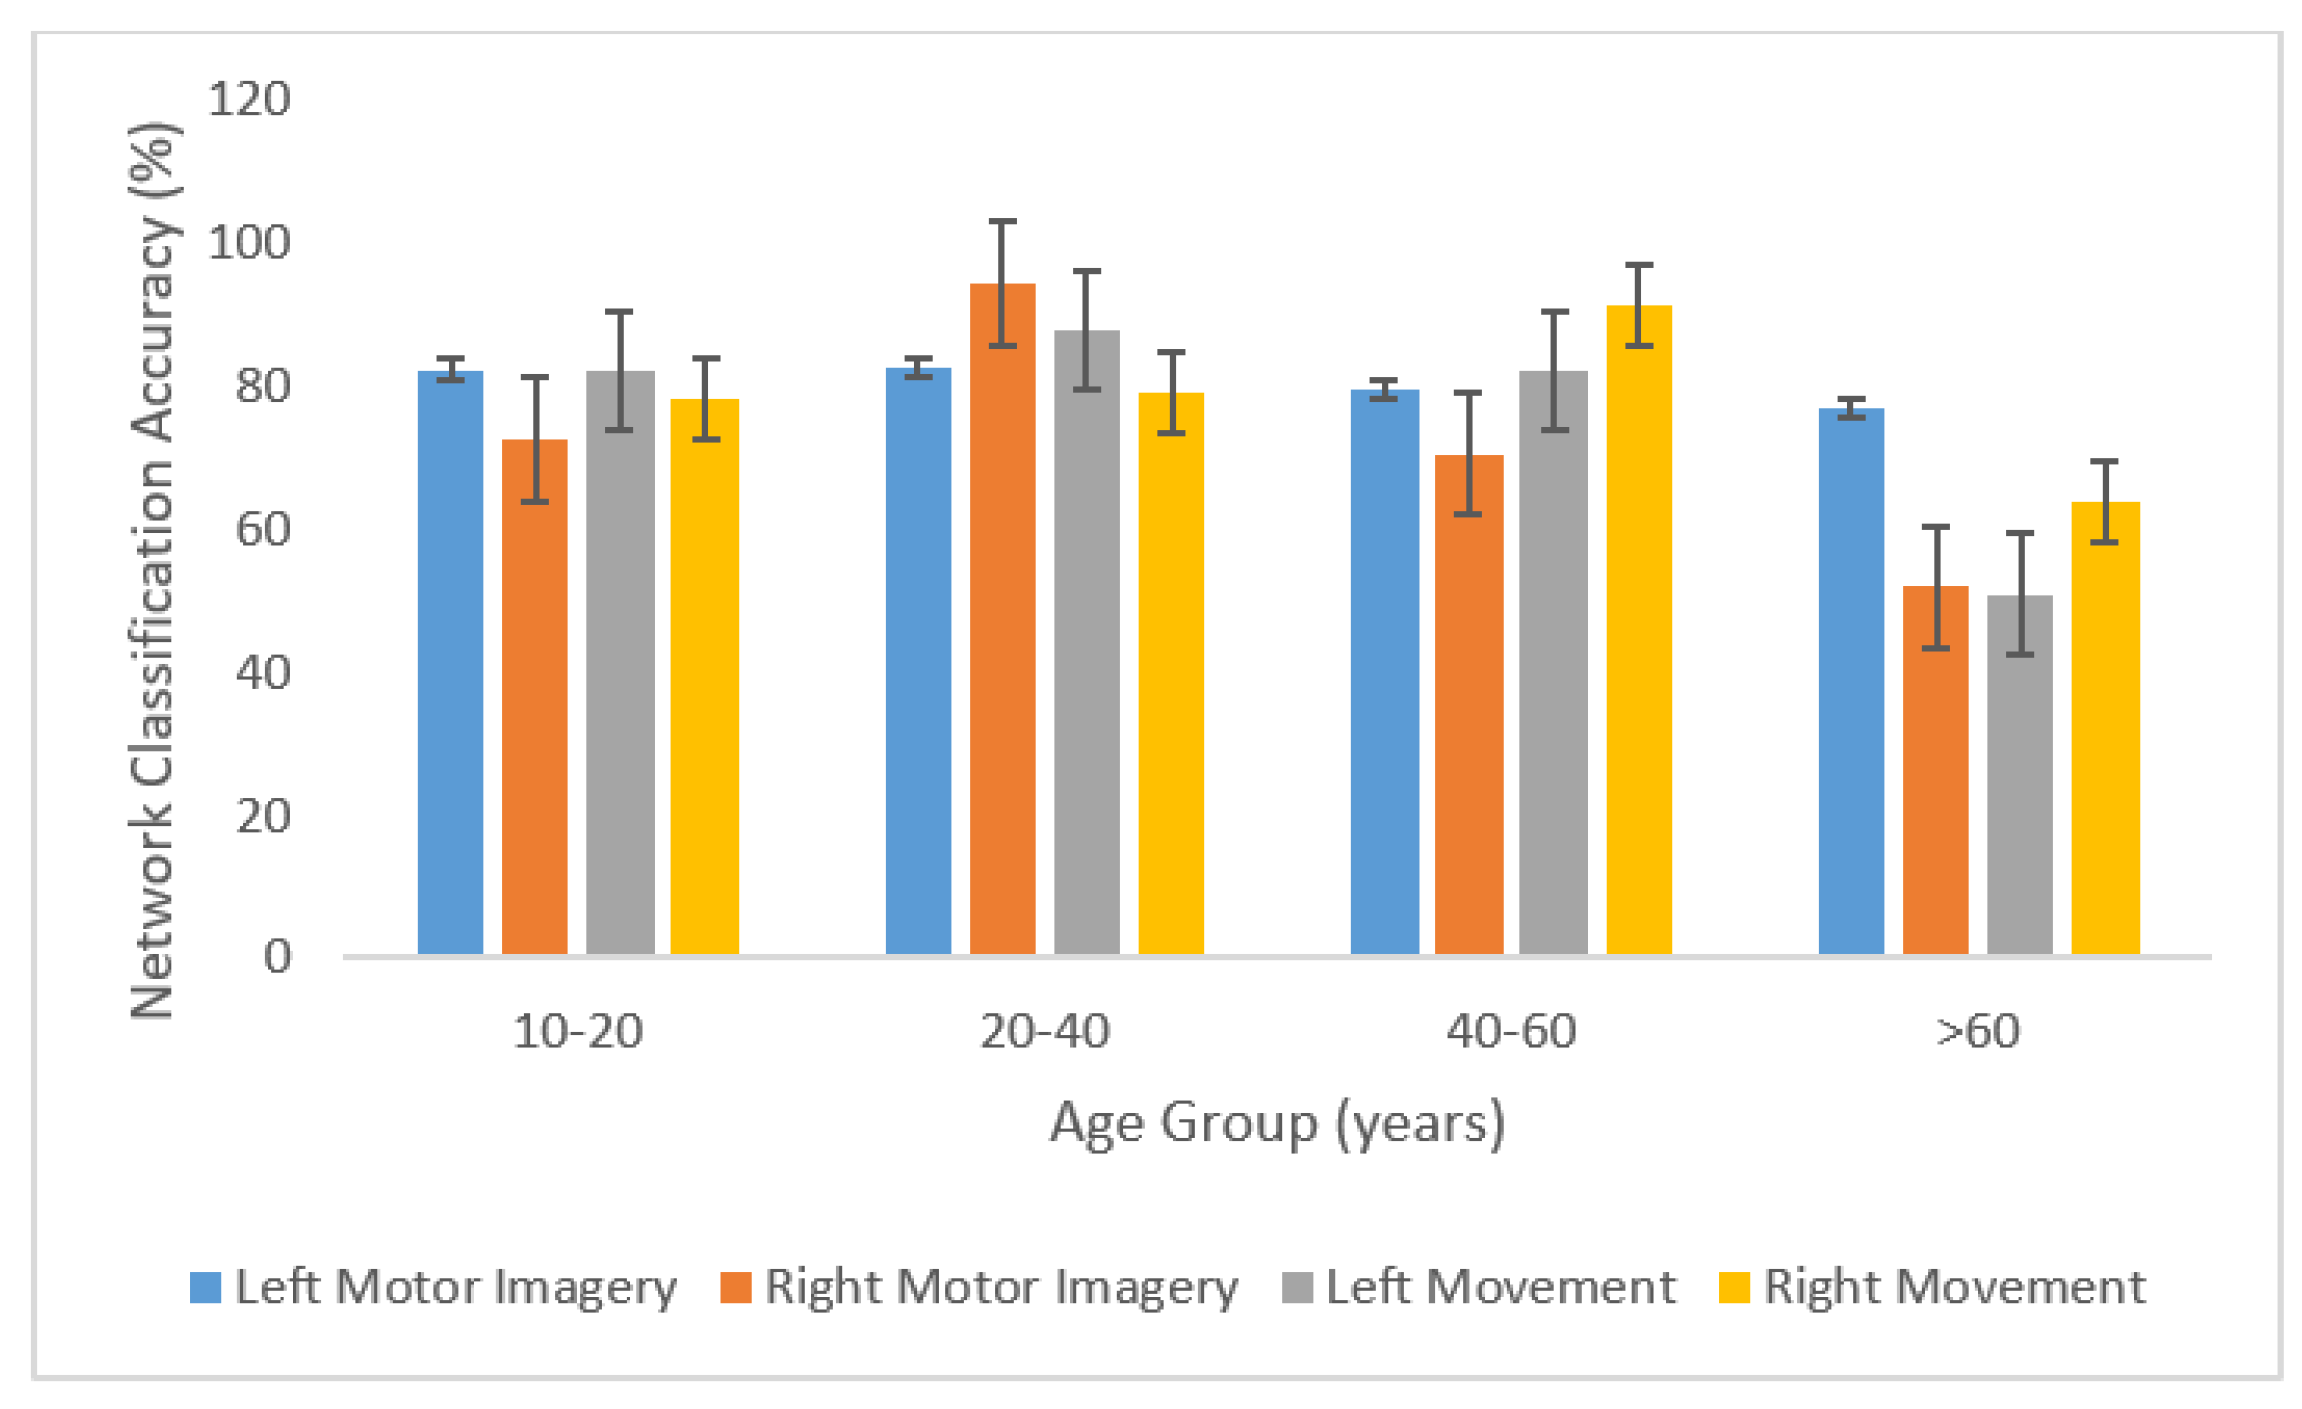
Figure 5 indicates that the mean classification accuracy of potentials related to movement and motor imagery increases as a function of age. However,
Figure 6 shows that when the left and right sides are considered separately, movement- and motor imagery-related stimuli are reliable indicators of age-induced and pathological cognitive deterioration, with the exception of right-hand movement and olfactory (lavender).
The results of this study show significant differences between network classification accuracy of signals pertaining to healthy and demented subjects.
Table 1 shows that the classification accuracy of all sensory motor responses obtained using intra-subject testing, except those pertaining to audition and olfactory (eucalyptus), were significantly lower for the test group comprised of subjects with MCI than for any of the age groups studied.
Table 3 shows detection accuracies (%) of evoked sensory motor potentials analyzed together for each group tested, and comparison with subjects suffering from Mild Cognitive Impairment (MCI) in age groups 40–60 and >60. Additionally,
Table 3, which shows the classification accuracies of several combined sensory motor rhythms, demonstrates not only the previously described age-related trend, but also a sharp contrast between the mean network classification accuracy of these combined signals for the upper age groups (40–60 and >60) and the MCI subjects belonging to each of these age groups.
The results shown in
Table 2 were acquired through inter-subject training and testing. The intra-subject and inter-subject results are comparable, demonstrating the subject-agnostic nature of the network. As a result, the network has minimal to no need for subject-specific information, resulting in a more robust and versatile system that can be trained with data from different subjects and can detect cognitive deterioration from new data pertaining to demented subjects
Cognitive function is highly variable depending on a variety of factors, such as lifestyle, stress and anxiety levels, attention span, and pre-existing health conditions. For this study, an optimal coefficient of variation was considered to be 50% or below.
Table 4 shows the standard deviation and coefficient of variation of detection accuracies (%) of evoked sensory motor potentials analyzed together for each group tested. Optimal coefficient of variation is considered to be under 50% for this study. According to
Table 5, the test group comprising subjects with MCI displayed significantly higher levels of variation in classification accuracy than any other test group. This can be accounted for by several disparities among the subjects that formed part of this group; for example, the seven subjects pertained to different age groups (five belonged in 40–60 and two in the other age group >60). In addition, while the subject belonging to the age group 40–60 experienced severe cognitive impairment and suffered from Bipolar Syndrome, the subject belonging to the age group >60 recently acquired dementia and hence displayed only mild cognitive deterioration. Furthermore, due to logistical and ethical constraints, the test group pertaining to MCI has variability as there are many causes that lead to MCI including medical history, demography, family history, environment, and health predispositions.
According to
Figure 7, band power (dB/Hz) exhibits variation more frequently than network classification accuracy (%). This suggests that network classification accuracy is a more reliable indicator of cognitive deterioration than band power.
Figure 8 indicates that the beta, alpha, theta, and gamma bands were the best indicators of cognitive aging and MCI.
Of all the five frequency bands analyzed, the Gamma band proved to be the most reliable as it exhibits the lowest levels of variation. In fact, previous work has shown that Gamma waves are closely linked with functional connectivity.
Figure 8 also shows that the band power of delta waves, which are predominant during a state of deep relaxation, is disproportionately higher than those of other waves [
1].
Table 6 shows the Results of Analysis of Variance (ANOVA) conducted on the relationship between network classification accuracy of sensory motor evoked potentials and subject age. The ANOVA results indicates that the classification accuracies of the sensory motor rhythms analyzed shows EEG differences between age groups, with p-values below 0.05 and F-values surpassing F-critical values. The sensory motor rhythms elicited by left-hand movement show the highest discriminability between test groups (
p = 0.012) because it contains both oscillatory and motion-related cortical potentials (MRCP), and is thus a more comprehensive indicator of cognitive health [
7].
Table 7 shows the results of Student’s
t-Test to determine the significance of difference between network classification accuracy of all sensory motor potentials. According to the Student’s
t-Test, the network classification accuracy of diverse sensory motor potentials is indeed effective at distinguishing between age-related and pathological cognitive decline, as the
p-value falls below 0.05 and the T-Statistic (2.25) falls above the T-Critical value (2.23).
Table 8 shows the results of Student’s
t-test to determine the significance of difference between band power (dB/Hz) of all sensory motor potentials.
Table 8 shows that band power (dB/Hz) of evoked sensory motor potentials is a less reliable indicator of cognitive aging and dementia, as fewer stimulus categories exhibit clear trends in relation to age and significant differences between the MCI group and upper age groups. Responses to auditory and olfactory (eucalyptus and rosewater) stimuli, left-hand movement, left-hand motor imagery, and right-hand motor imagery exhibit the previously mentioned relationship with age, with a plateau at age group 40–60.
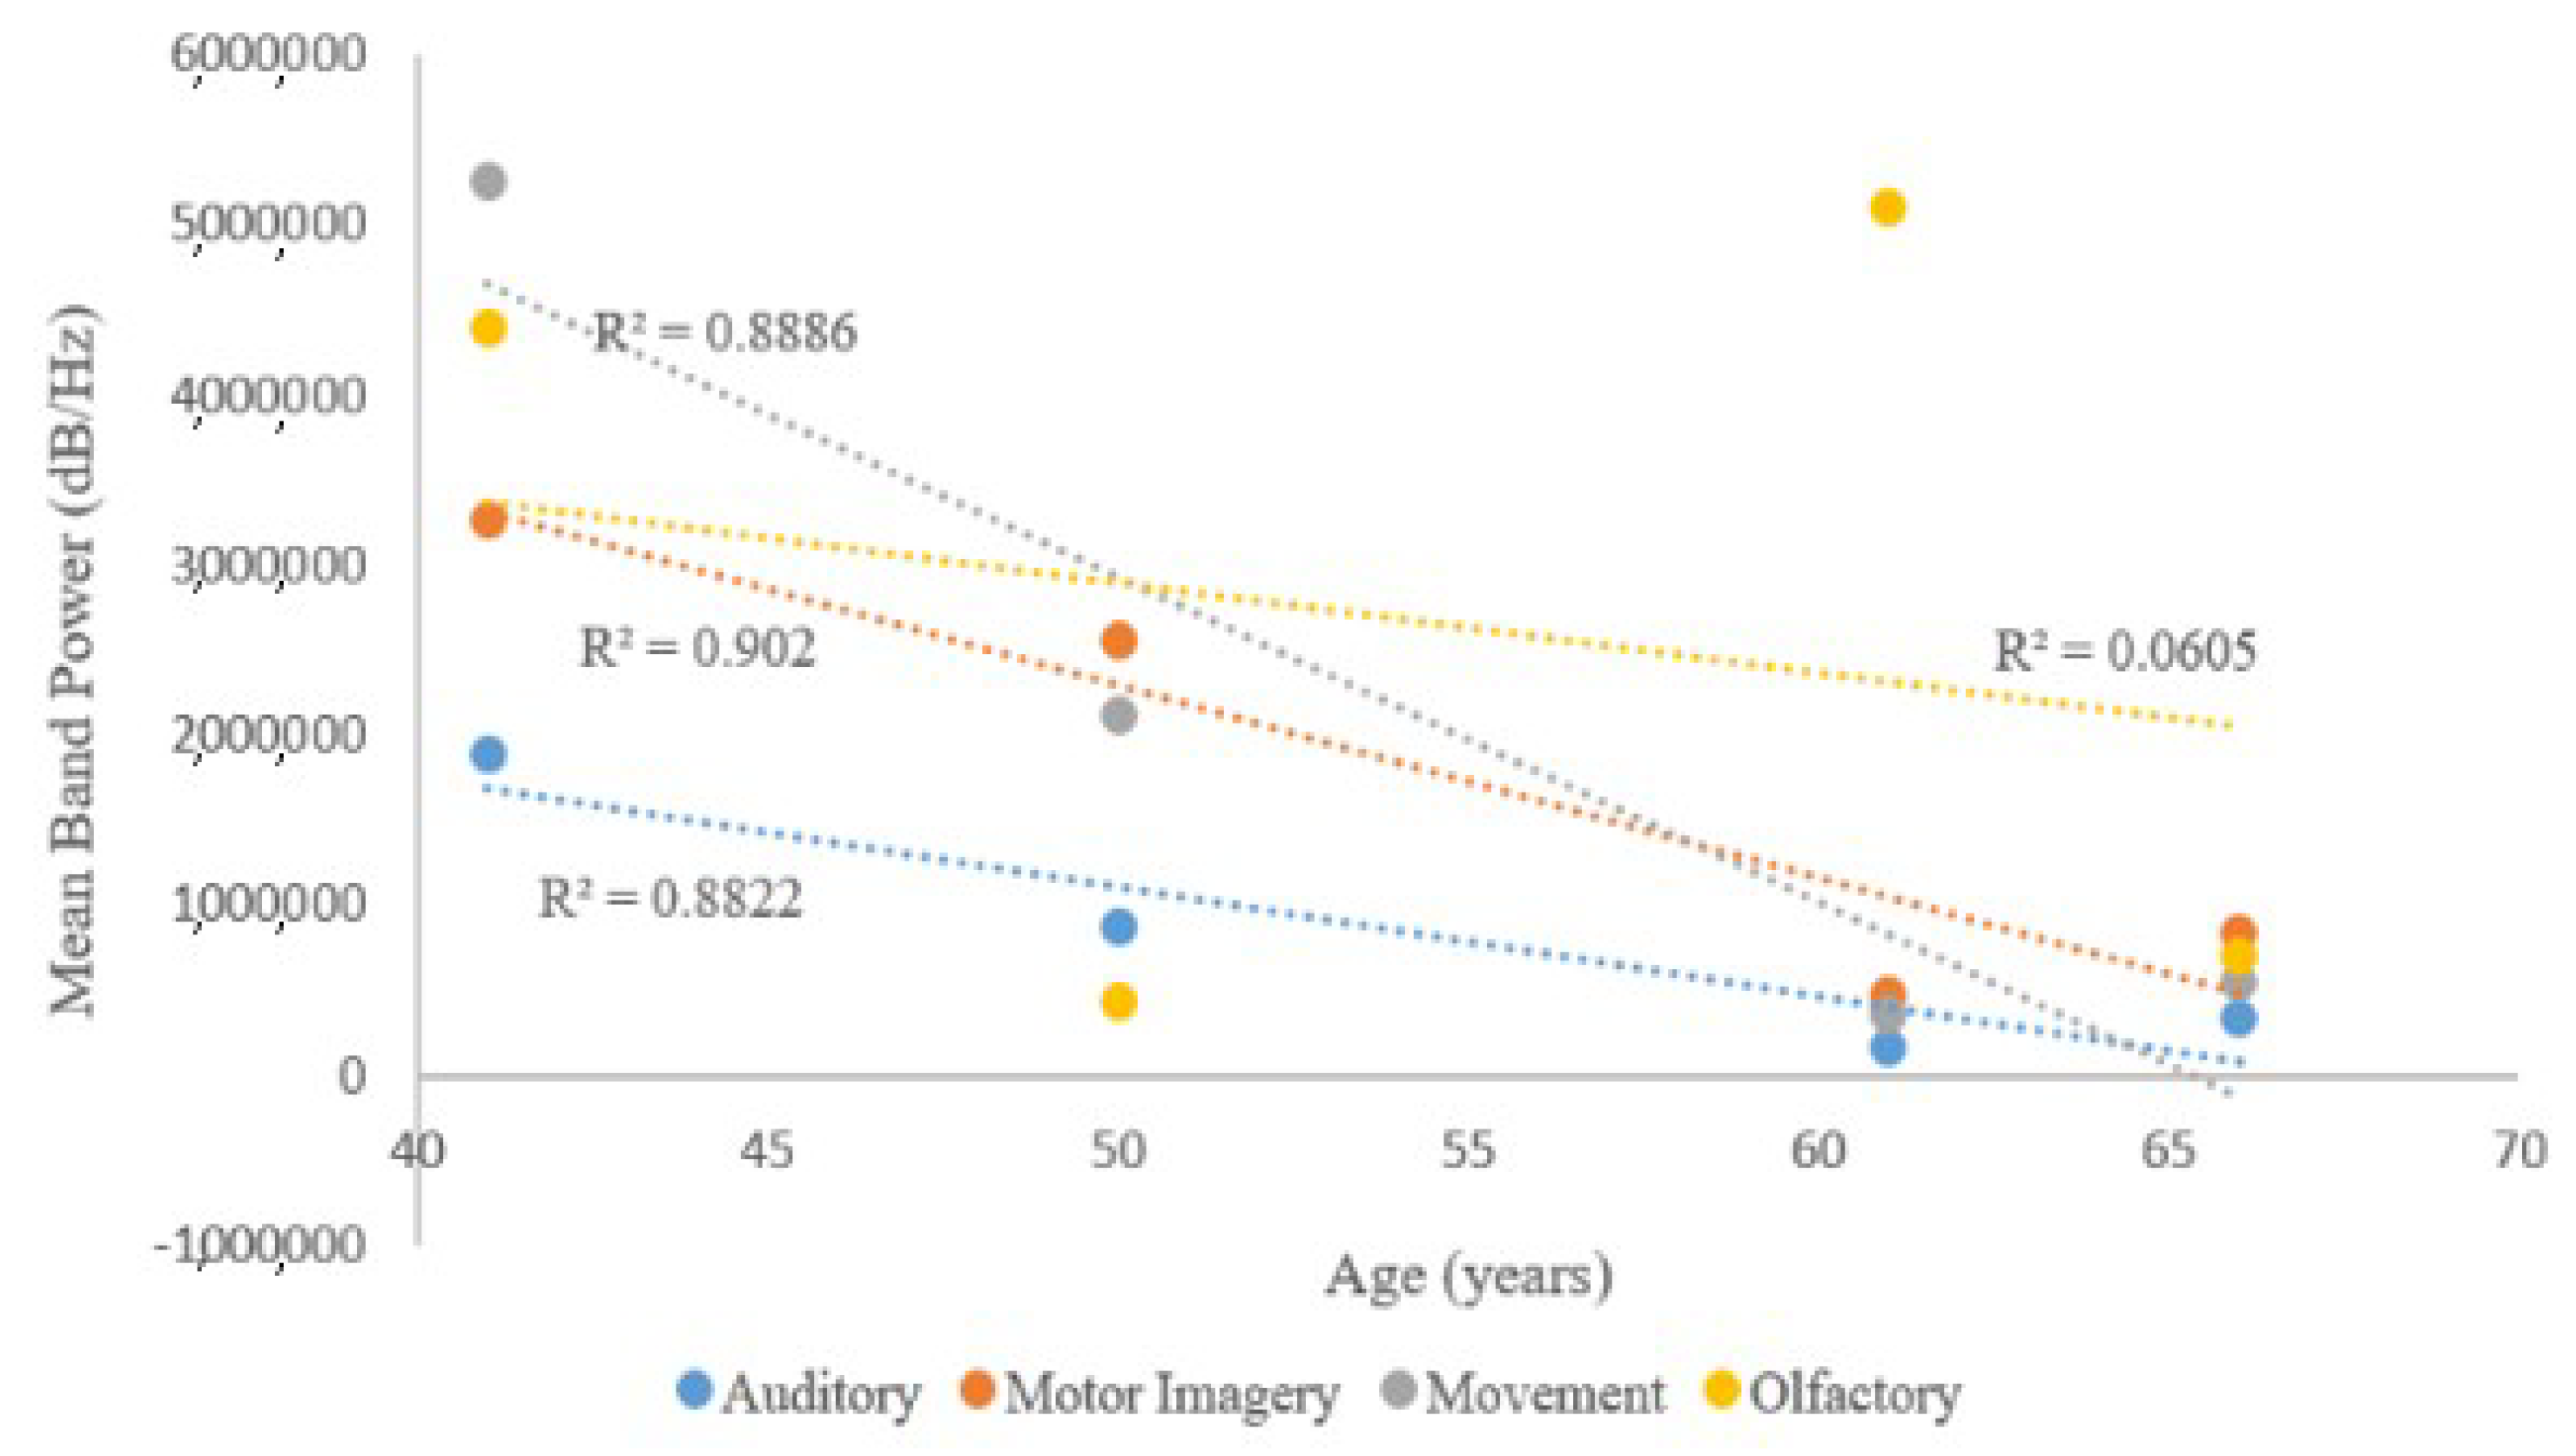
Figure 9 shows that this trend, prevalent after the age of 40, is best shown by sensory motor responses to motor imagery. This trend is also exhibited by the mean of the band power values pertaining to responses to both left and right movement, as well as the mean band power of responses pertaining to both left and right motor imagery.
In addition, the band power of signals elicited by olfactory stimuli were subject to the highest coefficients of variation, and hence, not desirable as indicators of cognitive decline. Furthermore, the results of the Student’s
t-test, shown in
Table 8, indicate that band power is not effective at distinguishing between the cognitive deterioration effectuated by advanced age and that effectuated by dementia, because
p > 0.05 and the T-statistic falls below the critical
t-value (2.26) at 1.00. Interestingly, subjects with MCI also displayed differential activation of cerebral regions.
Table 9 shows cerebral regions where Delta, Theta, Alpha, Beta, and Gamma Bands were predominant for test groups studied. M stands for Motor Cortex, OT for Occipito-temporal, FT for Fronto-temporal, FM for Frontal and Motor, FP for Fronto-parietal, and OF for Occipito-frontal.
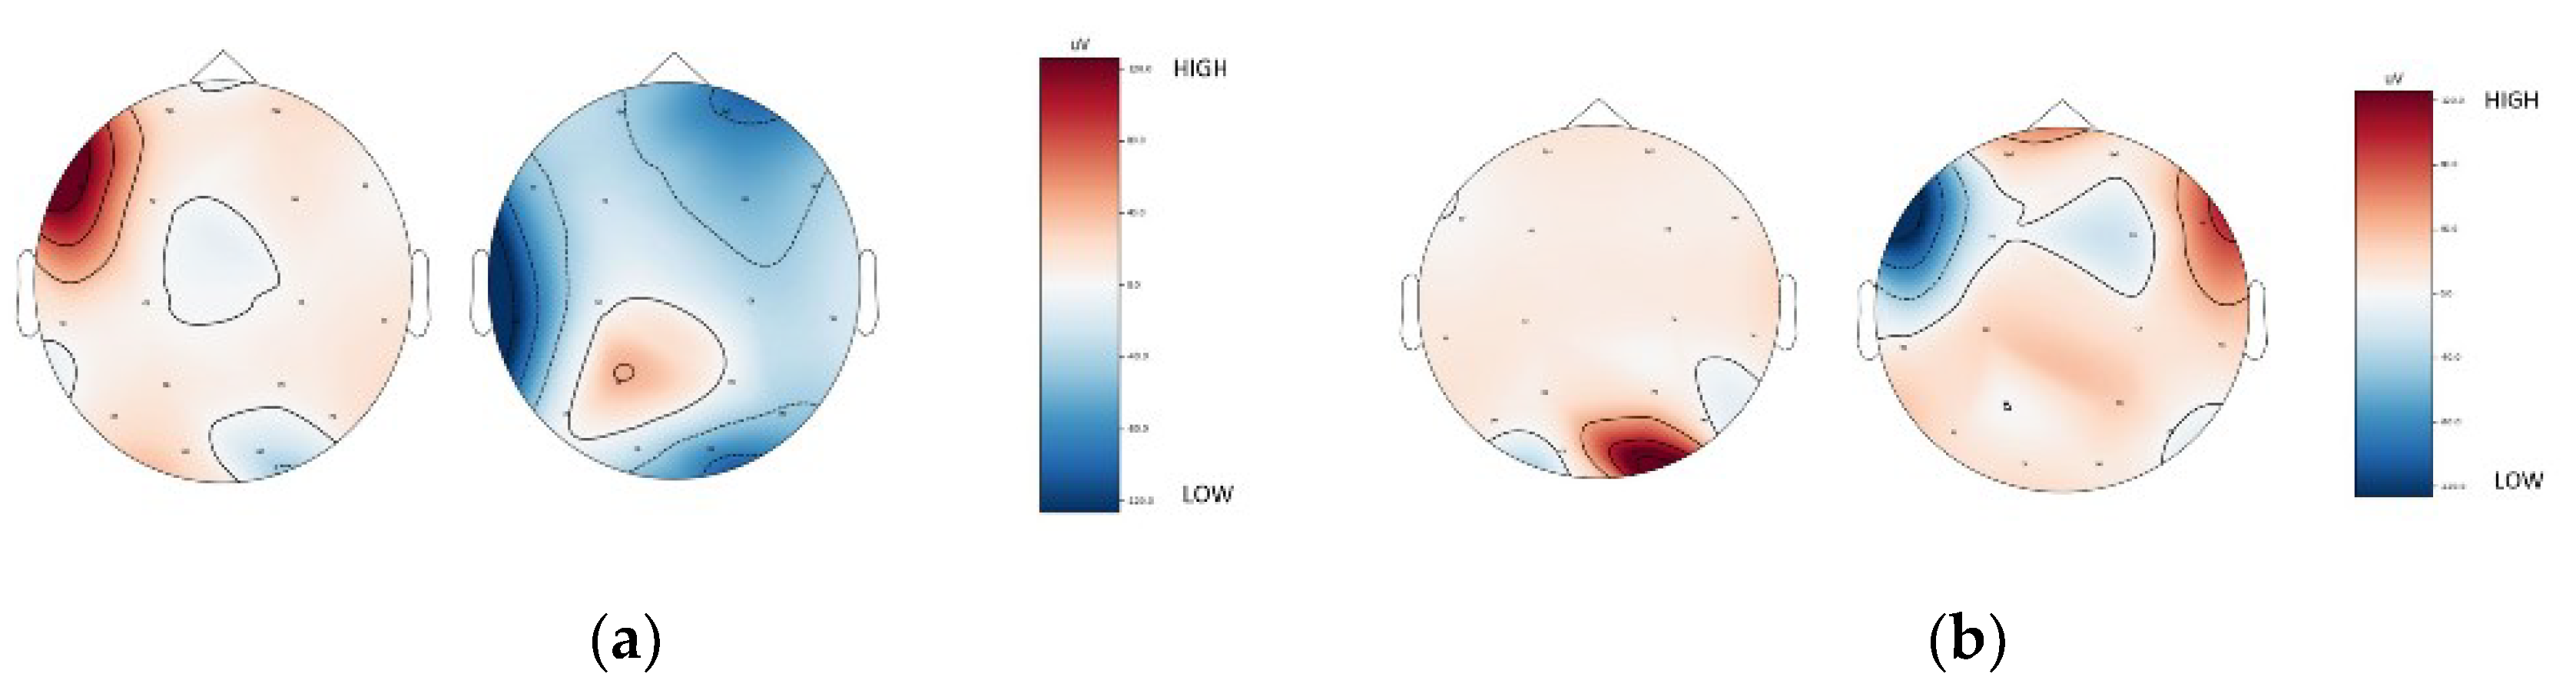
As shown in
Table 5 and
Table 6, the Fronto-parietal region, which processes sensory motor stimuli [
49], of MCI subjects was activated more often than those of healthy subjects, suggesting that the Fronto-parietal region is important in the advent of cognitive deterioration. Additionally, the pairs of topographical plots shown in
Figure 10a,b show that the brains of MCI subjects display significantly lower activity levels in key regions (frontal, occipital, parietal, temporal) than those of healthy subjects. Based on the classification accuracies of EEG from sensory motor function tasks, it can be seen that the EEG features are not well discriminable in elder subjects and even lesser discriminable in subjects with MCI. Hence, sensory motor function tasks can be incorporated in early MCI diagnosis from fMRI modality, as well.


