1. Introduction
Privacy and security concerns are a serious issue which affects fundamental rights. The exposure to risk in this sense has been considered as a severe problem by the scientific and social studies communities, by industry, and by governments at the point that the European Union-defined Regulation (EU) 2016/679 of the European Parliament and of the Council, 27 April 2016, which defines principles and duties about the processing of personal data of individuals and the rules for the free movement of such data, and Directive 95/46/EC (General Data Protection Regulation, GDPR) OJ L 119, 4 May 2016, were issued. The extent and the strength of GDPR have been so macroscopic that scholars in strategy interpreted their fast and pervasive spread, in different forms, around the world as a phenomenon of weaponization.
Italy has been a pioneer in privacy regulation. The Italian parliament promulgated D.lg. 7 marzo 2005, n. 82, Codice dell’amministrazione digitale (G.U. n. 112 del 16 maggio 2005, Suppl. ord. n. 93), and promoted consequent initiatives to ensure that egovernment implementation processes were coupled with proper publicity and training actions towards public servants, citizens, and other private subjects. Similar initiatives took place in other countries. Even after these initiatives, which advertised and popularized privacy and security themes among the population, a study on European citizens revealed that the population behaves incoherently with the best practices, as a 2018 Eurobarometer survey (
https://europa.eu/eurobarometer/ (accessed on 21 February 2024)) indicates that citizens are well aware of risks and threats as well as of best practices and safe conduct, but they do not enact them in daily life.
In our previous work, we approached this problem in search for possible explanations in [
1], and we proposed a preliminary analysis method and mitigation approach in [
2]; we also considered the impact of privacy-by-design and privacy-by-default mandatory approaches requested by GDPR and a possible integration in software development cycles in [
3]. In this paper, we propose an approach for defining, detailing and analyzing policies aiming at limiting the probability that users behave in a risky way. We identified the type of factors which may restrain incorrect users’ behavior to provide a general framework for the definition of policies and actions; then, we defined, as a running example, a suitable strategy which can be adopted by a government and a parliament to restrain users and evaluated it to show how Influence Nets may be used for this purpose. In fact, in order to evaluate the impact of the possible actions to be taken, we use an approach based on Bayesian Influence Nets [
4], and we used the
Pythia [
5] tool and its analysis methods to compare alternative enactments of the available actions. To the best of our knowledge, our proposal provides a novel perspective and contributes to bridge efforts by the software industry, academia and policymakers.
The
Privacy Paradox is an apparently bizarre users’ behavior that may be characterized as
a concept in which online users declare that they are concerned about privacy but disclose personal data anyway [
6]. A systematic literature review [
7] identifies various theoretical explanations for the privacy paradox, such as decision biases, lack of experience, and illusion of control.
The privacy paradox concept is equally debatable. Solove [
8] claims that it is a myth produced by a poor application of logic, because people’s conduct in their everyday life can be influenced by biases and heuristics, manipulation and skewing, and other causes. The author argues that assigning more jobs to individuals to manage users’ privacy will not provide effective privacy protection, and instead suggests that a rule focused on regulating how information is used, stored, and transferred may have a greater influence on this issue.
Acquisti et al. [
9] discussed biases and illusory control in their review study, using user adaptation as an explanation. This research also proposes some possible actions to be performed to reduce the issue: (i) soft paternalistic interventions, namely
nudges, by authors given by stakeholders such as government, companies, etc.; (ii) beneficial impact from privacy regulations; (iii) use of privacy-enhancing technology; and (iv) market-based data
propertization schemes that could produce a favorable response (propertization is the process of treating anything as property under the law [
10]).
An empirical study undertaken during the COVID-19 pandemic [
11] reveals that consumers’ behavior may differ based on age and medical condition. In [
12], the case of AIoT-enabled smart surveillance was explored. The authors suggest that transparency in the mode and purpose of the information acquired could efficiently limit the privacy paradox impact.
The main contribution of this paper are as follows:
This paper is organized as follows: in the next section, the materials and methods are presented, in particular the Bayesian networks and the theory of influence networks, which are the base of the out proposal, and also the tool that has been used for the implementation. In
Section 3, results of the proof-of-concept are shown and related considerations. In
Section 4, results are discussed. In
Section 5, conclusions of the work are drawn and possible future work is outlined.
2. Materials and Methods
In order to define an action strategy, an analysis of the context in which the user operates is needed. The user operates in an environment and its factors influence (and can be used to influence) the user. Three types of factors can be identified:
behavioral factors, which are related to the way in which a user behaves according to their own beliefs, own decisions, own initiatives, own understanding of the environment, own intents;
context factors, which are related to the active or passive interactions of the user with the environment; and
tool factors, which are related to the devices by which the user interacts with the environment and implements their behavior (see
Figure 1).
Behavioral factors, in turn, can be classified into two levels: personal behavioral factors, which include all individual behavioral factors, that is, whatever belongs to the personal dimension of decisions, of intents, and of strategies the user applies in their interactions with the environment; and societal behavioral factors, which include all behavioral factors which a user implements as a member of the society, of a group, of a team, or of a collective subject. Context factors can be classified into two levels: instantaneous factors, which are related to a given instant of time in which a user interacts with the environment and are consequently embedded in an isolated action or choice of the user in that very moment, given an evaluation of the state of the environment in a limited horizon of time and space and with no hypothesis of coherence in user behavior; and duration factors, which are related to behavior in time, including adaptation, coherence, and filtering of exceptional reactions or of reactions to exceptional conditions. The analysis of time-related aspects is not in the scope of this paper, and consequently, this dimension is not used. Tool factors can be classified into three levels: product related factors, which represent the constraints which derive by the adoption of a specific tool because of its general nature (e.g., software, orally transmitted procedure, self-defined procedure…), its own characteristics (e.g., features of that software, absence of free-choice option in a list…) and its limitations (scope or purpose of the tool) and, in a wider perspective, the effects of the choice of a given tool enacted by the user or by a stakeholder which can impose it to the user; technological factors, which are related to the potential, the power and the limitation of the chosen technology, or the chosen set of technologies, for the implementation of the behavior, which also includes cultural factors and cost influences; and regulation factors, which are related to all international, national, local, and vertical formal regulations, shaping what is allowed for the tools in terms of capabilities, limitations, technical characteristics and rules, delimiting the extent and type of free choice in tools, behavior and context configuration.
All factors may be used to guide the user towards a correct behavior, implementing stimuli or constraints and enforcing some decisions or performing nudging. A preliminary study on this problem [
13] helped us to explore the field and to build the background for this analysis, which adopts a wider, more systematic and different conceptual approach. In order to obtain a quantification of the factors, we adopt, after the successful experience, Influence Nets, which expand the capabilities of the widely known and adopted Bayesian networks.
2.1. Bayesian Networks
Bayesian Networks (BNs) are well-known probabilistic models, frequently used to depict complex phenomena having in mind their intrinsic uncertainty. Those structures have been widely used in a number of application areas, including finance, machine learning, speech recognition, gene regulatory networks, and illness detection; examples of applications of BNs in various domains may be found in [
14,
15].
BNs implement a graphical model structure known as a Directed Acyclic Graph (DAG), and they allow us to effectively compute and describe the joint probability distribution over a set of random variables. The set of directed edges and the set of nodes determine the structure of a DAG. The nodes, drawn as circles with the variable names labeled on them, stand in for random variables, while arrows connecting nodes symbolize the edges, which stand in for connections between the variables. The direction of the dependencies is shown by the arrows on the edges. In a network, the connected nodes’ conditional probabilities are linked to the strengths of these dependencies. Specifically, an edge that connects node
to node
shows a relationship between the respective variables. Consequently, an arrow shows that a value obtained by variable
is dependent upon a value obtained by variable
; in this way, the number of parameters that are required to characterize the joint probability distribution of the variables is significantly reduced. This may be verified by applying the Markov property, where the conditional probability distribution (CPD) at each node depends only on its parents [
14]. This conditional probability is typically shown for discrete random variables as a table describing the local probability that a child node takes on each of the possible values for every possible combination of values for its parents.
To better clarify the model [
16], assume that the problem is to describe the relationships between three variables: the status (S) of a sprinkler (i.e., whether it is turned on or off), the presence or absence of rain (R), and the wetness of the grass (G). Keep in mind that rain or an operating sprinkler are the two things that can moisten the grass. Rain directly affects how sprinklers are used; assume also that when it rains, the sprinklers are usually off. A BN can be used to describe this scenario. There are two possible values for each variable: F (false) and T (true); the graph is shown in
Figure 2.
Influence Nets are BNs whose probabilities are estimated using influence constants which are in turn estimated by experts, providing a framework for modeling and analysis when dealing with challenging decision-making situations [
4]. Influence Nets are represented by directed acyclic graphs in which the events are nodes, and a causal relationship between occurrences is indicated by the arc connecting nodes. Every graph arc has two Causal Strength (CAST) Logic parameters (
h,
g) [
17] which define its causal strength:
h denotes the influence of the parent node event on the child node, and
g denotes the impact of the child node event in the absence of the parent incident. The range of
h and
g is [
,
], where “+” denotes promotion, “−” denotes inhibition, “1” denotes the strongest possible influence, and ”0” denotes no effect.
The desired event is represented as a leaf node with no outgoing edges, and the actionable events in the Influence Net model are root nodes with no incoming edges. The intermediary nodes are responsible for gradually influencing the situation and transferring the effect to the next node. Every root node in the model requires an a priori probability, while non-root nodes require a baseline probability [
18].
In
Figure 3, an example of an Influence Net is shown, in which the root nodes are
A,
B and
C, with a priori probabilities of, respectively,
,
and
; node
X is a leaf node with baseline probability
. When event
A occurs, the impact of
X is
, indicating that the occurrence of event
X is strongly encouraged; when event
A does not occur, the impact of
X is
, indicating that the occurrence of event
X is strongly inhibited.
2.2. The Pythia Tool
Pythia [
5] is developed in C# language using the Visual Studio .NET platform and allows us to build both Influence Net models and Timed Influence Nets of any size and complexity and the only limitation is the memory of the machine running Pythia, and it can import and export data in the Microsoft Excel format.
Using the GUI of the tool, it is possible to define actionable events (root nodes), drawn as rectangles, and non-actionable events, drawn as rounded rectangles, thus making them visually distinct. In order to represent both positive and negative influence relationships between the nodes, different link styles are used: positive influence links are blue with pointed arrow head, while negative ones are colored in red with a round arrow head.
The likelihood of occurrence of a particular event (node) in an Influence Net is represented using 9 different levels (and 9 corresponding colors), namely, the following:
Significantly More Likely: Darker Blue ()
More Likely: Dark Blue ()
Moderately More Likely: Blue ()
Slightly More Likely: Light Blue ()
Neutral or No Impact: Grey ()
Slightly Less Likely: Pink ()
Moderately Less Likely: Red ()
Less Likely: Dark Red ()
Significantly Less Likely: Darker Red. ()
A basic Influence Net is displayed in
Figure 4. Node
A has a neutral beginning probability, is actionable, and positively affects Node
C (blue arrow). Though it has a Significantly Less Likely (Dark Red) probability of happening and a negative impact on Node
D (red rounded arrowhead), Node
B is still an actionable event. Node
C is a final node that cannot be altered, that is, no influence arrows are emitted from it. This occurrence is marked as Moderately More Likely by the color blue.
2.3. Modeling and Analysis Approach
With respect to our previous work, we applied a different methodology. The primary target in this work is to evaluate which actions by the authorities (primarily, the government) may impact the enactment of risky behavior by users. As this should be obtained by influencing users at different levels of intrusiveness in their free will, the analysis has been carried on by considering macrofactors related to the behavioral, context and tool perspectives, which have been described by means of possible actions which may minimize the probability of the enactment for risky behavior. These actions have been analyzed to track back a chain of actions from viable basic actions which may match political decisions to the actions corresponding to the found macrofactors (which can be represented as actionable events in Pythia). These basic actions are the actionable levers of the models of which the effectiveness has to be evaluated. In the breakdown process of the network of actions and influences, additional reinforcement or inhibition influences between actions have been detected and included in the model. During the breakdown process, alternatives have been identified and different choices are presented in the cited previous work: a selection process has been applied to obtain the model used for this work and presented in the next section, according to the following criteria:
Is the action systematic, that is, can it be replicated in the same way to enact a coherent strategy?
Is the action within the range of power of a government, that is, is the action something which can be supported, stimulated, forced, directed, induced, produced by decisions taken by the government or the parliament in direct or indirect way? Is it a political action which can be framed into a policy which is not ideological but of administrative nature?
Can the action be performed by or with respect to a specific group of actors which can be considered as a well-defined subsystem of societal forces?
Is the action practically viable, that is, do evident, even if abstract, means of enactment exist?
Is the action substantially different from other selected actions? Is it not already comprised within another action? Is it not just a special case or a step of another action?
Does the action have actual consequences which may lead to the hypothesized influence?
With the exclusion of the viable basic actions, can the action actually be influenced by other previous reasonable actions? Does the action lead to discovering other possible influencing actions?
Such a modeling process does obviously imply a component of subjectivity and discretion, as the analysis is clearly influenced by the experience of the modeler; in order to minimize the relevance of non-analytical points of view, the model has been developed by applying the following process:
The extent of the basic viable actions has been discussed by the authors, with the help of experts and colleagues;
For each action, starting from the target and until no action has relevant potential influencing actions which cannot be logically considered as one of the basic viable actions,
- (a)
The action has been analyzed to understand possible influencing actions by each participant;
- (b)
The relevance of each influencing action has been estimated;
- (c)
Each action has been evaluated according to the presented criteria;
- (d)
The decision of each participant has been shared;
- (e)
Participants have agreed on the actions to be inserted in the model;
When no action needs to be analyzed, the model has been discussed within all participants;
Each objection or suggestion has been evaluated;
The model has been consequently reviewed.
For step (1), the evaluation is strongly related to the domain and to the nature of each basic viable action. Each action should be analyzed not only with respect to its direct consequences, but also in relation with all other actions and its possible superposition with the other basic viable actions, to ensure that they are as less interdependent as possible and to ensure that one is not included or implied in others. Moreover, they must not have potential common influencing factors which are not in the set of actions, that is, they should be not consequences of common causes. In case they are, the common cause should be considered and take the place of the dependent actions as the basic viable action. Viability should be estimated in terms of actual means available to policymakers. The evaluation requires experience and different expertise, with an eye on the political strategy of the decision authority, which can only be available by resorting to a panel of experts in suitable composition, depending on the nature of the actions. In this step the set of basic viable actions can be changed if needed, and the panel composition can also match the needs generated by the new set. After this step, the composition of the panel is kept for the rest of the process.
In step (2), the indicated steps are oriented to keep the extent of the model as compact as possible, and the analysis should be focused on cause/consequence effects; anyway, the panel might recognize some influence which requires additional basic viable actions: this constitutes a static debug point of the model, which must be consequently modified to include the new factor and rebuild the coherence of the model. In this case, the process must restart from step (1), as new basic viable actions may be revealed as necessary.
In step (3), the model is in a stable state of its development and coherence. Each member of the panel reviews the model as a whole, with the purpose of confirming or not its completeness with reference of its purpose. The step is passed if all participants accept it as complete. Individual qualitative evaluations and a panel validation statement, if possible, are the outputs of this step.
In step (4), if a panel validation statement has been issued, the individual qualitative evaluations about the model are used to discuss minor non-structural corrections on influences or probabilities and converge to the final values; otherwise, the process goes consequently back to step (1) or to step (2), depending on the nature of the disagreement (fundamental or local).
In step (5), the model is released for the analysis (during the analysis process, further changes on influences or probabilities, driven by the results and their interpretation, might happen: this constitutes a dynamic debug point of the model).
According to this approach, in order to evaluate the effectiveness of the approach, the strength of each influence has been defined during the analysis process according to the experience of a panel of experts The panel is composed of 2 Data Protection Officers (DPsO), 2 legal experts in privacy, 2 ICT professionals and the authors, one of which is a DPO himself, the other of which is an expert in the application of ICT and privacy in public administrations, including participants, and in case of disagreement, a sensitivity analysis has been performed on the model, by evaluating different influence weights.
In a second phase, the effects of propagation in time of the consequences of the actions have been considered when significant.
2.4. Model
The resulting model is depicted in
Figure 5.
As seen, the purpose of the model is to evaluate if and how a set of actions which are in the power of the government minimize the possibility of having users incurring into risk exposures related to privacy (and security) because of wrong behavior. The analysis produced a behavioral inhibiting action, “Users behave consciously”, two context-related inhibiting actions, “Improve reaction capacity” and “Lower risk exposure”, and a tool-related inhibiting action, “Improve contrast system”.
“Users behave consciously” represents the enactment of a more conscious behavior, due to influencing actions which aim at raising the knowledge and the awareness of users with respect to privacy (and security) risks and bad practices. This can be obtained by enacting measures which inform and educate users on a regular, systematic and trusted basis (“Promote in education” awareness about these themes, which is within the range of the regulation power of the government or the parliament and can be incorporated into bipartisan policies, thus can be easily approved and kept even in case of a different majority taking over governmental duties), by means of a constant attention by media (“Inform population”) or by contrasting false awareness in users, due to misinformation, loose security procedures or absence of proper means to consciously or unconsciously react to potential exposure (“False awareness spreads”, which has a negative influence on “Users behave consciously”).
In order to “Inform the population”, the government may design and introduce a baseline of frequent and correct information through the media (“Enact public service adv. campaign”), which may stimulate other contributions (not all necessarily valuable or effective).
In order to contrast the fact that “False awareness spreads”, regulations to enforce good practices or to keep up the attention and stimulate an improvement in users attention levels may directly be defined by the government or the parliament (“Define user man. reg.”), for example, it could be possible to define regulations aiming to apply different security measures to reward users showing a more conscious behavior, using looser security controls for them, at the cost of tracking their behavior in a more or less precise way; another looser security control could be a more sporadic use of third-factor authentication.
Another contribution which may inhibit the spread of false awareness is the implementation of standard and purposely designed plugins which may be used by websites to implement good practices, analogously to what currently is carried out with cookie management (“Implement institutional plugins”), and which might gather useful information to contrast bad practices both on the side of users and services. In order to do so, there is a need to “Define security regulations” in a proper way, which can be in the power of the government, possibly by means of the definition of technical standards within national or international organizations or public authorities.
To “Improve reaction capacity”, besides implementing standard general tools (“Implement institutional plugins”), an analysis of reference behavioral profiles to understand, categorize and manage typical user types and refine the tools to enable correct reaction strategies (“Research behavioral models”) may produce advantages. In turn, proper and properly managed verified data are needed to allow research (“Make more reporting info available”). This may be favored by embedding into products safe mechanisms to obtain, report and preprocess data, coherently with privacy requirements (“Define industrial prod. reg.”), which may be stimulated by the government by means of regulation, or through international agreements aiming at promoting quality standards for products.
The availability of detailed reports may also improve the capability of the law and order system (“Improve contrast system”), as information may help with defining the general framework of judicial cases, the design process of regulation and the organization of police authorities and their procedures.
One of the possible actions which may lead to enable lowering the risk of exposure is to “Improve usability”. This means tools which are more suitable for correct use and which guide users towards a correct behavior. The availability of behavioral models and industrial product regulations may actually contribute, but the most important action to “Improve usability” is to “Foster better SW design practice”, so that state-of-the-art in software design and development, oriented to promote best practices, will confer software products the correct usability features. To ”Foster better SW design practice”, authorities may actively “Involve field experts”, by means of proper campaigns, by creating panels, or by funding “dedicated initiatives” to ”Define technical regulations”, either by legislative initiatives or by means of the usual technical regulations processes, based on consortia of private stakeholders. This may, in turn, include to “Define training standards”, so that workers will enact, at their workplaces, good practices which have ”Lower risk exposure”. The government, or international organization, may also directly promote free initiatives in privacy enhancing technologies or in quality-enhanced products which implement higher privacy preserving features by funding related activities or consultancy (“Fund PET”), reducing the overall risk exposure of users (“Lower risk exposure”) by other paths.
This Influence Net model is itself a preliminary result needed for the analysis presented in the next section.
3. Results
The initial settings of the model are in
Table 1. In this phase, influences are set according to the evaluations of the panel and all actions have a native
baseline probability, to obtain an overall reference probability for the target action “User incur into risk” and verify that a proper setting of baseline probabilities for all other actions do actually have consequences. When all independent actions are set to a
probability (random initiatives by the government), “Users incur into risks” has a final probability of
due to influences after a static propagation.
The model has been analyzed by using Pythia.
3.1. First Step: Background
A first sensitivity analysis can be performed to point out subsequently that there are actual effects of proper baseline probabilities for actions on the overall behavior of the target action probability value. This has been carried out to also evaluate the general effects of influences on which there has not been agreement in the panel. Changing the influence between “Make reporting info available” and “Improve contrast system” from to a more pessimistic changes the probability of the destination event (still with naïve baseline probabilities) from to with no effect on the probability of the target event; changing the influence between “Define technical regulations” and “Foster better SW design practice” from to a more pessimistic changes the probability of the destination event (again, still with naïve baseline probabilities) from to with no effect on the probability of the target event, while the probability of “Improve usability” changes from to with no effect on the probability of “Lower risk exposure”, which stays at ; changing the influence between “Improve usability” and “Lower risk exposure” from to a more pessimistic changes the probability of the destination event from to , still with no effect on the probability of the target event. This means that the found disagreements on the influence values are basically structurally absorbed by the structure of the model, when a neutral baseline value for action probabilities is assumed for all actions.
Performing a Sensitivity to Actions analysis does not provide any significant oscillation of the target event probability. Performing a Sensitivity to Influences analysis produces a diff-g between “User behaves consciously” and the target action, a diff-g between “Improve contrast system” and the target action, a diff-g between “Improve reaction capacity” and the target action and a diff-h between “Lower risk exposure” and the target action, which are the only significant differences in the model. If all probabilities for governmental actions are set to 1, the probability of the target action is .
3.2. Second Step: Analysis
The actual baseline probabilities are set as in
Table 2. Pointing out that the baseline probability has been estimated as the probability of a
spontaneous evolution of the action with no external policy application, we set the baseline probability for the Actions “Inform population”, “Research behavioral models”, “Improve reaction capacity” and “Users behave consciously” to
because it is possible that a relevant security event, such as a massive hack of sensitive information from top-level service providers, could generate positive effects as follows:
A vast communication campaign (“Inform population”);
And/or more careful behavior of users (“Users behave consciously”);
Improve users’ reaction capacity;
Stimulate a growth in research on users’ behavior.
Table 2.
Setup for actions baseline probabilities in the presented model.
Table 2.
Setup for actions baseline probabilities in the presented model.
| Action | Baseline Probability |
|---|
| Promote in education | 0 |
| Define security reg. | 0 |
| Define industrial prod. reg. | 0 |
| Define user man. reg. | 0 |
| Enact public service adv. campaign | 0 |
| Involve field experts | 0 |
| Fund PET | 0 |
| Implement institutional plugins | 0 |
| Make reporting info available | 0 |
| Inform population | 0.2 |
| Define tech. reg. | 0 |
| Improve contrast system | 0.1 |
| False awareness spreads | 0.7 |
| Research behavioral models | 0.2 |
| Foster better SW design practice | 0 |
| Define training standards | 0 |
| Improve reaction capacity | 0.2 |
| Users behave consciously | 0.2 |
| Lower risk exposure | 0 |
| Users incur into risk | 0.6 |
| Improve usability | 0 |
For the same reason, action “Improve contrast system” has been set to a non-zero value, but with a lower probability of happening (). Regarding “Users incur into risk”, we assume the value due to the trend of risky attitude adopted by users, which increased over time, as shown by the cited Eurobarometer survey. For the same reason, we set the baseline for action “False awareness spreads” at a value of .
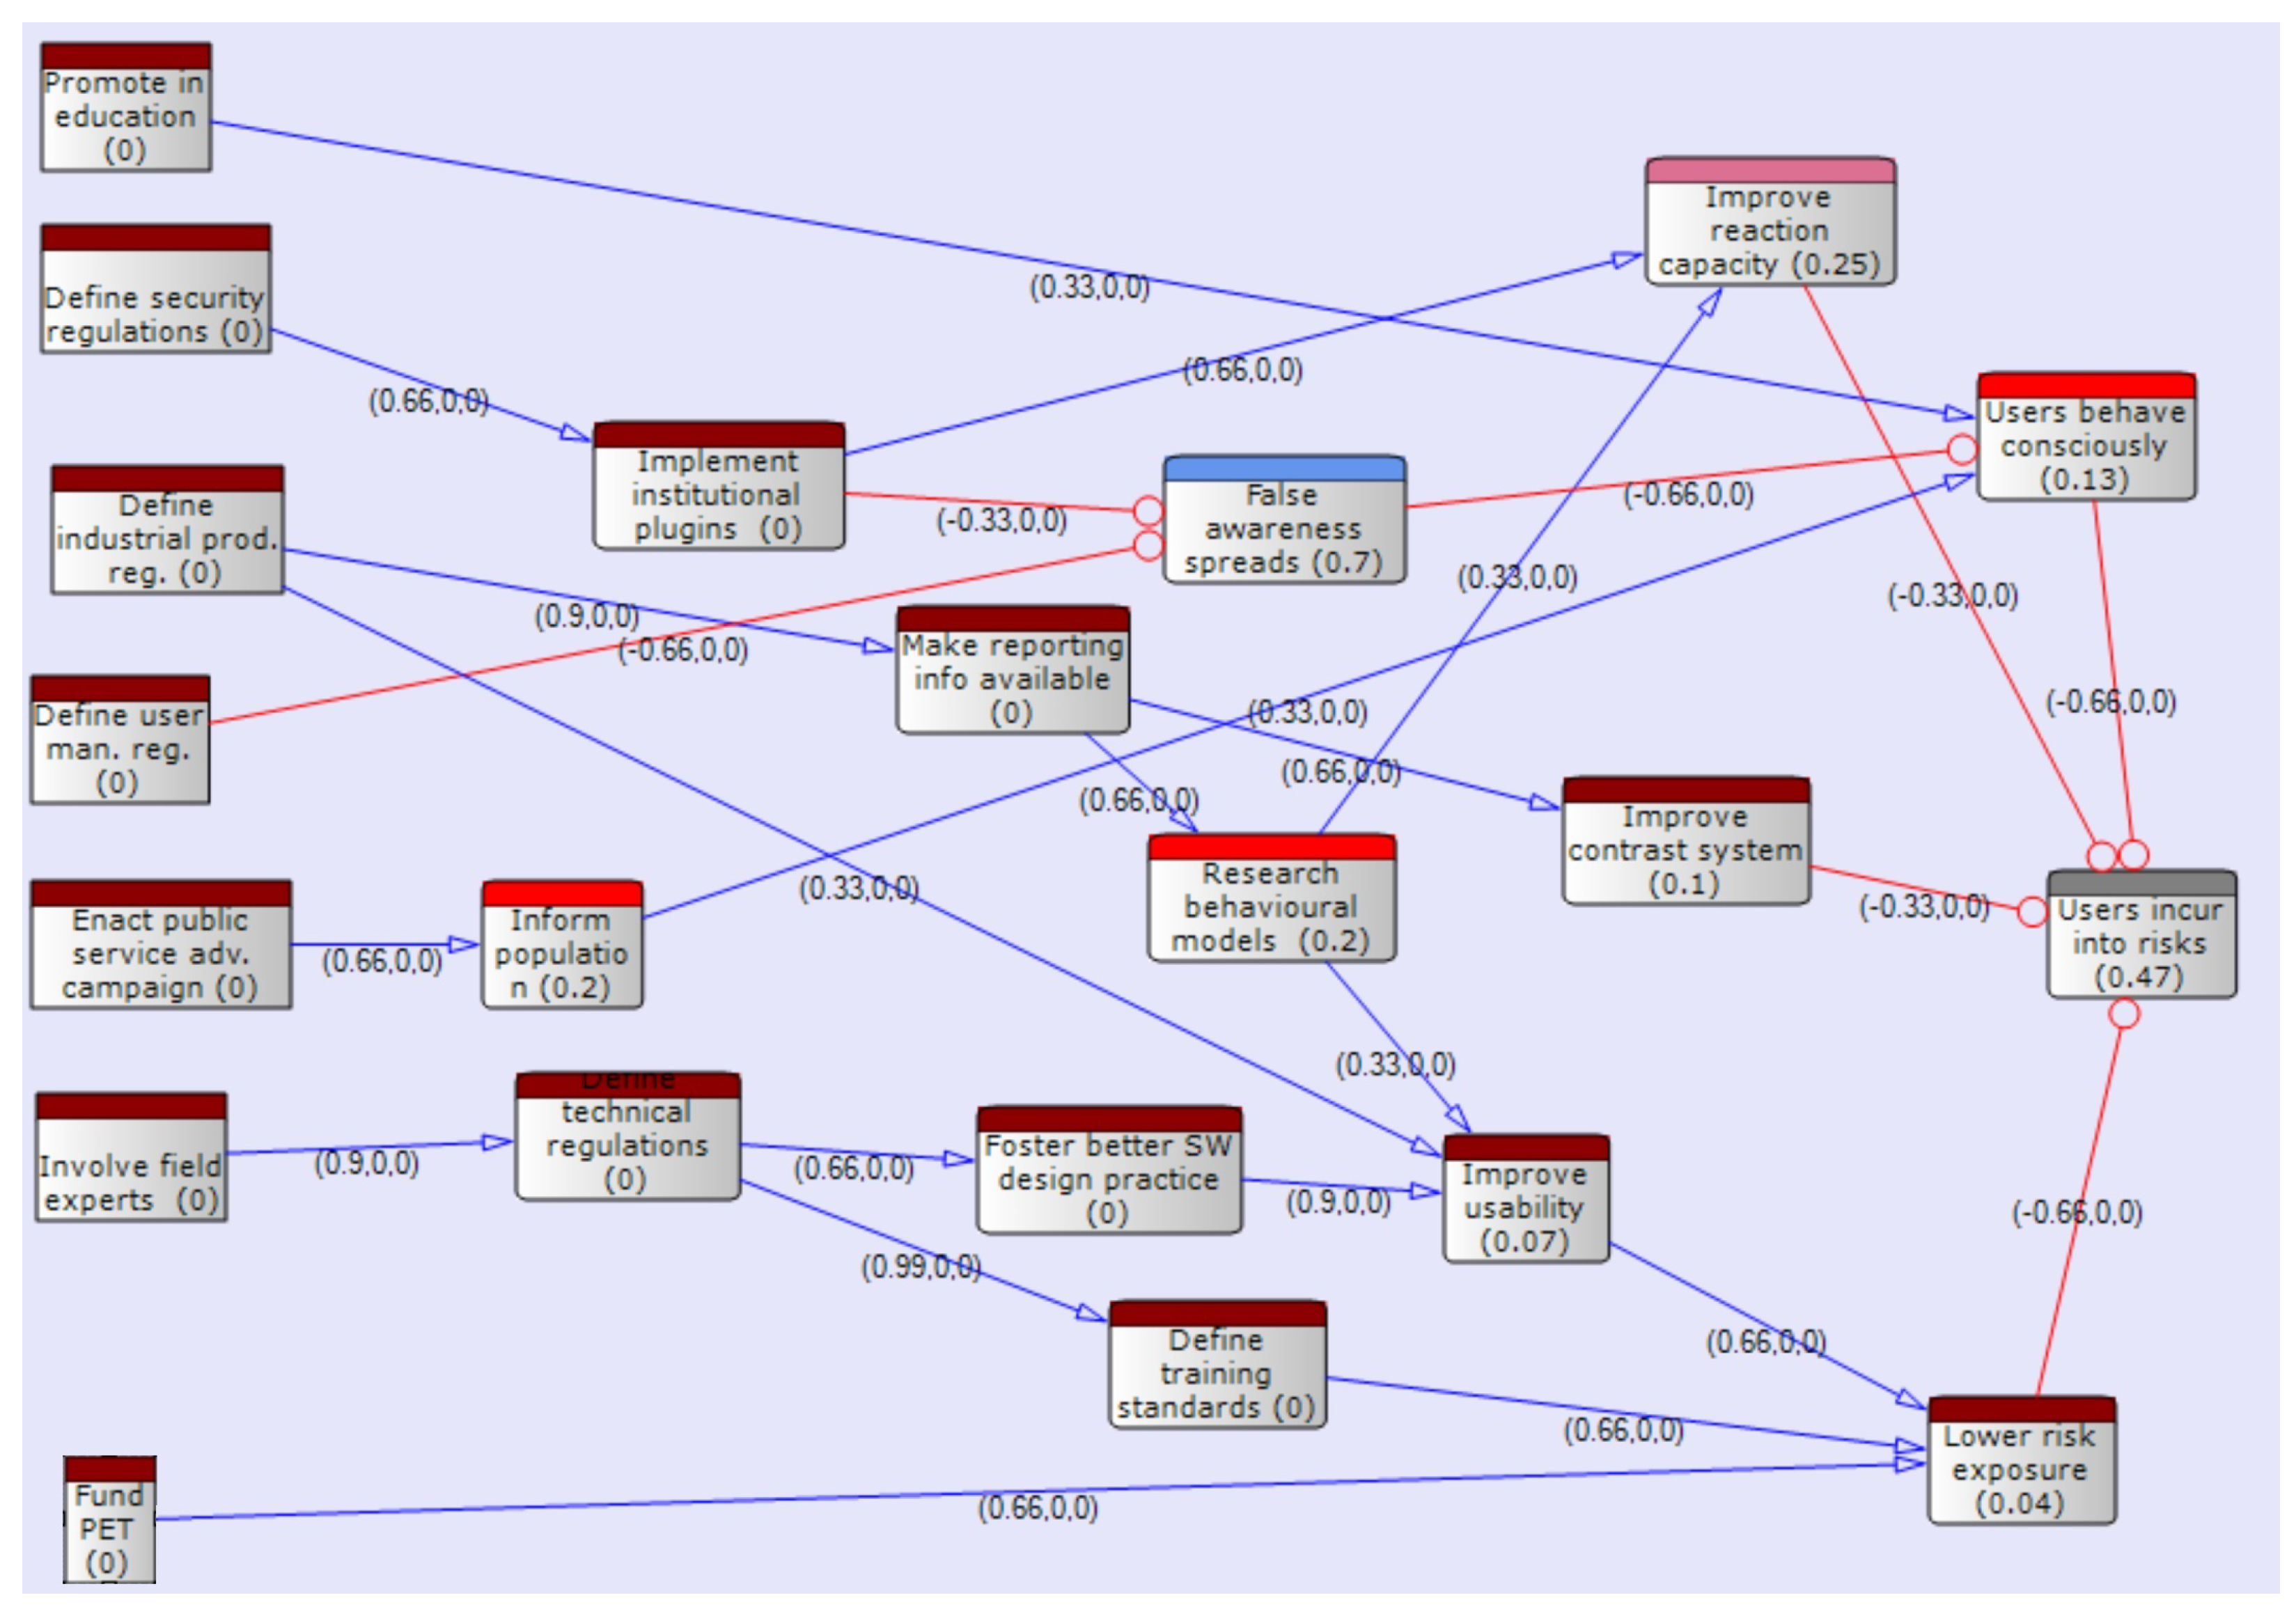
The baseline probability for the other actions have been set to 0, meaning that if no policy is deployed, the respective influenced action will not take place.
By setting all governmental actions probability to 0 (the government does not do anything to manage the problem), the propagation across the model produces a
probability for the target action, which is lower than the hypothesized value: this was expected, as the rough original value was only considering one specific, even if macroscopic, behavior of users. This means that the spontaneous enactment of intermediate actions, which happens according to the stated baseline probabilities, does already show positive effects as a result of the actual and active implementation of spontaneous actions. This justifies the described choice for the baseline probability of the target action, which has been set by evaluating in isolation an independent behavior documented about users by the Eurobarometer study, but does not produce such an analogously macroscopic effect, not observed in reality, due to the existence of the inhibiting factors, which operate anyway in the three areas of influence. Verifying if this reduction in impact is beyond the goals of this work, here, we assume this result as a qualitative result which confirms a realistic overall behavior.
Figure 6 shows all probabilities in this case.
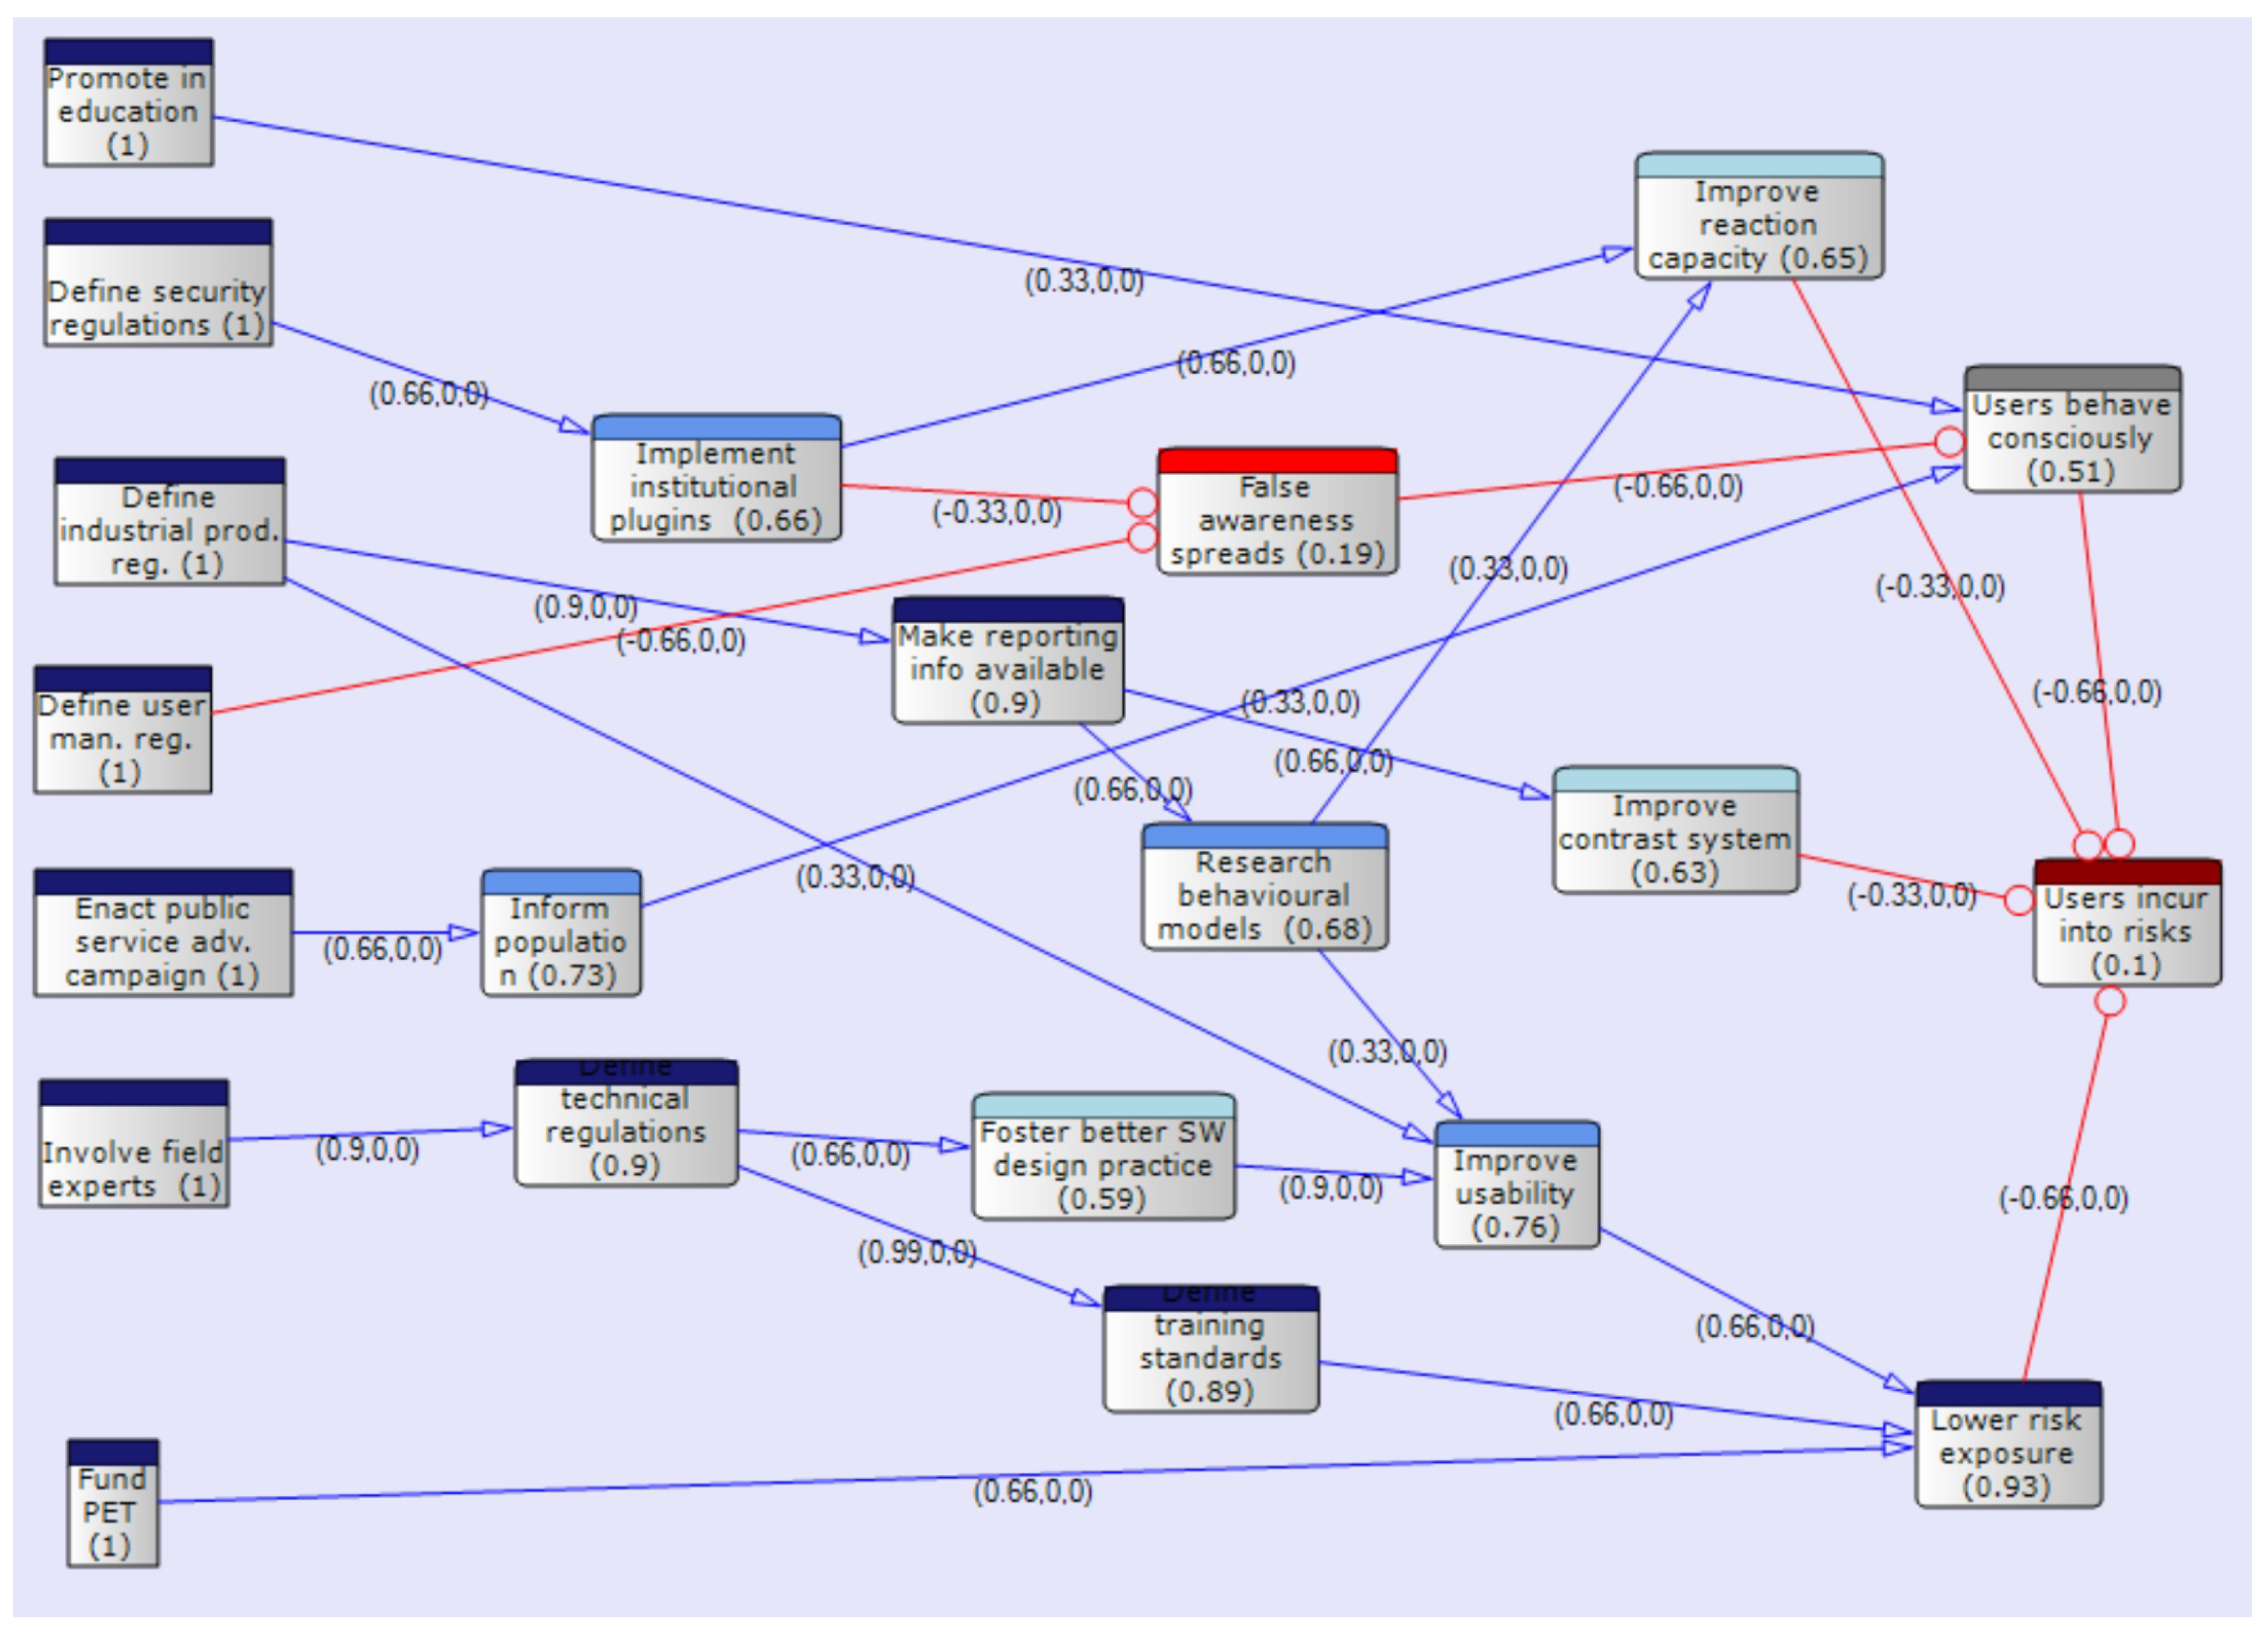
By setting all governmental actions probability to 1 (the government does enact all considered available actions to manage the problem), the propagation across the model produces a
(
in
Figure 7, but see
Figure 8 for a more accurate value) probability for the target action. Consequently, the considered actions have a significant effect on the limitation of the probability of enactment of risky behavior.
Figure 7 shows all probabilities in this case.
It is interesting noting that in this case, there is less than probability that “False awareness spreads”, but this does not impact dramatically on the fact that “Users behave consciously” (, much better than the probability when the government does not act, but very close to , which is a random behavior). There is a radical effect on the probability of “Lower risk exposure” (from to , which tells us that the biggest contribution on the fact that “Users incur into risk” much less is due to tools factors). A good effect is also obtained for “Improve contrast system”, which has a probability of happening which increases from to .
4. Discussion
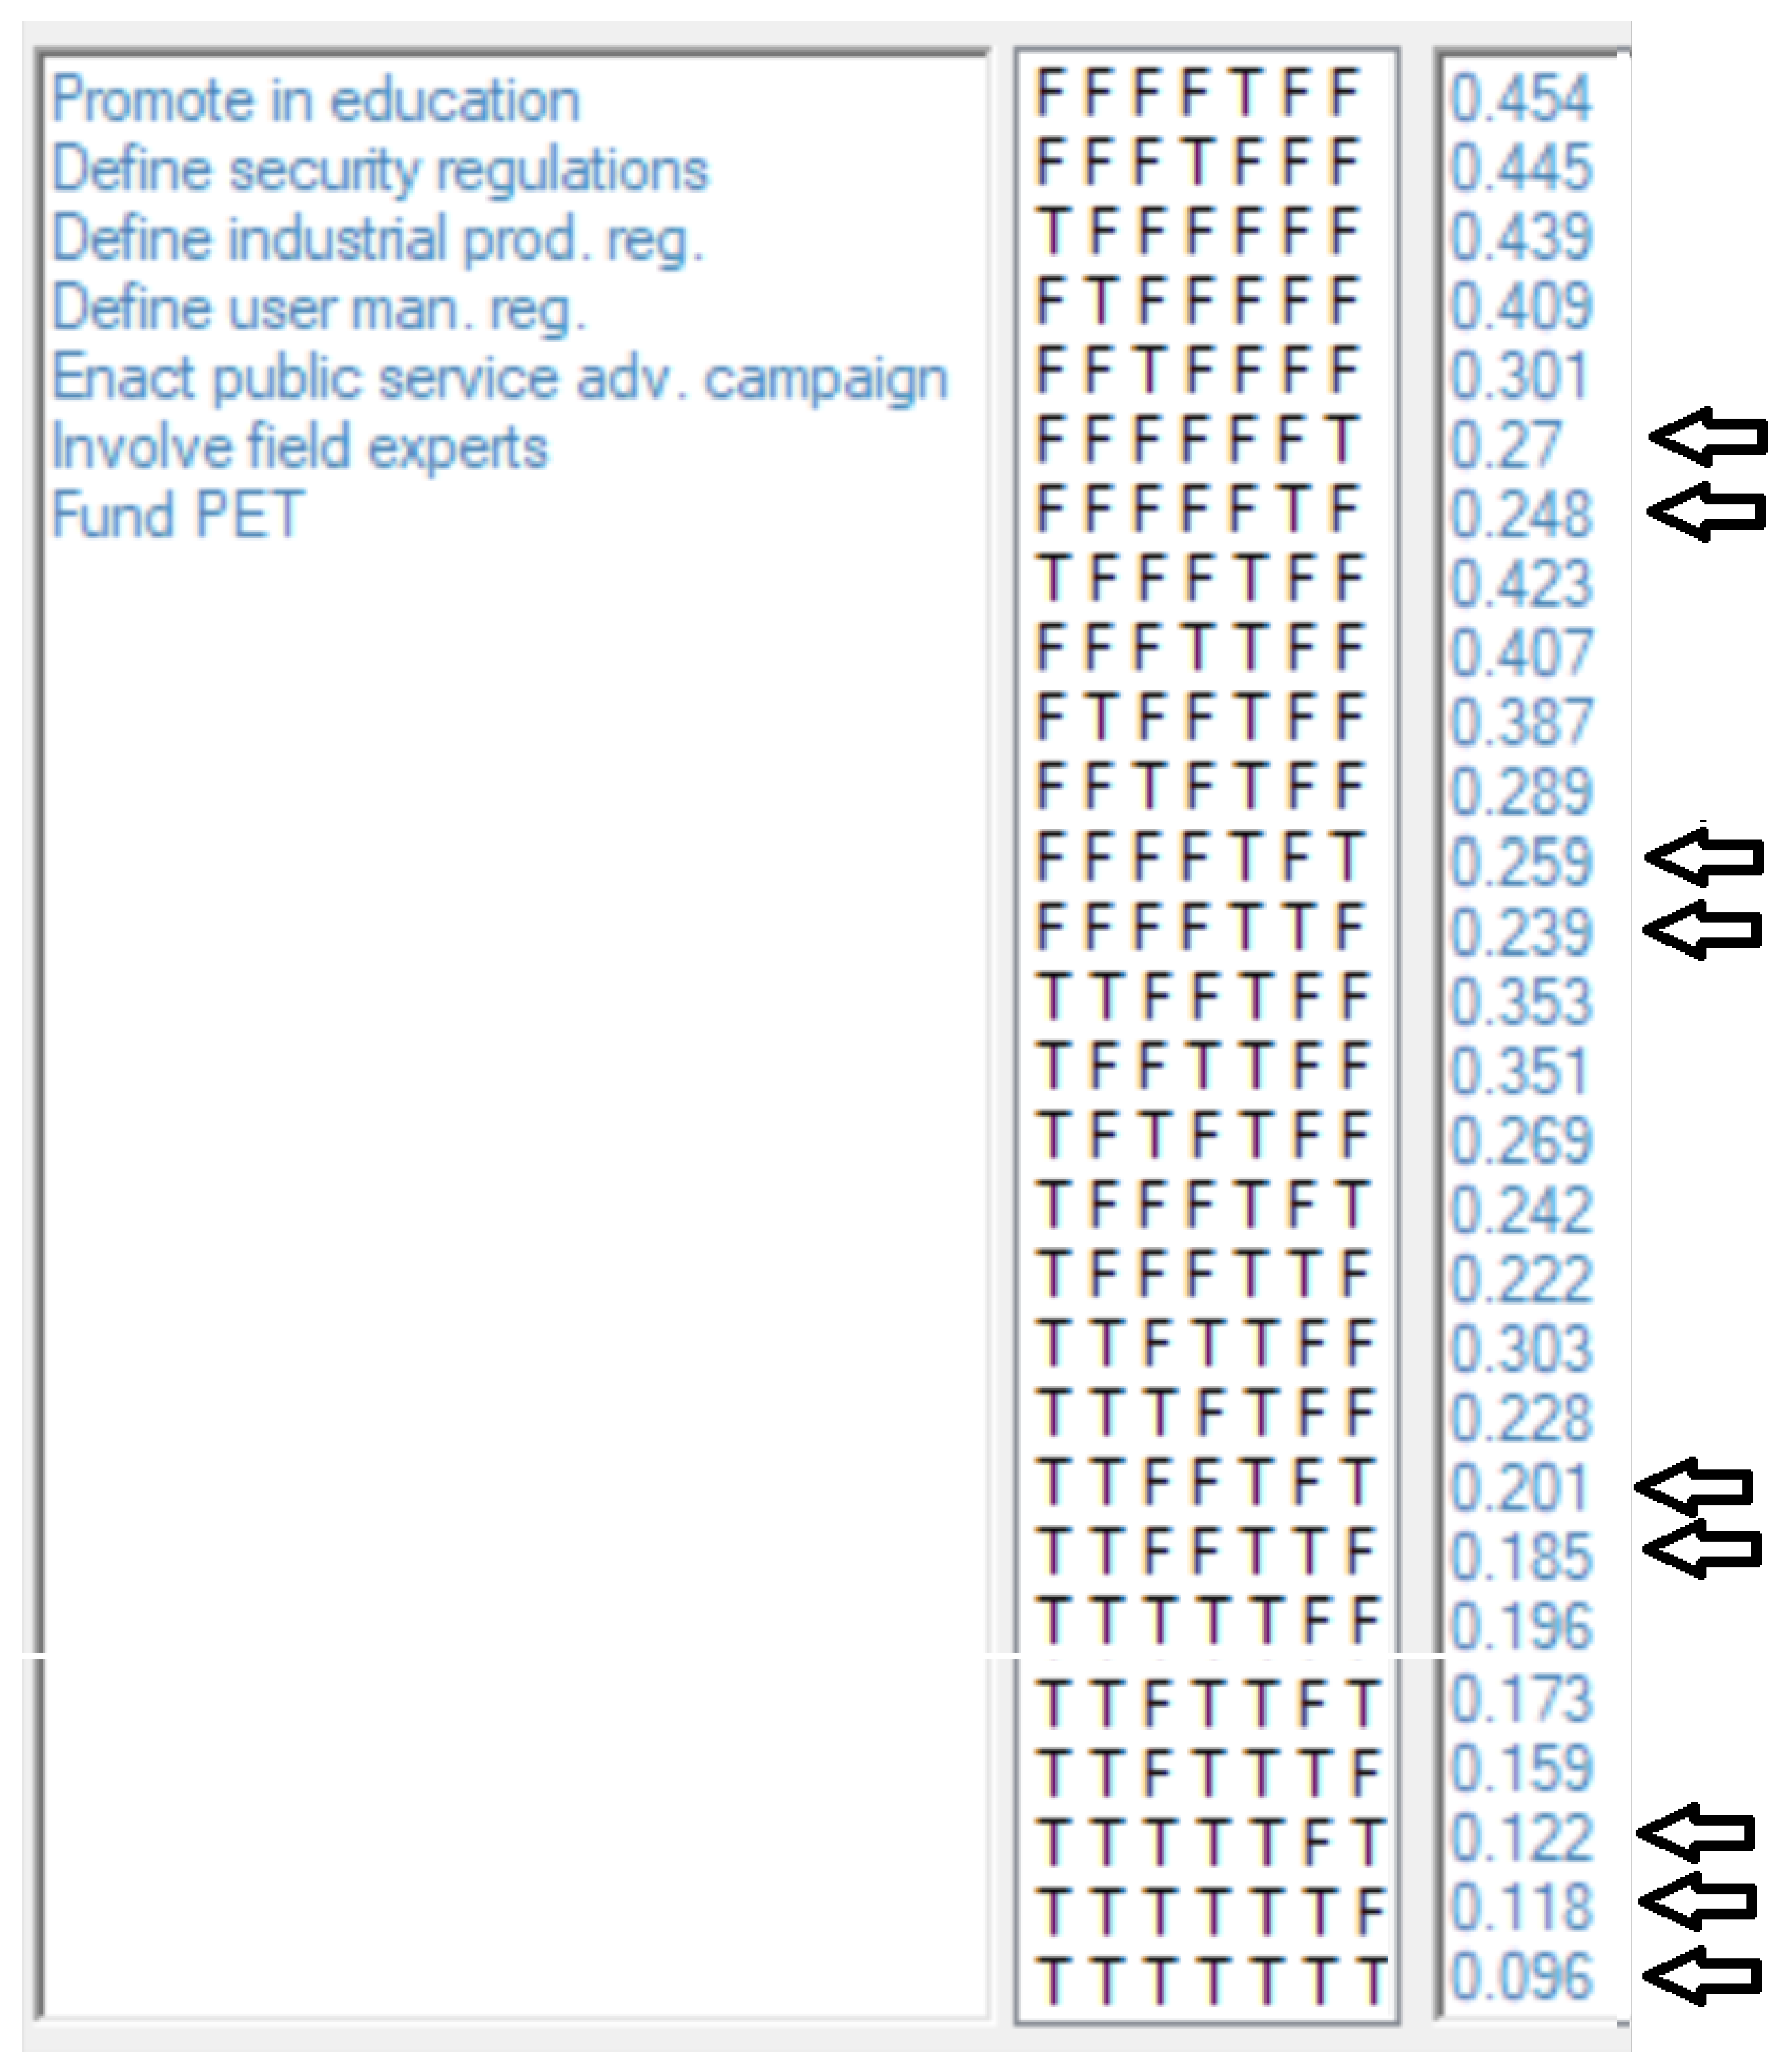
In order to discuss the actual influences of each lever, a Sets of Actions Finder (SAF) analysis has been performed for the target action. Results of the best 28 cases (lower probabilities) are reported in
Figure 8. The figure also points out some interesting cases.
First, it is noticeable that, as the lowest probability is obtained by taking all available actions, all of those are giving a positive contribution. Anyway, by grouping together sequences with the same number of active levers, the best results are always obtained in each group when either field experts are involved or PET are funded, with a difference between them which is always approximately times less than the difference between the third and the second best options, and less than on average. Such a result suggests that these factors are substantially equivalent when developing a strategy for the enactment of the presented actions.
A comparison between the two available combinations which only differ in the promotion of privacy in education and exhibit a ratio of less than in the improvement of the biggest probability value, with the exception of the case which exhibits a ratio and implies the use of public service advertisement campaigns and regulation of user management only, suggests that the impact of specific user-education actions is actually not critical, confirming somehow the privacy paradox.
The best performance by applying four actions is obtained by promoting privacy in education, defining security regulations, enacting public service advertising and involving field experts. This solution produces a target action probability smaller than and only twice the one obtained by enacting all actions, but it has the advantage of not requiring funding of PET, which is the most expensive action, because the other actions may be easily launched by policy. This result is better than the worst result employing five actions, all of regulatory nature (no PET funding, no involvement of field experts, less than difference). The best performance by applying two actions is also interesting, as it is obtained by only enacting public service advertising and involving field experts, which can be carried out in a very short time and without the burden of regulation definition procedures. This solution reduces the target action probability to less than , which is half of the probability obtained when no action is taken, and appears to be better than all solutions using three actions, with the exception of the combination which adds the effects of education, which produces a further improvement of less than of the probability but needs time to produce effects on the population.
The analysis and its results have been discussed by the panel, and a consensus has been reached about the applicability of the approach and the significance of results which can be obtained in real cases. A consensus has been reached by proposing the results of the analysis and the hypotheses before disclosing the process, discussing them and producing an individual short comment to propose a possible explanation; secondly, explanations have been shared and discussed, and the procedure has been disclosed, discussed and validated.


