1. Introduction
The Pulmonary Function Test (PFT) is a basic device to evaluate the functionality of the respiratory system [
1]. The diagnostic decision obtained from the PFT is usually based on two nonlinear curves: the respiratory flow–volume and volume–time curves. Apart from those primary curves and patient data, many threshold limits and predicted values of the respiratory parameters can be calculated and visualized to the physician to help them make the right decision about the patient condition [
2]. The knowledge base from expert pulmonologists could be invested to design a PFT medical decision support system that employs artificial intelligence techniques [
3,
4], such as an artificial neural network (ANN). An ANN can be trained to deal with sophisticated nonlinear problems [
5], such as PFT curves and parameters. Using smart methodologies such as ANN may improve the healthcare quality for patients [
3,
4].
Many types of ANN have been attempted in the literature for the auto diagnosis of respiratory diseases. This includes Radial Basis Function (RBF) [
6,
7,
8,
9,
10], MLP [
7,
8,
9,
10,
11,
12,
13,
14,
15,
16,
17], Recurrent Networks (RN) [
11,
13,
18], Learning Vector Quantization (LVQ), and Generalized Regression [
19]. Different classifiers were utilized, such as Support Vector Regression (SVR) analysis [
20], multiclass Support Vector Machine (SVM) [
10,
21,
22], Data Mining [
23], Random Forest classifier [
22,
24,
25], and Decision Tree [
4,
25]. Other attempts combined ANN with different techniques to improve the classifier’s performance, such as Fuzzy Algorithms [
13,
14], Principal Component Analysis [
26], k-means clustering [
8,
22], or using a convolutional neural network to extract the PFT features from the flow time [
18]. They all successfully reported a range of performances, indicating 82–100% accuracy.
Of those who utilized ANN with MLP, Baemani et al. [
11] implemented eleven PFT parameters as inputs to their two-stage network: the MLP and Elman network, resulting in three-cases classification (normal, obstructive, and restrictive) with an average accuracy of 92.3%. Using 15 inputs to their MLP, Manoharan et al. [
7] classified their samples into only two cases (normal or abnormal), achieving 96% classification accuracy. In addition, Jafari et al. [
12] obtained 97.6% average classification accuracy by using an MLP neural network with ten inputs, categorizing their samples into four cases (normal, obstructive, restrictive, and mixed). Hakan et al. [
17] utilized five PFT parameters to classify their samples into three cases, achieving 98.7% accuracy. Moreover, Badnjevic et al. [
13] built a hybrid system using an MLP neural network and fuzzy algorithm to distinguish three cases (normal, COPD (Chronic Obstructive Pulmonary Disease), and asthma) with 99.5% accuracy, utilizing three PFT parameters and two additional measurements. Spathis and Vlamos achieved 89% accuracy differentiating between COPD and asthma by using 13 PFT parameters in their MLP to obtain 89% classification accuracy [
22]. The expert system developed by Badnjevic et al. [
14] yielded 98.7% correctly classified samples into three classes (normal, COPD, and asthma) with five inputs fed to the ANN. Unlike the others, Loachimescu et al. [
15] suggested new input extracted from the area under the expiratory flow–volume curve (AEX). In addition to the conventional three PFT parameters, they were able to classify a relatively large database of samples into four classes (normal, obstructive, restrictive, and mixed) with 91.6% accuracy. Using ten anthropometric features to predict the most important spirometric parameters using MLP, Kalantary et al. [
16] were able to correctly establish the patient condition (normal or abnormal), obtaining 84.6% prediction accuracy.
According to the American Thoracic Society (ATS) and the European Respiratory Society (ERS) guidelines [
2,
27], respiratory diseases can be categorized into three main categories; these are: obstructive disorders (difficulty to exhale), restrictive disorders (difficulty to inhale), and mixed (both obstructive and restrictive disorders) [
1]. World Health Organization (WHO) statistics in 2016 revealed that COPD was considered the third world biggest threat after heart diseases and strokes, while lower respiratory infections occupied fourth place [
28].
In this study, we assessed the practicability of using the entire respiratory parameters (i.e., 23 features), which are recommended by ATS and ERS in the diagnosis of PFT exams, as inputs to an MLP neural network [
29]. In addition, many back-propagation algorithms were used and evaluated and, eventually, compared in this work. To the best of our knowledge, this study has not been investigated. Successfully, our experiment has resulted in up to 99% and 92% accuracy on training and testing sets, respectively. Many standard statistical metrics were utilized for outcome evaluations, including accuracy, sensitivity, specificity, positive predictive value, negative predictive value, and area under the receiver operating characteristic curve.
Additionally, the ANN epoch and the learning rate were recorded. The results were compared with the PFT built-in program, which is often used as a suggestion or a prediction to PFT diagnosis. The suggested PFT medical support system was also compared with similar attempts in the literature.
2. Materials and Methods
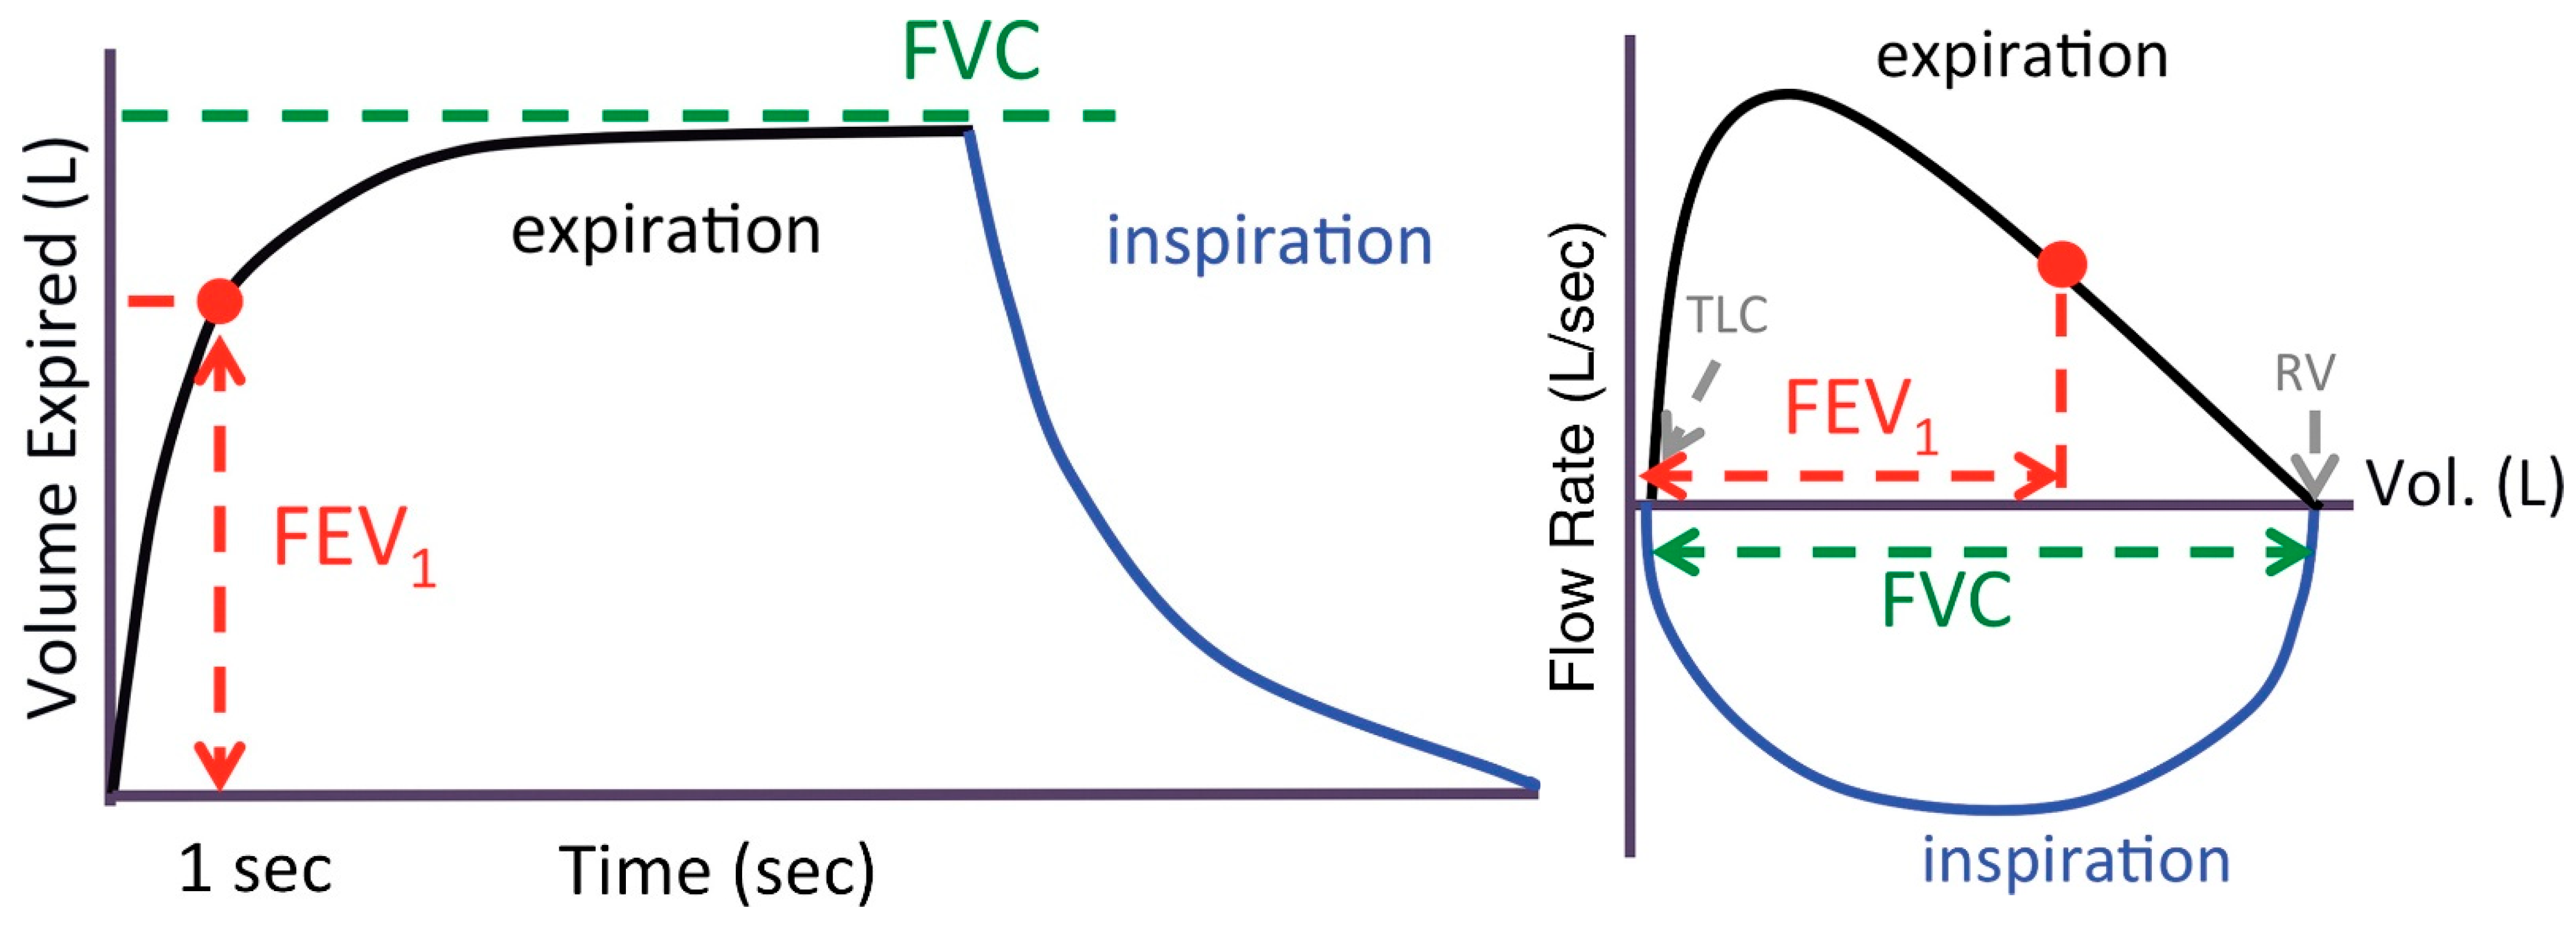
Figure 1 illustrates the flow–volume and volume–time curves obtained from the PFT exam. Based on these curves, the PFT machine usually generates a set of respiratory parameters called spirometric measurements/parameters [
30]. The major parameters are: Forced Expiratory Volume (FEV1), Forced Vital Capacity (FVC), ratio FEV1/FVC (briefly FEV1%), Forced Expiratory Flow (FEF), Peak Expiratory Flow (PEF), and Maximum Expiratory Flow (MEF). Other parameters are acquired at different time intervals, such as FEV1, which indicate the forced expiratory volume during the first second, or at different percentages such as MEF25%, which indicates 25% maximum expiratory flow at 75% of FVC [
2,
27].
Table 1 shows the full set of the 23 respiratory parameters specified by ATS and ERS [
2,
27]. Usually, those parameters are classified as either the essential respiratory ones (Group 1) or the secondary respiratory parameters (Group 3). Instead, Group 2 in
Table 1 illustrates the patient anthropometric characteristics, including age, weight, height, sex, and smoking/nonsmoking. In total, a set of 23 PFT features are usually recorded in the PFT machine according to ERS/ATS recommendations. The pulmonologists observe these PFT parameters in comparison to deduce diagnosis.
The PFT device is usually supplied with built-in diagnostic software, suggesting suspicion of the presence of respiratory disorders. In this experiment, the PFT software was designed by COSMED Cardiopulmonary Diagnostics, Italy [
31]. It suggests the diagnosis of the patient’s status, namely “normal” or “abnormal” with the suspicion of obstructive, restrictive, or mixed conditions. The software employs an IF/THEN program based on the comparison between the recorded and typical values. The software utilizes the ATS/ERS standard respiratory parameters (
Table 1).
We collected 201 retrospective PFT examinations from a pulmonary function device (Quark PFT device, manufactured by COSMED Cardiopulmonary Diagnostics, Pavona RM, Italy [
31]) in a university hospital archive relating to a recent three-year period (just before the SARS-CoV-2 pandemic). Personal information was removed, so they became anonymous medical records. For every PFT exam, we had the pulmonologist’s diagnostic decision of whether the patient condition was normal or suspicion of restrictive, obstructive, or mixed disorders. There were 103 normal cases (51%), 74 obstructive (37%), 14 restrictive (7%), and 10 mixed (5%) cases. Based on the 75–25% strategy, the 201 samples were randomly divided into training and test sets. It is worth mentioning that a bigger dataset of 381 samples with 13 features was also tested and evaluated (results not shown), but it did not outperform the 201 dataset with 23 features. Thus, the latter (with 201 samples) was only considered in this work. Additionally, the 201 dataset was filtered carefully from a larger dataset (consisting of about 1000 samples), and only samples that followed the ATS/ERS standards and were certified by the pulmonologists were included.
Table 2 illustrates the distribution of the 201 samples in the experimental dataset. All experiments were tested and evaluated in a MATLAB environment program version R2017b (Math Works. Inc., Natick, MA, USA), utilizing its artificial neural network library [
32].
Even though the used dataset is relatively small compared with other works in the literature, it is certified and confinable. Instead, other works in the literature had a bigger dataset, but this was not enough to improve the accuracy. In other words, not only the quantity of the samples matters but also the quality (i.e., a variability that means distinct samples covering a wide range of the input space).
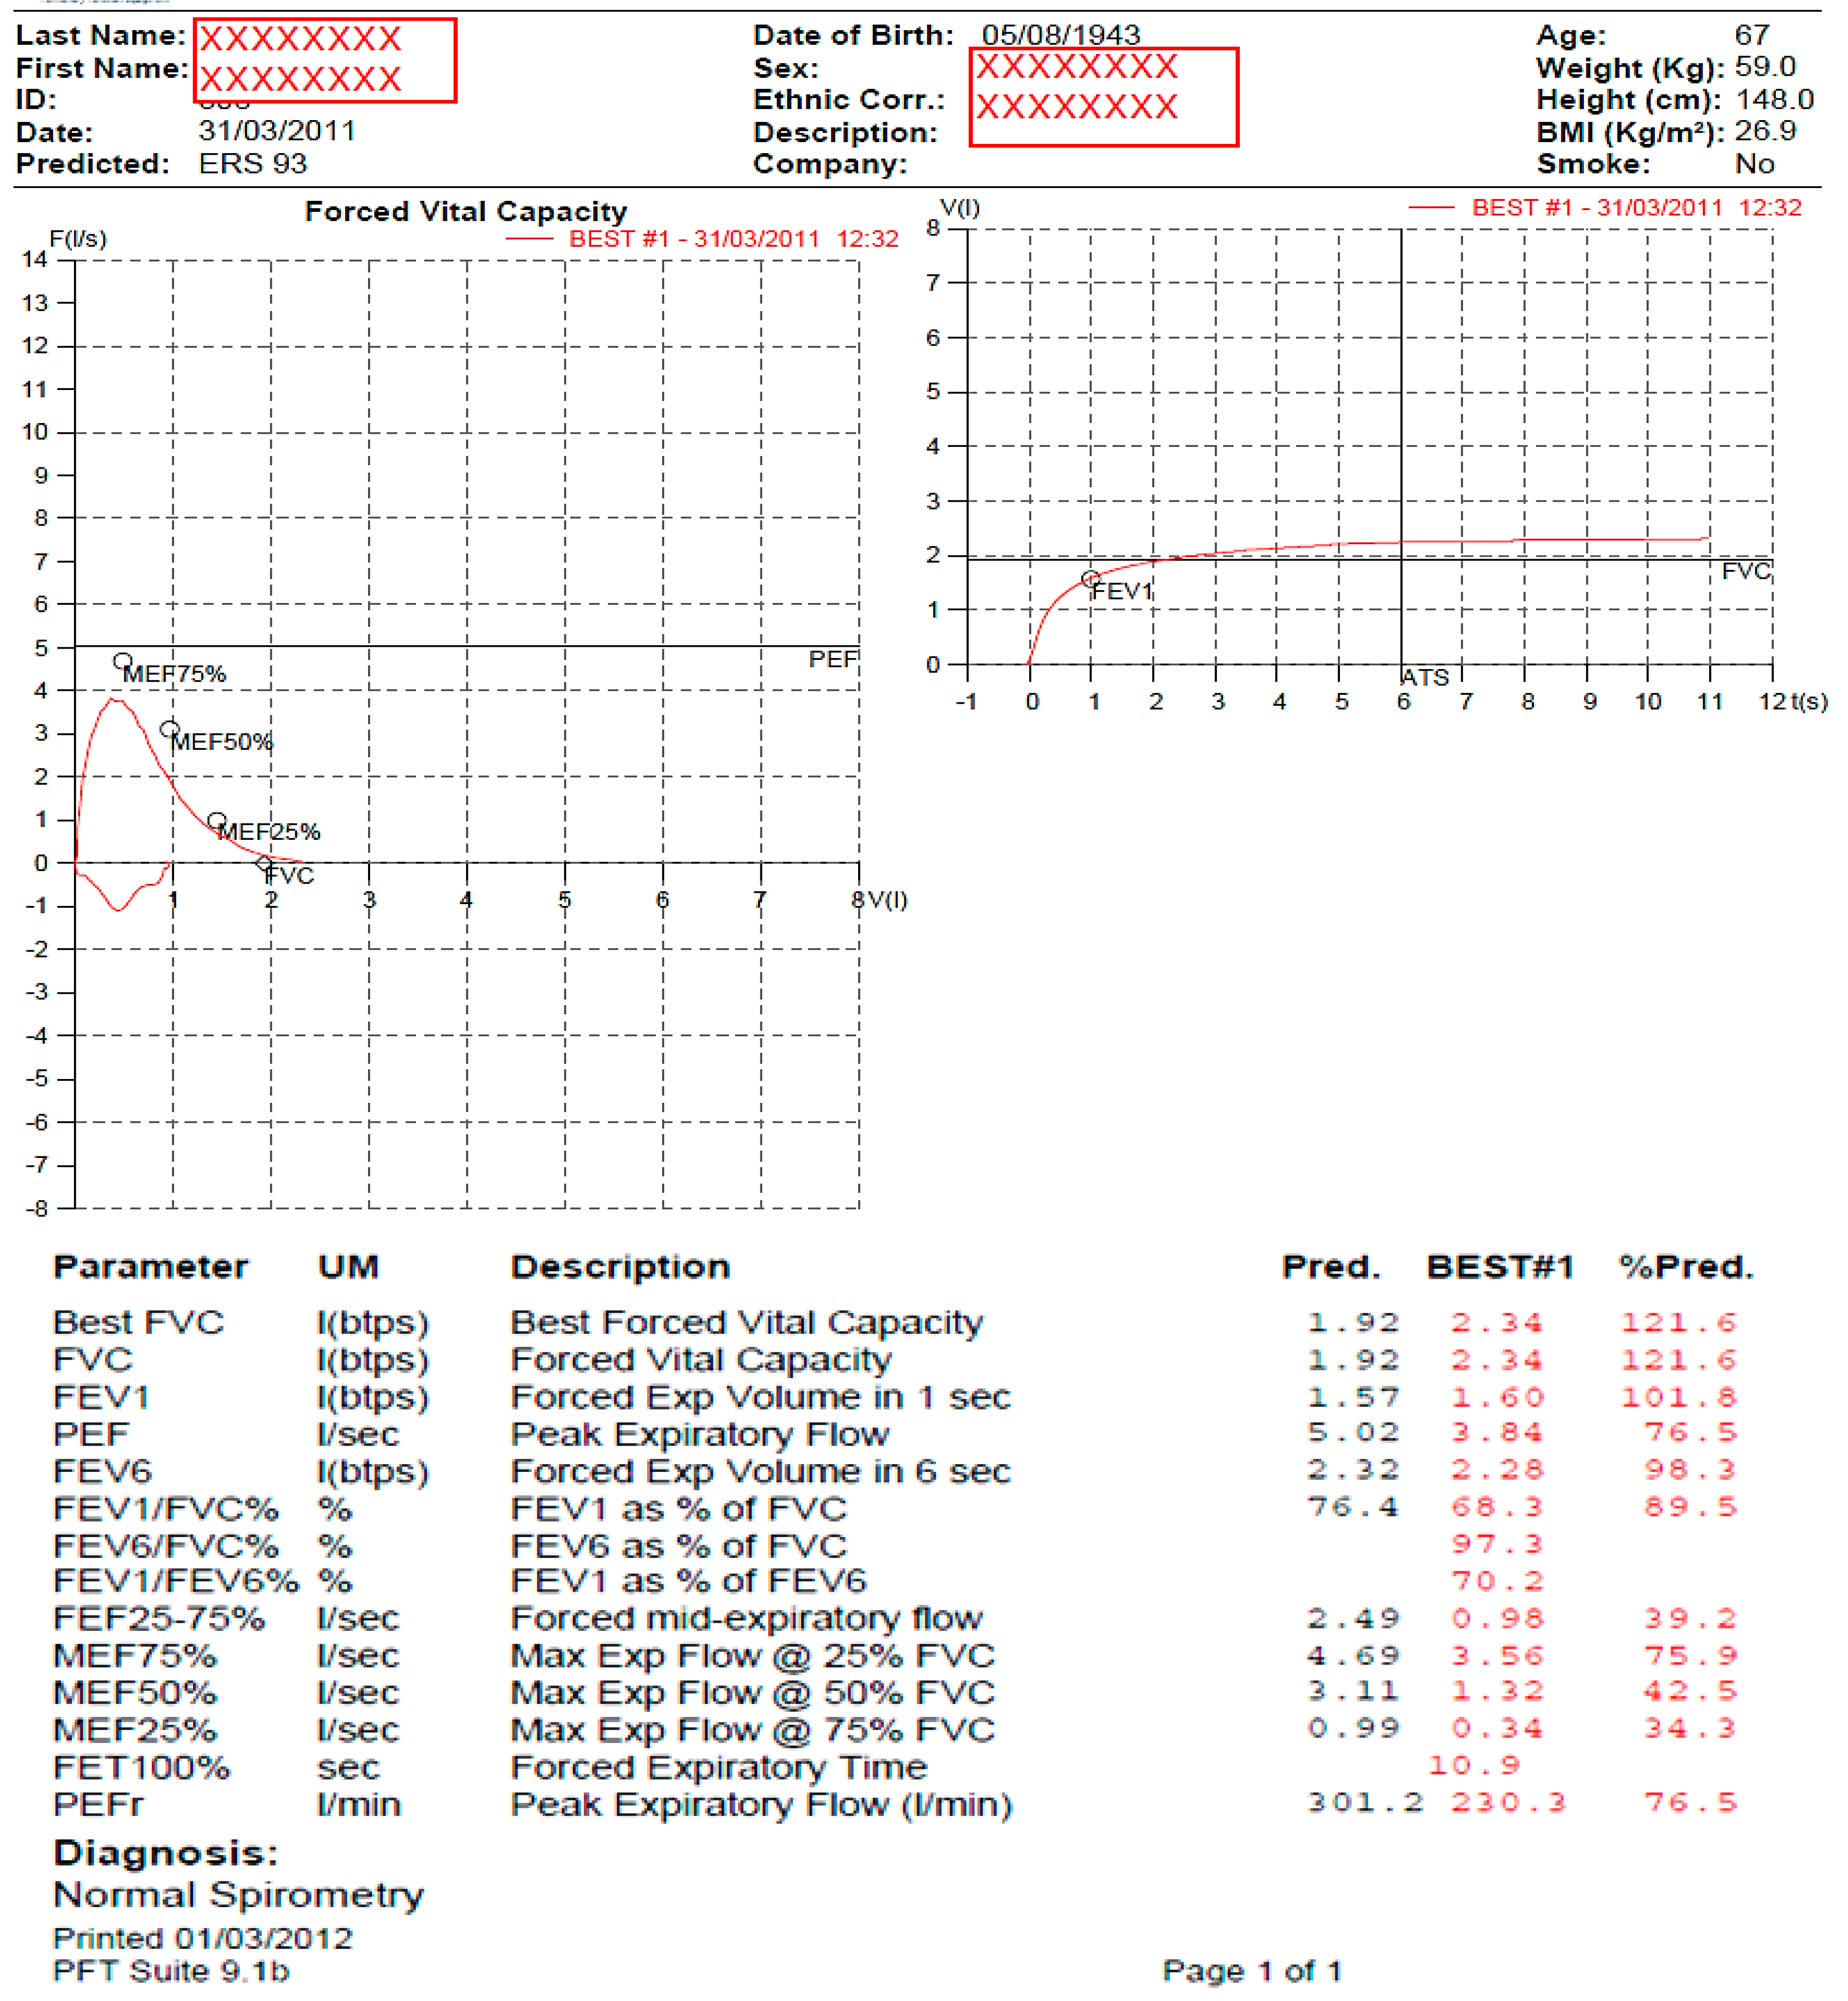
Figure 2 illustrates a sample from the 201 Pulmonary Function Test (PFT) exams that have been analyzed in this research work. It shows the anthropometric characteristics of the patient (at the top of
Figure 2), the flow–volume curve as “Forced Vital Capacity (FVC)” (on the left center), the volume–time curve as “Forced Expiratory Volume (FEV)” (on the right center), and the summary report (at the bottom of
Figure 2) as a table for the 13 respiratory parameters that are usually calculated from these two curves. In this summary report, the predicted values (Pred.) of each PFT parameter are estimated according to the patient anthropometric characteristics (4th column). Instead, the actual measurement of the PFT parameter (“BEST#1”) and its percentage (“%Pred.”) related to the predicted value are shown in the 5th and 6th columns, respectively.
The final diagnosis suggested by the built-in PFT program is reported at the bottom of the report as “Normal Spirometry”. The MEF75%, MEF50%, MEF25%, FVC, PEF, and FEV1 values, which are reported on the curves, are examples of the respiratory parameters. It is worth mentioning that the patient maneuver, as shown in the volume–time curve, should last for at least 6 s according to the American Thoracic Society (ATS) and the European Respiratory Society (ERS) to obtain reliable results.
Table 3 illustrates the descriptive statistics of all the 201 Pulmonary Function Test (PFT) samples for the 23 PFT parameters. It shows the mean and the standard deviation (SD) of all 23 respiratory parameters, which are recommended by the American Thoracic Society (ATS) and the European Respiratory Society (ERS), for the 201 PFT exams. For the Sex parameter, the number of men and the related percentage were calculated instead of the mean and SD values. Likewise, the number of positive cases of smoking and the related percentage in the database were calculated for the Smoker parameter.
2.1. Spirometer Procedure
All patients were instructed to perform the standard spirometry procedure recommended by the ATS/ERS [
2]. In detail, the patient inhaled rapidly and completely, then exhaled in the mouthpiece (turbine flow meter) forcefully until no more air could be expelled, keeping the nose clip attached and the mouth tightly closed on the mouthpiece. The procedure was repeated until acceptable results were obtained, and the best outcomes were stored for further analysis.
2.2. MLP Neural Network
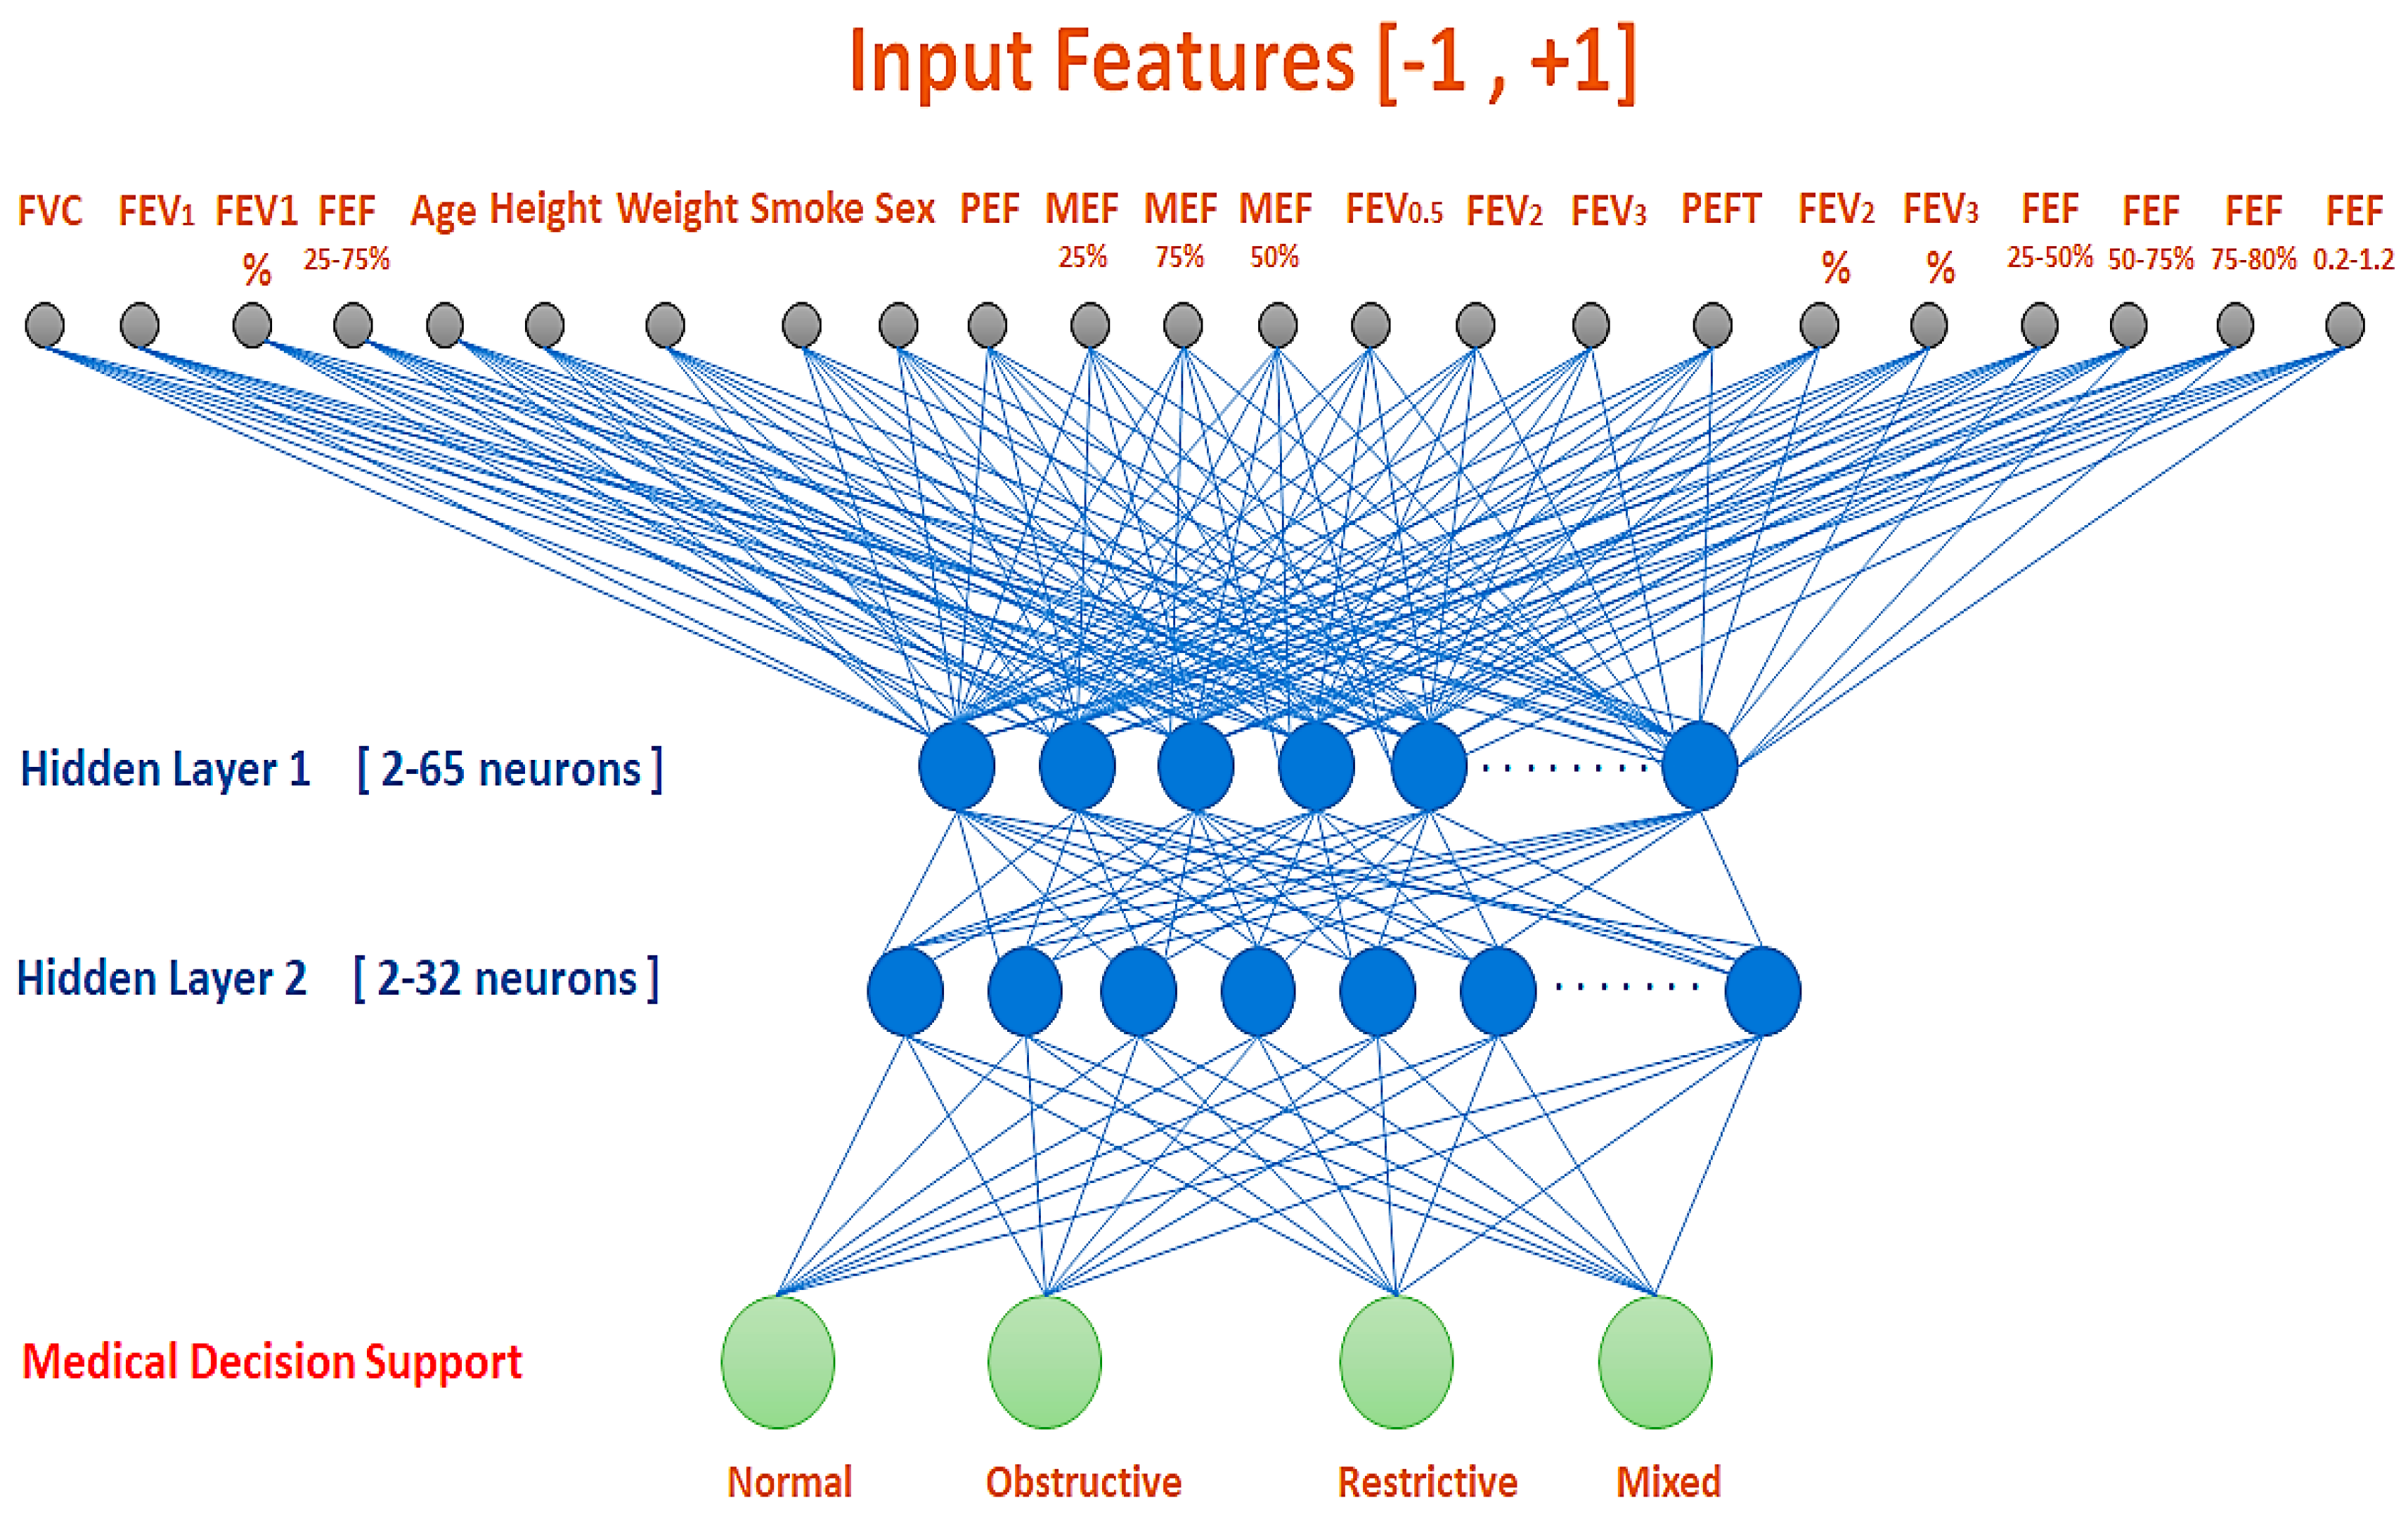
The experiment employed the Multi-Layer Perceptron Neural Network (MLPNN or MLP for short) with a back-propagation (BP) algorithm [
5,
32], as shown in
Figure 3, also known as a fully connected feed-forward back-propagation neural network. This MLP is basically made up of an input layer, an output layer, and at least one hidden layer. Each layer consists of a high number of neurons, based on the layer location and ruled by essential constraints. For example, the number of neurons in the input layer should be determined by the number of sample features, which are the 23 features in this experiment. The number of neurons in the output layer is ruled by the number of decisions that the ANN will classify (e.g., normal, obstructive, restrictive, and mixed). Whereas, for hidden layers, the at least maximum number of neurons can be calculated according to Equation (1) explained by Stathakis et al. [
33,
34,
35], where “
N” is the number of distinct samples and “
m” is the number of output neurons. Selecting higher limits than what theoretically can be calculated from Equation (1) would guarantee the optimum combination of neurons during training [
35]. The number of neurons in the hidden layers was varied during the training tryouts (searching for the optimum performance) from 2 to 65 in the first and from 2 to 32 in the second for each individual back-propagation algorithm [
33]. Thus, 32 × 65 = 2080 structures of NNs were constructed/trained and then evaluated for each algorithm. The optimum number of neurons was determined after several variations until the ANN yielded a minimum error (i.e., highest performance) [
5,
32].
The MLP architecture was initially tested several times by changing the normalization scale of the input data (e.g., [−1, +1] and [0, +1]), the type of activation function, and the number of hidden layers (e.g., 1 or 2 layers). After these preliminary tryouts, the best performance was achieved by employing a [−1, +1] normalization scale and two hidden layers. A single hidden-layer neural network may be sufficient in any decision support system, but a complex activation function should be used [
36]. The second hidden layer is important to compensate for any loss in network performance [
34,
35,
36]. Thus, we utilized two hidden layers. Increasing the hidden layers would require an increment in time and processing capacity. Then, the nonlinear symmetric sigmoidal activation functions were implemented in all neurons of the input, hidden, and output layers. This function was preferred because they achieved the best performance during the preliminary tryouts. The early stopping criterion was employed; namely, the training immediately stops once the validation error starts to increase [
32]. Finally, the proposed MLP architecture (
Figure 3) was trained and then tested for all the 13 possible BP algorithms to validate the research work objective, namely the investigation of the validity of using all 23 ARS and ETS PFT parameters to design a PFT medical decision support system. The planned MLP PFT medical decision support architecture is illustrated in
Figure 3.
2.3. Measures of Classification Performance
There are well-established statistical metrics for assessing the classification performance of medical decision support systems [
37]. In our research work, we employed six different statistics parameters [
37,
38]; these are: the classification accuracy, sensitivity, and specificity. Additionally, the positive predicted value (
PPV) and negative predicted value (
NPV) are other statistical indicators. Equations (2)–(7) explain these metrics, considering that
TP,
TN,
FP, and
FN represent the true positive, true negative, false positive, and false negative cases, respectively. The variations in sensitivity versus specificity generate the receiver operating characteristics (
ROC) curve, which is another statistical indicator for the ANN classification performance resulting in another indicator, the area under the curve (
AUC) (Equation (7)). Further ANN model statistical indicators could have been utilized, such as those reported in Ref. [
16]. However, Equations (2)–(7) are commonly used in assessing the classification performance of the ANN bioinformatics applications [
37,
38,
39]. It is important to note that many performance metrics (namely sensitivity, specificity, positive predictive value, negative predictive value,
ROC, and area under
ROC), besides the accuracy, were used to evaluate the classification outcomes well in a reliable and consistent manner, taking into consideration the imbalanced classes in the ANN output [
40]. Using different measures of accuracy helps to reveal blind spots, to avoid misleading evaluation, and to provide many accurate outcomes [
41]. In addition, as the other metrics have provided high percentages, the classifier’s performance was considered reliable.
3. Results
Several experiments that we have already done, using fewer parameters (e.g., 13 features/inputs) with the same strategy explained in
Section 2.2, resulted in worse accuracies than using the same number of samples with 23 features/inputs. Thus, we concluded that the dataset with more features outperformed the one with fewer features, remembering that all 23 features were recommended by the international standards (ATS/ERS) for diagnosis. After fixing the number of features, we started many further experiments to determine other hyperparameters related to the neural network (NN), which is the central focus of this research work (several training algorithms).
In the first experiment, the 23 spirometer measurements from all training samples in
Table 2 were fed to the proposed MLP architecture shown in
Figure 3. The mean and SD of the values of all parameters are shown in
Table 3. After training, the MLP was evaluated on samples in the test set. The classification accuracy was reported on both the training and test sets for each BP algorithm.
Table 4 reports the obtained results and the optimum number of neurons in the hidden layers, the epoch, and the learning rate.
Table 4 demonstrates that the fixed number of neurons in each hidden layer corresponds with the best results obtained after training and parameter tuning. Thus, no encoder/decoder structure of the recurrent neural network was needed; instead, we used a fully connected feed-forward back-propagation neural network or Multilayer Perceptron Neural Network (MLP).
To carry on the experiments, we preferred six BP algorithms from the 13 BP detailed in
Table 4. The CGB was selected because it led to the highest accuracy (i.e., 97% and 92% accuracy on the training and test sets, respectively) among the four possible Conjugate Gradient (CG) algorithms, the CGS, CGP, CGB, and CGF. The LM algorithm was often reported in the literature [
7,
8,
9,
10,
11,
12,
13,
14,
15], so it was particularly considered; it yielded the highest accuracy (i.e., 99%) on the training set. The BR, RBP, and the OSS were selected because they performed high accuracy on both the training and the test sets. Finally, the GDA was preferred because it yielded to the best accuracy among the three Gradient Descent (GD) algorithms, the GDX, GDA, and GD-1. All these BP algorithms are highlighted in
Table 4. Subsequently, in the second experiment, we evaluated the MLP performance for the selected six BP algorithms in terms of sensitivity, specificity, PPV, NPV, and AUC. This objective was achieved on the test set samples by comparing the MLP decision with the clinical decision (i.e., the pulmonologist’s diagnostic decision about patient condition).
Table 5 illustrates the obtained results.
Finally, the third experiment reported the MLP’s accuracy of the selected six BP algorithms in terms of each MLP’s output (i.e., the decision whether the PFT was normal, obstructive, restrictive, or mixed). This experiment was attained on all samples and the training and test sets (i.e., the 201 samples in
Table 2). Consequently, the MLP’s accuracy was possibly compared with the PFT IF/THEN program’s accuracy, which was in the same manner estimated from the 201 samples.
Figure 4 demonstrates the results; the PFT device outputs are represented by green bars while the MLP outputs are represented by different colored bars.
4. Results Discussion
Table 4 illustrates the MLP’s classification accuracy of all 13 BP algorithms. The number of epochs was less than 60 for LM, BR, RBO, all CG, and OSS algorithms, whereas it was higher than 100 epochs for all GD, SOIT, and BT algorithms. The learning rate (LR) was equal to or less than 0.01 for all algorithms except BR, GDX, and GDA. The number of epochs was impossible for SOIT and BT because their structure does not utilize the stopping criteria or LR values. All MLP BP algorithms with the various architectures of numbers of neurons succeeded in yielding 92% to 99% accuracy on the training set and 87% to 92% accuracy on the test set. Therefore, these results sustain this paper’s question statement (i.e., hypothesis) that the 23 respiratory parameters from ERS/ATS can successfully operate a PFT medical decision support system. This one is the first finding in this research paper.
Table 5 demonstrates the statistical performances of the preferred six BP algorithms on the test set. They resulted in 54 to 81% sensitivity, 92 to 94% specificity, 50 to 73% PPV, 91 to 93 NPV, and 88 to 94 AUC. On the one hand, these results revealed that the different BPs yielded different performance values. That is, a BP algorithm can outperform other BP algorithms in terms of one measure (e.g., accuracy), but it may underperform other BP algorithms (e.g., sensitivity). This result may be attributed to the low number of samples in the test set (50 PFT exams); this concept will be further discussed in the next paragraph. On the other hand, these results further support this paper’s hypothesis that the 23 ERS/ATS standard respiratory parameters can be utilized satisfactorily in a PFT medical decision support system.
Figure 4 illustrates the second finding of this paper. It shows that the performance of an operating MLP BP algorithm is not necessarily the same for all outputs (decisions). For example, the LM resulted in approximately 95% accuracy on normal samples, while it yielded 95%, 98%, and 99% in classifying obstructive, restrictive, and mixed disorders, respectively. This marginal disparity occurred in all BP algorithms, the RB, BRP, CGB, OSS, and GDA. Consequently, as we mentioned in the previous section, a BP may exceed other BP algorithms in classifying one output (e.g., normal), but it may go beyond other BP algorithms for other decisions (e.g., restrictive disease). This means that the six BP algorithm outputs disperse slightly among each other. Therefore, the second finding in this paper is that different BP algorithms for the same type of ANN may yield different performances on different possible medical outputs (i.e., diagnostic decisions). This result can be applied to other medical decision support tasks other than the PFT exam.
Furthermore,
Figure 4 reveals further findings. On the one hand, it indicates that the classification performances from the PFT machine program varied among different medical decisions, similarly to what was noticed from the MLP, as explained in the previous section. On the other hand,
Figure 4 shows that all six MLP BP algorithms can outperform the built-in machine program in classifying the normal, obstructive, and restrictive conditions. However, only the LM, BR, and RBP exceeded the machine program in identifying the mixed condition. Therefore, the third finding in this paper is that by providing 23 ATS/ERS respiratory parameters as inputs to ANN, an MLP neural network could generate better performance than the PFT machine’s diagnostic software. This finding was not similarly addressed in the literature. For instance, the LM algorithm exceeded the performance of the machine program by 6%, 5%, 9%, and 3% for classifying normal, obstructive, restrictive, and mixed cases, respectively. This result corresponds to a 6% average increment in classifying PFT cases. It is attributed to the capabilities of any ANN to analyze sophisticated nonlinear data; the matter is not feasible by an IF/THEN program.
Since the LM, BR, and RBP outperform the built-in machine program in classifying all PFT diagnosis decisions, including the mixed cases, they were utilized to plot the ROC curves, which is the comprehensive statistical parameter to observe any medical decision support capabilities. A ROC curve plots variations in sensitivity and specificity due to applying different threshold values in classifying outputs.
Figure 5 shows the resulting ROC curves.
Table 6 shows results from some attempts presented in the literature. Regarding the number of samples, the report by Loachimescu et al. [
15] utilized more than 15,000 PFT exams (i.e., patients). They utilized three respiratory features and a signal processing feature (i.e., the area under the expiratory flow–volume curve in
Figure 1). They reported 83.5% and 91.6% accuracy, utilizing three and four features, respectively, to classify the same four respiratory cases (i.e., normal, obstructive, restrictive, and mixed cases). These results were the most reliable due to the extensive training and test sets. Another study was conducted by Badnjevic et al. [
14], in which more than 5000 PFT exams were utilized. However, they attempted to classify COPD from normal exams only. In addition, Topalovic et al. [
4,
39] trained their system on 1500 samples.
The rest of the scientific papers reported in
Table 6 used an almost similar number of samples as in this paper (i.e., 150 to 500 samples). They reported accuracies between 82 to 99% as the results in
Table 4, but they explored part of the ERS/ATS parameters. Furthermore, they did not classify their samples into all four cases (four outputs) except for the work by Jafari et al. [
12] and Topalovic et al. [
4,
39]. Jafari et al. utilized fitting coefficients of the processed signal and the four ERS/ATS parameters, whereas Topalovic et al. used about 21 PFT parameters and classified their samples into eight cases.
In terms of the type and number of input features (i.e., PFT parameters), most reports only explored the essential respiratory parameters (Group 1 in
Table 1). However, except for the study made by Topalovic et al. [
4,
39], no reports had tested all 23 parameters, including the secondary respiratory parameters and the patient’s anthropometric characteristics (Groups 2 and 3 in
Table 1), as in this paper. Kalantary et al. [
16] tested ten anthropometric parameters in the MLP decision support system (DSS) to discern normal from abnormal 130 PFT examinations. The results showed approximately 94% and 85% accuracies on the training and test sets, respectively. In this research work, all 23 features were included as inputs to MLP according to prior knowledge of these features’ importance, which was confirmed by pulmonologists and international standards (ATS/ERS) for diagnosis [
42]. However, specific selection methods of the unsupervised and supervised features could be implemented to investigate the significance of these features individually and combined [
42,
43]. While the unsupervised methods do not depend on the classification targets, and information loss might occur, the supervised methods suffer from multicollinearity and independency issues [
42]. Therefore, feature selection methods were not utilized here to avoid any loss of valuable information, to accelerate the training process computationally, and to focus on MLP tunning parameters and algorithms.
Finally, in terms of the type of ANN technique, some researchers investigated MLP alone [
11,
12,
14,
15,
16] or with other ANNs [
4,
7,
13], as reported in
Table 6. It seems that MLP is a successful ANN choice, since it yielded encouraging performances, comparable with the results obtained in this experiment (
Table 4 and
Table 5). However, other ANNs were also investigated, as in the references [
4,
6,
10,
21,
22,
24] reported in
Table 6, leading to a range of accuracies as those obtained by the MLP neural network.
For example, Spathis and Vlamos [
22] investigated machine learning techniques such as Naïve Bayes (NB), Logistic Regression (LogR), Neural Network (NN), Support Vector Machine (SVM), K-Nearest Neighbor (KNN), Decision Tree (DT), and Random Forest Classifier (RFC) to classify 132 PFT samples into two medical respiratory conditions, the COPD, and asthma. In contrast, Iadanza et al. [
10] evaluated three models to design automatic learning techniques to classify 414 PFT samples into three levels of COPD severity, utilizing the Radial Basis Neural Network (RBNN), SVM, and C5.0, which is an automatic classifier function from the IBM SPSS Modeler capable of selecting the most suitable classification algorithm for any given data. Bodduluri et al. [
24] attempted to use a deep-learning model (i.e., Fully Convolutional Network (FCN)) and RFC, employing PFT flow–volume curves of nearly 9000 samples. The latter three studies [
10,
22,
24] recorded 78–94.5% accuracies, which overlap with records utilizing MLPs [
7,
11,
12,
13,
14,
15,
16] in
Table 6, alongside the results obtained in this paper (as reported in
Table 4).
It is worth mentioning that the number of classes to which the artificial intelligence (AI) technique will classify is determinant to the complexity of the modeled relationship input–output classes. Topalovic et al. [
4,
39] were the first to classify their samples into eight different cases (categories), making the classification task for machine learning even harder to achieve. Those eight cases are asthma, COPD, other obstructive diseases (OBD), neuromuscular disorder (NMD), thoracic deformity (TD), interstitial lung disease (ILD), pulmonary vascular disease (PVD), and normal condition.
As observed from the specific eight cases (which contain the four previous ones used in our study) the complexity to distinguish between these classes is relatively higher than that of fewer classes (e.g., four cases). That is why the classification accuracy reported in this study was relatively lower than that of other studies with fewer output classes (≤4). Furthermore, Topalovic et al. used very extensive examinations, such as the diffusing capacity of the lung for carbon monoxide, to obtain more parameters and support the pulmonologist’s decision.
It is also of importance to highlight that the reports in
Table 6 have differences in the terms of the ANN specifications (i.e., ANN architecture). Possible specifications, but not limited to, are the number of hidden layers, number of neurons, type of activation function, and the normalization scale of the input data. The distribution of the PFT samples, whether they cover the entire input space or not, also has an important role in enriching the learning process. They all affect the performance of any AI medical decision system. These AI specifications were not reflected in comparison with the literature because this is beyond the purpose of this research work.
However, it is important to indicate that other MLP architecture specifications may further optimize or refine the results; one of which is the assessment of different activation functions that govern ANN outputs. Another factor is the repetition of the experiment using several iterations of the random 75–25% splitting protocol of the dataset, which would ascertain ANN’s performance. Increasing the number of hidden layers is another impact in ANN science; this might improve the classification performance, but it would also increase the training time and the computer capacity requirements. To end, increasing the number of PFT samples, as in reports by Loachimescu et al. [
15] and Badnjevic et al. [
14], would finalize the merits of using the 23 ERS/ATS respiratory parameters as inputs to the PFT medical decision support system.


