Article

Relationship between the Expression of CHK2 and p53 in Tumor Tissue and the Course of Papillary Thyroid Cancer in Patients with CHEK2 Germline Mutations

1
Collegium Medicum, Jan Kochanowski University, 25-317 Kielce, Poland
2
Endocrinology Clinic, Holycross Cancer Centre, S. Artwińskiego St. 3, 25-734 Kielce, Poland
3
Department of Molecular Diagnostics, Holycross Cancer Centre, S. Artwińskiego Str. 3, 25-734 Kielce, Poland
4
Division of Medical Biology, Institute of Biology, Jan Kochanowski University, Uniwersytecka 7, 25-406 Kielce, Poland
5
Surgical Pathology, Holycross Cancer Centre, S. Artwińskiego Str. 3, 25-734 Kielce, Poland
6
Department of Epidemiology and Cancer Control, Holycross Cancer Center S. Artwińskiego St. 3, 25-734 Kielce, Poland
7
Genetic Clinic, Holycross Cancer Centre, 25-734 Kielce, Poland
8
Department of Radiology, Holycross Cancer Centre, S. Artwińskiego Str. 3, 25-734 Kielce, Poland
9
Clinical Oncology, Holycross Cancer Centre, S. Artwińskiego Str. 3, 25-734 Kielce, Poland
*
Author to whom correspondence should be addressed.
Cancers 2024, 16(4), 815; https://doi.org/10.3390/cancers16040815
Submission received: 28 December 2023 / Revised: 6 February 2024 / Accepted: 10 February 2024 / Published: 17 February 2024
(This article belongs to the Special Issue Thyroid Cancer: Diagnosis, Prognosis and Treatment)

Abstract

:

Simple Summary

CHK2 has functions in DNA damage repair. Germline CHEK2 mutations impair these functions, increasing the risk of PTC. The aim of this study was to determine whether CHK2 and p53 expression in patients with a germline CHEK2 mutation in tumor tissue can serve as a prognostic marker for papillary thyroid cancer (PTC), and whether copy number aberrations in CHEK2 and TP53 correlate with the course of PTC. This study included 156 patients with PTC who had been selected from a group of 1547 people previously tested for the presence of CHEK2 mutations in their peripheral blood. Higher CHK2 expression was associated with poorer treatment responses and disease outcomes in PTC patients. Higher CHK2 expression and positive p53 together with a TP53 deletion could have potential as a prognostic marker of unfavorable disease outcomes in patients with germline truncating mutations in CHEK2.

Abstract

The aim of this study was to determine whether the expression of CHK2 and p53 in tumor tissue in carriers of germline CHEK2 mutations can serve as a prognostic marker for PTC, and whether CHEK2 and TP53 copy numbers correlates with the course of PTC disease. This study included 156 PTC patients previously tested for the presence of CHEK2. Clinicopathological features, treatment response, disease outcome, and germline mutation status of the CHEK2 gene were assessed with respect to CHK2 and p53 expression, and CHEK2 and TP53 gene copy statuses. In patients with and without a germline mutation in CHEK2 and with higher CHK2 expression, the chances of an excellent treatment response and no evidence of disease were lower than in patients without or with lower CHK2 expression. TP53 deletion was associated with angioinvasion. In patients with a truncating mutation, the chance of a CHEK2 deletion was higher than in patients with WT CHEK2 alone or those with WT CHEK2 and with the missense I157T mutation. Higher CHK2 expression was associated with poorer treatment responses and disease outcomes. Higher CHK2 expression and positive p53 together with a TP53 deletion could be a prognostic marker of unfavorable disease outcomes in patients with germline truncating mutations in CHEK2.

Graphical Abstract

1. Introduction

In recent years, there has been a steady increase in the incidence of papillary thyroid cancer (PTC) worldwide, mainly due to improved diagnostic technologies and increased awareness of screening tests. Most new cases are cancers at a low clinical stage [1,2,3]. PTC currently has an excellent prognosis [4]. However, in some patients, PTC can lead to metastases and death of the patient. The mortality of patients with differentiated thyroid cancer is approximately 1–2% [5]. The molecular mechanisms determining this mortality are still largely unknown. Thus, it is extremely important to identify molecular markers not only in tumor tissue after surgery but, more importantly, in peripheral blood before surgery to select for patients in need of aggressive treatment. Mutations in DNA repair pathway genes (ATM/CHK2/p53) represent one potential source of markers. The checkpoint kinase 2 gene (CHEK2) is involved in DNA repair and is activated by DNA damage, especially double-strand breaks. It is also a tumor suppressor gene. It is located on the long arm of human chromosome 22 at position q12.1 and encodes a protein (CHK2, checkpoint kinase 2) with serine-threonine kinase activity. CHK2 regulates the cell cycle and prevents uncontrolled cell division. In response to a double-stranded DNA break, the serine- threonine kinase ATM (ataxia-telangiectasia mutated gene) is activated and phosphorylates and activates CHK2, which then phosphorylates proteins involved in the DNA damage response, such as p53, Cdc25A, Cdc25C, and BRCA1, which leads to cell cycle arrest in the G1, S, and G2 phases and initiation of DNA damage repair. However, if the DNA damage is irreparable, the cells undergo cell death in a process termed apoptosis. These observations suggest that CHK2 is regulated at sites of double-stranded DNA breaks and plays an important role in the DNA damage response. Therefore, an efficient signaling ATM/CHK2/p53 pathway is essential for the coordination of DNA repair, cell cycle progression, and apoptosis in response to DNA damage [6,7,8].
Mutations in the genes encoding DNA repair proteins may affect their stability and activity, which can lead to the development of cancer. Carriers of mutations in genes encoding tumor suppressor proteins, such as CHK2 and p53, are genetically predisposed to certain cancers. The expression of DNA repair pathway genes is increased in patients with malignant tumors, and this is associated with unfavorable disease outcomes in these patients. DNA repair pathway genes are also expressed at significantly higher levels in patients with melanoma metastases, suggesting that CHK2 may also mediate tumor progression [9]. A study by Zhao et al. reported that high CHK2 expression may be associated with PTC progression [10]. Increased CHK expression is also observed in most cases of diffuse large B-cell lymphoma (DLBCL), bladder cancer, and ovarian cancer, and is associated with poor clinical courses in these patients [11,12,13].
Like the CHEK2 gene, the tumor suppressor gene TP53 is important for maintaining genome integrity. It is referred to as the “guardian of the genome”, not alone because it is involved in the control of cell growth and division [14,15], but also because mutations in this gene commonly occur in a wide range of malignant tumors, suggesting that it suppresses cancer formation [14]. Mutations that functionally impair p53 seriously compromise the cells’ ability to repair DNA and result in apoptosis if the genetic defect is not repaired [16]. TP53 mutations block inhibition of the G1 phase of cell cycle progression and deregulate apoptosis, resulting in the malignant transformation and proliferation of damaged cells [17,18,19].
Germinal CHEK2 truncating mutations (1100delC, IVS2 + 1G > A, del5395) increase the risk of thyroid cancer by approximately 6-fold [20,21], and missense mutations such as I157T increase the risk by about 2–3 fold [20,21,22,23]. According to The Cancer Genome Atlas Research, in addition to hereditary predisposition to the development of PTC, somatic mutations occur in the CHEK2 gene, which may contribute to PTC tumor progression [24].
We have previously shown that CHEK2 truncating mutations, rather than missense mutations, are significantly associated with angioinvasion and an intermediate or high initial risk of recurrent/persistent PTC [21]. However, that study did not assess the expression of CHK2 and p53 in tumor tissues in carriers of CHEK2 germline mutations with PTC.
To learn more about the role of CHK2 and p53 in PTC and determine whether they have potential as diagnostic and prognostic markers of PTC, we measured the expression of the unphosphorylated forms of CHK2 and p53 using immunohistochemistry (IHC) and determined whether their expression levels correlated with disease progression in PTC patients. Furthermore, we used fluorescence in situ hybridization (FISH) to analyze copy number aberrations of CHEK2 and TP53 and determine whether they correlated with disease progression in PTC patients.

2. Materials and Methods
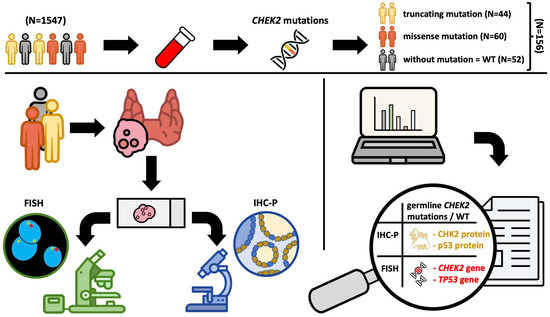
2.1. Patients

The study included 156 PTC patients who were selected from a group of 1547 PTC patients who had previously been tested for the presence of mutations in the CHEK2 gene in DNA isolated from peripheral blood [21]. In 43 of 51 patients from the previous study with a truncating mutation in the CHEK2 gene, it was possible to obtain archival paraffin-embedded blocks containing fixed tissues of the primary tumor for IHC and FISH testing. Seven patients were excluded from the study due to degraded DNA. One patient with a truncating mutation in the CHEK2 gene, who underwent thyroid surgery after 2020, from whom archival blocks were also obtained, was included in the study. A total of 44 patients with a truncating mutation were included in the study. Archival blocks containing fixed tissues of the primary tumor were obtained from 7 out of 7 patients with the I157T homozygous mutation in the CHEK2 gene. Fifty-three of 182 patients with the I157T heterozygous mutation in the CHEK2 gene and 52 of 1307 patients without a mutation in the CHEK2 gene from a previous study were randomly selected according to the procedure described below.

2.2. Description of the Test Procedure

Patients were ordered by medical history number (in ascending order) and each patient was assigned a unique number (between 1 and 1547). Of the patients assigned to the missense mutation group, 53 were randomly selected with the use of a random number generator (R software). Of the patients assigned to the no-mutation group, 52 were randomly selected. Number 182 (the number of all patients in the missense mutation group) was selected as a setting for the random number generator in the statistical software R (open source statistical software [25]) when drawing from the group with missense mutations. The number 1307 (the number of all patients in the no-mutation group) was selected as the random number generator setting when drawing from no-mutation group in the R program.
No additional randomization was performed because it was possible to obtain archival blocks containing fixed tissues of the primary tumor from all randomly selected patients.
All study procedures were approved by the Institutional Review Board of Jan Kochanowski University, Kielce, Poland (approval number: 31/2021). All patients gave written informed consent to participate in the study. All patients were informed about the nature, objectives, and methods of the study. All patients included in the study were Caucasian. Detailed data on CHEK2 germline mutations have been reported previously [26]. Samples of archival paraffin-embedded tumor blocks after thyroid surgery were used for immunohistochemical (IHC) analysis of CHEK2 and p53 expression as well as for analysis of CHEK2 and TP53 gene copy numbers via FISH. Clinicopathological data were available for all analyzed cases and were analyzed retrospectively. All PTCs were graded histopathologically according to the 8th edition of the American Joint Committee on Cancer (AJCC) thyroid cancer staging system (AJCC/Union for International Cancer Control (UICC) TNM staging system and American Thyroid Association (ATA) modified initial risk stratification system (low, intermediate, and high risk of recurrence)) [27,28]. All patients included in the study underwent primary surgical treatment (lobectomy, total thyroidectomy, or total thyroidectomy with central or central and lateral compartment lymphadenectomy). The scope of surgery and surgical procedure have been described previously [29]. Response to therapy was assessed 1 year after initial treatment. Response to initial treatment was classified into four categories: excellent, indeterminate, biochemically incomplete, and structurally incomplete [27]. Response to treatment after thyroidectomy and I-131 radiotherapy was assessed according to Tuttle’s criteria [30], while response to treatment after thyroidectomy without I-131 radiotherapy or lobectomy was assessed according to Momesso’s criteria [31].
All procedures for monitoring the course of the disease after surgery, assessing the response to treatment, and further follow-up, as well as treatment assessment, have been described previously [32,33]. Relapse was defined as the detection of biochemical or structural disease after a period of NED (no evidence of disease at least 12 months after initial therapy) and no symptoms of the disease [27,31].
Clinical observation was completed on 30 November 2022. Patients were classified into one of the following groups based on medical records in accordance with ATA recommendations [27]: NED, indeterminate response, biochemically and structurally chronic disease, deaths from cancer, and deaths from other causes.

2.3. Detection of CHEK2 Mutation

DNA was isolated from whole blood samples (100 µL), collected in EDTA tubes, within 12 h of collection, using the Maxwell® RSC Blood DNA Kit (Promega, Madison, WI, USA). DNA samples were eluted in 120 µL of buffer E. Genotyping and the diagnostic algorithm of molecular tests in our center have been described in detail in our previous work [21,26].

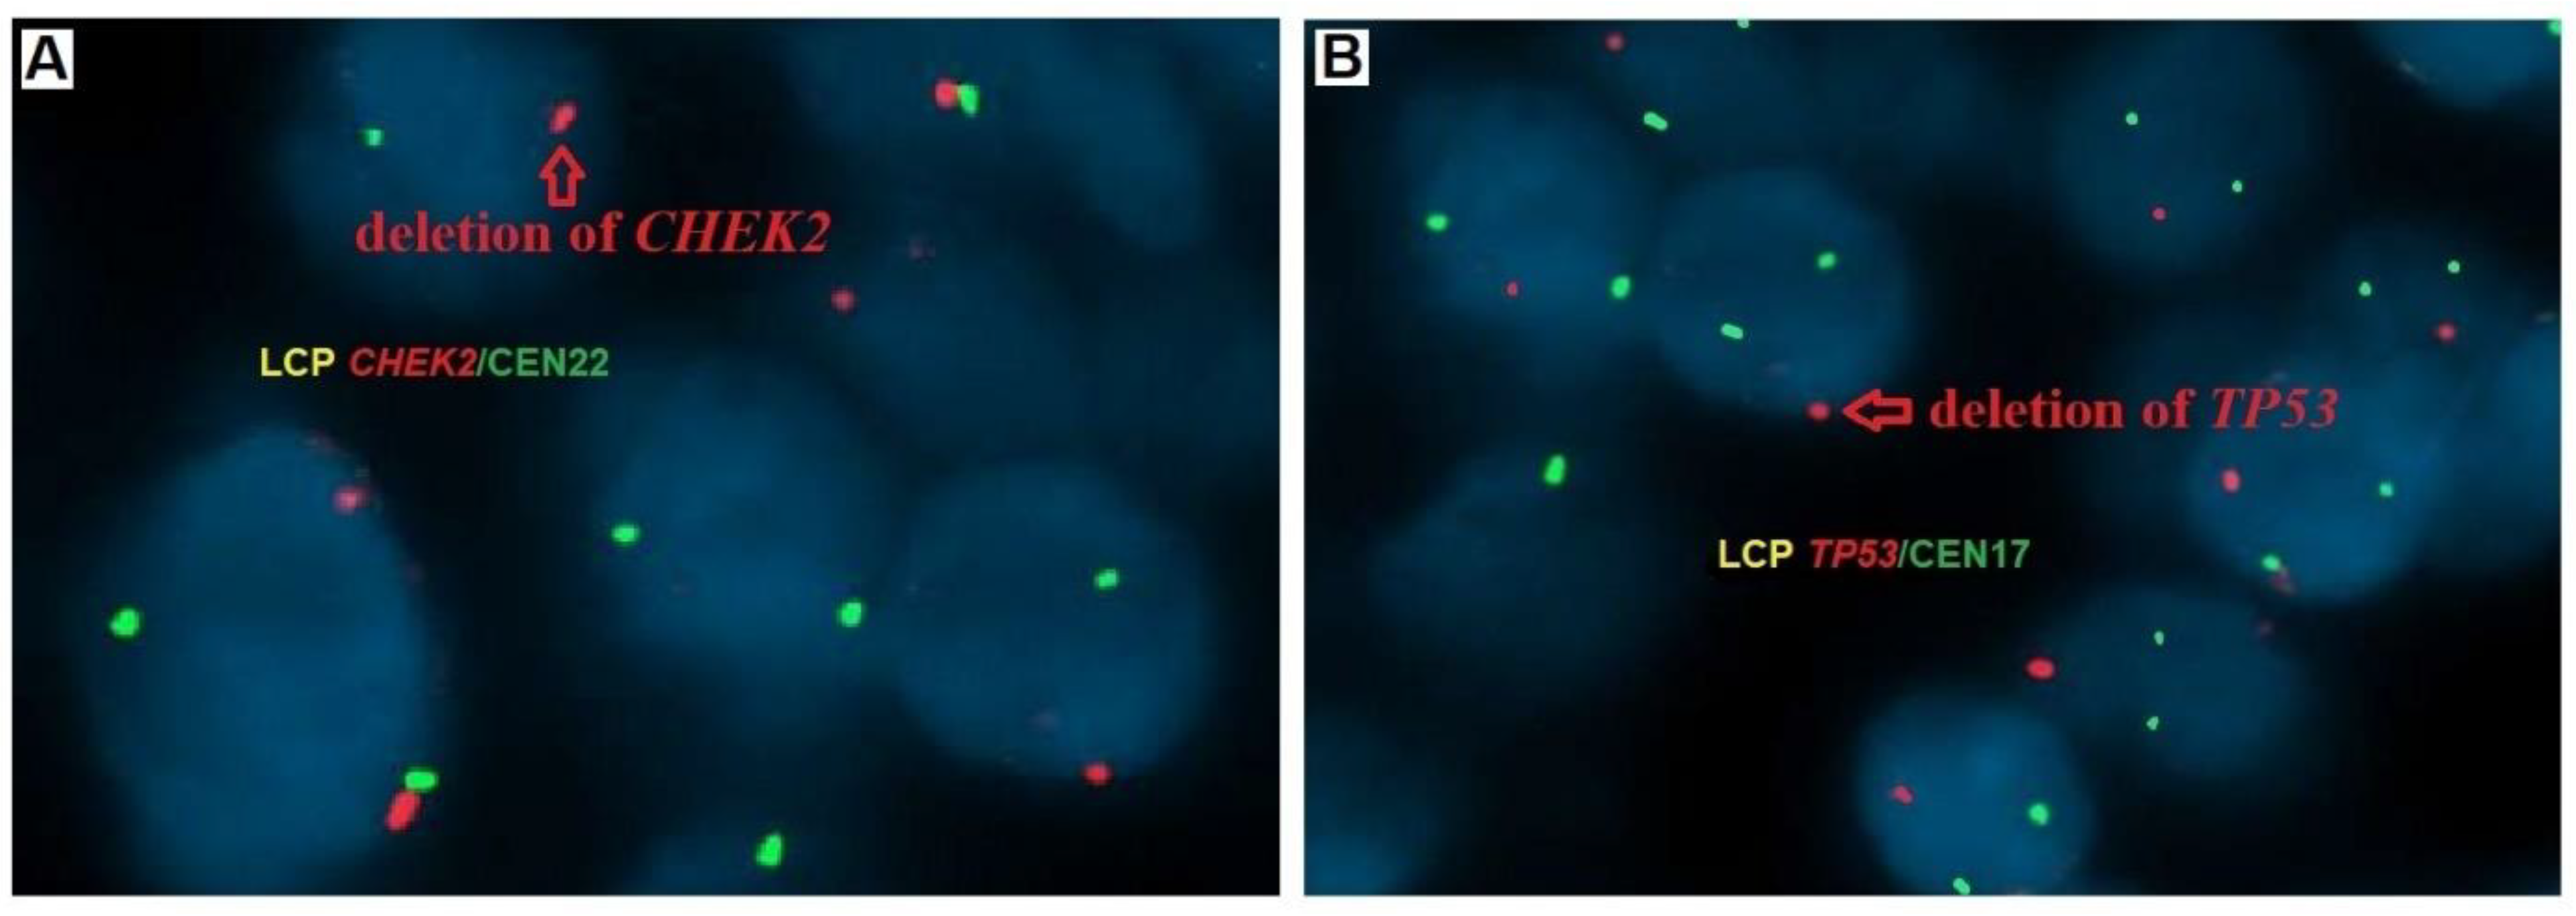
2.4. Fluorescence In Situ Hybridization (FISH)

CHEK2 and TP53 copy number determination via FISH was performed on PTC tissue fixed in 10% buffered formalin and embedded in paraffin. Four-micrometer thick paraffin sections were placed on the positively charged side of an organosilane-coated slide to minimize tissue detachment from the slide during FISH. The sections were baked for 1 h on a hot plate at 56 °C and then subjected to the protocol recommended by the probe manufacturer (CytoTest, Washington, DC, USA).
After incubation overnight, the sections were immersed twice in xylene for 10 min each and then passed through a series of decreasing alcohol concentrations (100%, 96%) for 5 min each. After rinsing twice in purified water for 5 min, the sections were immersed in pretreatment solution at 95 °C for 30 min, passed through washing buffer twice for 5 min each, and then immersed in a protease solution at 37 °C for 30 min. After washing the sections twice in washing buffer, the sections were dried at room temperature. Two probes (10 μL each) were used in parallel: the CHEK2/CCP22 FISH Probe (CytoTest) and the TP53/CCP17 FISH Probe (CytoTest). The sections of the slides were covered with coverslips and sealed with rubber glue. The probe and DNA in the sections were denatured in a ThermoBrite apparatus for 5 min at 75 °C, and then allowed to hybridize at 37 °C overnight. The cover slip was removed and the excess of non-hybridized and non-specifically bound probe was removed by washing the sections twice for 2 min each in post-hybridization washing buffer (2 × SSC/03% NP-40). After drying at room temperature, 10 μL of DAPI Solution was applied to the sections and the sections were covered again with a coverslip. The preparations were stored in a dark place until signal counting.
CHEK2/CCP22 and TP53/CCP17 gene copy numbers were counted in 100 cell nuclei in non-overlapping fields of view containing cancer cells using a fluorescence microscope equipped with a double Orange/Green filter at 100× magnification with oil immersion. Hybridization with the CHEK2/CCP22 probe was confirmed by observing two red signals for the CHEK2 and two green signals for the centromere of chromosome 22. Hybridization with the TP53/CCP17 probe was confirmed by observing two red signals for TP53 and two green signals for the centromere of chromosome 17. The exact number of copies of each gene in each nucleus was recorded. When the copy number in more than 20% of the nuclei in each section exceeded the DNA ploidy number, this was considered gene amplification, whereas when the copy number in more than 30% of the nuclei was below the ploidy number, this was considered a gene deletion (Figure 1) [34].

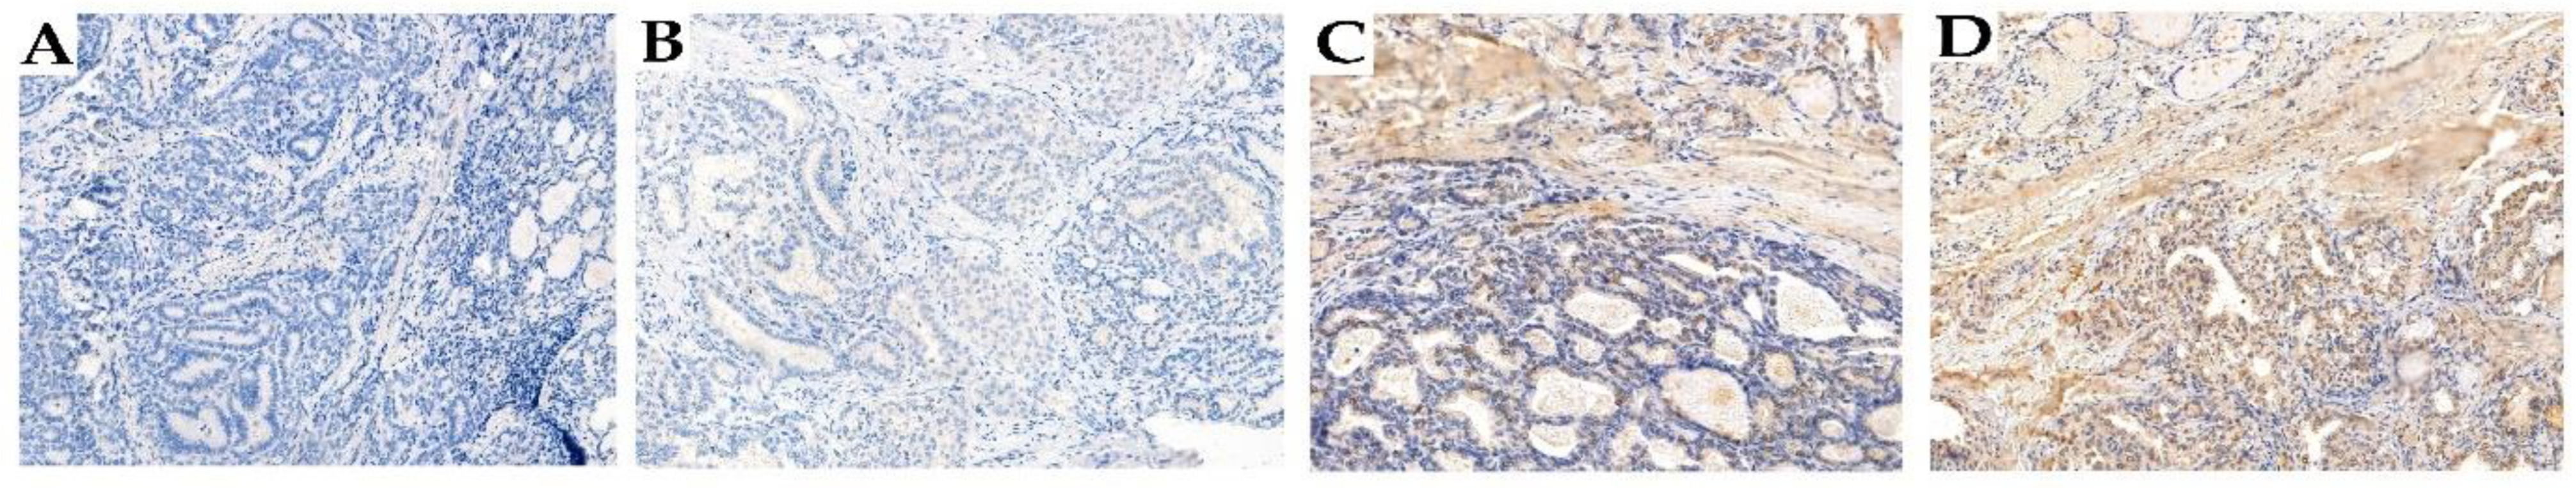
2.5. Immunohistochemistry (IHC)

IHC Staining

Chk2(A-12) mouse monoclonal antibody from Santa Cruz Biotechnology (sc-5278) was used. Staining with this antibody was performed in an OMNIS staining device (Dako). Antigen unmasking was performed with EnV Flex TRS high pH reagent no. REF GV804 (Dako) at 97 °C for 20 min. The sections were incubated for 30 min with the primary antibody diluted 1:50 with EnV Flex/HRP polymer (Dako, REF GV800).
For p53 mouse monoclonal antibody (DO7) (Cell Marque; REF 453M-95, catalog number CM-453M-95), staining was performed in an OMNIS staining device (Dako). Antigen unmasking was performed with EnV Flex TRS high pH reagent (Dako; no. REF GV804) at 97 °C for 20 min. The sections were incubated for 30 min with the primary antibody at a dilution of 1:500 with EnV Flex/HRP polymer (Dako, REF GV800).

2.6. Analysis of Immunohistochemical Results

Immunohistochemical evaluation of CHK2 and p53 expression was performed by two pathologists specialized in PTC. The age of the tissue block had no effect on immunohistochemical staining. CHEK2 staining was scored to evaluate the intensity of nuclear staining and determine the percentage of positive cells. Criteria for assessing the number of tumor cells were as follows: 0, no staining; 1, weak staining (≤10% of cells); 2, moderate staining (10–50% of cells); and 3, strong staining (>50% cancer cells). For statistical analysis, scores of 0 and 1 were classified as low CHK2 staining and scores of 2 and 3 as high staining. The following scoring system was also used for p53. Cases scored as positive showed strong nuclear staining in >30% of the cells, whereas normal thyroid follicular cells showed little staining. The CHK2 expression patterns revealed by IHC staining are shown in Figure 2.

2.7. Statistical Analyses

Continuous data are presented as the mean (standard deviation) and median (lower/upper quartiles and ranges (minimum and maximum)). Categorical data are presented as numbers and percentages. Odds ratio (OR) and 95% confidence intervals (95% CI) were calculated using logistic regression models. A two-tailed p-value < 0.05 was considered statistically significant. Two binomial proportions (e.g., CHK2 frequency in patients with and without vascular invasion) were compared using a Bayesian A/B test. The predictive performances of three competing hypotheses were examined. The first, the null hypothesis (H0), which was assigned a prior probability model (P(M)) of 0.50, predicted the equality of the tested binomial proportions and had a log OR = 0. The second, one-sided alternative hypothesis with an assigned P(M) of 0.25 predicted a higher percentage of results defined as “categories of interest” in the group of patients with the tested feature present (e.g., a higher percentage of patients without vascular invasion in the group of patients with the CHK2 present). The hypothesis with a log OR > 0 predicted a clinically beneficial effect of the tested feature. The third, complementary alternative hypothesis (log OR < 0 and P(M) = 0.25) predicted fewer successes in the selected group of patients, i.e., a clinically unfavorable impact of the tested feature. The results of testing the hypothesis are presented in the form of the Bayes factor (BF). The BF defines the ratio of two competing statistical models represented by their marginal probability. The BF was used to quantify the support for one model over another. The subscript used in BF notation indicated which hypothesis was supported by the data. BF10 indicated a BF that was more in favor of the alternative hypothesis than the H0 hypothesis. BF assumed that any positive value was qualitatively interpreted in accordance with the classification proposed by Jeffreys, modified by Lee et al. [35]. The prior and posterior densities of the log OR for the quantity of interest were plotted. A standard normal prior distribution (µ = 0 and σ = 1) on the log OR scale was adopted. The results were expressed as medians with 95% credible intervals (95% CI). For simplicity, descriptions of the results in the text were expressed as medians of the OR (anti-logarithm of log OR). A sequential analysis was performed to consider the results as a function of the total number of observations. The reproducibility of the estimates was determined by setting an initial random seed value (set seed = 123). All statistical analyses were performed using JASP (Version 16.0.0).

3. Results

3.1. Baseline Characteristics

Clinicopathological features of patients with PTC, molecular status of CHEK2 mutation, primary treatment response categories, and disease outcomes for all 156 cases are presented in Table 1. In the study group of 156 Caucasian patients (median age was 49.5, range 39–59), the majority were women 138 (88.5%) and 98 patients were under 55 years of age (62.8%). The mean and standard deviation of tumor diameter for all patients was 13.1 ± 13.0 (range 1.0–84.0 mm). The stage of the primary lesion was pT1a in 94 (60.3%) patients, the dominant classic subtype was found in 107 (68.6%), gross extrathyroidal extension in two (1.3%), vascular invasion in 11 (7.1%), R1 surgical margin in 19 (12.2%), histologically verified lymph node metastases in 35 (22.4%), distant metastases in one (0.6%), and multifocality in 50 (32.1%) patients. Mutations in the CHEK2 gene were found in 104 (66.7%) patients, including the I157T missense mutation in 60 (38.5%) and a truncating mutation (1100delC, IVS2 + 1G > A, del5395) in 38 (24.4%). No mutations in the CHEK2 gene were found in 52 (33.3%) patients. Thirty-four patients (21.8%) were classified as intermediate risk and 25 patients (16.0%) as high risk according to ATA guidelines [27]. I-131 radiotherapy was administered to 111 (71.2%) patients, and 1100–3700 MBq of I-131 was used depending on cancer stage according to the TNM classification. Eighteen (11.5%) patients received I-131 radiotherapy more than once. The remaining 45 patients (28.9%) with a single PTC focus (≤1 cm in diameter) limited to the thyroid gland, without nodal and distant metastases (pT1aN0-xM0), did not receive I-131 treatment. In the entire study group, a very good response to primary treatment was observed in 127 (81.4%) patients. The median follow-up of the study group was 7 years (range 1–23). There were no cases of death due to cancer. However, deaths from other causes were recorded in five (3.2%) patients. At the end of follow-up, seven (4.5%) patients had an indeterminate response, one (0.6%) had biochemically persistent disease, and three (1.9%) had structurally persistent disease. Recurrence after a disease-free period (NED) occurred in five patients (3.2%).

3.1.1. CHK2 and p53 Expression: Impact on Clinicopathological Features, Treatment Response and Outcomes in PTC Patients with and without CHEK2 Mutations

The relationship between CHK2 and p53 expression levels and clinicopathological features, response to treatment, and disease outcomes in 156 patients with PTC is presented in Table 2. There were no significant associations between CHK2 and p53 expression levels and sex, age at diagnosis, tumor size, histopathological subtypes, multifocality, lymph node (LN) metastases, distant metastases, extrathyroidal extension, vascular invasion, margin status, higher clinical stage of cancer, and intermediate and high recurrence or I-131 treatment. Patients with high CHK2 expression had a 70% and 80% lower chance of excellent and NED responses, respectively, than patients with no or lower CHK2 expression (OR, 0.28; 95% CI, 0.11–0.72; p = 0.009 and OR, 0.17; 95% CI, 0.05–0.62; p = 0.007). No such relationship was observed in patients who were positive for p53 expression.

3.1.2. Impact of CHEK2 and TP53 Gene Status, and p53 Expression on Clinicopathological Features, Treatment Response and Outcomes in PTC Patients with and without CHEK2 Mutations

The relationships between clinicopathological features, response to treatment, and disease outcome in 151 patients with PTC (five patients were not included in the analysis due to degraded histopathological material) and CHEK2 gene copy number, TP53 gene copy number, and p53 expression together with TP53 gene copy status are presented in Table 2. Positive p53 together with a TP53 gene copy deletion was significantly associated with older patient age (≥55 years) at diagnosis (p = 0.047). A significant relationship was found between a TP53 gene copy deletion and angioinvasion (p = 0.008). However, there was no significant relationship between CHEK2 gene copy number, TP53 gene copy number, and positive p53 together with a TP53 gene copy deletion and clinicopathological features, response to treatment, and disease outcome.

3.1.3. Prognostically Favorable and Predictive Results Defined as Categories of Interest in Groups of PTC Patients with and without CHEK2 Mutations

In the analyses described above, the associations between clinicopathological features (tumor diameter, papillary cancer histologic variant, vascular invasion, and age), response to therapy, and final follow-up and CHK2 expression, TP53 gene copy number, p53 expression, and p53 expression together with TP53 gene copy number were either statistically significant or borderline significant. These associations were further explored using Bayesian A/B testing (Table 3). Excellent response, NED in final follow-up, tumor size ≤10 mm (vs. >10 mm and ≤20 mm), and classic cancer subtype (vs. other aggressive subtypes) were ~1.4-fold, ~1.2-fold, ~1.4-fold, and ~1.1-fold higher, respectively, in patients with low CHK2 expression than in those with high CHK2 expression. In patients with no loss of a TP53 gene copy and negative p53 together with no loss of a TP53 gene copy, the absence of vascular invasion was ~1.4-fold and ~1.2-fold higher, respectively, than in patients with a TP53 gene copy deletion and positive p53 together with a TP53 gene copy deletion. In patients under 55 years of age, no loss of a TP53 gene copy and negative p53 together with no loss of a TP53 gene copy were observed ~2.0 and ~1.7 times more often, respectively.

3.1.4. Predictive Value of Clinicopathological Features, Treatment Response, and Outcome Correlations with CHK2, TP53 Status, and p53 Expression in PTC Patients with and without CHEK2 Mutations

For all tested relationships (Table S1), H0 and the hypothesis predicting an increased frequency of categories defined as “categories of interest” in patients with high CHK2 expression, TP53 gene copy deletion, and positive p53 together with a TP53 gene copy deletion, the probability of the posterior model was reduced and these hypotheses were not consistent with the data. A third hypothesis predicting a reduced excellent response (compared to H0), NED in final follow-up, tumor size ≤10 mm (compared with >10 mm and ≤20 mm), classic cancer subtype (compared with other aggressive tumors), absence of vascular invasion, and age <55 years in patients with higher CHK2 expression, TP53 gene copy deletion, and positive p53 together with a TP53 gene copy deletion was qualitatively consistent with the data. The prior probability model of 0.25 was increased in all models from ~2-fold for positive p53 together with deletion of a TP53 gene copy and age, and ~4-fold for higher CHK2 expression, treatment response, deletion of a TP53 gene copy, and vascular invasion. In summary, the analyses provided strong or moderate evidence supporting the alternative hypothesis (compared with H0) predicting a lower prevalence of excellent response, NED in final follow-up, tumor size ≤10 mm (compared with >10 mm and ≤20 mm), classic cancer subtype (compared with other aggressive) in patients with higher CHK2 expression, lower prevalence of absence of vascular invasion, and age <55 years, in patients with deletion of the TP53 gene copy and positive p53 together with deletion of the TP53 gene copy. The accumulated evidence was 17,031, 20,554, 4,766, and 4,646 times more likely to support the hypothesis that excellent response, NED in final follow-up, tumor size ≤10 mm, and classic cancer subtype, respectively, occur less frequently in patients with higher CHK2 expression. The evidence was also 18,553 and 5,713 times more likely to support the hypothesis that the absence of vascular invasion is less common in patients with a TP53 gene copy deletion and positive p53 together with a TP53 gene copy deletion, respectively. In patients with a TP53 gene copy deletion and positive p53 together with a TP53 gene copy deletion, the probability of being <55 years old was 4,280 and 4,962 times less likely than for patients without a TP53 gene copy deletion and negative p53 together with no loss of TP53 gene copy (Table S1).

3.1.5. Posterior Distribution of Odds Log Ratio for Clinicopathological Correlations with CHK2, TP53 Status, and p53 Expression in PTC Patients with and without CHEK2 Mutations

Based on the median posterior distribution of the log OR, we found that in patients with high CHK2 expression compared with patients with low CHK2 expression, the probabilities of an excellent response, NED in final follow-up, tumor size ≤10 mm, and classic cancer subtype were 0.34 to 1, 0.27 to 1, 0.43 to 1, and 0.34 to 1, respectively. In patients with a TP53 gene copy deletion and positive p53 together with a TP53 gene copy deletion, the probabilities of not having vascular invasion were 0.23 to 1 and 0.35 to 1, respectively, compared with patients without these features. The probabilities of being <55 years of age in patients with a TP53 gene copy deletion and positive p53 together with a TP53 gene copy deletion were 0.39 to 1 and 0.42 to 1, respectively, compared with patients without this feature (Figure S1).

3.1.6. Sequential Analysis of Clinicopathological Correlations with CHK2, TP53 Status, and p53 Expression in PTC Tumors with and without CHEK2 Mutations

All panel figures (Figure S2) indicated an increase in the likelihood of the alternative hypothesis predicting a reduced excellent response, NED in final follow-up, tumor size ≤10 mm, and classic cancer subtype in patients with higher CHK2 expression, lower absence of vascular invasion, and age <55 years in patients with TP53 gene deletion and positive p53 together with TP53 gene deletion.

3.1.7. Correlation of Germline CHEK2 Mutation with p53 and CHK2 Expression, and CHEK2 and TP53 Gene Statuses in PTC Patients with and without CHEK2 Mutations

Table 4 shows the association between the germline CHEK2 mutation and p53 expression, CHK2 expression, CHEK2 and TP53 gene statuses, and p53 expression together with TP53 gene status. The association between germline heterozygous truncating CHEK2 mutation variants (1100delC, IVS2 + 1G > A, del5395) with a CHEK2 gene copy deletion and positive p53 together with deletion of a TP53 gene copy was statistically significant. The chance of finding the CHEK2 gene copy deletion in patients with germline heterozygous truncating CHEK2 mutation variants (1100delC, IVS2 + 1G > A, del5395) was 62- and 57-fold higher than in patients with the WT CHEK2 or WT CHEK2 and patients with the missense I157T mutation, respectively. The chance of finding positive p53 together with a TP53 gene copy deletion in patients with germline heterozygous truncating CHEK2 mutation variants (1100delC, IVS2 + 1G > A, del5395) was more than 3-fold higher than in patients with WT CHEK2 and the missense I157T mutation combined. Other associations between germline CHEK2 mutations and p53 expression, CHK2 expression, CHEK2 gene copy status, p53 expression together with TP53 gene copy status, and TP53 gene copy status alone were not statistically significant.

3.1.8. The Incidence of Unfavorable Prognostic Factors Linked to CHEK2 and TP53 Gene Alterations, CHK2 and p53 Expression in PTC Patients with and without CHEK2 Mutations

The analyses described above examined the associations between germline heterozygous truncating CHEK2 mutation variants (1100delC, IVS2 + 1G > A, del5395) and CHEK2 gene status, CHK2 expression, and p53 expression together with TP53 gene status. We decided to examine further the associations that were significant or marginally significant. We tested the equality of following two binomial proportions: CHEK2 gene copy deletion/no deletion; higher/lower CHK2 expression, and positive/negative p53 together with TP53 gene copy deletion/no deletion in patients with CHEK2 truncating mutations (1100delC, IVS2 + 1G > A, del5395), and in patients with WT CHEK2 or WT CHEK2 and the missense I157T mutation using the Bayesian A/B test. In the compared groups, categories of interest were defined as CHEK2 gene copy deletion, higher CHK2 expression, and positive p53 together with a TP53 gene copy deletion. The results are presented in Table 5. Among patients with germline heterozygous truncating CHEK2 mutation variants (1100delC, IVS2 + 1G > A, del5395) the percentages of cases with a CHEK2 gene copy deletion, higher CHK2 expression, and positive p53 together a TP53 gene copy deletion were ~10-, ~3-, and ≈3-fold higher than in those with WT CHEK2, respectively. Among patients with germline heterozygous truncating CHEK2 mutation variants (1100delC, IVS2 + 1G > A, del5395) and the missense I157T mutation, the percentages of cases with a CHEK2 gene copy deletion, higher CHK2 expression, and positive p53 together with a TP53 gene copy deletion were ~10-, ~2-, and ~3-fold higher, respectively, than in those with WT CHEK2 or the missense I157T mutation (Table 5).

3.1.9. Predictive Value of CHEK2 and TP53 Gene Status, CHK2 and p53 Expression in PTC Patients with WT and/or I157T CHEK2 Mutations

Table S2 shows the predictive value of the three competing hypotheses. For H0 and the hypothesis predicting no CHEK2 gene copy deletion, low CHK2 expression, and negative p53 together with no loss of TP53 gene copy in patients with germline heterozygous CHEK2 truncating mutations (1100delC, IVS2 + 1G > A, del5395) compared with those with WT CHEK2 or WT CHEK2 and those with the missense I157T mutation, posterior model probabilities were reduced (compared to prior model probabilities) and these hypotheses were not consistent with the data. The third hypothesis predicted higher probabilities of a CHEK2 gene copy deletion, high CHK2 expression, and positive p53 together with deletion of the TP53 gene copy in patients with heterozygous CHEK2 truncating germline mutations (1100delC, IVS2 + 1G > A, del5395) than in those with WT CHEK2 or WT CHEK2 and those with the missense I157T mutation. The predictions were qualitatively consistent with the data; the a priori model probability of 0.25 was increased by more than 4-fold in both tested models for the CHEK2 gene copy deletion, 2-fold in both models for high CHK2 expression, and 2- and 3-fold in models for positive p53 together with deletion of the TP53 gene copy. To sum up, the analyses provided high or moderate evidence supporting the alternative hypothesis (compared with H0) predicting higher probabilities of a CHEK2 gene copy deletion, high CHK2 expression, and positive p53 together with a TP53 gene copy deletion in patients with the heterozygous CHEK2 truncating germline mutation (1100delC, IVS2 + 1G > A, del5395) than in those with WT CHEK2 or WT CHEK2 and those with the I157T missense mutation, with the accumulated evidence showing that the alternative hypothesis (log OR > 0) would predict that these features are 1,781 × 1010, 4,215, and 3,194 times more likely, respectively, in patients with CHEK2 truncating germline mutations (1100delC, IVS2 + 1G > A, del5395) than in those with WT CHEK2. The evidence also showed that it was 1,054 × 1015, 3,058, and 9,999 times more likely that the alternative hypothesis (log OR > 0) would predict that the CHEK2 gene copy deletion, high CHK2 expression, and positive p53 with a TP53 gene copy deletion, respectively, occurs more often in patients with heterozygous CHEK2 truncating germline mutations (1100delC, IVS2 + 1G > A, del5395) than in those with WT CHEK2 and the missense I157T mutation.

3.1.10. Posterior Odds Log Ratio Distribution for CHEK2 and TP53 Gene Status, CHK2 and p53 Expression in PTC Patients with and without CHEK2 Mutations

Based on the median posterior distribution for the log OR, we found that the probability of a CHEK2 gene copy deletion in patients with germline heterozygous CHEK2 truncating mutations (1100delC, IVS2 + 1G > A, del5395) was ~22 to 1 and ~26 to 1, respectively, compared with patients with WT CHEK2 and WT CHEK2 with the missense I157T mutation. The probabilities of higher CHK2 and positive p53 in the presence of TP53 gene copy deletion in patients with a CHEK2 truncating germline mutation (1100delC, IVS2 + 1G > A, del5395) were ~2.5 to 1 and ~2 to 1, respectively, compared with patients with WT CHEK2, whereas the probabilities were ~2 to 1 and ~3 to 1 compared with patients with WT CHEK2 and WT CHEK2 with the missense I157T mutation, respectively (Figure S3).

3.1.11. Sequential Analysis of Associations Involving CHEK2 and TP53 Gene Status, CHK2 and p53 Expression in PTC Patients with and without CHEK2 Mutations

Based on the sequential analysis, the obtained results were considered as a function of the total number of observations. The panels in Figure S4 depict two circles visualizing the prior and posterior probabilities of the tested hypotheses based on all available data. All the panels in the figures indicate an increase in the probability of the alternative hypothesis that CHEK2 gene copy deletion, higher CHK2 expression, or positive p53 together with the TP53 gene copy deletion occur more frequently in patients with a germline heterozygous CHEK2 truncating mutation (1100delC, IVS2 + 1G > A, del5395) (Figure S4).

4. Discussion

Cell cycle checkpoints induced by DNA mutations play a key role in maintaining genome stability. Tumor suppressors associated with DNA damage responses and the regulation of cell cycle checkpoints include checkpoint kinase 2 (CHEK2 gene, CHK2) and p53. Due to defects in the function of suppressor genes involved in the DNA repair pathway, genome instability and a predisposition to cancer development may occur [6,36]. Depending on the nature of the damage, the type and function of the damaged cell, and other factors, CHK2 can phosphorylate over 20 different proteins involved in the regulation of cellular responses, including p53 and BRCA1 [37]. The association between germline mutations in the CHEK2 gene and the development of various types of cancer, including PTC, has been reported in numerous case-control studies [20,38,39,40,41,42,43,44,45,46]. To date, the mechanism responsible for the increased CHK2 levels in PTC patients remains poorly understood. The data in this study identified CHK2 expression as an independent prognostic parameter of PTC. Patients expressing CHK2 had a 70% and 80% lower chance of an excellent response and NED, respectively, than patients not expressing or expressing lower amounts of CHK2. Tumor size, histological subtype of the cancer (features that were of borderline statistical significance), response to treatment, and final disease status (features that were statistically significant) were further explored using the Bayesian A/B test.
Excellent response to primary treatment, final follow-up NED, tumor size ≤ 10 mm (compared with >10 mm and ≤20 mm), and classic cancer type (compared with other aggressive subtypes) were from 10% to 40% higher in patients without CHK2 expression than in those with CHK2 expression. In a study by Zhao W et al. 2018 [10], it was found that CHK2 expression levels and phosphorylated CHK2 (p-CHK2) were significantly higher in most PTCs than in tumor-adjacent thyroid tissues. They also reported that high p-CHK2 expression, male sex, classical variant, stage N, and LN metastasis were associated with cancer aggressiveness. In the present study, we did not evaluate p-CHK2 expression. However, CHK2 expression in the study by Zhao W et al. 2018 correlated significantly and negatively with multifocality [10], but we were unable to evaluate this in the present study. Zhao W et al. 2018 also found that CHK2 and p-CHK2 expression were significantly downregulated in LN metastasis compared with matched primary PTC tumors and suggested that CHK2 levels may be negatively associated with circulating tumor cell survival and metastatic behavior [10]. In the current study, we also analyzed CHK2 expression in all 35 patients with LN metastasis, but found that CHK2 expression in LN metastasis tumors was not higher than that in matched primary tumors (Figure S5).
Similarly, increased CHK2 expression has been observed in other human malignancies, such as melanoma metastases, most cases of DLBCL [11], bladder cancer, and ovarian cancer [13]. However, other studies on the prognostic value of CHK2 expression revealed low CHK2 expression was associated with poor prognosis in 918 cases of gastric cancer. These differences in patient outcomes may be because CHK2 has multiple and diverse functions and interacts with a wide variety of key cancer genes, each of which can cause CHK2 overexpression under certain conditions [47,48].
The molecular database employed in the present study allowed us to examine the association between CHK2 expression and molecular features of interest. We selected patients with germline mutations in the CHEK2 gene (truncating 1100delC, IVS2 + 1G > A, del5395, and missense I157T mutations) and patients without a mutation in the CHEK2 gene (CHEK2 WT). In our previous work, we showed that truncating mutations, but not missense mutations, in the CHEK2 gene are significantly associated with angioinvasion and an intermediate or high initial risk of recurrent/persistent disease in PTC patients [21]; however, we did not evaluate CHK2 and p53 expression in tumor tissues. Therefore, in the current study, we performed IHC analysis of CHK2 and p53 expression in tumors to assess the value of the ATM/CHK2/p53 pathway as a prognostic marker. In addition, we used FISH to analyze for CHEK2 and TP53 copy number aberrations and correlate these aberrations with the course of PTC disease. Positive p53 expression together with TP53 gene deletion was significantly associated with older (≥55 years) patient age at diagnosis. This can be attributed to the decrease in p53 pathway activity with age, which is associated with an increased mutation rate (due to impaired DNA repair) and mutation fixation (due to a decrease in p53-mediated apoptosis) in older people. The decline in p53 function with age may result in the accumulation of TP53 mutations, which is probably why older people have lower rates of cell division fidelity, higher DNA replication error rates, and a higher incidence of cancer [49]. In this study, we found a significant association between angioinvasion and TP53 gene copy deletion, but this association lost statistical significance when we examined the association between angioinvasion and positive p53 expression together with a TP53 gene copy deletion. These associations were further explored using a Bayesian A/B test, where patients with no loss of a TP53 gene copy together with negative p53 expression and patients with no loss of a TP53 gene copy alone had a 20% to 40% lower prevalence of vascular invasion than patients with no loss of a TP53 gene copy together with positive p53 expression and patients with a TP53 gene copy deletion alone. So far, angioinvasion is thought to be associated with an unfavorable clinical course and poor prognosis, which has important consequences for cancer treatment [50]. Moreover, in accordance with the ATA Management Guidelines criteria, vascular invasion is a key feature that is absent from low-risk PTC patients [27]. Mutations in the TP53 gene, in addition to poorly differentiated and anaplastic thyroid cancer, where such mutations occur most frequently, have also been found in some well-differentiated cancers, including PTC [51]. It is also likely that well-differentiated cancers with a TP53 mutation are more inclined to undergo tumor dedifferentiation and result in a more aggressive clinical course [52].
To the best of our knowledge, no previous studies have assessed CHK2 and p53 expression by IHC and CHEK2 and TP53 gene statuses by FISH in a large group of PTC patients with germline mutations in the CHEK2 gene. The only study to have evaluated patients with a germline CHEK2 mutation in PTC patients was a paper by Zhao Y et al. [53], which reported a Chinese family with a germline CHEK2 mutation c.417C > A. Molecular analysis showed that the 417C > A substitution created a premature stop codon (Y139X). Tumor tissue analysis showed that two patients with the loss-of-function Y139X variant exhibited lower mRNA expression of the mutant allele, lower CHK2 expression, and lower p53 and phosphorylated p53 expression than in patients with sporadic PTC (WT CHEK2). The molecular database employed in the present study comprised patients with truncating mutations (1100delC, IVS2 + 1G > A, and del5395) and a I157T missense mutation, but no patients with a nonsense mutation [53].
The association between CHK2 expression and mutation of the CHEK2 gene was clear in patients with truncating mutations (1100delC, IVS2 + 1G > A, and del5395). In patients with CHEK2 truncating mutations, one copy of the CHEK2 gene remains intact (in the FISH method in this study, all detected deletions had only one damaged copy of the gene) while the other is truncated. The intact copy can synthesize a sufficient amount of CHK2, or in some cases produce larger amounts of CHK2 than cells with two normal copies of CHEK2. Complete loss of CHK2 function only occurs when the remaining intact copy is mutated or deleted, termed loss of heterozygosity, but we did not test for this in our study.
On the other hand, higher CHK2 expression may be due to impaired degradation of CHK2, the mechanism of which is not fully understood in cancer cells. It is possible that the ubiquitin-proteasome pathway was disturbed in the tumor cells. The ubiquitin-proteasome pathway is crucial for the expression and control of the activity of proteins involved in cell cycle regulation and the DNA damage response. It is known that interactions between proteins may change in response to DNA damage [54].
Increased expression of CHK2 may also be attributed to impaired ubiquitination caused by aberrations in p53. Bohgaki et al. demonstrated that, in mice, CHK2 phosphorylated at S460 (which corresponds to S456 in humans) undergoes ubiquitination that is facilitated by the p53-induced RING-H2 protein (PIRH2) and subsequent degradation by the proteasome [55].
Our study has several strengths. First, the study examined a large homogeneous group of Caucasian patients from one center in Poland. Second, to our knowledge, there have been no studies in the literature assessing CHK2 and p53 expression in a large number of PTC patients with a germline mutation in the CHEK2 gene. Third, there have been no studies assessing the statuses of the CHEK2 and TP53 genes by FISH in patients with PTC.
Our study has some limitations. First, the study mainly included low-risk tumors (62.2%), with a high number of microcarcinomas (≤1 cm, 60.3%), and this could have influenced the results. Second, the number of patients with advanced clinical disease was relatively small. Third, the follow-up period was short (7 years). Follow-up periods beyond 7 years could reveal more information about PTC-related recurrence or death and improve understanding of the roles of CHK2 and p53. Due to financial constraints, we were unable to examine the tumor tissues for phosphorylated CHK2 and p53 or sequence both genes (CHEK2, TP53) in the tumor tissues, which could have improved the risk stratification. It will be interesting to evaluate p-CHK2 and p53 expression and sequence both genes in future studies.

5. Conclusions

High CHK2 expression is associated with poor treatment response and outcomes in patients with PTC. Increased expression of CHK2 and positive p53 expression together with deletion of a TP53 gene copy in patients with a truncating mutation in the CHEK2 gene could have potential as a prognostic marker for an unfavorable disease course in this group of patients. Therefore, further studies will be required using larger patient groups with germline mutations, in particular those with a truncating mutation in the CHEK2 gene, to assess whether patients with increased expression of CHK2 and p53 in cancer cells, especially their phosphorylated forms, require different treatment regimens or oncological follow-up protocols from those of patients with tumors that do not express these genes.

Supplementary Materials

The following supporting information can be downloaded at: https://www.mdpi.com/2072-6694/16/4/815/s1, Figure S1: Posterior distribution of the odds log ratio for the relationships between clinicopathological features and CHK2 expression, TP53 gene status, and p53 expression together with TP53 gene status in tumor tissues from PTC patients with and without CHEK2 germline mutations; Figure S2: Sequential analysis for the relationships between clinicopathological features and CHK2 expression, TP53 gene status, and p53 expression together with TP53 gene status in the tumor tissues of PTC patients with and without CHEK2 germline mutations; Figure S3: Posterior distribution of the odds log ratio for the association between CHEK2 gene status, CHK2 expression, and the p53 expression together with TP53 gene status in tumor tissues from PTC patients with and without the CHEK2 germline mutations; Figure S4: Sequential analysis of the associations between CHEK2 gene status, CHK2 expression as determined by IHC, and p53 expression together with TP53 gene status as determined by FISH in tumor tissues from PTC patients with and without the CHEK2 germline mutations; Figure S5: CHK2 expression levels in primary papillary thyroid cancer tissue and lymph node metastases; Table S1: Predictive values of the tested hypotheses for the relationships between clinicopathological features, treatment response, and disease outcome and level of CHK2 expression and TP53 gene status, and p53 expression together with TP53 status in tumor tissues from PTC patients with and without CHEK2 germline mutations; Table S2: Predictive value of tested hypotheses for the association between CHEK2 gene status, CHK2 expression, and p53 expression together with TP53 gene status in PTC patients with and without the CHEK2 germline mutations.

Author Contributions

Conceptualization, D.G.-P.; methodology, D.G.-P., A.K. (Artur Kowalik), J.K., O.W., P.M., K.G., K.N. and T.D.; software, P.M.; validation, M.K.; formal analysis, D.G.-P., A.K. (Artur Kowalik), P.M. and A.K. (Aldona Kowalska); investigation, D.G.-P.; resources, D.G.-P., P.P., M.S., A.W. and I.P.; data curation, D.G.-P. and A.K. (Aldona Kowalska); writing—original draft preparation, D.G.-P.; writing—review and editing, D.G.-P., A.K. (Artur Kowalik) and P.M.; visualization, D.G.-P. and P.P.; supervision, D.G.-P. and S.G.; project administration, D.G.-P.; funding acquisition, D.G.-P. and S.G. All authors have read and agreed to the published version of the manuscript.

Funding

This research was funded by grants from the Minister of Education and Science termed “Regional Initiative of Excellence” in the years 2019–2023 (project no. 024/RID/2018/19; amount of financing, 11,999,000.00 PLN).

Institutional Review Board Statement

This study was conducted according to the guidelines of the Declaration of Helsinki and approved by the Ethics Committee of the Institutional Review Board of Jan Kochanowski University, Kielce, Poland (approval number: 31/2021).

Informed Consent Statement

Informed consent was obtained from all subjects involved in the study.

Data Availability Statement

Data are available on reasonable request.

Conflicts of Interest

The authors declare no conflicts of interest.

Correction Statement

This article has been republished with a minor correction to resolve spelling and grammatical errors. This change does not affect the scientific content of the article.

References

  1. Davies, L.; Welch, H.G. Increasing incidence of thyroid cancer in the United States, 1973–2002. JAMA 2006, 295, 2164–2167. [Google Scholar] [CrossRef]
  2. Davies, L.; Welch, H.G. Current thyroid cancer trends in the United States. JAMA Otolaryngol. Head Neck Surg. 2014, 140, 317–322. [Google Scholar] [CrossRef] [PubMed]
  3. Ahn, H.S.; Kim, H.J.; Welch, H.G. Korea’s thyroid-cancer “epidemic”—Screening and overdiagnosis. N. Engl. J. Med. 2014, 371, 1765–1767. [Google Scholar] [CrossRef] [PubMed]
  4. Carling, T.; Udelsman, R. Thyroid cancer. Annu. Rev. Med. 2014, 65, 125–137. [Google Scholar] [CrossRef]
  5. Cady, B.; Rossi, R. An expanded view of risk-group definition in differentiated thyroid carcinoma. Surgery 1988, 104, 947–953. [Google Scholar]
  6. Bartek, J.; Falck, J.; Lukas, J. CHK2 kinase—A busy messenger. Nat. Rev. Mol. Cell. Biol. 2001, 2, 877–886. [Google Scholar] [CrossRef] [PubMed]
  7. Ahn, J.; Urist, M.; Prives, C. The Chk2 protein kinase. DNA Repair 2004, 3, 1039–1047. [Google Scholar] [CrossRef]
  8. Bahassi, E.M.; Ovesen, J.L.; Riesenberg, A.L.; Bernstein, W.Z.; E Hasty, P.; Stambrook, P.J. The checkpoint kinases Chk1 and Chk2 regulate the functional associations between hBRCA2 and Rad51 in response to DNA damage. Oncogene 2008, 27, 3977–3985. [Google Scholar] [CrossRef]
  9. Kauffmann, A.; Rosselli, F.; Lazar, V.; Winnepenninckx, V.; Mansuet-Lupo, A.; Dessen, P.; Oord, J.J.v.D.; Spatz, A.; Sarasin, A. High expression of DNA repair pathways is associated with metastasis in melanoma patients. Oncogene 2007, 27, 565–573. [Google Scholar] [CrossRef]
  10. Zhao, W.; Chen, S.; Hou, X.; Chen, G.; Zhao, Y. CHK2 Promotes Anoikis and is Associated with the Progression of Papillary Thyroid Cancer. Cell. Physiol. Biochem. 2018, 45, 1590–1602. [Google Scholar] [CrossRef]
  11. Dai, B.; Zhao, X.F.; Mazan-Mamczarz, K.; Hagner, P.; Corl, S.; Bahassi, E.M.; Lu, S.; Stambrook, P.J.; Shapiro, P.; Gartenhaus, R.B. Functional and molecular interactions between ERK and CHK2 in diffuse large B-cell lymphoma. Nat. Commun. 2011, 2, 402. [Google Scholar] [CrossRef]
  12. Bartkova, J.; Guldberg, P.; Grønbæk, K.; Koed, K.; Primdahl, H.; Møller, K.; Lukas, J.; Ørntoft, T.F.; Bartek, J. Aberrations of the Chk2 tumour suppressor in advanced urinary bladder cancer. Oncogene 2004, 23, 8545–8551. [Google Scholar] [CrossRef]
  13. Davidson, B.; Bjørnerem, M.; Holth, A.; Hellesylt, E.; Falkenthal, T.E.H.; Flørenes, V.A. Expression, activation and clinical relevance of CHK1 and CHK2 in metastatic high-grade serous carcinoma. Gynecol. Oncol. 2018, 150, 136–142. [Google Scholar] [CrossRef]
  14. Barnoud, T.; Parris, J.L.D.; Murphy, M.E. Common genetic variants in the TP53 pathway and their impact on cancer. J. Mol. Cell. Biol. 2019, 11, 578–585. [Google Scholar] [CrossRef]
  15. Bell, D.W.; Varley, J.M.; Szydlo, T.E.; Kang, D.H.; Wahrer, D.C.R.; Shannon, K.E.; Lubratovich, M.; Verselis, S.J.; Isselbacher, K.J.; Fraumeni, J.F.; et al. Heterozygous Germ Line hCHK2 Mutations in Li-Fraumeni Syndrome. Science 1999, 286, 2528–2531. [Google Scholar] [CrossRef]
  16. Soussi, T. The p53 tumor suppressor gene: From molecular biology to clinical investigation. Ann. N. Y. Acad. Sci. 2000, 910, 121–137, discussion 137–139. [Google Scholar] [CrossRef]
  17. Levine, A.J. p53, the cellular gatekeeper for growth and division. Cell 1997, 88, 323–331. [Google Scholar] [CrossRef]
  18. Levine, A.J.; Momand, J.; Finlay, C.A. The p53 tumour suppressor gene. Nature 1991, 351, 453–456. [Google Scholar] [CrossRef] [PubMed]
  19. el-Deiry, W.S.; Harper, J.W.; O’Connor, P.M.; Velculescu, V.E.; Canman, C.E.; Jackman, J.; Pietenpol, J.A.; Burrell, M.; Hill, D.E.; Wang, Y.; et al. WAF1/CIP1 is induced in p53-mediated G1 arrest and apoptosis. Cancer Res. 1994, 54, 1169–1174. [Google Scholar] [PubMed]
  20. Siolek, M.; Cybulski, C.; Gąsior-Perczak, D.; Kowalik, A.; Kozak-Klonowska, B.; Kowalska, A.; Chłopek, M.; Kluźniak, W.; Wokołorczyk, D.; Pałyga, I.; et al. CHEK2 mutations and the risk of papillary thyroid cancer. Int. J. Cancer 2015, 137, 548–552. [Google Scholar] [CrossRef] [PubMed]
  21. Gasior-Perczak, D.; Kowalik, A.; Gruszczyński, K.; Walczyk, A.; Siołek, M.; Pałyga, I.; Trepka, S.; Mikina, E.; Trybek, T.; Kopczyński, J.; et al. Incidence of the CHEK2 Germline Mutation and Its Impact on Clinicopathological Features, Treatment Responses, and Disease Course in Patients with Papillary Thyroid Carcinoma. Cancers 2021, 13, 470. [Google Scholar] [CrossRef]
  22. Kaczmarek-Ryś, M.; Ziemnicka, K.; Hryhorowicz, S.T.; Górczak, K.; Hoppe-Gołębiewska, J.; Skrzypczak-Zielińska, M.; Tomys, M.; Gołąb, M.; Szkudlarek, M.; Budny, B.; et al. The c.470 T > C CHEK2 missense variant increases the risk of differentiated thyroid carcinoma in the Great Poland population. Hered. Cancer Clin. Pract. 2015, 13, 8. [Google Scholar] [CrossRef] [PubMed]
  23. Wójcicka, A.; Czetwertyńska, M.; Świerniak, M.; Długosińska, J.; Maciąg, M.; Czajka, A.; Dymecka, K.; Kubiak, A.; Kot, A.; Płoski, R.; et al. Variants in the ATM-CHEK2-BRCA1 axis determine genetic predisposition and clinical presentation of papillary thyroid carcinoma. Genes Chromosom. Cancer 2014, 53, 516–523. [Google Scholar] [CrossRef] [PubMed]
  24. The Cancer Genome Atlas Research Network. Integrated genomic characterization of papillary thyroid carcinoma. Cell 2014, 159, 676–690. [Google Scholar] [CrossRef]
  25. R Core Team. (2020). R: A Language and Environment for Statistical Computing. Vienna, Austria: R Foundation for Statistical Computing. Available online: https://www.R-project.org/ (accessed on 30 January 2024).
  26. Gąsior-Perczak, D.; Kowalik, A.; Walczyk, A.; Siołek, M.; Gruszczyński, K.; Pałyga, I.; Mikina, E.; Trybek, T.; Kopczyński, J.; Mężyk, R.; et al. Coexisting Germline CHEK2 and Somatic BRAF(V600E) Mutations in Papillary Thyroid Cancer and Their Association with Clinicopathological Features and Disease Course. Cancers 2019, 11, 1744. [Google Scholar] [CrossRef]
  27. Haugen, B.R.; Alexander, E.K.; Bible, K.C.; Doherty, G.M.; Mandel, S.J.; Nikiforov, Y.E.; Pacini, F.; Randolph, G.W.; Sawka, A.M.; Schlumberger, M.; et al. 2015 American Thyroid Association Management Guidelines for Adult Patients with Thyroid Nodules and Differentiated Thyroid Cancer: The American Thyroid Association Guidelines Task Force on Thyroid Nodules and Differentiated Thyroid Cancer. Thyroid 2016, 26, 1–133. [Google Scholar] [CrossRef] [PubMed]
  28. Tuttle, M.L.; Morris, L.F.; Haugen, B.; Shah, J.; Sosa, J.A.; Rohren, E.; Subramaniam, R.M.; Hunt, J.L.; Perrier, N.D. AJCC Cancer Staging Manual; Springer: New York, NY, USA, 2017; Volume 8, pp. 1–19. [Google Scholar]
  29. Gąsior-Perczak, D.; Pałyga, I.; Szymonek, M.; Kowalik, A.; Walczyk, A.; Kopczyński, J.; Lizis-Kolus, K.; Trybek, T.; Mikina, E.; Szyska-Skrobot, D.; et al. The impact of BMI on clinical progress, response to treatment, and disease course in patients with differentiated thyroid cancer. PLOS ONE 2018, 13, e0204668. [Google Scholar] [CrossRef]
  30. Tuttle, R.M.; Tala, H.; Shah, J.; Leboeuf, R.; Ghossein, R.; Gonen, M.; Brokhin, M.; Omry, G.; Fagin, J.A.; Shaha, A. Estimating Risk of Recurrence in Differentiated Thyroid Cancer After Total Thyroidectomy and Radioactive Iodine Remnant Ablation: Using Response to Therapy Variables to Modify the Initial Risk Estimates Predicted by the New American Thyroid Association Staging System. Thyroid® 2010, 20, 1341–1349. [Google Scholar] [CrossRef]
  31. Momesso, D.P.; Vaisman, F.; Yang, S.P.; Bulzico, D.A.; Corbo, R.; Vaisman, M.; Tuttle, R.M. Dynamic Risk Stratification in Patients with Differentiated Thyroid Cancer Treated Without Radioactive Iodine. J. Clin. Endocrinol. Metab. 2016, 101, 2692–2700. [Google Scholar] [CrossRef]
  32. Kowalska, A.; Walczyk, A.; Pałyga, I.; Gąsior-Perczak, D.; Gadawska-Juszczyk, K.; Szymonek, M.; Trybek, T.; Lizis-Kolus, K.; Szyska-Skrobot, D.; Mikina, E.; et al. The Delayed Risk Stratification System in the Risk of Differentiated Thyroid Cancer Recurrence. PLOS ONE 2016, 11, e0153242. [Google Scholar] [CrossRef]
  33. Gąsior-Perczak, D.; Pałyga, I.; Szymonek, M.; Kowalik, A.; Walczyk, A.; Kopczyński, J.; Lizis-Kolus, K.; Słuszniak, A.; Słuszniak, J.; Łopatyński, T.; et al. Delayed risk stratification system in pT1aN0/Nx DTC patients treated without radioactive iodine. Endocr. Connect. 2017, 6, 522–527. [Google Scholar] [CrossRef] [PubMed]
  34. Li, C.; Bai, J.; Hao, X.; Zhang, S.; Hu, Y.; Zhang, X.; Yuan, W.; Hu, L.; Cheng, T.; Zetterberg, A.; et al. Multi-gene fluorescence in situ hybridization to detect cell cycle gene copy number aberrations in young breast cancer patients. Cell Cycle 2014, 13, 1299–1305. [Google Scholar] [CrossRef] [PubMed]
  35. Lee, M.D.; Wagenmakers, E.J. Bayesian Cognitive Modeling: A Practical Course; Cambridge University Press: Cambridge, UK, 2013. [Google Scholar]
  36. Stolarova, L.; Kleiblova, P.; Janatova, M.; Soukupova, J.; Zemankova, P.; Macurek, L.; Kleibl, Z. CHEK2 Germline Variants in Cancer Predisposition: Stalemate Rather than Checkmate. Cells 2020, 9, 2675. [Google Scholar] [CrossRef] [PubMed]
  37. Ertych, N.; Stolz, A.; Valerius, O.; Braus, G.H.; Bastians, H. CHK2BRCA1 tumor-suppressor axis restrains oncogenic Aurora-A kinase to ensure proper mitotic microtubule assembly. Proc. Natl. Acad. Sci. USA 2016, 113, 1817–1822. [Google Scholar] [CrossRef] [PubMed]
  38. Cybulski, C.; Górski, B.; Huzarski, T.; Masojć, B.; Mierzejewski, M.; Dębniak, T.; Teodorczyk, U.; Byrski, T.; Gronwald, J.; Matyjasik, J.; et al. CHEK2 Is a Multiorgan Cancer Susceptibility Gene. Am. J. Hum. Genet. 2004, 75, 1131–1135. [Google Scholar] [CrossRef] [PubMed]
  39. Cybulski, C.; Masojć, B.; Oszutowska, D.; Jaworowska, E.; Grodzki, T.; Waloszczyk, P.; Serwatowski, P.; Pankowski, J.; Huzarski, T.; Byrski, T.; et al. Constitutional CHEK2 mutations are associated with a decreased risk of lung and laryngeal cancers. Carcinog. 2008, 29, 762–765. [Google Scholar] [CrossRef]
  40. Brennan, P.; McKay, J.; Moore, L.; Zaridze, D.; Mukeria, A.; Szeszenia-Dabrowska, N.; Lissowska, J.; Rudnai, P.; Fabianova, E.; Mates, D.; et al. Uncommon CHEK2 mis-sense variant and reduced risk of tobacco-related cancers: Case–control study. Hum. Mol. Genet. 2007, 16, 1794–1801. [Google Scholar] [CrossRef]
  41. Szymanska-Pasternak, J.; Szymanska, A.; Medrek, K.; Imyanitov, E.; Cybulski, C.; Gorski, B.; Magnowski, P.; Dziuba, I.; Gugala, K.; Debniak, B.; et al. CHEK2 variants predispose to benign, borderline and low-grade invasive ovarian tumors. Gynecol. Oncol. 2006, 102, 429–431. [Google Scholar] [CrossRef]
  42. Wang, Y.; McKay, J.D.; Rafnar, T.; Wang, Z.; Timofeeva, M.N.; Broderick, P.; Zong, X.; Laplana, M.; Wei, Y.; Han, Y.; et al. Rare variants of large effect in BRCA2 and CHEK2 affect risk of lung cancer. Nat. Genet. 2014, 46, 736–741. [Google Scholar] [CrossRef]
  43. Rudd, M.F.; Sellick, G.S.; Webb, E.L.; Catovsky, D.; Houlston, R.S. Variants in the ATM-BRCA2-CHEK2 axis predispose to chronic lymphocytic leukemia. Blood 2006, 108, 638–644. [Google Scholar] [CrossRef]
  44. Złowocka, E.; Cybulski, C.; Górski, B.; Dębniak, T.; Słojewski, M.; Wokołorczyk, D.; Serrano-Fernández, P.; Matyjasik, J.; van de Wetering, T.; Sikorski, A.; et al. Germline mutations in the CHEK2 kinase gene are associated with an increased risk of bladder cancer. Int. J. Cancer 2007, 122, 583–586. [Google Scholar] [CrossRef] [PubMed]
  45. Teodorczyk, U.; Cybulski, C.; Wokołorczyk, D.; Jakubowska, A.; Starzyńska, T.; Ławniczak, M.; Domagała, P.; Ferenc, K.; Marlicz, K.; Banaszkiewicz, Z.; et al. The risk of gastric cancer in carriers of CHEK2 mutations. Fam. Cancer 2013, 12, 473–478. [Google Scholar] [CrossRef] [PubMed]
  46. Havranek, O.; Spacek, M.; Hubacek, P.; Mocikova, H.; Markova, J.; Trneny, M.; Kleibl, Z. Alterations of CHEK2 forkhead-associated domain increase the risk of Hodgkin lymphoma. Neoplasma 2011, 58, 392–395. [Google Scholar] [CrossRef] [PubMed]
  47. Abdel-Fatah, T.M.; Arora, A.; Alsubhi, N.; Agarwal, D.; Moseley, P.M.; Perry, C.; Doherty, R.; Chan, S.Y.; Green, A.R.; Rakha, E.; et al. Clinicopathological Significance of ATM-Chk2 Expression in Sporadic Breast Cancers: A Comprehensive Analysis in Large Cohorts. Neoplasia 2014, 16, 982–991. [Google Scholar] [CrossRef] [PubMed]
  48. Eichenauer, T.; Federlein, F.; Möller, K.; Chirico, V.; Kind, S.; Lennartz, M.; Lutz, F.; Hube-Magg, C.; Höflmayer, D.; Fisch, M.; et al. High CHK2 protein expression is a strong and independent prognostic feature in ERG negative prostate cancer. Pathology 2020, 52, 421–430. [Google Scholar] [CrossRef]
  49. Feng, Z.; Hu, W.; Teresky, A.K.; Hernando, E.; Cordon-Cardo, C.; Levine, A.J. Declining p53 function in the aging process: A possible mechanism for the increased tumor incidence in older populations. Proc. Natl. Acad. Sci. USA 2007, 104, 16633–16638. [Google Scholar] [CrossRef] [PubMed]
  50. Cipriani, N.A. Prognostic Parameters in Differentiated Thyroid Carcinomas. Surg. Pathol. Clin. 2019, 12, 883–900. [Google Scholar] [CrossRef]
  51. Nikiforova, M.N.; Wald, A.I.; Roy, S.; Durso, M.B.; Nikiforov, Y.E. Targeted Next-Generation Sequencing Panel (ThyroSeq) for Detection of Mutations in Thyroid Cancer. J. Clin. Endocrinol. Metab. 2013, 98, E1852–E1860. [Google Scholar] [CrossRef]
  52. Hsiao, S.J.; Nikiforov, Y.E. Molecular approaches to thyroid cancer diagnosis. Endocr. Relat. Cancer 2014, 21, T301–T313. [Google Scholar] [CrossRef]
  53. Zhao, Y.; Yu, T.; Chen, L.; Xie, D.; Wang, F.; Fu, L.; Cheng, C.; Li, Y.; Zhu, X.; Miao, G. A Germline CHEK2 Mutation in a Family with Papillary Thyroid Cancer. Thyroid® 2020, 30, 924–930. [Google Scholar] [CrossRef] [PubMed]
  54. García-Limones, C.; Lara-Chica, M.; Jiménez-Jiménez, C.; Pérez, M.; Moreno, P.; Muñoz, E.; A Calzado, M. CHK2 stability is regulated by the E3 ubiquitin ligase SIAH2. Oncogene 2016, 35, 4289–4301. [Google Scholar] [CrossRef] [PubMed]
  55. Bohgaki, M.; Hakem, A.; Halaby, M.J.; Bohgaki, T.; Li, Q.; A Bissey, P.; Shloush, J.; Kislinger, T.; Sanchez, O.; Sheng, Y.; et al. The E3 ligase PIRH2 polyubiquitylates CHK2 and regulates its turnover. Cell Death Differ. 2013, 20, 812–822. [Google Scholar] [CrossRef] [PubMed]
Figure 1. Gene status in PTC tumors samples examined by fluorescence in situ hybridization (FISH) using the probes LCP CHEK2/CEN22 and LCP TP53/CEN17; (A) detection of CHEK2 (red signal indicates deletion of one copy of the CHEK2 gene), and (B) detection of TP53 (red signal indicates deletion of one copy of the TP53 gene), magnification ×100.
Cancers 16 00815 g001
Figure 2. Detection of CHK2 expression by immunohistochemistry in PTC tumor samples. Representative staining intensities were scored as 0 (negative) (A), 1+ (weak) (B), 2+ (moderate) (C), and 3+ (strong) (D). Magnification ×200.
Cancers 16 00815 g002
Table 1. Basic characteristics of 156 patients with papillary thyroid carcinoma.
CharacteristicTotal n = 156 (100%)
Sex
  Female138 (88.5%)
  Male18 (11.5%)
Age at diagnosis (years)
  <5598 (62.8%)
  ≥5558 (37.2%)
  Mean (SD)48.5 (13.6)
  Median (Q1–Q3)49.5 (39.0–59.0)
  Range18.0–73.0
Tumor diameter (mm)
  Mean (SD)13.1 (13.0)
  Median (Q1–Q3)8.0 (5.0–16.5)
  Range1.0–84.0
Tumor diameter (mm)
  ≤1094 (60.3%)
  >10–2032 (20.5%)
  >20–4025 (16.0%)
  >405 (3.2%)
Papillary cancer histologic variant
  Classic 107 (68.6%)
  Follicular35 (22.4%)
  Oxyphilic3 (1.9%)
  Diffuse sclerosing3 (1.9%)
  Tall cell1 (0.6%)
  Other *7 (4.5%)
Surgical treatment
  Total thyroidectomy152 (97.4%)
  Lobectomy4 (2.6%)
Nodal dissection
  Central 94 (60.3%)
  Lateral 17 (10.9%)
  No dissection45 (28.8%)
Multifocality
  No106 (68.0%)
  Yes50 (32.1%)
Lymph node metastases **
  N0a76 (48.7%)
  N0b45 (28.9%)
  N1a18 (11.5%)
  N1b17 (10.9%)
Distant metastases
  M0155 (99.4%)
  M11 (0.6%)
Extrathyroidal extension
  Negative124 (79.5%)
  Microscopic30 (19.2%)
  Gross2 (1.3%)
Vascular invasion
  No145 (93%)
  Yes11 (7.1%)
Margin status
  R0137 (87.8%)
  R119 (12.2%)
Tumor stage
  pT1a94 (60.3%)
  pT1b32 (20.5%)
  pT223 (14.7%)
  pT3a5 (3.2%)
  pT3b2 (1.3%)
CHEK2 mutation status
  CHEK2 WT52 (33.3%)
  CHEK2 mutation any104 (66.7%)
CHEK2 I157T missense mutation (any)60 (38.5%)
  I157T heterozygous53 (34.0%)
  I157T homozygous7 (4.5%)
CHEK2 truncating heterozygous mutation (any)38 (24.4%)
  IVS2 + 1G > A16 (10.3%)
  Del539510 (6.4%)
  1100delC12 (7.7%)
Coexistence of two heterozygous CHEK2 mutations6 (3.8%)
  I157T and IVS2 + 1G > A3 (1.9%)
  I157T and Del53951 (0.6%)
  IVS2 + 1G > A and Del53952 (1.3%)
TNM (8th edition)
  I144 (92.3%)
  II12 (7.7%)
ATA initial risk stratification system
  Low97 (62.2%)
  Intermediate34 (21.8%)
  High25 (16.0%)
Radioactive iodine (I-131) therapy
  No45 (28.9%)
  Yes111 (71.2%)
More than one course of radioactive iodine therapy (I-131)
  No138 (88.5%)
  Yes 18 (11.5%)
Response to therapy
  Excellent127 (81.4%)
  Indeterminate24 (15.4%)
  Biochemically incomplete2 (1.3%)
  Structurally incomplete3 (1.9%)
Final follow-up (disease outcome)
  NED145 (93.0%)
  Indeterminate7 (4.5%)
  Biochemically persistent1 (0.6%)
  Structurally persistent3 (1.9%)
Follow-up, recurrence
  No 151 (96.8%)
  Yes5 (3.2%)
Death
  No151 (96.8%)
  Yes5 (3.2%)
Follow-up (years)
  Median (range)7.0 (1.0–23.0)
* Warthin-like (n = 2); mixed variant (classic and follicular) (n = 5). ** N0a, one or more cytologically or histologically confirmed benign lymph nodes; N0b, no radiologic or clinical evidence of locoregional lymph node metastasis; N1a–N1b, metastasis to regional lymph nodes; R1, microscopically positive margin (resection); ATA, American Thyroid Association, determined according to the 8th edition of the American Joint Committee on Cancer/Union for International Cancer Control (tumor-node-metastasis) TNM staging system; CHEK2 WT (wild type), cases without the following mutations: I157T, 1100delC, IVS2 + 1G > A, del5395; SD, standard deviation; NED, no evidence of disease.
Table 2. Relationship between clinicopathological characteristics and p53 expression, CHK2 expression, CHEK2 gene copy deletion, TP53 deletion, and p53 expression together with TP53 deletion in the tumor tissues of patients with and without germline CHEK2 mutations.
Variablep53, n = 156 (100%)CHK2, n = 156 (100%) CHEK2 (FISH), n = 151 (100%) TP53 (FISH), n = 151 (100%) Positive p53 with TP53 Deletion (FISH)
Positive n = 8 (5.1%)High Expression n = 23 (14.7%)Deletion n = 44 (29.1%)Deletion n = 7 (4.6%)n = 15 out of 151 (9.9%)
OR (95% CI)pOR (95% CI)pOR (95% CI)pOR (95% CI)pOR (95% CI)p
Sex
Female vs. maleNA (0 in cell) 1.44 (0.31–6.71)0.6451.08 (0.36–3.23)0.8921.09 (0.13–9.24)0.938NA (0 in cell)
Age group
≥55 years vs. <55 years2.99 (0.69–13.00)0.1450.55 (0.20–1.49)0.2380.75 (0.36–1.58)0.4513.92 (0.94–16.35)0.0613.03 (1.02–9.05)0.047
Tumor stage
pT1a vs. pT1b, pT2, pT3a, pT3bNA (0 in cell) 0.96 (0.11–8.38)0.9720.97 (0.18–5.21)0.9730.81 (0.21–3.16)0.7660.99 (0.33–2.93)0.982
TNM (8th edition)
TNM II vs. TNM INA (0 in cell) 1.17 (0.24–5.73)0.8450.52 (0.11–2.50)0.4141.65 (0.19–14.54)0.6520.90 (0.11–7.56)0.923
Multifocality
Yes vs. no0.69 (0.14–3.57)0.6620.92 (0.35–2.39)0.8571.00 (0.47–2.13)0.9960.62 (0.12–3.08)0.5550.52 (0.14–1.95)0.334
Lymph node metastasis *
N1a, N1b vs. N0b, N0aNA (0 in cell) 0.95 (0.33–2.78)0.9311.02 (0.44–2.35)0.9680.40 (0.05–3.29)0.3920.21 (0.03–1.69)0.144
Distant metastasis
M1 vs. M0NA (0 in cell) NA (0 in cell) NA (0 in cell) NA (0 in cell)0.993NA (0 in cell)
Tumor diameter
>10 and ≤20 mm vs. ≤10 mm1.84 (0.41–8.18)0.4222.80 (1.00–7.88)0.0510.78 (0.31–1.95)0.5921.84 (0.41–8.21)0.4221.75 (0.54–5.70)0.351
>20 and ≤40 mm vs. ≤10 mmNA (0 in cell) 2.10 (0.65–6.83)0.2171.31 (0.52–3.34)0.5680.72 (0.08–6.43)0.7660.38 (0.05–3.15)0.370
>40 mm vs. ≤10 mmNA (0 in cell) NA (0 in cell) NA (0 in cell) NA (0 in cell) NA (0 in cell)
Papillary cancer histologic variant
Follicular vs. Classic1.24 (0.23–6.68)0.8051.02 (0.34–3.05)0.9691.24 (0.54–2.86)0.6180.44 (0.05–3.69)0.4470.95 (0.25–3.68)0.941
Other ** aggressive vs. ClassicNA (0 in cell) 6.13 (0.80–46.91)0.0810.86 (0.09–8.63)0.9004.67 (0.43–50.91)0.2063.17 (0.30–33.37)0.337
Other *** non-aggressive vs. Classic2.27 (0.24–21.56)0.4760.68 (0.08–5.77)0.7251.29 (0.30–5.52)0.728NA (0 in cell) 1.19 (0.13–10.49)0.877
Extrathyroidal extension
Micro and gross vs. negative1.31 (0.25–6.83)0.7481.09 (0.37–3.20)0.8751.45 (0.63–3.35)0.3851.11 (0.22–5.65)0.8970.68 (0.20–2.31)0.537
Vascular invasion
Yes vs. noNA (0 in cell) 1.31 (0.27–6.50)0.7392.62 (0.72–9.53)0.1458.38 (1.76–39.80)0.0084.00 (0.94–17.10)0.061
Margin status
R1 vs. R0NA (0 in cell) 0.65 (0.14–3.02)0.5830.85 (0.29–2.53)0.7720.92 (0.11–7.81)0.9380.50 (0.06–4.05)0.516
ATA
Low vs intermediate, high1.01 (0.23–4.41)0.9850.62 (0.25–1.50)0.2871.05 (0.50–2.17)0.9060.72 (0.19–2.81)0.6391.55 (0.53–4.54)0.421
Response to therapy
Excellent vs. othersNA (0 in cell) 0.28 (0.11–0.72)0.0090.85 (0.34–2.14)0.7311.63 (0.19–13.61)0.6530.33 (0.04–2.66)0.300
Radioactive iodine (I-131) therapy
Yes vs. no0.66 (0.15–2.89)0.5812.12 (0.68–6.61)0.1970.72 (0.34–1.53)0.3913.48 (0.42–28.64)0.2471.15 (0.34–3.81)0.824
Number of I-131 courses
2–9 courses vs. 0–1 course2.75 (0.51–14.79)0.2390.70 (0.15–3.25)0.6462.16 (0.79–5.89)0.1340.92 (0.11–7.81)0.9382.02 (0.51–7.97)0.317
Final follow-up
NED vs. othersNA (0 in cell) 0.17 (0.05–0.62)0.0070.96 (0.24–3.88)0.9510.54 (0.06–4.82)0.5820.99 (0.12–8.42)0.994
Follow-up recurrence
Yes vs. noNA (0 in cell) 1.47 (0.16–13.74)0.738NA (0 in cell) NA (0 in cell) NA (0 in cell)
Death
Yes vs. noNA (0 in cell) NA (0 in cell) 0.60 (0.07–5.51)0.6514.31 (0.43–43.20)0.2142.36 (0.25–22.58)0.457
* N0a, one or more cytologically or histologically confirmed benign lymph nodes; N0b, no radiologic or clinical evidence of locoregional lymph node metastasis; N1a–N1b, metastasis to regional lymph nodes; **diffuse sclerosing (n = 3); tall cell variant (n = 1); *** oxyphilic, Warthin-like (n = 2); mixed variant (classic and follicular) (n = 5); R1-microscopically positive margin (resection); ATA, American Thyroid Association, determined according to the 8th edition of the American Joint Committee on Cancer/Union for International Cancer Control (tumor-node-metastasis) TNM staging system; NED, no evidence of disease.
Table 3. The prevalence of prognostically favorable and predictive results, defined as category of interest in groups of PTC patients with and without CHEK2 germline mutations.
GroupCategory of InterestCountsTotalProportion
Response to therapyExcellent
Low CHK21131330.850
High CHK2 14230.609
Final follow-up NED
Low CHK21271330.955
High CHK2 18230.783
Tumor diameter ≤10 mm
Low CHK2841080.788
High CHK2 10180.556
Papillary cancer histologic variantClassic
Low CHK292940.979
High CHK2 15170.882
Age <55 years
No loss of TP53 941420.662
Deletion of TP53 390.333
Vascular invasionNo
No loss of TP53 1341420.944
Deletion of TP53 690.667
Age <55 years
Negative p53 + no loss of TP53911360.669
Positive p53 + Deletion of TP536150.400
Vascular invasionNo
Negative p53 + no loss of TP531281360.941
Positive p53 + Deletion of TP5312150.800
CHK2 loss/low/high, CHK2 loss/low/high expression as determined by IHC on tumor tissue; IHC, immunohistochemistry; no loss of TP53/deletion of TP53, no loss/deletion of gene copy in tumor tissue as determined by FISH; FISH, fluorescence in situ hybridization; NED, no evidence of disease.
Table 4. Relationships between the germline CHEK2 mutation and p53 expression, CHK2 expression, CHEK2 and TP53 gene statuses, and p53 expression together with TP53 gene status (FISH) in tumor tissues from PTC patients with and without CHEK2 germline mutations.
VariableCHEK2 Truncating vs. WTCHEK2 Missense vs. WTCHEK2 Truncating vs. WT + Missense I157T
OR (95% CI)pOR (95% CI)pOR (95% CI)p
p53 expression
Positive vs. negative0.42 (0.04–4.19)0.4591.17 (0.25–5.47)0.8450.35 (0.04–2.92)0.331
CHK2 expression
High vs. low3.48 (0.99–12.30)0.0522.12 (0.61–7.33)0.2362.24 (0.90–5.58)0.083
CHEK2 gene status
Deletion vs. no loss
of gene copy
62.67 (16.37–239.93)<0.0011.31 (0.35–4.91)0.69357.23 (19.36–169.24)<0.001
TP53 gene status
Deletion vs. no loss
of gene copy
NA (0 in cell) NA (0 in cell) NA (0 in cell)
p53 expression and TP53 gene status
Positive vs. negative and
deletion vs. no loss of gene copy
3.47 (0.84–14.37)0.0871.17 (0.25–5.47)0.8453.33 (1.13–9.84)0.029
Abbreviations: CHEK2 truncating, germline heterozygous truncating CHEK2 mutation variants (1100delC, IVS2 + 1G > A, del5395); WT, wild type.
Table 5. The incidence of unfavorable prognostic factors, such as deletion of the CHEK2 gene copy, higher CHK2 expression, and p53 expression together with deletion of the TP53 gene copy by FISH, in tumor tissues from PTC patients with and without the CHEK2 germline mutations.
VariableCHEK2 Truncating
and WT
CHEK2 Truncating and
WT + Missense I157T
GroupCountsTotalProportionCountsTotalProportion
CHEK2 deletionNo mutation4510.078101110.090
Mutation32380.84234400.850
High expression
of CHK2
No mutation4520.077131120.116
Mutation9400.22510440.227
Positive p53 and
TP53 deletion
No mutation3510.05971110.063
Mutation7380.1848400.200
Abbreviations: TP53 deletion, deletion of a TP53 gene copy in tumor tissue as determined by FISH; FISH, fluorescence in situ hybridization; positive p53, p53 expression as determined by IHC; IHC, immunohistochemistry; CHEK2 truncating, germline heterozygous truncating CHEK2 mutation variants (1100delC, IVS2 + 1G > A, del5395); WT, wild type.
Disclaimer/Publisher’s Note: The statements, opinions and data contained in all publications are solely those of the individual author(s) and contributor(s) and not of MDPI and/or the editor(s). MDPI and/or the editor(s) disclaim responsibility for any injury to people or property resulting from any ideas, methods, instructions or products referred to in the content.

