
What Does Atypical Chronic Lymphocytic Leukemia Really Mean? A Retrospective Morphological and Immunophenotypic Study
 , , , , , , and
Abstract
:Simple Summary
Abstract
1. Introduction
2. Materials and Methods
Statistics
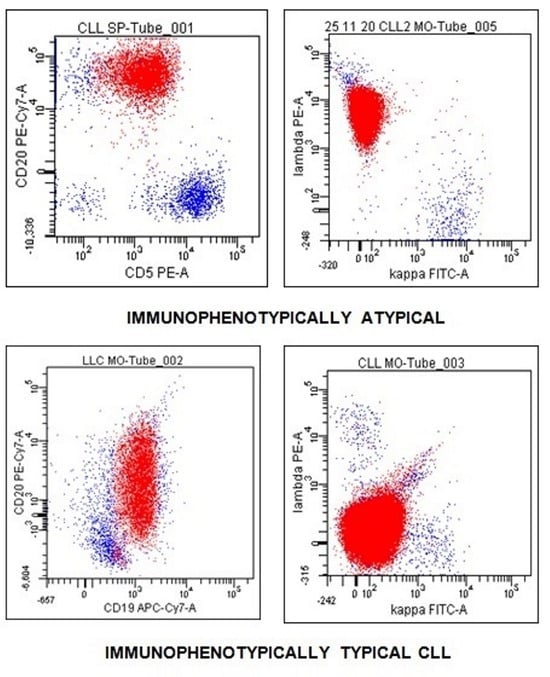
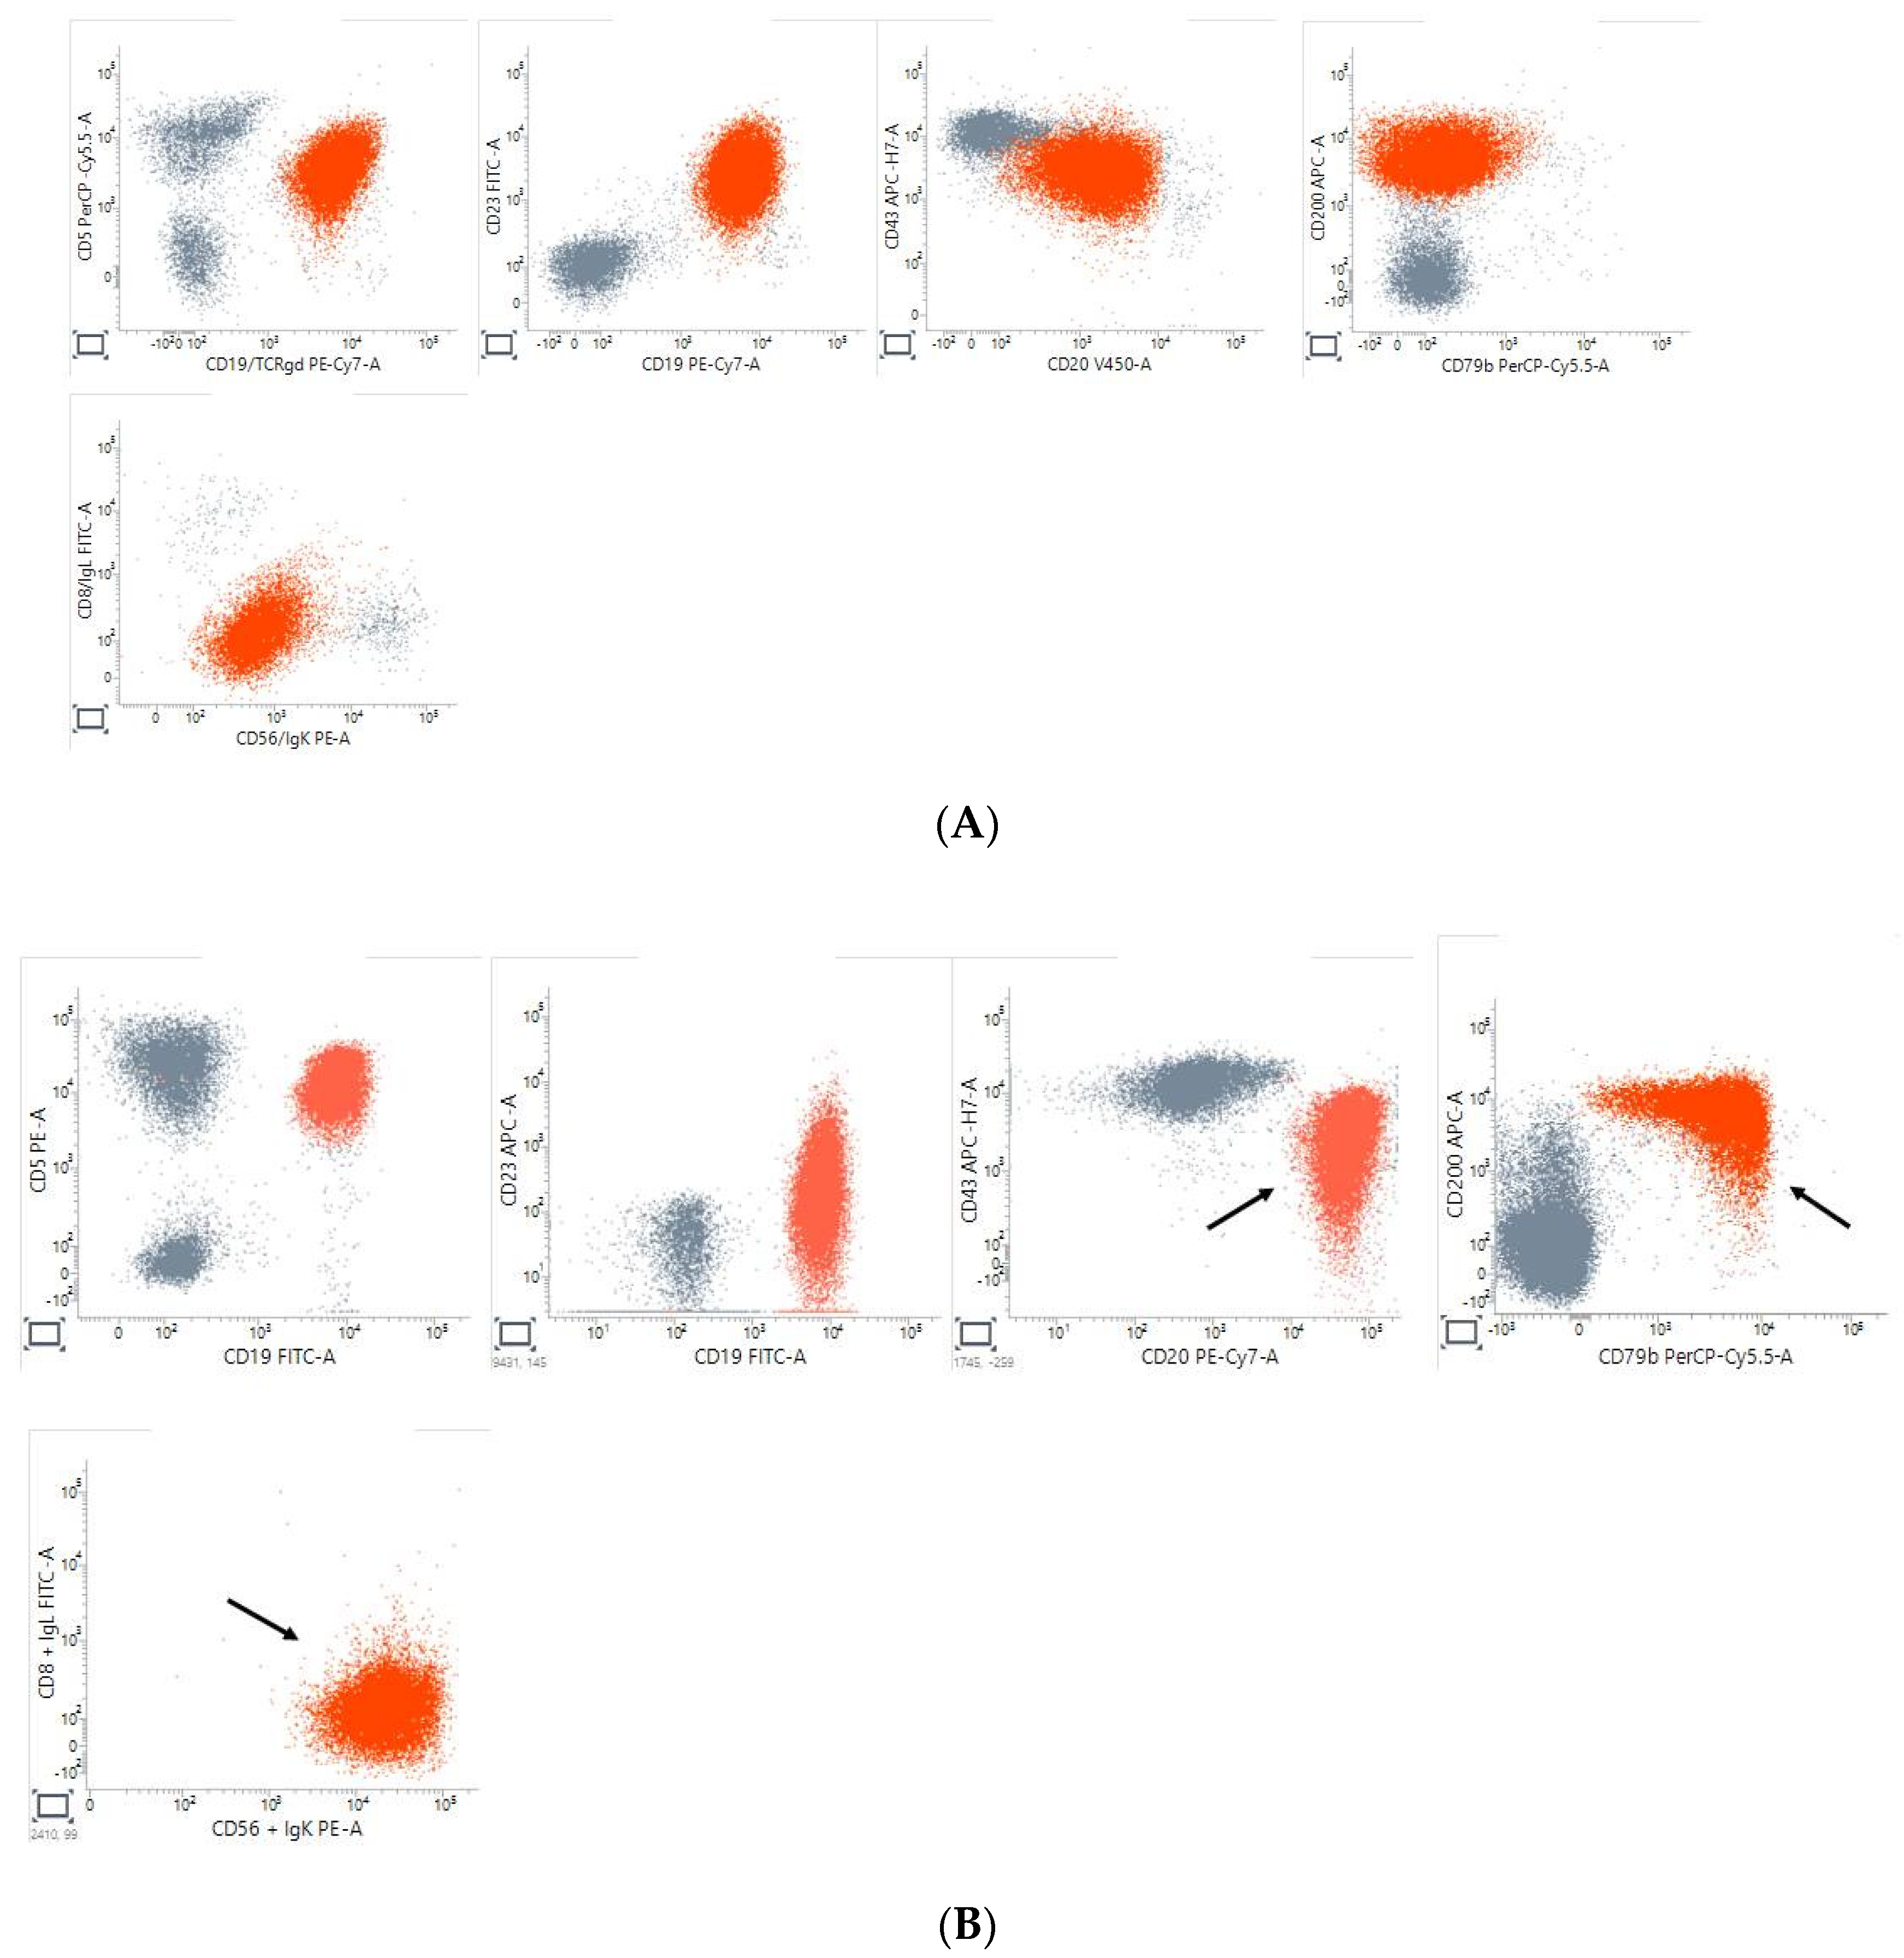
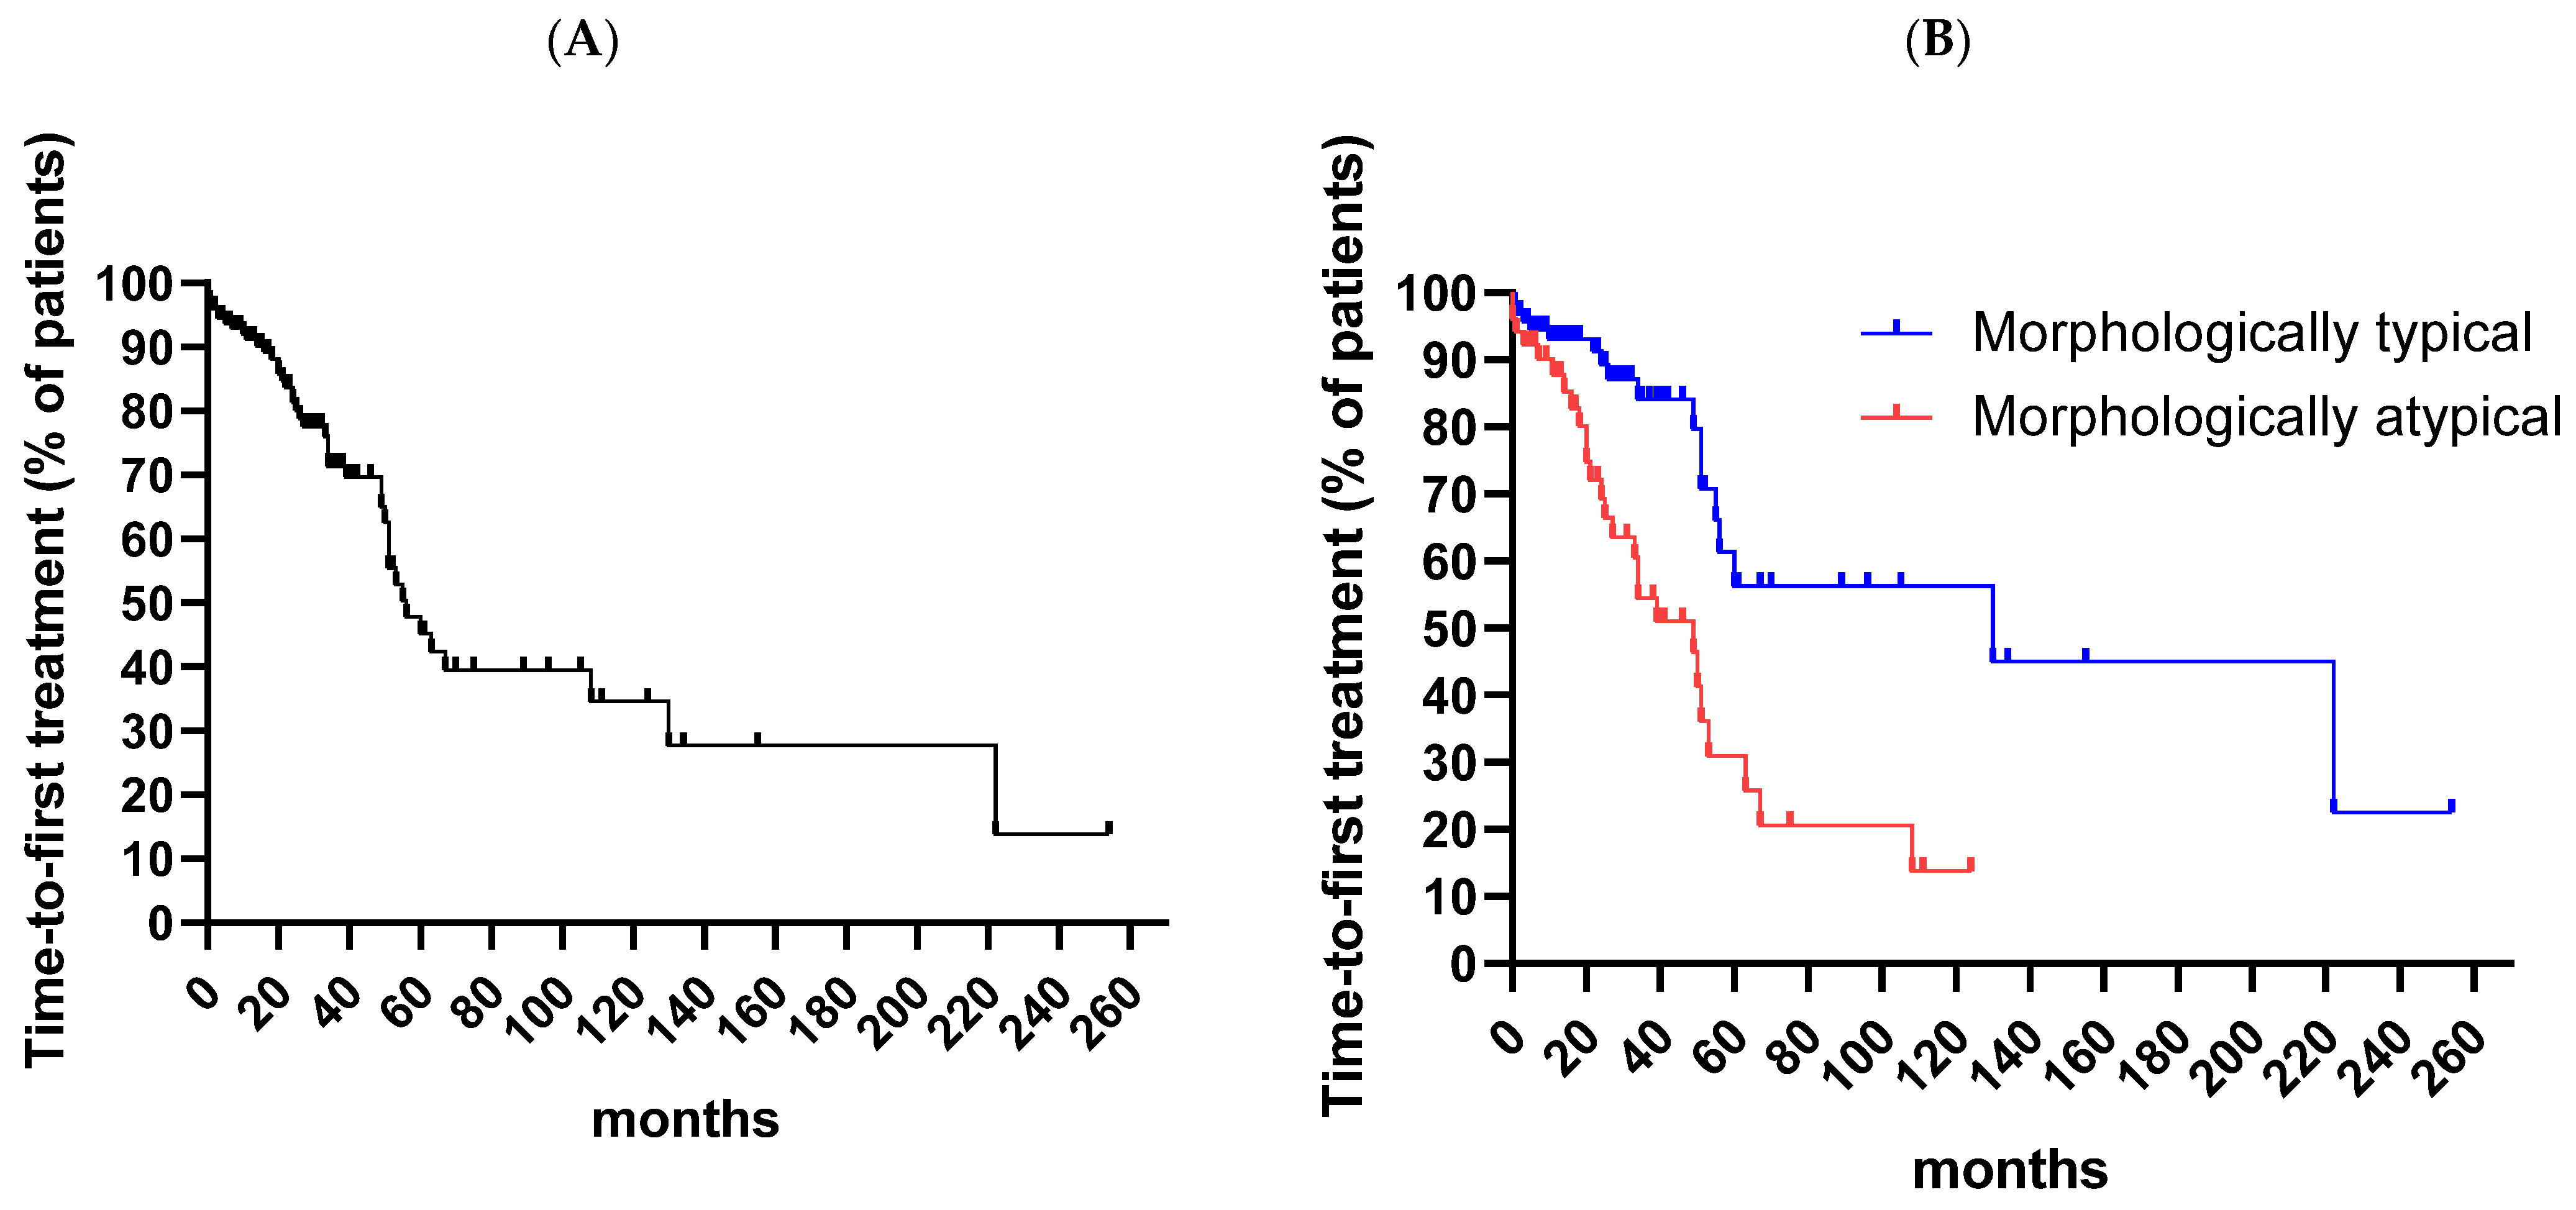
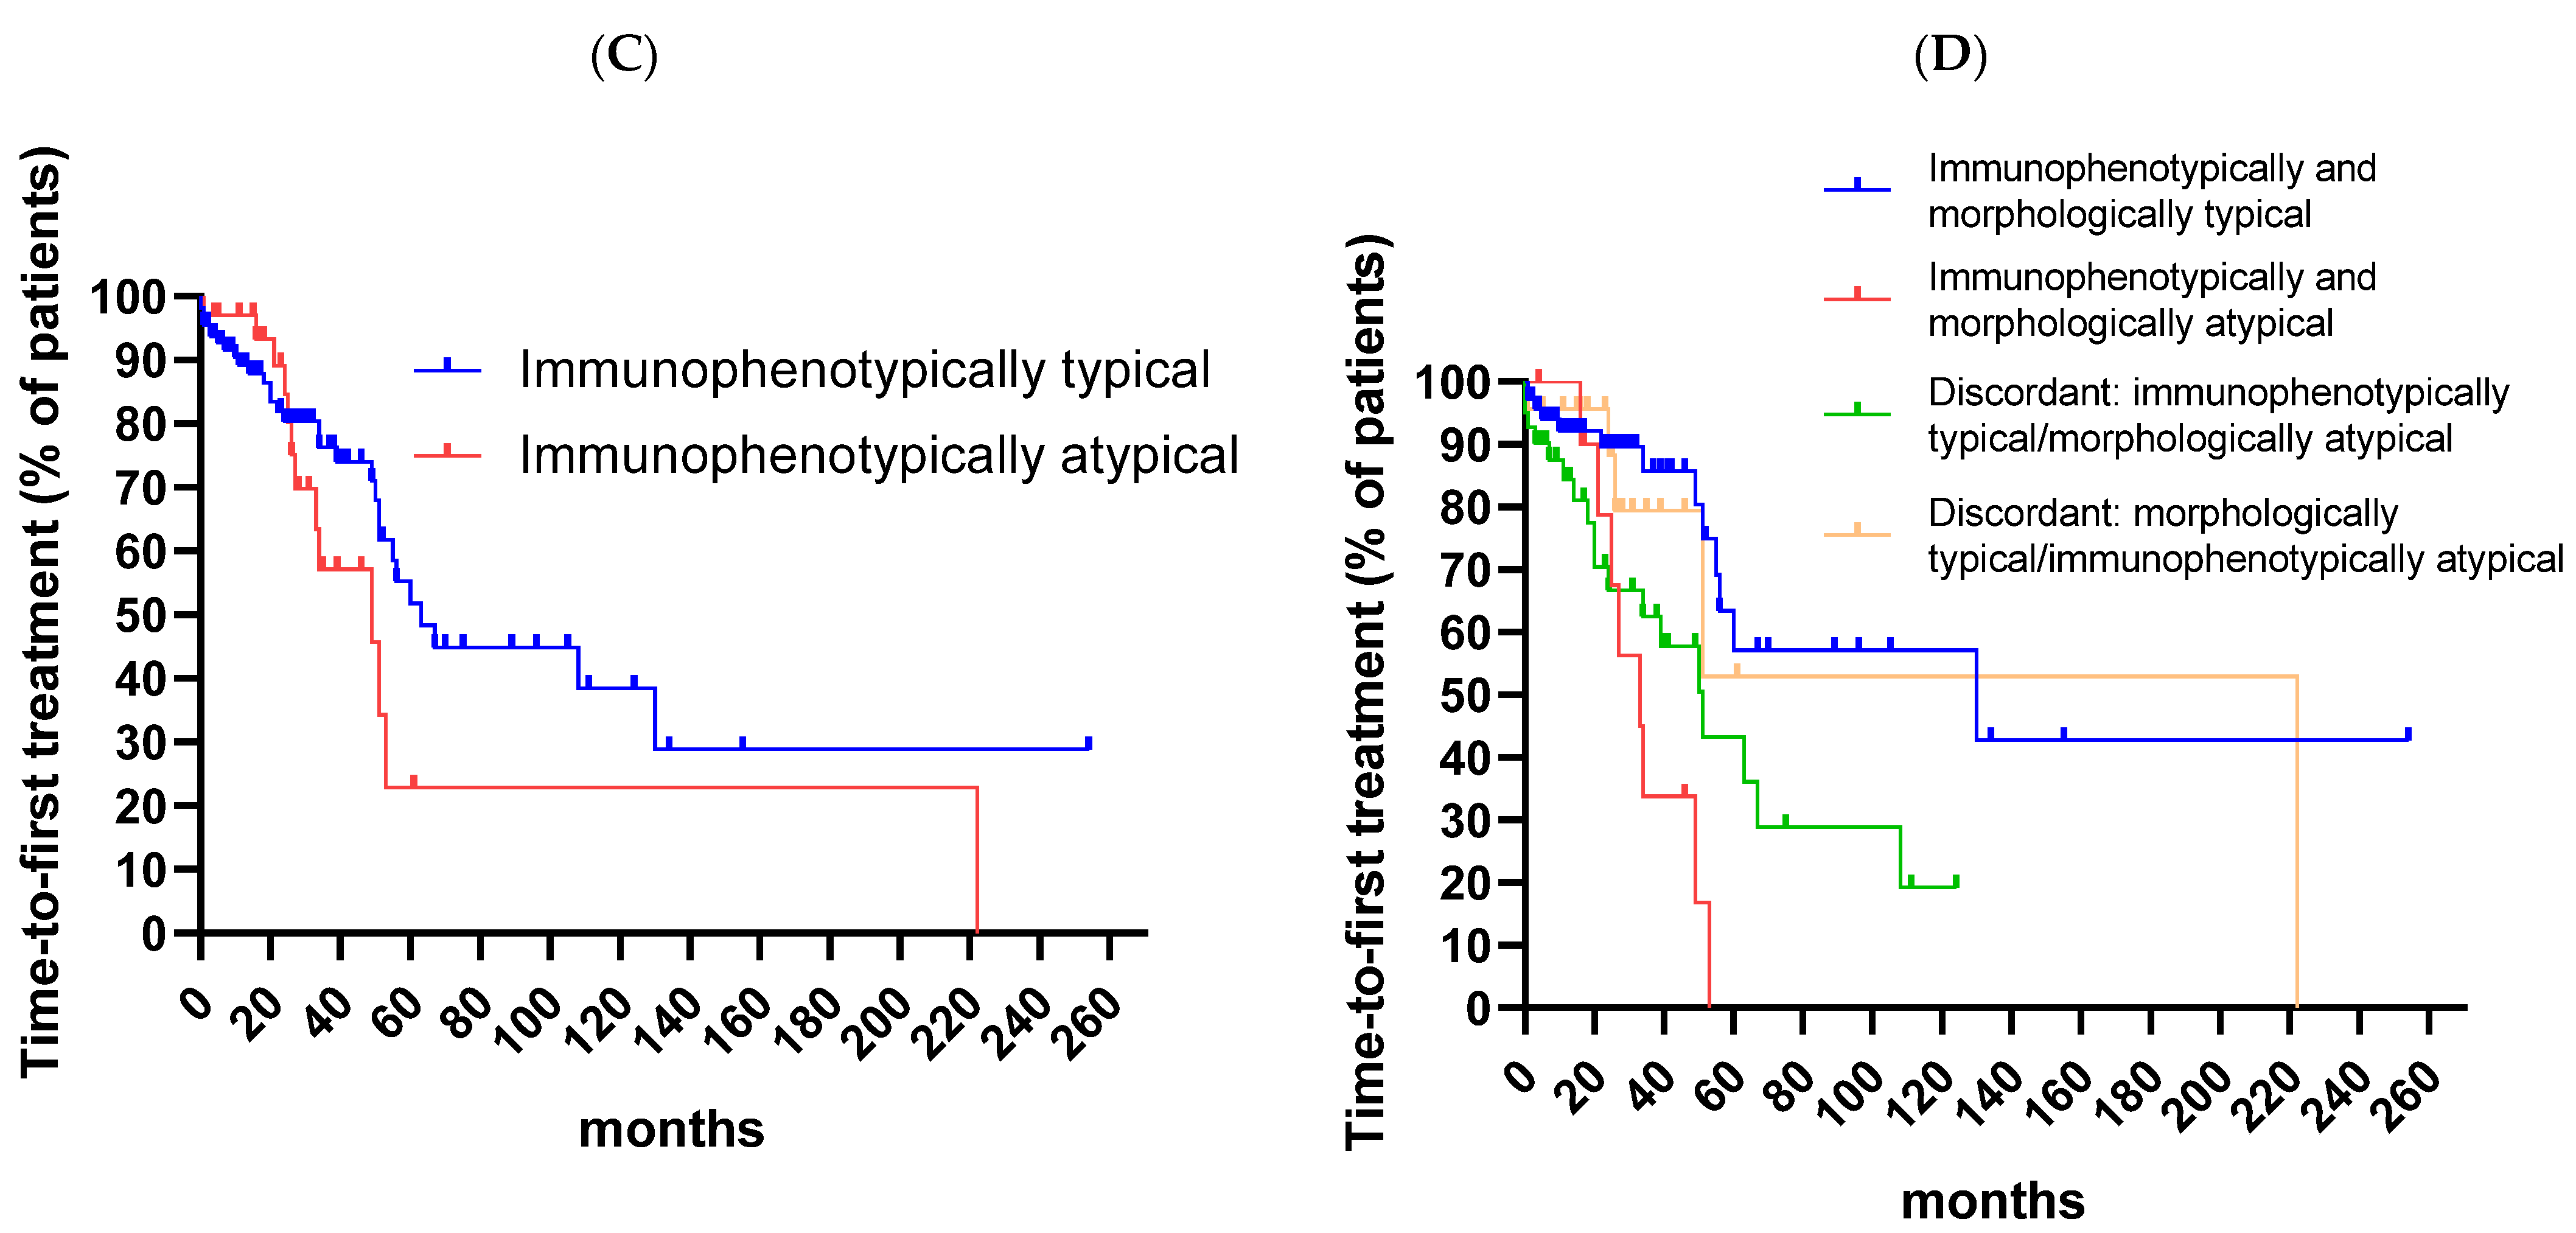
3. Results
4. Discussion
5. Conclusions
Author Contributions
Funding
Institutional Review Board Statement
Informed Consent Statement
Data Availability Statement
Conflicts of Interest
References
- Hallek, M.; Shanafelt, T.D.; Eichorts, B. Chronic lymphocytic leukaemia. Lancet 2018, 391, 1524–1537. [Google Scholar] [CrossRef] [PubMed]
- Hallek, M.; Cheson, B.D.; Catovsky, D.; Caligaris-Cappio, F.; Dighiero, G.; Döhner, H.; Hillmen, P.; Keating, M.; Montserrat, E.; Chiorazzi, N.; et al. iwCLL guidelines for diagnosis, indications for treatment, response assessmnet, and supportive management of CLL. Blood 2018, 131, 2745–2760. [Google Scholar] [CrossRef]
- Bennett, J.M.; Catovsky, D.; Daniel, M.-T.; Flandrin, G.; Galton, D.A.G.; Gralnick, H.R.; Sultan, C. Proposals for the classification of chronic (mature) B and T lymphoid leukaemias. J. Clin. Pathol. 1989, 42, 567–584. [Google Scholar] [CrossRef] [PubMed]
- D’Arena, G.; Keating, M.J.; Carotenuto, M. Chronic lymphoproliferative discorde: An integrated point of view for the differential diagnosis. Leuk. Lymphoma 2000, 36, 225–237. [Google Scholar] [CrossRef] [PubMed]
- Matutes, E.; Owusu-Ankomah, K.; Morilla, R.; Garcia, M.J.; Houlihan, A.; Que, T.H.; Catovsky, D. The immunological profile of B-cell disorders and proposal of a scoring system for the diagnosis of CLL. Leukemia 1994, 8, 1640–1645. [Google Scholar] [PubMed]
- Moreau, E.J.; Matutes, E.; A’Hern, R.P.; Morilla, R.M.; Owusu-Ankomah, K.A.; Seon, B.K.; Catovsky, D. Improvement of the chronic lymphocytic leukemia scoring system with the monoclonal antibody SN8 (CD79b). Am. J. Clin. Pathol. 1997, 108, 378–382. [Google Scholar] [CrossRef]
- Kohnke, T.; Wittmann, V.K.; Bücklein, V.L.; Lichtenegger, F.; Pasalic, Z.; Hiddemann, W.; Spiekermann, K.; Subklewe, M. Diagnosis of CLL revisited: Increased specificity by a modified five-marker scoring system including CD200. Br. J. Haematol. 2017, 179, 480–487. [Google Scholar] [CrossRef]
- D’Arena, G.; Vitale, C.; Rossi, G.; Coscia, M.; Omedè, P.; D’Auria, F.; Statuto, T.; Valvano, L.; Ciolli, S.; Gilestro, M.; et al. CD200 included in a 4-marker modified Matutes score provides optimal sensitivity and specificity for the diagnosis of chronic lymphocytic leukaemia. Hematol. Oncol. 2018, 36, 543–546. [Google Scholar] [CrossRef]
- Sorigue, M.; Junca, J.; Sarrate, E.; Grau, J. Expression of CD43 in chronic lymphoproliferative leukemia. Cytometry B Clin. Cytom. 2018, 94, 136–142. [Google Scholar] [CrossRef]
- Finn, W.G.; Thangavelu, M.; Yelavarthi, K.K.; Goolsby, C.L.; Tallman, M.S.; Traynor, A.; Peterson, L.C. Karyotype correlates with peripheral blood morphology and immunophenotype in chronic lymphocytic leukemia. Am. J. Clin. Pathol. 1996, 105, 458–467. [Google Scholar] [CrossRef]
- Ting, Y.S.; Smith, S.A.B.C.; Brown, D.A.; Dodds, A.J.; Fay, K.C.; Ma, D.D.F.; Milliken, S.; Moore, J.J.; Sewell, W.A. CD200 is a useful diagnostic marker for identifying atypical chronic lymphocytic leukemia by flow cytometry. Int. J. Lab. Hematol. 2018, 40, 533–539. [Google Scholar] [CrossRef] [PubMed]
- Dohner, H.; Stilgenbauer, S.; Benner, A.; Leupolt, E.; Krober, A.; Bullinger, L.; Dohner, K.; Bentz, M.; Lichter, P. Genomic aberrations and survival in chronic lymphocytic leukemia. N. Engl. J. Med. 2000, 343, 1910–1916. [Google Scholar] [CrossRef]
- Statuto, T.; Valvano, L.; Calice, G.; Villani, O.; Pietrantuono, G.; Mansueto, G.; D’Arena, G.; Vita, G.; Lalinga, V.; Possidente, L.; et al. Cytofluorimetric and immunohistochemical comparison for detecting bone marrow infiltration in non-Hodgkin lymphomas: A study of 354 patients. Leuk. Res. 2020, 88, 106267. [Google Scholar] [CrossRef] [PubMed]
- Criel, A.; Verhoef, G.; Vlietinck, R.; Mecucci, C.; Billiet, J.; Michaux, L.; Meeus, P.; Louwagie, A.; Van Orshoven, A.; Van Hoof, A.; et al. Further characterization of morphologically defined typical and atypical CLL: A clinical, immunophenotypic, cytogenetic and prognostic study on 390 cases. Br. J. Haematol. 1997, 97, 383–391. [Google Scholar] [CrossRef] [PubMed]
- D’Arena, G.; Dell’Olio, M.; Musto, P.; Cascavilla, N.; Perla, G.; Savino, L.; Greco, M.M. Morphologically typical and atypical B-cell chronic lymphocytic leukemias display a different pattern of surface antigenic density. Leuk. Lymphoma 2001, 42, 649–654. [Google Scholar] [CrossRef] [PubMed]
- Schwarz, J.; Mikulenkova, D.; Cermakova, M.; Polanska, V.; Michalova, K.; Marinov, I.; Campr, V.; Ransdorfova, S.; Markova, J.; Pavlistova, L.; et al. Prognostic relevance of the FAB morphological criteria in chronic lymphocytic leukemia: Correlations with IgVH gene mutational status and other prognostic markers. Neoplasma 2006, 53, 219–225. [Google Scholar] [PubMed]
- Habib, L.K.; Finn, W.G. Unsupervised immunophenotypic profiling of chronic lymphocytic leukemia. Cytometry B Clin. Cytom. 2006, 70B, 124–135. [Google Scholar] [CrossRef]
- Lanier, L.L.; Allison, J.O.; Phillips, J.H. Correlation of cell surface antigen expression on human thymocytes by multi-color flow cytometric analysis: Implications for differentiation. J. Immunol. 1986, 137, 2501–2507. [Google Scholar] [CrossRef]
- Scott, C.S.; Limbert, H.J.; MacKarill, I.D.; Roberts, B.E. Membrane phenotypic studies in B cell lymphoproliferative disorders. J. Clin. Pathol. 1985, 38, 995–1001. [Google Scholar] [CrossRef] [PubMed]
- Loken, M.R.; Shah, V.O.; Dattilio, K.L.; Civin, C.I.; Flow cytometric analysis of human bone marrow. II. Normal B lymphocyte development. Blood 1987, 70, 1316–1324. [Google Scholar] [CrossRef]
- Almasri, N.M.; Duque, R.E.; Iturraspe, J.; Everett, E.; Braylan, R.C. Reduced expression of CD20 antigen as a characteristic marker for chronic lymphocytic leukemia. Am. J. Hematol. 1992, 40, 259–263. [Google Scholar] [CrossRef] [PubMed]
- Huang, J.; Fan, G.; Zhong, Y.; Gatter, K.; Braziel, R.; Gross, G.; Bakke, A. Diagnostic usefulness of aberrant CD22 expression in differentiating neoplastic cells of B-Cell chronic lymphoproliferative disorders from admixed benign B cells in four-color multiparameter flow cytometry. Am. J. Clin. Pathol. 2005, 123, 826–832. [Google Scholar] [CrossRef] [PubMed]
- Sarfati, M.; Fournier, S.; Wu, C.Y.; Delespesse, G. Expression, regulation and function of human Fc epsilon RII (CD23) antigen. Immunol. Res. 1992, 11, 260–272. [Google Scholar] [CrossRef] [PubMed]
- Dorfman, D.M.; Pinkus, G.S. Distinction between small lymphocytic and mantle cell lymphoma by immunoreactivity for CD23. Mod. Pathol. 1994, 7, 326–331. [Google Scholar]
- Deaglio, S.; Mehta, K.; Malavasi, F. Human CD38: A (r)evolutionary story of enzymes and receptors. Leuk. Res. 2001, 25, 1–12. [Google Scholar] [CrossRef] [PubMed]
- Malavasi, F.; Deaglio, S.; Damle, R.; Cutrona, G.; Ferrarini, M.; Chiorazzi, N. CD38 and chronic lymphocytic leukemia: A decade later. Blood 2011, 118, 3470–3478. [Google Scholar] [CrossRef] [PubMed]
- Rosenstein, Y.; Santana, A.; Pedraza-Alva, G. CD43, a molecule with multiple functions. Immunol. Res. 1999, 20, 89–99. [Google Scholar] [CrossRef]
- Postigo, A.A.; Pulido, R.; Campanero, M.R.; Acevedo, A.; García-Pardo, A.; Corbi, A.L.; Sanchez-Madrid, F.; De Landazuri, M.O. Differential expression of VLA-4 integrin by resident and peripheral blood B lymphocytes. Acquisition of functionally active alpha 4 beta 1-fibronectin receptors upon B cell activation. Eur. J. Immunol. 1991, 21, 2437–2445. [Google Scholar] [CrossRef]
- Bulian, P.; Shanafelt, T.D.; Fegan, C.; Zucchetto, A.; Cro, L.; Nückel, H.; Baldini, L.; Kurtova, A.V.; Ferrajoli, A.; Burger, J.A.; et al. CD49d is the strongest flow cytometry-based predictor of overall survival in chronic lymphocytic leukemia. J. Clin. Oncol. 2014, 32, 897–904. [Google Scholar] [CrossRef]
- Okazaki, M.; Luo, Y.; Han, T.; Yoshida, M.; Seon, B.K. Three new monoclonal antibodies that define a unique antigen associated with prolymphocytic leukemia/non-Hodgkin’s lymphoma and are effectively internalized after binding to the cell surface antigen. Blood 1993, 81, 84–94. [Google Scholar] [CrossRef]
- Wright, G.J.; Jones, M.; Puklavec, M.J.; Brown, M.H.; Barclay, A.N. The unusual distribution of the neuronal/lymphoid cell surface CD200 (OX2) glycoprotein is conserved in humans. Immunology 2001, 102, 173–179. [Google Scholar] [CrossRef] [PubMed]
- D’Arena, G.; De Feo, V.; Pietrantuono, G.; Seneca, E.; Mansueto, G.; Villani, O.; La Rocca, F.; D’Auria, F.; Statuto, T.; Valvano, L.; et al. CD200 and chronic lymphocytic leukemia: Biological and clinical relevance. Front. Oncol. 2020, 10, 584427. [Google Scholar] [CrossRef]
- Catovsky, D.; Cherchi, M.; Brookss, D.; Bradely, J.; Korsmeyer, S.J.Z.; Hieter, P.A.; Ravetch, J.V.; Poplack, D.G.; Waldmann, T.A.; Leder, P. Developmental hierarchy of immunoglobulin gene rearrangements in human leukemic pre-B-cells. Proc. Natl. Acad. Sci. USA 1981, 78, 7096–7100. [Google Scholar]
- Huh, Y.O.; Pugh, W.C.; Kantarjian, H.M.; Stass, S.A.; Cork, A.; Trujillo, J.M.; Keating, M.J. Detection of subgroups of chronic B-cell leukemias by FMC7 monoclonal antibody. Am. J. Clin. Pathol. 1994, 101, 283–289. [Google Scholar] [CrossRef] [PubMed]
- Witzig, T.E.; Li, C.Y.; Tefferi, A.; Katzmann, J.A. Measurement of the intensity of cell surface antigen expression in B-cell chronic lymphocytic leukemia. Am. J. Clin. Pathol. 1994, 101, 312–317. [Google Scholar] [CrossRef]
- Marionneaux, S.; Maslak, P.; Keohane, E.M. Morphologic identification of atypical chronic lymphocytic leukemia by digital microscopy. Int. J. Lab. Hematol. 2014, 36, 459–464. [Google Scholar] [CrossRef]
- Lesesve, J.-F.; Tardy, S.; Frotscher, B.; Latger-Cannard, V.; Feugier, P.; De Carvalho Bittencourt, M. Combination of CD160 and CD200 as a useful tool for differential diagnosis between chronic lymphocytic leukemia and other mature B-cell neoplasms. Int. J. Lab. Hematol. 2015, 37, 486–494. [Google Scholar] [CrossRef]
- Sandes, A.F.; Chauffaille, M.L.; Oliveira, C.R.M.C.; Maekawa, Y.; Tamashiro, N.; Takao, T.T.; Ritter, E.C.; Rizzatti, E.G. CD200 has an important role in the differential diagnosis of mature B-cell neoplasms by multiparameter flow cytometry. Cytometry B Clin. Citom. 2014, 86, 98–105. [Google Scholar] [CrossRef]

| Classification | Typical | Atypical |
|---|---|---|
| Criteria | >90% of lymphocytes are small-to-medium sized with relatively normal morphology, except for a characteristically clumped, chunky chromatin pattern. Prolymphocytes and/or large cells < 10% of circulating lymphocytes | Small lymphocytes plus >10% and <55% prolymphocytes; Mixed-cell subtype: >15% lymphoplasmacytoid cells, cells exhibiting nuclear indentations/clefts, or both with; prolymphocytes < 10% of cells |
| Cell Type (Disease) | Size | Chromatin | Nucleolus | Cytoplasm | Other Features |
|---|---|---|---|---|---|
| Small lymphocytes (CLL) | <2 red blood cells | Clumped in coarse blocks | Absent | Scanty high nuclear: cytoplasmic ratio | Regular nuclear outline |
| Large lymphocytes (CLL, mixed cell) | >2 red blood cells | Clumped | Inconspicuous or small | Low nuclear: cytoplasmic ratio, variable | Variable size |
| Prolymphocytes (PLL) | >2 red blood cells | Clumped | One, prominent | Low nuclear: cytoplasmic ratio | Variable size |
| Pleomorphic prolymphocytes (CLL/PL) | >2 red blood cells | Clumped | Central and prominent | Variable nuclear: cytoplasmic ratio | Variable size |
| Cleft cells (FL) | 1–2 red blood cells | Homogeneously coarse | Absent or one or two inconspicuous | Scanty; not visible or narrow rim | One or two shallow or deep narrow nuclear clefts from angular base |
| Parameters | |
|---|---|
| Age, median (range) | 67 (38–90) (n = 153) |
| Males, number (%) | 94 (61%) (n = 153) |
| Rai stage, number (%) | (n = 152) |
| 0 | 82 (54%) |
| I | 25 (10%) |
| II | 45 (30%) |
| III | 0 |
| IV | 10 (7%) |
| Binet stage, number (%) | (n = 152) |
| A | 93 (61%) |
| B | 49 (32%) |
| C | 10 (7%) |
| White blood cell count, ×109/L, median (range) | 17.7 (1.2–230) (n = 151) |
| Lymphocyte count, ×109/L, median (range) | 12.4 (4.3–200) (n = 151) |
| Hemoglobin, g/dL, median (range) | 13.8 (8–16.8) (n = 149) |
| Platelet count, ×109/L, median (range) | 177 (33–462) (n = 149) |
| Beta2-microglobulin, mg/L, median (range) | 2.5 (1.4–10.9) (n = 96) |
| Lactate dehydrogenase, UI/L, median (range) | 186 (126–909) (n = 113) |
| IGHV unmutated, number (%) | 50 (40%) (n = 125) |
| FISH abnormalities, number (%) * | (n = 128) |
| Negative | 33 (26%) |
| Deletion 13q | 63 (49%) |
| Trisomy 12 | 21 (16%) |
| Deletion 11q | 8 (6%) |
| Deletion 17p | (2%) |
| CD5 positive, number (%) | 153 (100%) (n = 153) |
| CD23 positive, number (%) | 148 (97%) (n = 153) |
| FMC7 positive, number (%) | 34 (25%) (n = 135) |
| CD79b positive, number (%) | 81 (54%) (n = 150) |
| CD200 positive, number (%) | 146 (100%) (n = 146) |
| CD20 expression, number (%) | (n = 151) |
| low | 89 (59%) |
| intermediate | 41 (27%) |
| high | 21 (14%) |
| Surface immunoglobulin light chain intensity, number (%) | (n = 150) |
| low | 90 (60%) |
| intermediate | 46 (31%) |
| high | 14 (9%) |
| CD43 positive, number (%) | 141 (93%) (n = 151) |
| CD38 positive, number (%) | 53 (48%) (n = 111) |
| CD49d positive, number (%) | 62 (48%) (n = 129) |
| Monoclonal Antibody | Significance | References |
|---|---|---|
| CD5 | Thymocytes, mature T-cells, subpopulations of B cells | [18,19] |
| CD20 | Subpopulations of precursor B cells, B cells | [20,21] |
| CD22 | Surface expression in mature B cells, cytoplasmic expression in precursor B cells | [20,22] |
| CD23 | Subpopulations of B cells | [23,24] |
| CD38 | Most thymocytes, activated mature T lymphocytes, B lymphocyte precursors, germinal center B cells, plasma cells | [25,26] |
| CD43 | T cells, natural killer (NK) cells, pre-B, and activated B cells, granulocytes | [9,27] |
| CD49d | T and B lymphocytes and weakly on monocytes | [28,29] |
| CD79b | Surface of Ig-positive B cells and cytoplasm of Ig-negative B cell precursors | [6,30] |
| CD200 | Thymocytes, CD19+ B cells, subpopulations of T cells | [7,31,32] |
| FMC7 | Differentiated B lymphocytes | [33,34] |
| Kappa–Lambda light chain | Surface of mature B cells | [33,35] |
| MoAb | Score |
|---|---|
| CD20 high density | 1 |
| SmIg high density | 1 |
| FMC7 expression | 1 |
| CD79b expression | 1 |
| CD200 negativity | 1 |
| Parameters | Morphologically Typical CLL | Morphologically Atypical CLL | |
|---|---|---|---|
| Age, median (range) | 67 (40–90) (n = 97) | 67 (38–89) (n = 56) | NS |
| Males, number (%) | 58 (60%) (n = 97) | 36 (64%) (n = 56) | NS |
| Rai stage, number (%) | (n = 97) | (n = 55) | NS |
| 0–I | 66 (68%) | 31 (56%) | |
| II–IV | 31 (32%) | 24 (44%) | |
| Binet stage, number (%) | (n = 97) | (n = 55) | NS |
| A | 60 (62%) | 33 (60%) | |
| B | 32 (33%) | 17 (31%) | |
| C | 5 (5%) | 5 (9%) | |
| White blood cell count, ×109/L, median (range) | 17.4 (8.75–230) (n = 97) | 18.64 (1.2–93) (n = 54) | NS |
| Lymphocyte count, ×109/L, median (range) | 11.46 (5.1–200) (n = 97) | 13.4 (4.3–86.6) (n = 54) | NS |
| Hemoglobin, g/dL, median (range) | 13.7 (8–16.8) (n = 97) | 13.8 (10.7–16.6) (n = 52) | NS |
| Platelet count, ×109/L, median (range) | 175 (33–462) (n = 97) | 182 (45–337) (n = 52) | NS |
| Beta2-microglobulin, mg/L, median (range) | 2.4 (1.4–5.6) (n = 61) | 2.5 (1.5–10.9) (n = 35) | NS |
| Lactate dehydrogenase, UI/L, median (range) | 184 (126–530) (n = 68) | 190 (139–909) (n = 45) | NS |
| IGHV unmutated, number (%) | 27 (33%) (n = 82) | 23 (53%) (n = 43) | p = 0.0258 |
| FISH abnormalities, number (%) * | (n = 83) | (n = 45) | NS |
| Negative | 24 (29%) | 9 (20%) | |
| Deletion 13q | 42 (51%) | 21 (47%) | |
| Trisomy 12 | 10 (12%) | 11 (24%) | |
| Deletion 11q | 4 (5%) | 4 (9%) | |
| Deletion 17p | 3 (4%) | 0 | |
| CD5 positive, number (%) | 97 (100%) (n = 97) | 56 (100%) (n = 56) | NS |
| CD23 positive, number (%) | 96 (99%) (n = 97) | 52 (93%) (n = 56) | NS |
| FMC7 positive, number (%) | 21 (23%) (n = 93) | 13 (31%) (n = 42) | NS |
| CD79b positive, number (%) | 48 (50%) (n = 96) | 33 (61%) (n = 54) | NS |
| CD200 positive, number (%) | 94 (100%) (n = 94) | 52 (100%) (n = 52) | NS |
| CD20 expression, number (%) | (n = 97) | (n = 54) | p < 0.0001 |
| low | 72 (74%) | 17 (31%) | |
| intermediate | 18 (19%) | 23 (43%) | |
| high | 7 (7%) | 14 (26%) | |
| Surface immunoglobulin light chain intensity, number (%) | (n = 96) | (n = 54) | NS |
| low | 63 (66%) | 27 (50%) | |
| intermediate | 24 (25%) | 22 (41%) | |
| high | 9 (9%) | 9 (9%) | |
| CD43 positive, number (%) | 92 (95%) (n = 97) | 49 (91%) (n = 54) | NS |
| CD38 positive, number (%) | 26 (38%) (n = 71) | 26 (65%) (n = 40) | p < 0.0063 |
| CD49d positive, number (%) | 38 (44%) (n = 87) | 24 (57%) (n = 42) | NS |
| Parameters | Immunophenotypically Typical CLL | Immunophenotypically Atypical CLL | |
|---|---|---|---|
| Age, median (range) | 67 (38–90) (n = 117) | 69 (47–88) (n = 36) | NS |
| Males, number (%) | 72 (62%) (n = 117) | 22 (61%) (n = 36) | NS |
| Rai stage, number (%) | (n = 117) | (n = 35) | p = 0.0111 |
| 0–I | 81 (69%) | 16 (46%) | |
| II–IV | 36 (31%) | 19 (53%) | |
| Binet stage, number (%) | (n = 117) | (n = 35) | p = 0.0208 |
| A | 78 (67%) | 15 (43%) | |
| B | 31 (26%) | 18 (51%) | |
| C | 8 (7%) | 2 (6%) | |
| White blood cell count, ×109/L, median (range) | 17.9 (8.2–230) (n = 116) | 15.9 (1.2–202) (n = 35) | NS |
| Lymphocyte count, ×109/L, median (range) | 12.83 (4.9–200) (n = 116) | 10.7(4.3–139) (n = 35) | NS |
| Hemoglobin, g/dL, median (range) | 13.8 (8–16.8) (n = 114) | 13.5 (9.6–16.6) (n = 35) | NS |
| Platelet count, ×109/L, median (range) | 177 (33–462) (n = 114) | 174 (86–304) (n = 35) | NS |
| Beta2-microglobulin, mg/L, median (range) | 2.4 (1.4–10.9) (n = 72) | 2.6 (1.5-5.3) (n = 24) | NS |
| Lactate dehydrogenase, UI/L, median (range) | 185 (126–909) (n = 88) | 188 (149–607) (n = 25) | NS |
| IGHV unmutated, number (%) | 41 (43%) (n = 96) | 9 (31%) (n = 29) | NS |
| FISH abnormalities, number (%) * | (n = 99) | (n = 29) | NS |
| Negative | 28 (28%) | 5 (17%) | |
| Deletion 13q | 50 (51%) | 13 (45%) | |
| Trisomy 12 | 13 (13%) | 8 (28%) | |
| Deletion 11q | 6 (6%) | 2 (7%) | |
| Deletion 17p | 2 (2%) | 1 (3%) | |
| CD5 positive, number (%) | 117 (100%) (n = 117) | 36 (100%) (n = 36) | NS |
| CD23 positive, number (%) | 113 (97%) (n = 117) | 35 (97%) (n = 36) | NS |
| FMC7 positive, number (%) | 15 (14%) (n = 107) | 19 (68%) (n = 28) | p < 0.0001 |
| CD79b positive, number (%) | 49 (43%) (n = 114) | 32 (89%) (n = 36) | p < 0.0001 |
| CD200 positive, number (%) | 110 (100%) (n = 110) | 36 (100%) (n = 36) | NS |
| CD20 expression, number (%) | (n = 115) | (n = 36) | p < 0.0001 |
| low | 77 (67%) | 12 (33%) | |
| intermediate | 33 (29%) | 8 (22%) | |
| high | 5 (4%) | 16 (44%) | |
| Surface immunoglobulin light chain intensity, number (%) | (n = 115) | (n = 35) | p < 0.0001 |
| low | 79 (69%) | 11 (31%) | |
| intermediate | 31 (27%) | 15 (43%) | |
| high | 5 (4%) | 9 (26%) | |
| CD43 positive, number (%) | 113 (98%) (n = 115) | 28 (78%) (n = 36) | p < 0.0001 |
| CD38 positive, number (%) | 35 (42%) (n = 83) | 18 (64%) (n = 28) | NS |
| CD49d positive, number (%) | 38 (39%) (n = 98) | 24 (77%) (n = 31) | p = 0.0002 |
| Parameters | Immunophenotypically and Morphologically Typical CLL 74/153 (48%) | Immunophenotypically and Morphologically Atypical CLL 13/153 (8%) | Discordant: Immunophenotypically Typical/Morphologically Atypical CLL 43/153 (28%) | Discordant: Morphologically Typical/Immunophenotypically Atypical CLL 23/153 (15%) |
|---|---|---|---|---|
| Age, median (range) | 67 (40–90) (n = 74) | 68 (47–88) (n = 13) | 67 (38–89) (n = 43) | 70 (50–83) (n = 23) |
| Males, number (%) | 43 (58%) (n = 74) | 7 (54%) (n = 13) | 29 (67%) (n = 43) | 15 (65%) (n = 23) |
| Rai stage, number (%) | (n = 74) | (n = 12) | (n = 23) | (n = 12) |
| 0–I | 56 (76%) | 6 (50%) | 10 (58%) | 6 (43%) |
| II–IV | 18 (24%) | 6 (50%) | 13 (42%) | 6 (57%) |
| Binet stage, number (%) | (n = 74) | (n = 12) | (n = 43) | (n = 23) |
| A | 51 (69%) | 6 (50%) | 27 (63%) | 9 (39%) |
| B | 18 (24%) | 4 (33%) | 13 (30%) | 14 (61%) |
| C | 5 (7%) | 2 (17%) | 3 (7%) | 0 |
| White blood cell count, ×109/L, median (range) | 17.9 (10–230) (n = 74) | 19.9 (1.2–32.6) (n = 12) | 18.3 (8.2–93) (n = 42) | 15.5 (8.7–202) (n = 23) |
| Lymphocyte count, ×109/L, median (range) | 12.75 (5.1–200) (n = 74) | 15.6 (4.3–21.9) (n = 12) | 12.8 (8.9–86.6) (n = 42) | 10.3 (5.3–139) (n = 23) |
| Hemoglobin, g/dL, median (range) | 13.8 (8–16.8) (n = 74) | 13.7 (10.7–16.6) (n = 12) | 13.9 (10.7–16.6) (n = 40) | 13.2 (9.6–15.5) (n = 23) |
| Platelet count, ×109/L, median (range) | 175 (33–462) (n = 74) | 169 (86–304) (n = 12) | 191 (45–337) (n = 40) | 174 (102–265) (n = 23) |
| Beta2-microglobulin, mg/L, median (range) | 2.4 (1.4–5.6) (n = 47) | 2.6 (1.5–4.9) (n = 10) | 2.5 (1.7–10.9) (n = 25) | 2.6 (1.6–5.3) (n = 14) |
| Lactate dehydrogenase, UI/L, median (range) | 183 (126–530) (n = 54) | 181 (149–607) (n = 11) | 195 (139–909) (n = 34) | 188 (153–268) (n = 14) |
| IGHV unmutated, number (%) | 20 (31%) (n = 64) | 2 (18%) (n = 11) | 21 (66%) (n = 32) | 7 (39%) (n = 18) |
| FISH abnormalities, number (%) | (n = 65) | (n = 11) | (n = 34) | (n = 18) |
| Negative | 20 (31%) | 1 (9%) | 8 (24%) | 4 (22%) |
| Deletion 13q | 34 (52%) | 5 (45%) | 16 (47%) | 8 (44%) |
| Trisomy 12 | 7 (11%) | 5 (45%) | 6 (18%) | 3 (17%) |
| Deletion 11q | 2 (3%) | 0 | 4 (12%) | 2 (11%) |
| Deletion 17p | 2 (3%) | 0 | 0 | 1 (6%) |
| CD5 positive, number (%) | 74 (100%) (n = 74) | 13 (100%) (n = 13) | 43 (100%) (n = 43) | 23 (100%) (n = 23) |
| CD23 positive, number (%) | 73 (99%) (n = 74) | 12 (92%) (n = 13) | 40 (93%) (n = 43) | 23 (100%) (n = 23) |
| FMC7 positive, number (%) | 7 (10%) (n = 73) | 5 (63%) (n = 8) | 8 (24%) (n = 34) | 14 (70%) (n = 20) |
| CD79b positive, number (%) | 28 (38%) (n = 73) | 12 (92%) (n = 13) | 21 (51%) (n = 41) | 20 (87%) (n = 23) |
| CD200 positive, number (%) | 71 (100%) (n = 71) | 13 (100%) (n = 13) | 39 (100%) (n = 39) | 23 (100%)(n = 23) |
| CD20 expression, number (%) | (n = 74) | (n = 13) | (n = 41) | (n = 23) |
| low | 60 (81%) | 0 | 17 (41%) | 12 (52%) |
| intermediate | 13 (18%) | 3 (23%) | 20 (49%) | 5 (22%) |
| high | 1 (1%) | 10 (77%) | 4 (10%) | 6 (26%) |
| Surface immunoglobulin light chain intensity, number (%) | (n = 73) | (n = 12) | (n = 42) | (n = 23) |
| low | 53 (73%) | 1 (8%) | 26 (62%) | 10 (43%) |
| intermediate | 17 (23%) | 8 (67%) | 14 (33%) | 7 (30%) |
| high | 3 (4%) | 3 (25%) | 2 (5%) | 6 (26%) |
| CD43 positive, number (%) | 73 (99%) (n = 74) | 9 (69%) (n = 13) | 40 (98%) (n = 41) | 19 (83%) (n = 23) |
| CD38 positive, number (%) | 17 (33%) (n = 52) | 8 (89%) (n = 9) | 18 (58%) (n = 31) | 10 (53%) (n = 19) |
| CD49d positive, number (%) | 25 (37%) (n = 67) | 11 (100%) (n = 11) | 13 (42%) (n = 31) | 13 (65%) (n = 20) |
| Reference | No. of Evaluated Patients | Criteria for Defining Atypical CLL | Atypical CLL (No. and %) | Impact on Prognosis (Correlations) |
|---|---|---|---|---|
| Matutes E et al., 1994 [5] | 400 | FMC | 52/400 (13%) | |
| Finn et al., 1996 [10] | 26 | Morphology FCM | 10/26 (38%) 8/26 (31%) | Trisomy 12 (p 0.004) and atypical immunophenotype (p 0.13) despite this latter having no statistical significance |
| Criel A et al., 1997 [14] | 390 | Morphology | 90/390 (23.1%) | Aberrant immunophenotype in 33% of cases: FMC7 positivity (p < 0.0001), intensive smIg (p < 0.0001). Trisomy 12 in 36% of cases (p < 0.0001); del11q the second most common anomaly (13.5%). More frequent advanced clinical stage (p < 0.05), lymph node involvement (p < 0.05), time-to-treatment shorter (p < 0.05), shorter survival (p < 0.005) |
| D’Arena G et al., 2001 [15] | 84 | Morphology | 15 (18%) | Higher expression of CD20 and CD22, CD79b and FMC7 expression and smIg density |
| Schwarz et al., 2006 [16] | 88 | Morphology | 63/88 (71.6%) | Inferior OS (103 vs. 237 months; p 0.03), unmutated IgVH (81.8%), trisomy 12 and del17p, CD38+ slightly more frequent (p ns) |
| Habib LK and Finn WG, 2006 [17] | 81 | FCM | 14/81 (17%) | High CD20, CD22, FMC7, and smIg, and low CD23 |
| Marianneaux et al., 2013 [36] | 97 | Morphology | 26/97 (27%) | Higher prevalence of trisomy 12, unmutated IgVH, CD38 expression, lower prevalence of del13q14, higher fluorescence expression of CD79b |
| Ting et al., 2018 [11] | 63 | FMC * | 7/63 (11%) | Not reported |
Disclaimer/Publisher’s Note: The statements, opinions and data contained in all publications are solely those of the individual author(s) and contributor(s) and not of MDPI and/or the editor(s). MDPI and/or the editor(s) disclaim responsibility for any injury to people or property resulting from any ideas, methods, instructions or products referred to in the content. |
© 2024 by the authors. Licensee MDPI, Basel, Switzerland. This article is an open access article distributed under the terms and conditions of the Creative Commons Attribution (CC BY) license (https://creativecommons.org/licenses/by/4.0/).
Share and Cite
D’Arena, G.; Vitale, C.; Pietrantuono, G.; Villani, O.; Mansueto, G.; D’Auria, F.; Statuto, T.; D’Agostino, S.; Sabetta, R.; Tarasco, A.; et al. What Does Atypical Chronic Lymphocytic Leukemia Really Mean? A Retrospective Morphological and Immunophenotypic Study. Cancers 2024, 16, 469. https://doi.org/10.3390/cancers16020469
D’Arena G, Vitale C, Pietrantuono G, Villani O, Mansueto G, D’Auria F, Statuto T, D’Agostino S, Sabetta R, Tarasco A, et al. What Does Atypical Chronic Lymphocytic Leukemia Really Mean? A Retrospective Morphological and Immunophenotypic Study. Cancers. 2024; 16(2):469. https://doi.org/10.3390/cancers16020469
Chicago/Turabian StyleD’Arena, Giovanni, Candida Vitale, Giuseppe Pietrantuono, Oreste Villani, Giovanna Mansueto, Fiorella D’Auria, Teodora Statuto, Simona D’Agostino, Rosalaura Sabetta, Angela Tarasco, and et al. 2024. "What Does Atypical Chronic Lymphocytic Leukemia Really Mean? A Retrospective Morphological and Immunophenotypic Study" Cancers 16, no. 2: 469. https://doi.org/10.3390/cancers16020469