
The Tumor Suppressor SOCS1 Diminishes Tolerance to Oxidative Stress in Hepatocellular Carcinoma

 , ,
, ,
Abstract
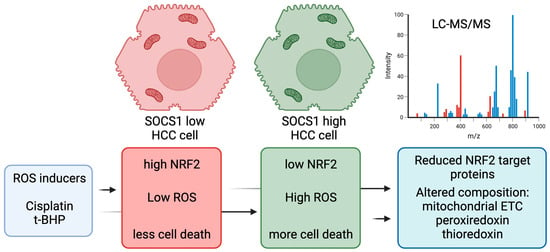
:Simple Summary
Abstract
1. Introduction
2. Materials and Methods
2.1. Cell Lines and Treatment
2.2. Western Blot
2.3. Gene Expression
2.4. Immunofluorescence (IF) Microscopy
2.5. Oxidative Stress
2.6. Cell Viability
2.7. Statistical Analysis
2.8. TCGA-LIHC Dataset and Analyses
2.9. Mass Spectrometry
2.9.1. Protein Preparation and Protease Digestion
2.9.2. Liquid Chromatography-Tandem Mass Spectrometry (LC-MS/MS)
2.9.3. Protein Identification
2.9.4. Proteomic Data Visualization
3. Results
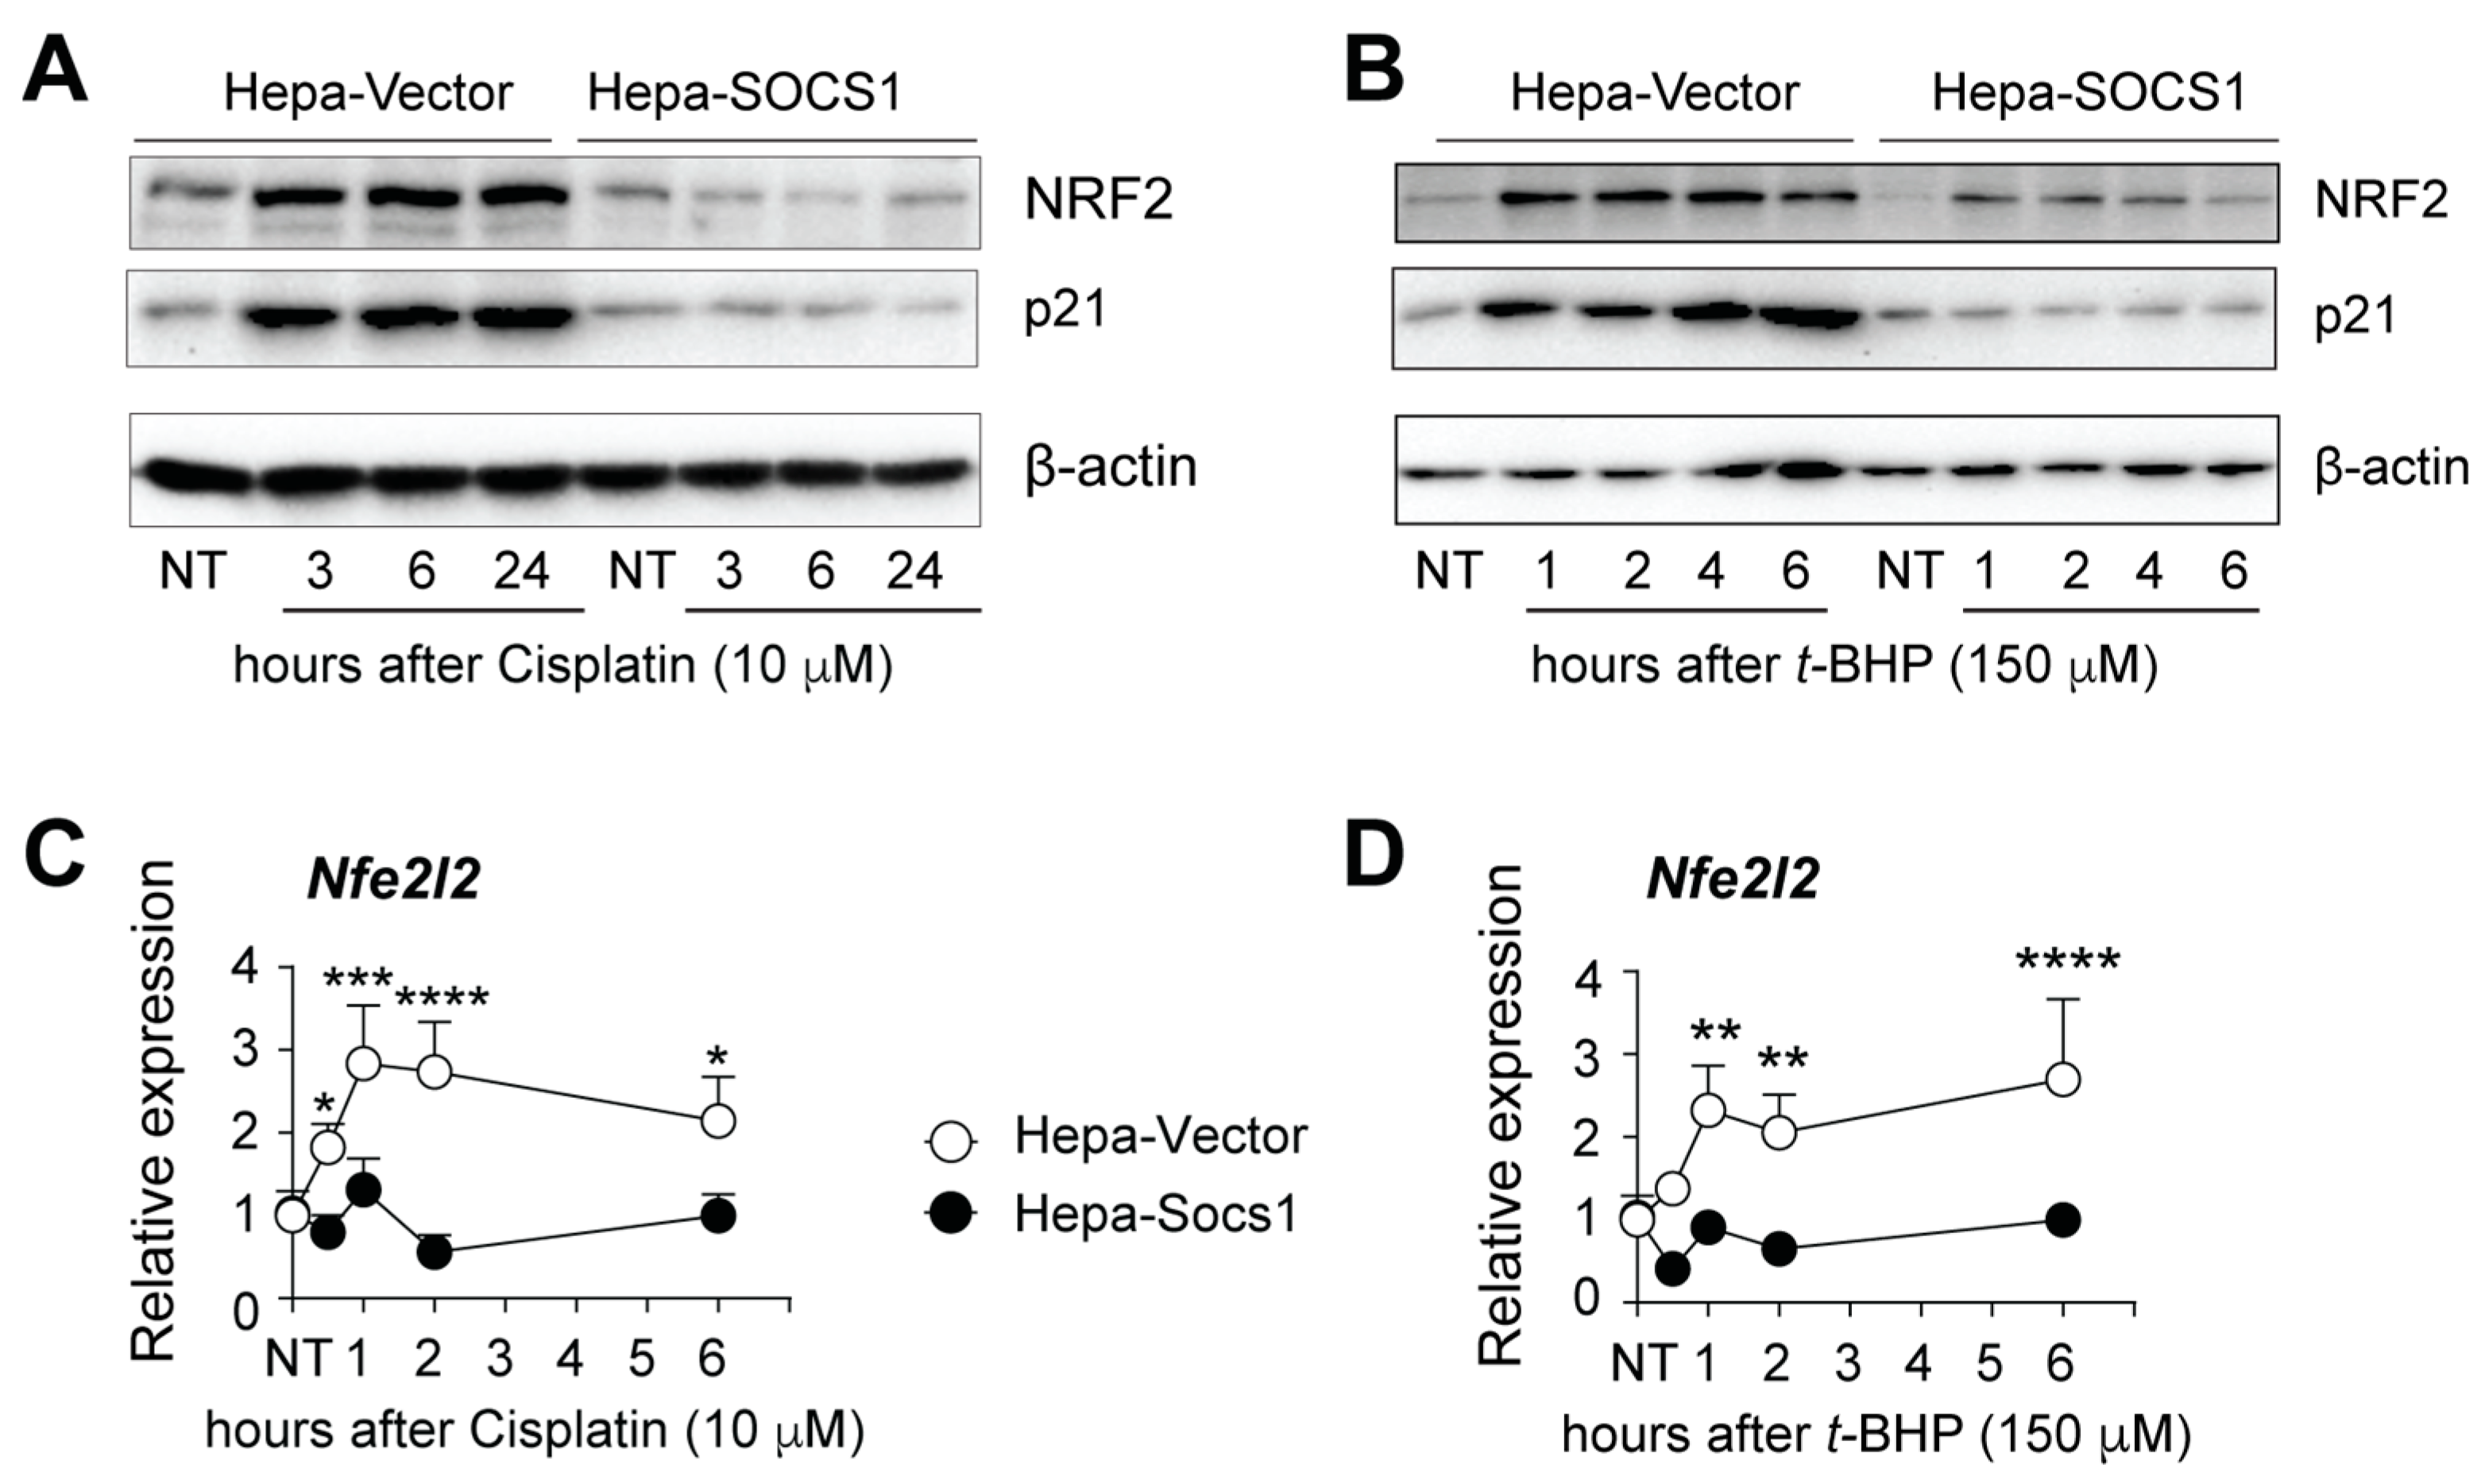
3.1. SOCS1 Inhibits NRF2 Induction through Oxidative Stress
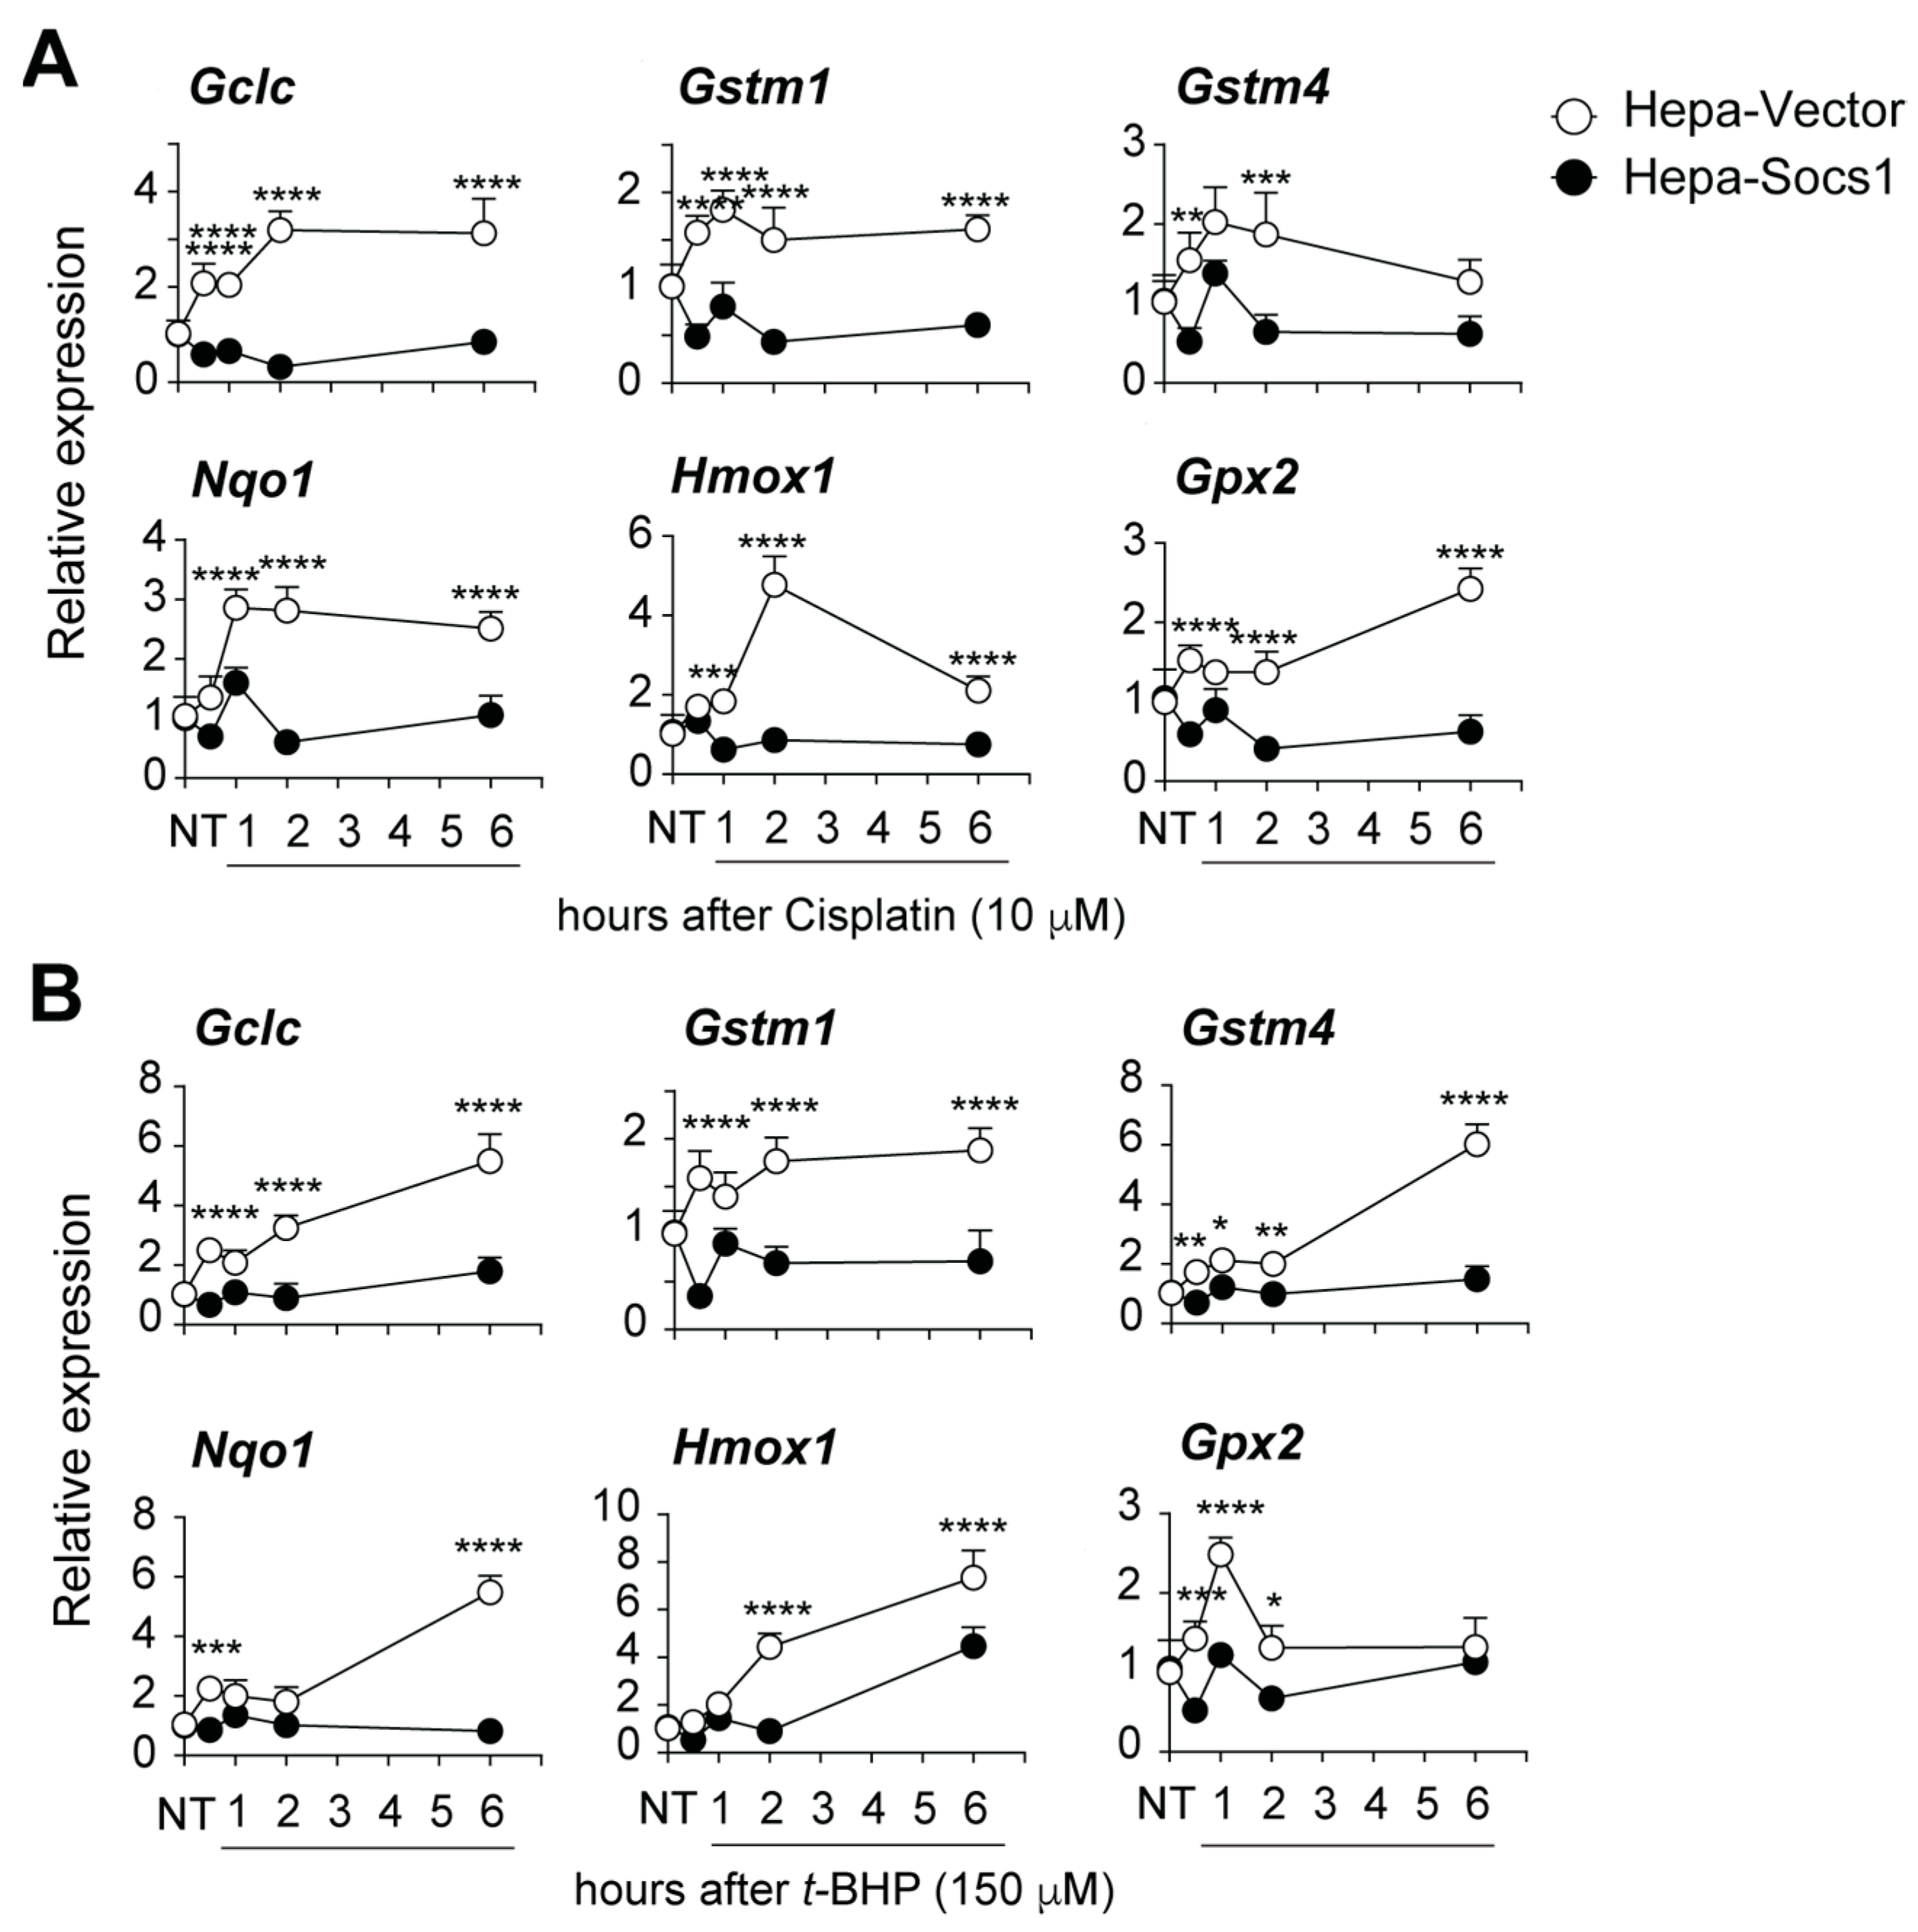
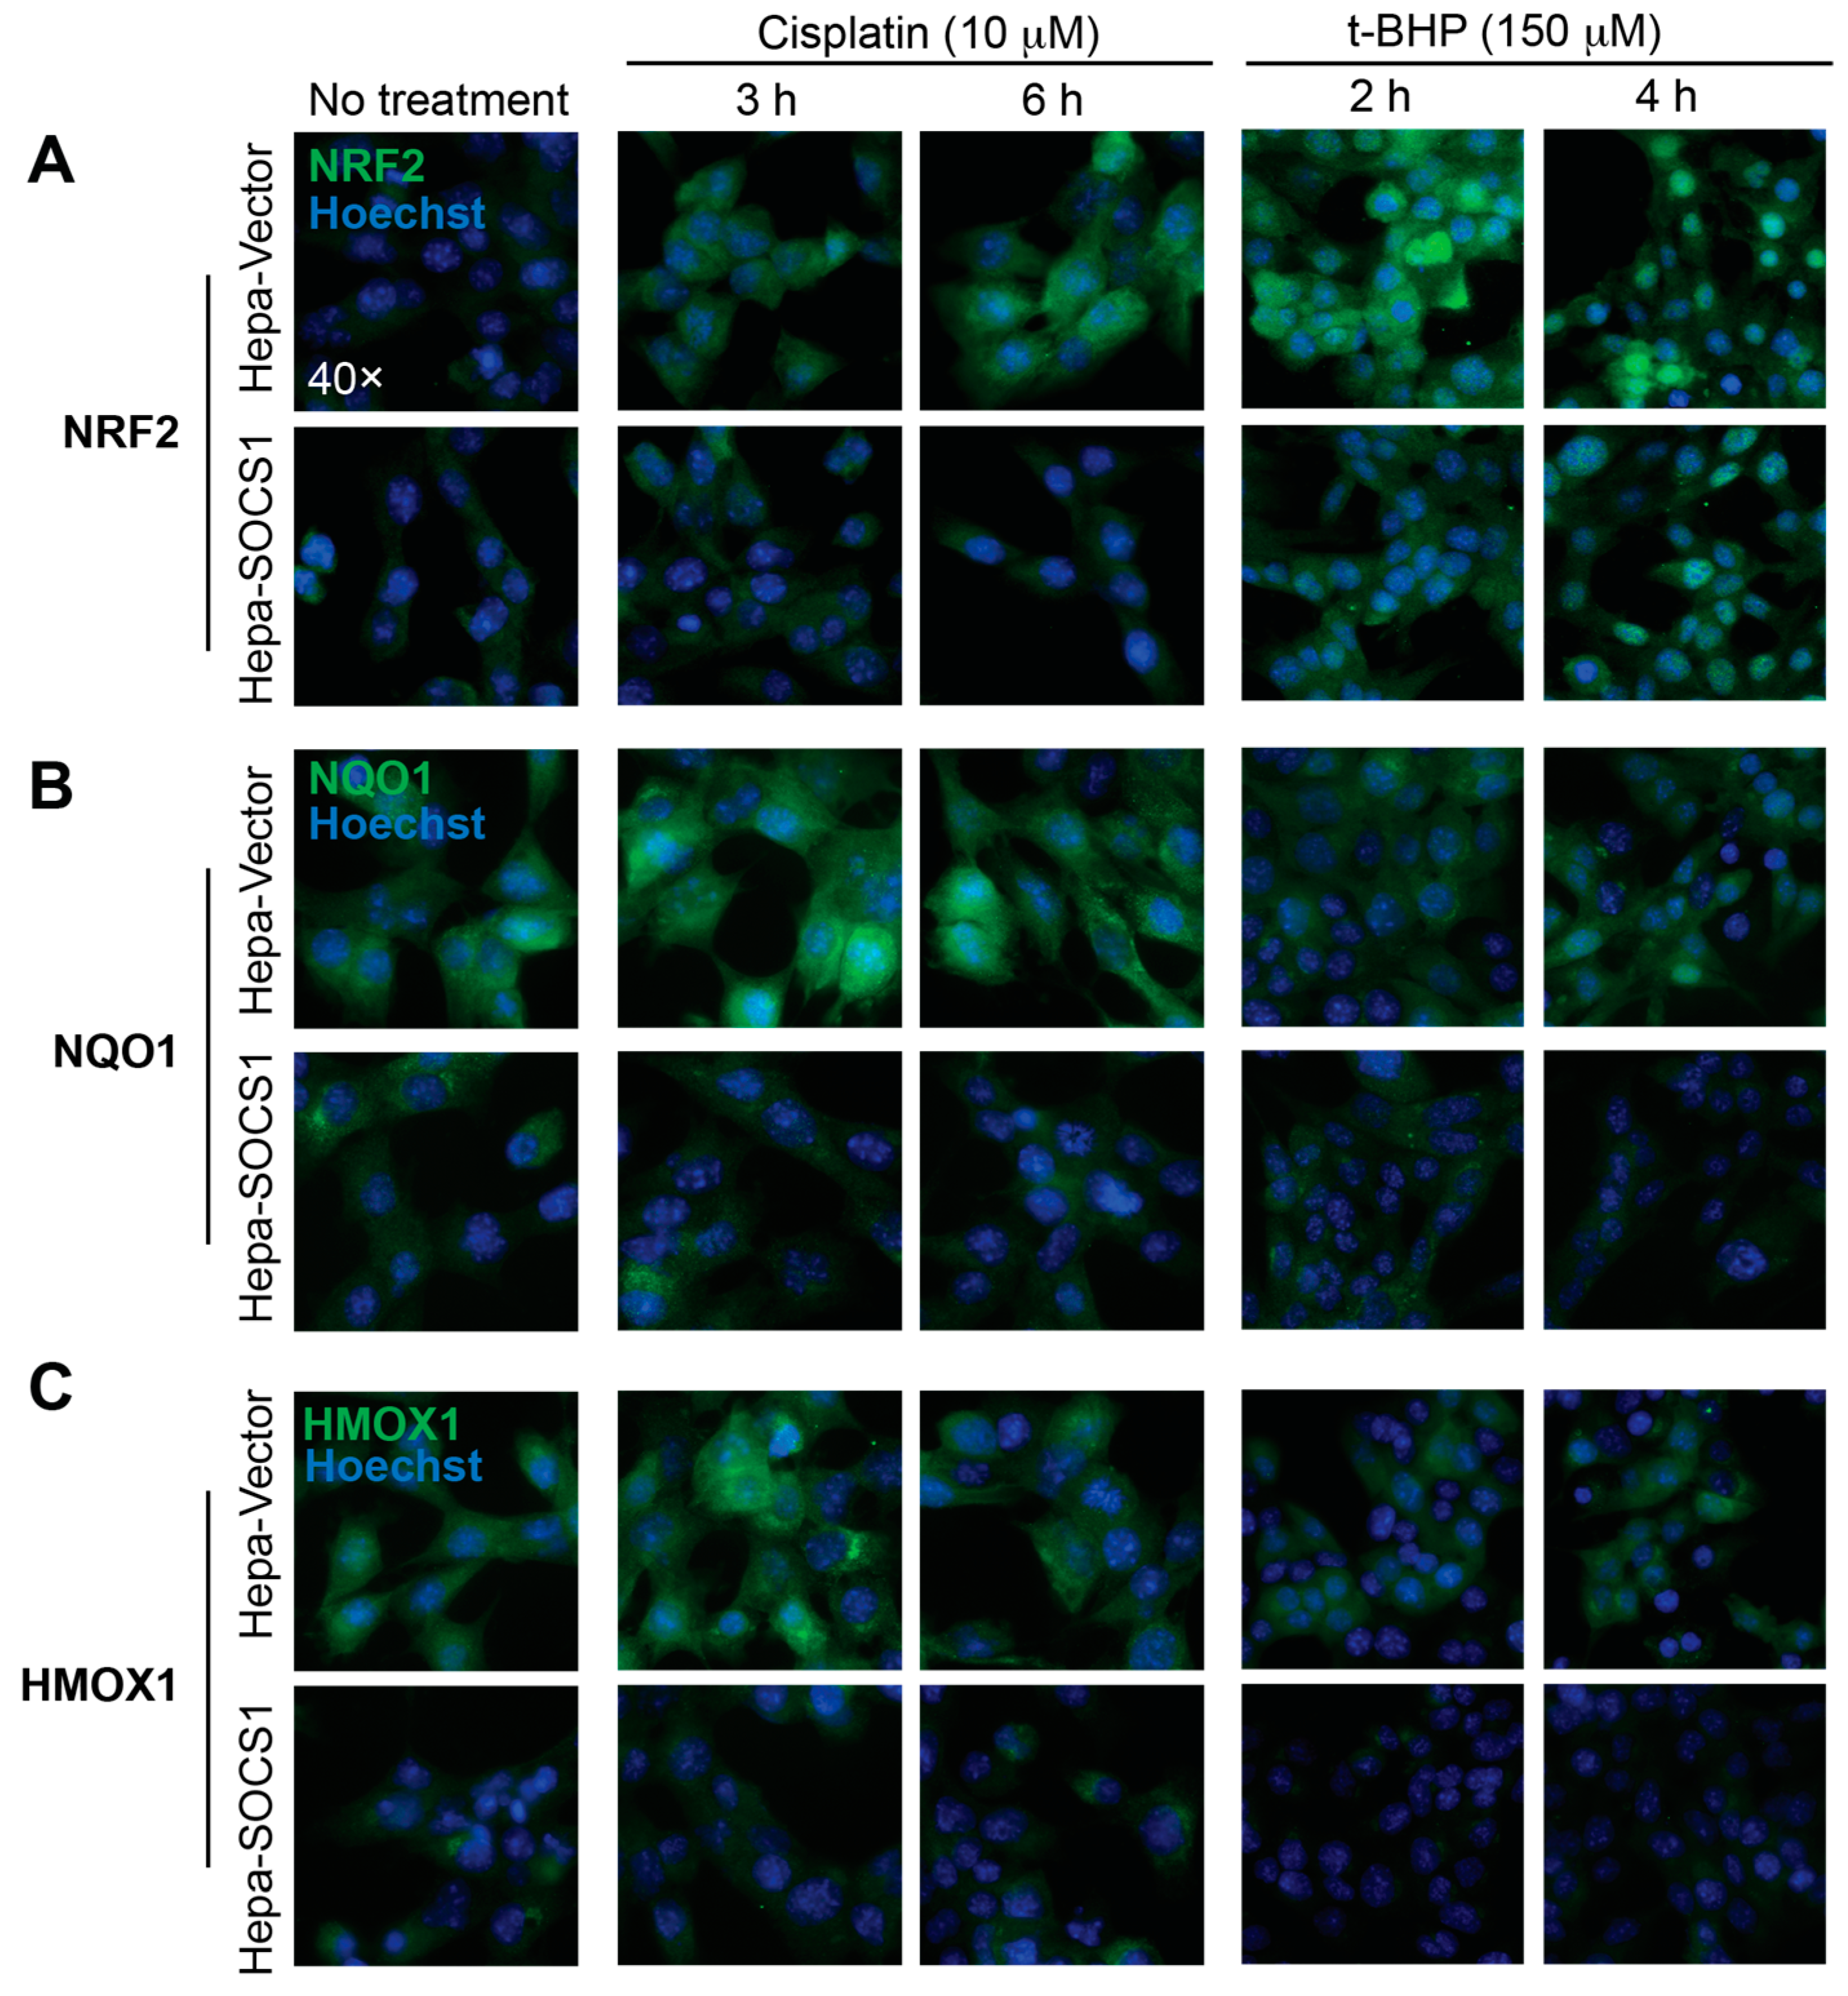
3.2. SOCS1 Inhibits the Induction of NRF2 Target Genes and Proteins
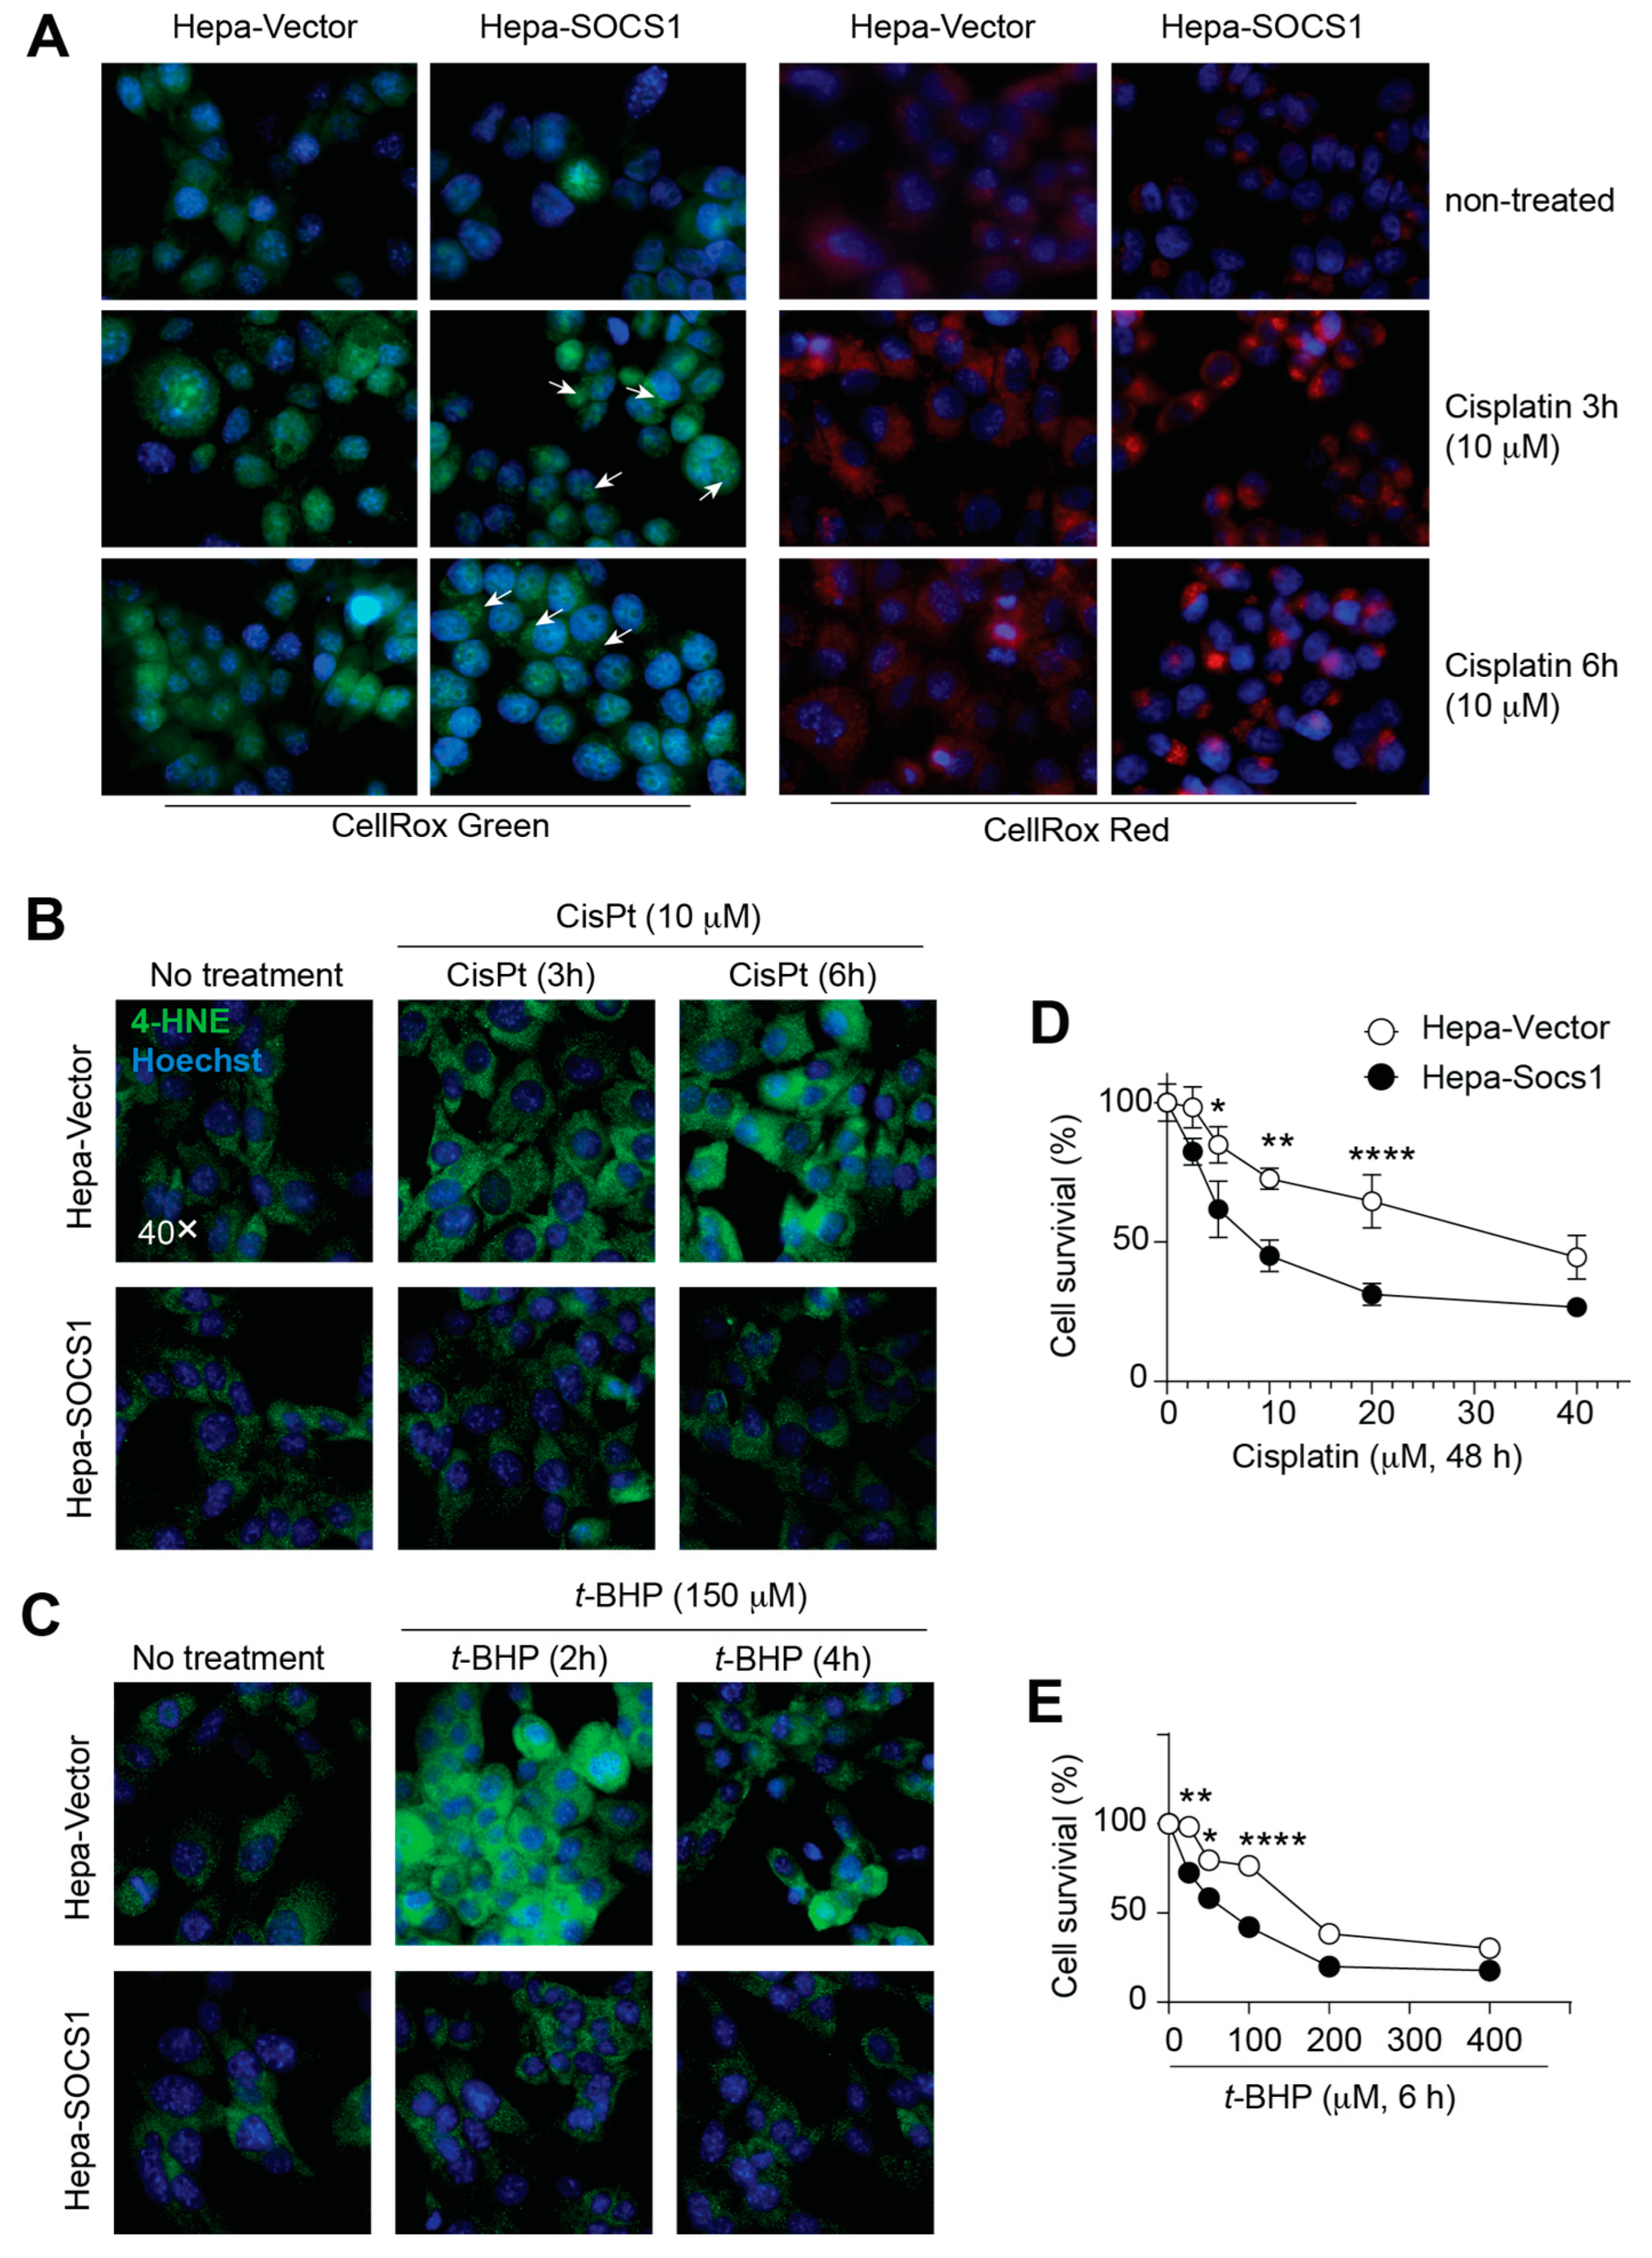
3.3. SOCS1 Increases Oxidative Stress and Reduces Cell Survival
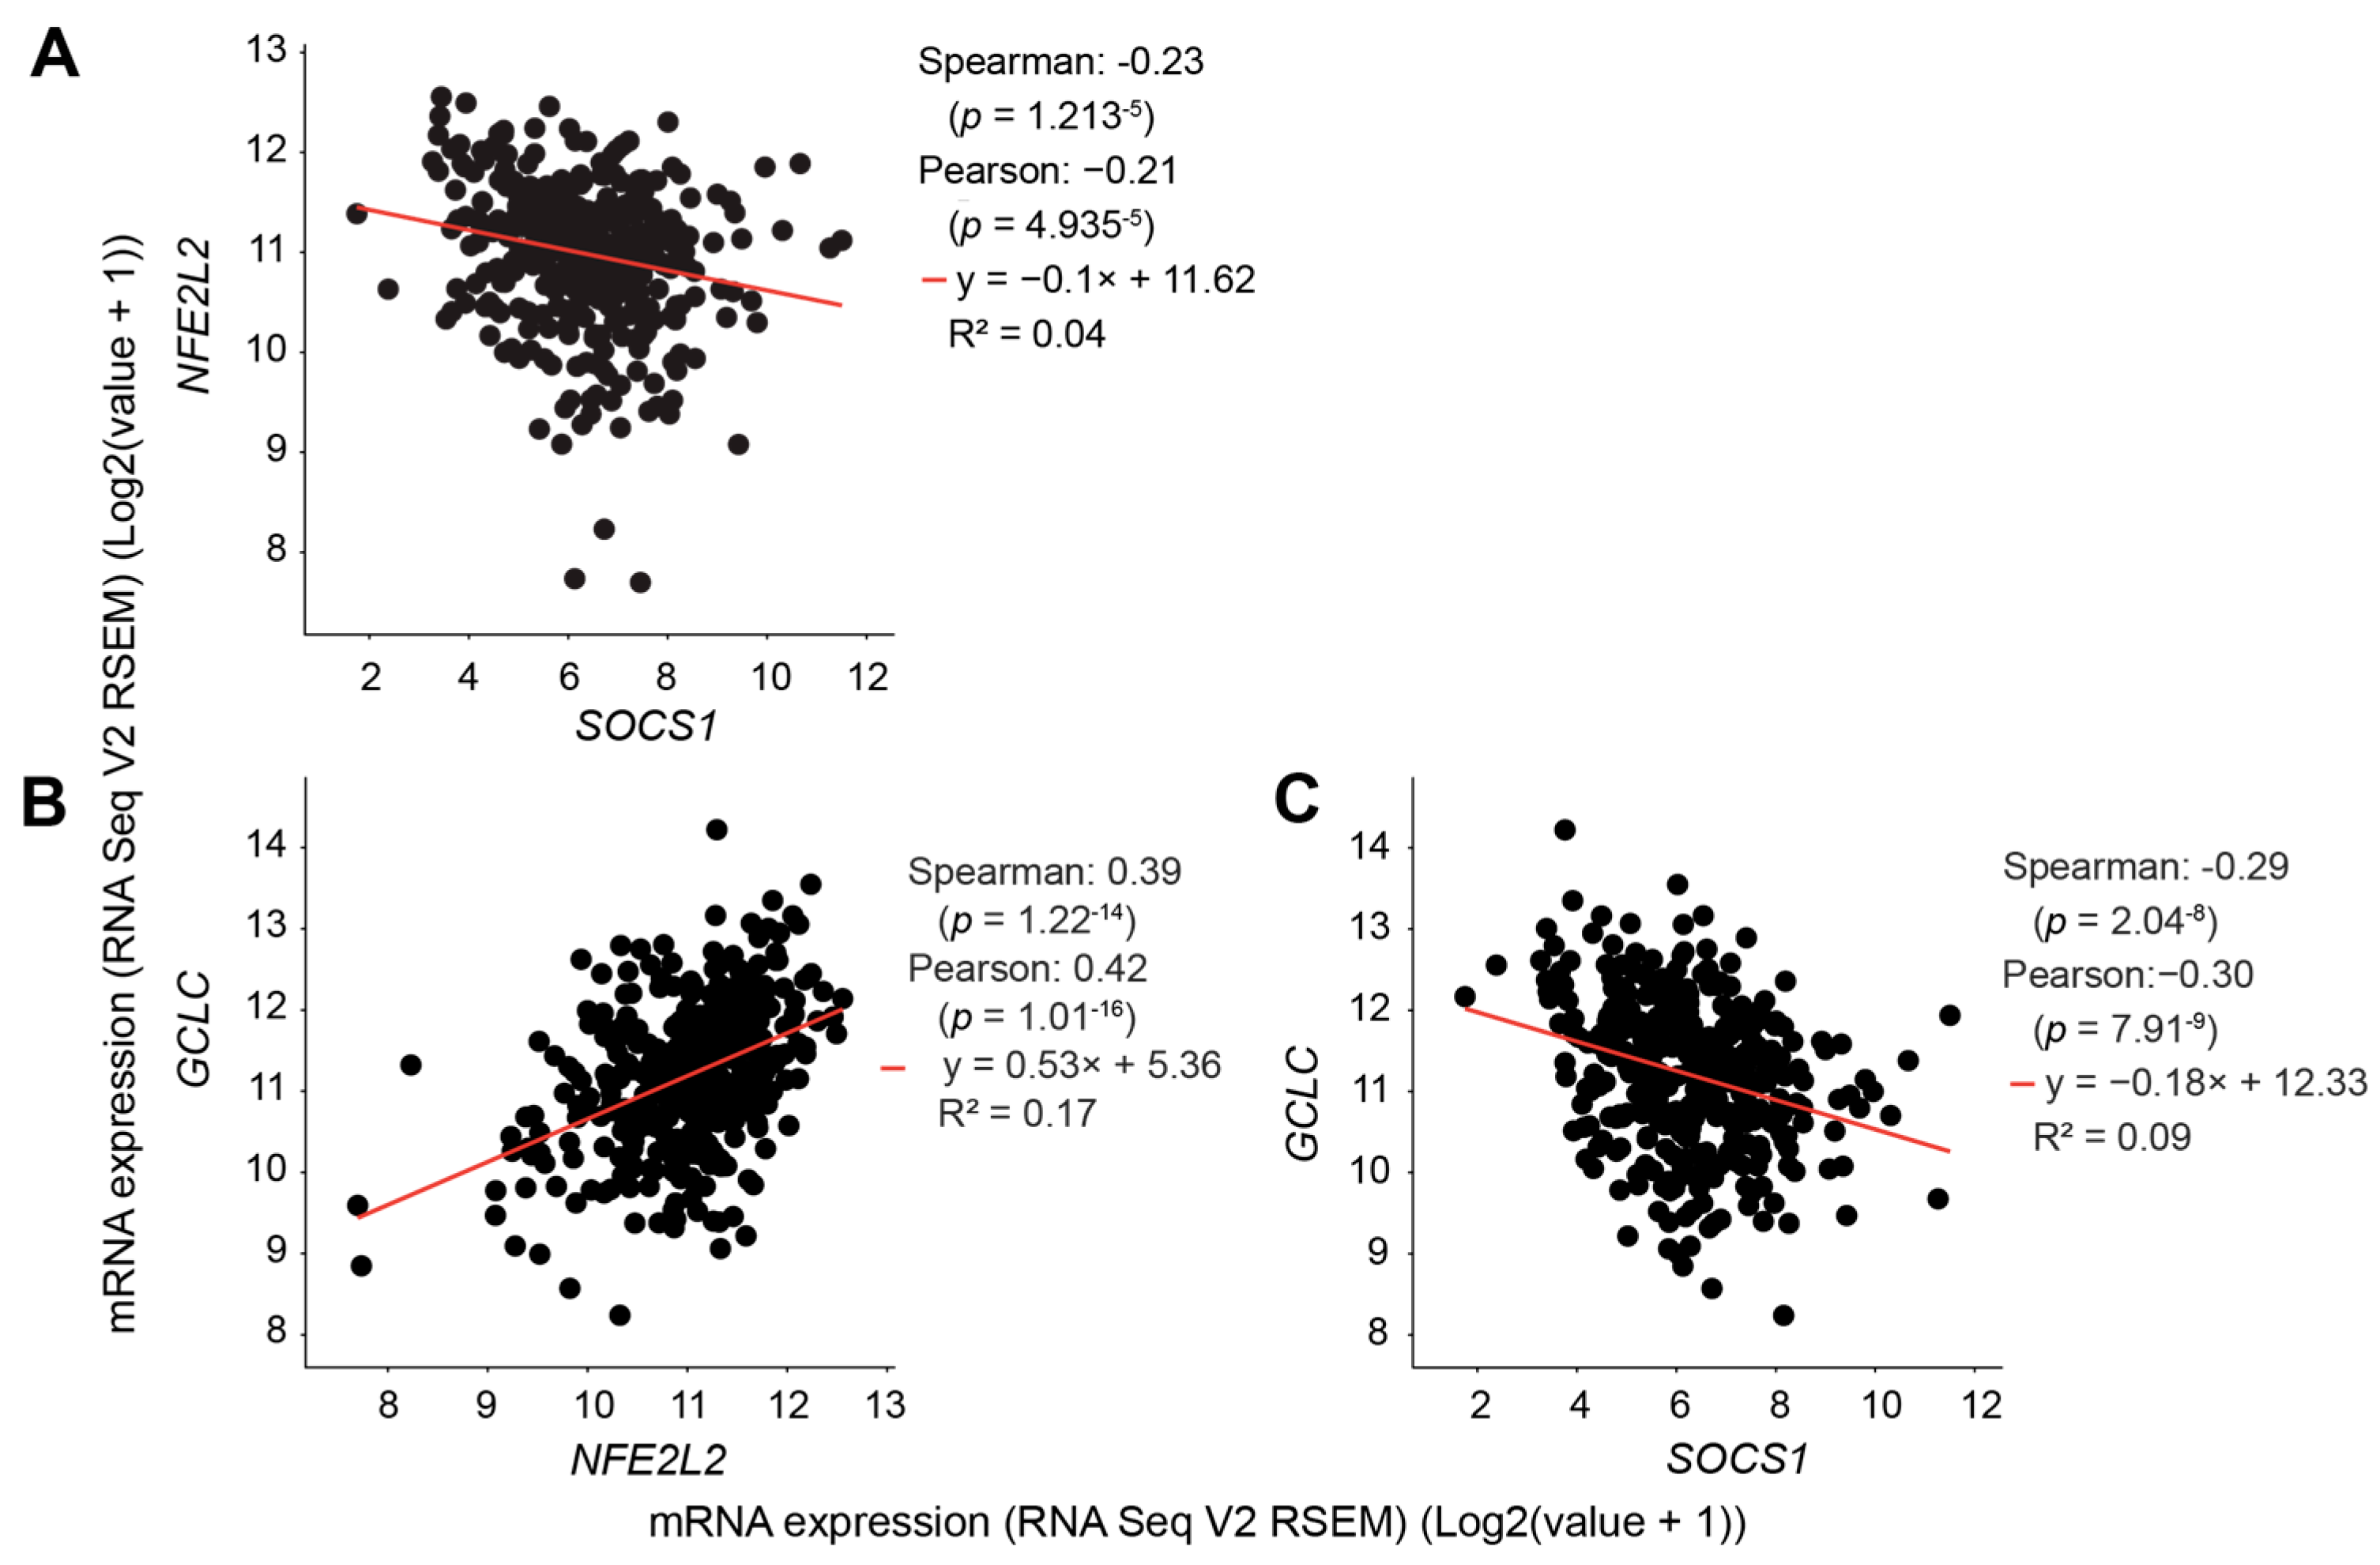
3.4. SOCS1 Expression in HCC Negatively Correlates with NFE2L2 and GCLC Expression
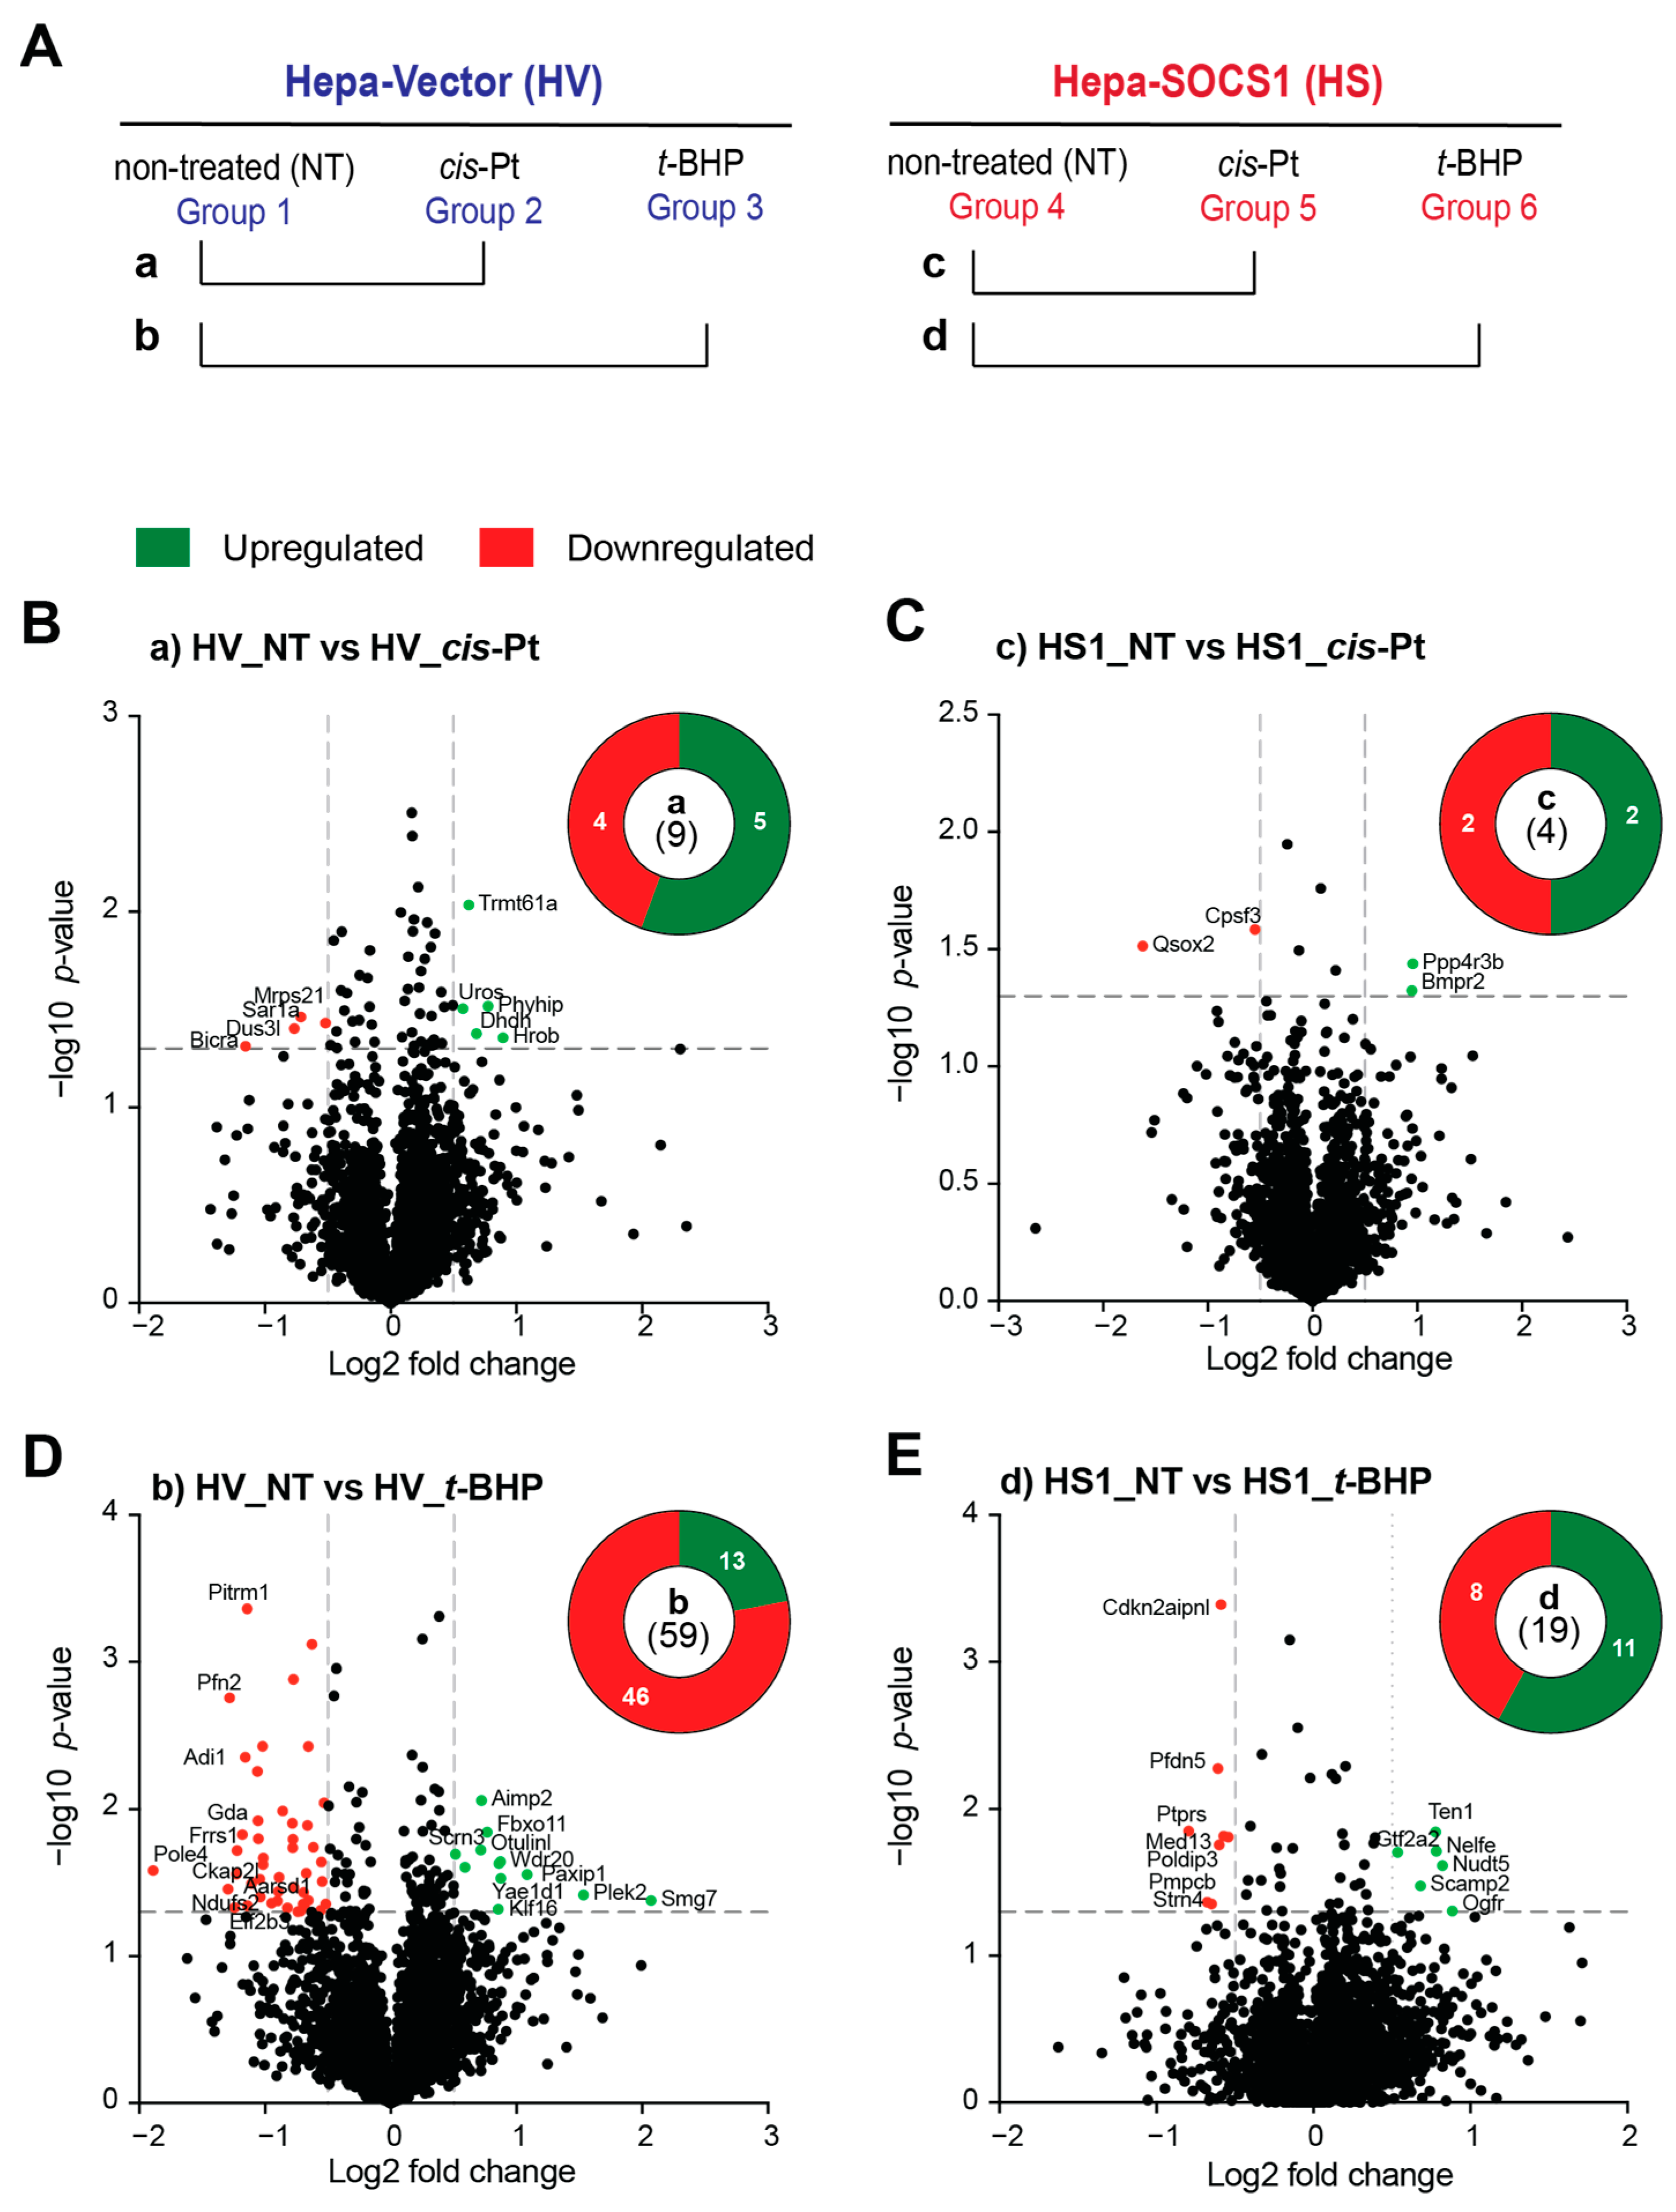
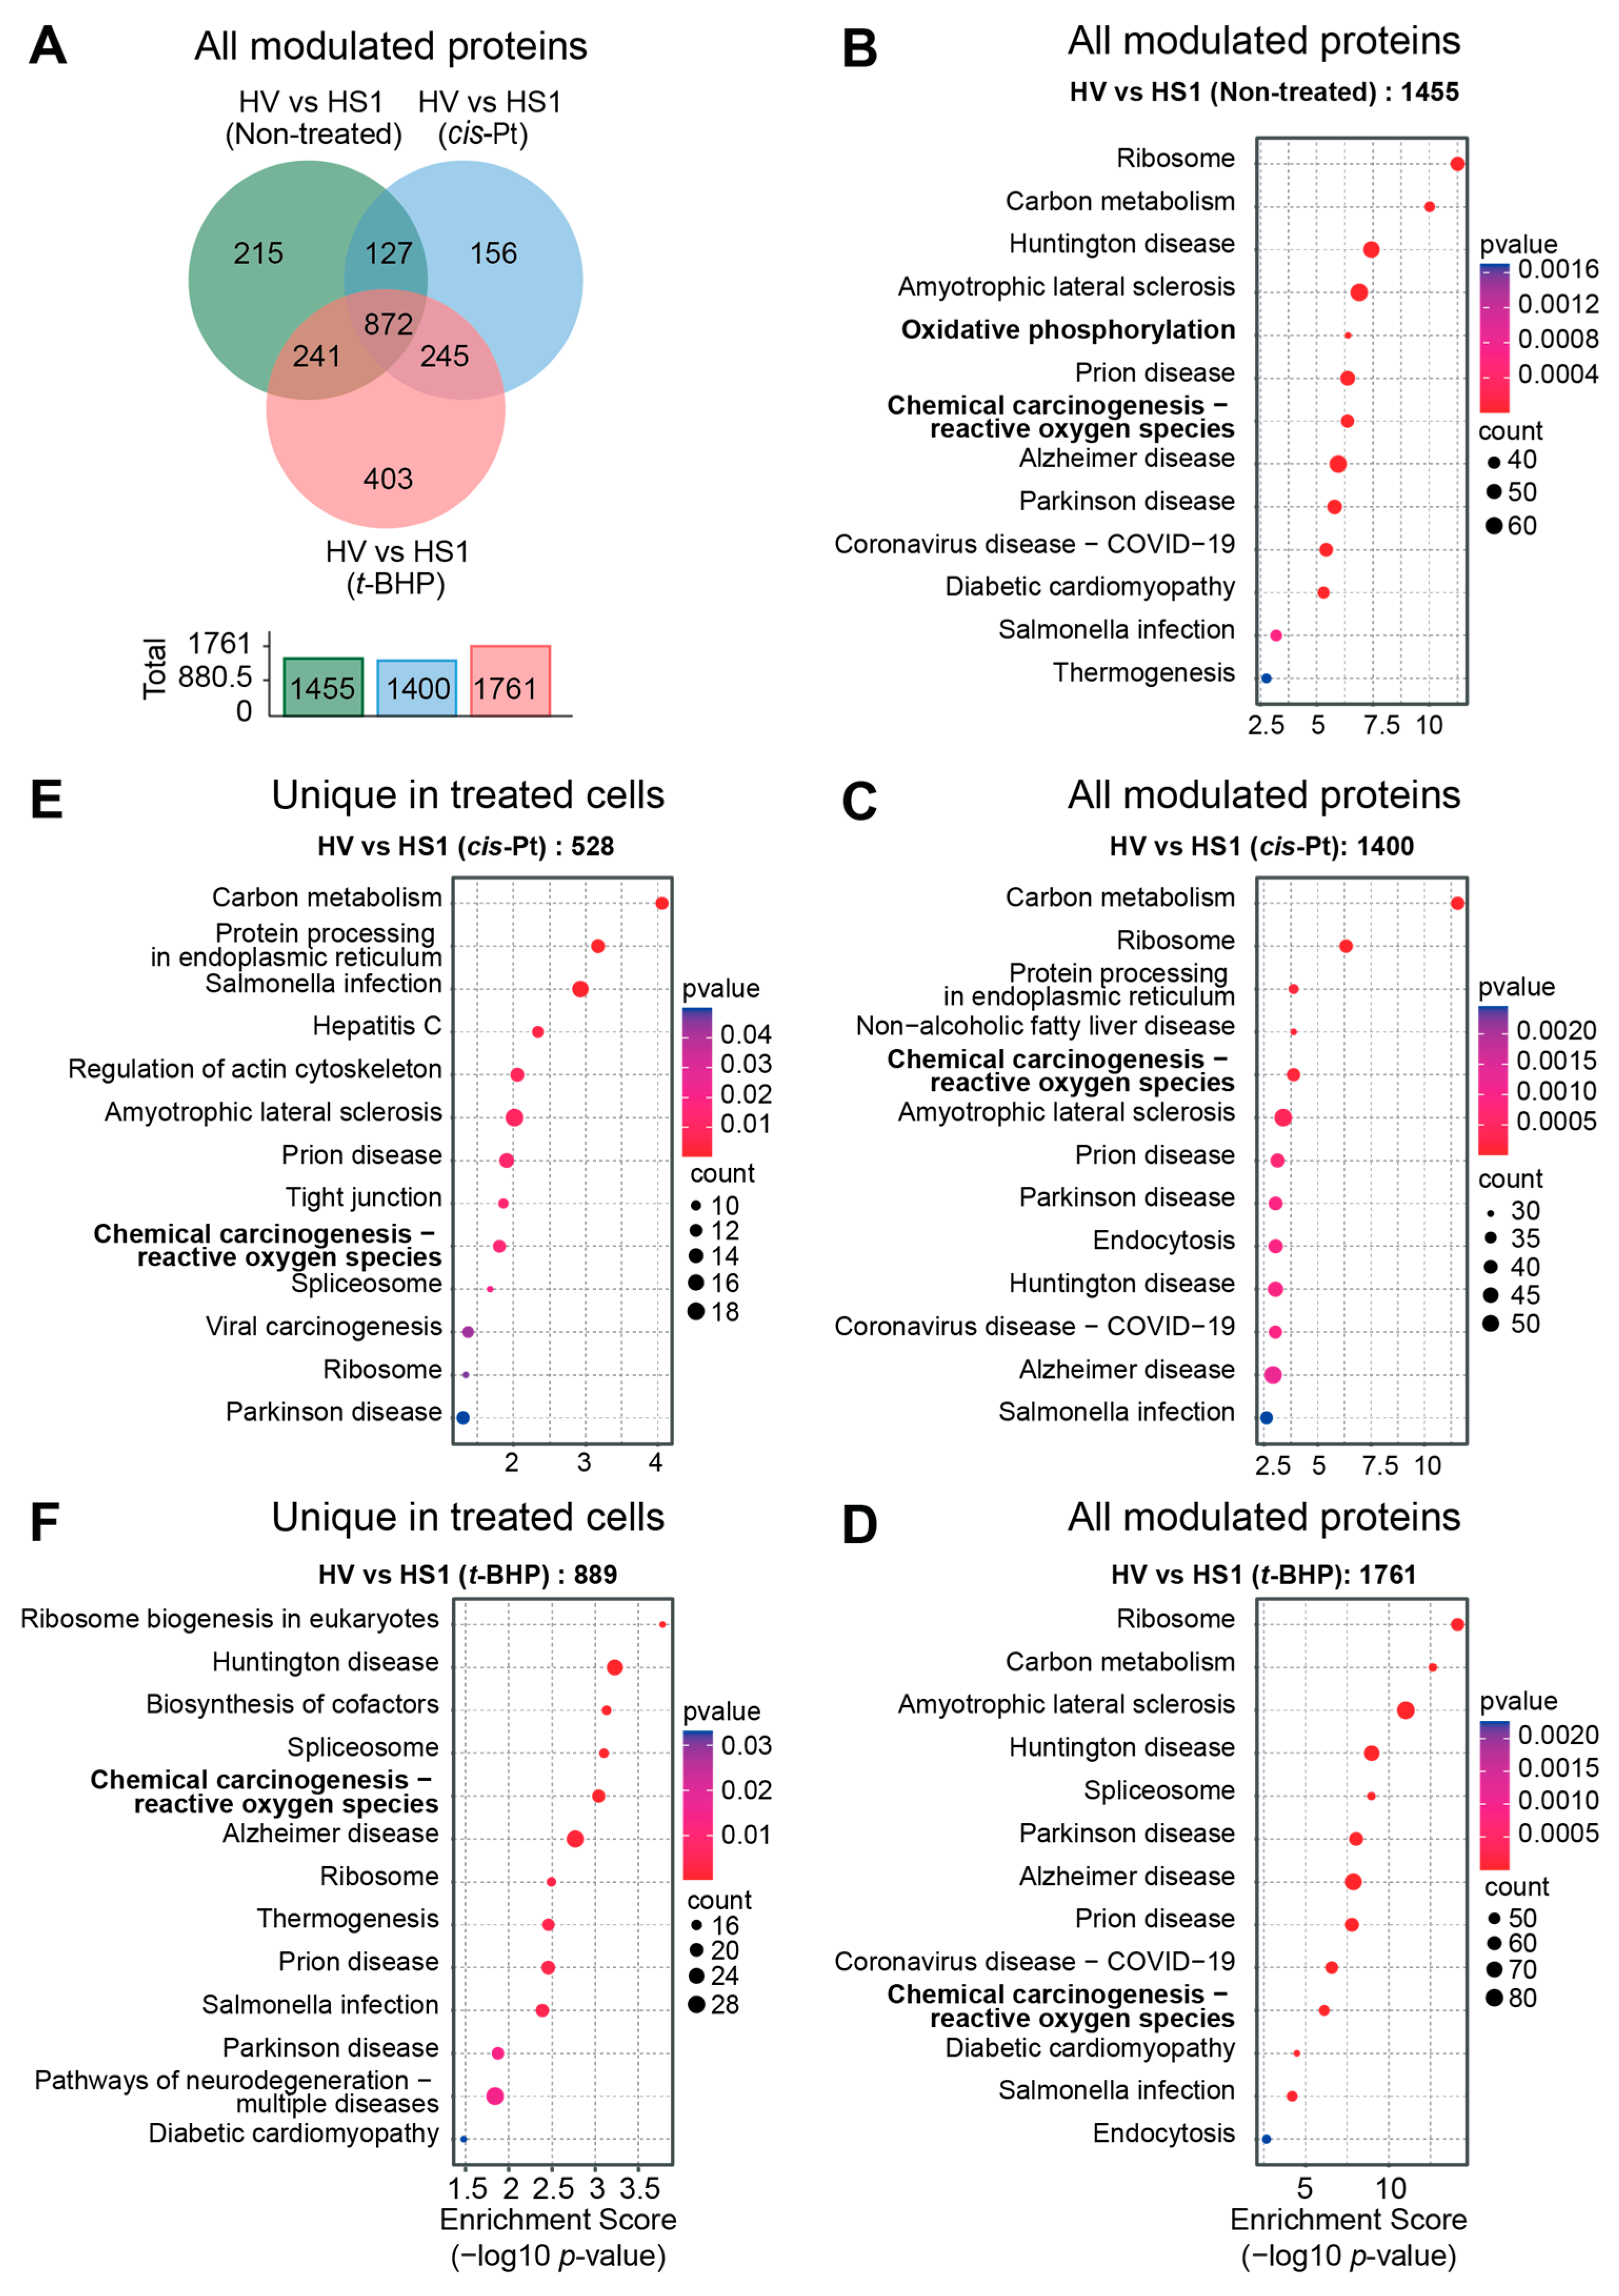
3.5. SOCS1 Expression Profoundly Modulates the Proteome of Hepatoma Cells
3.6. Oxidative Stress Response Is a Major Biological Pathway Modulated by SOCS1
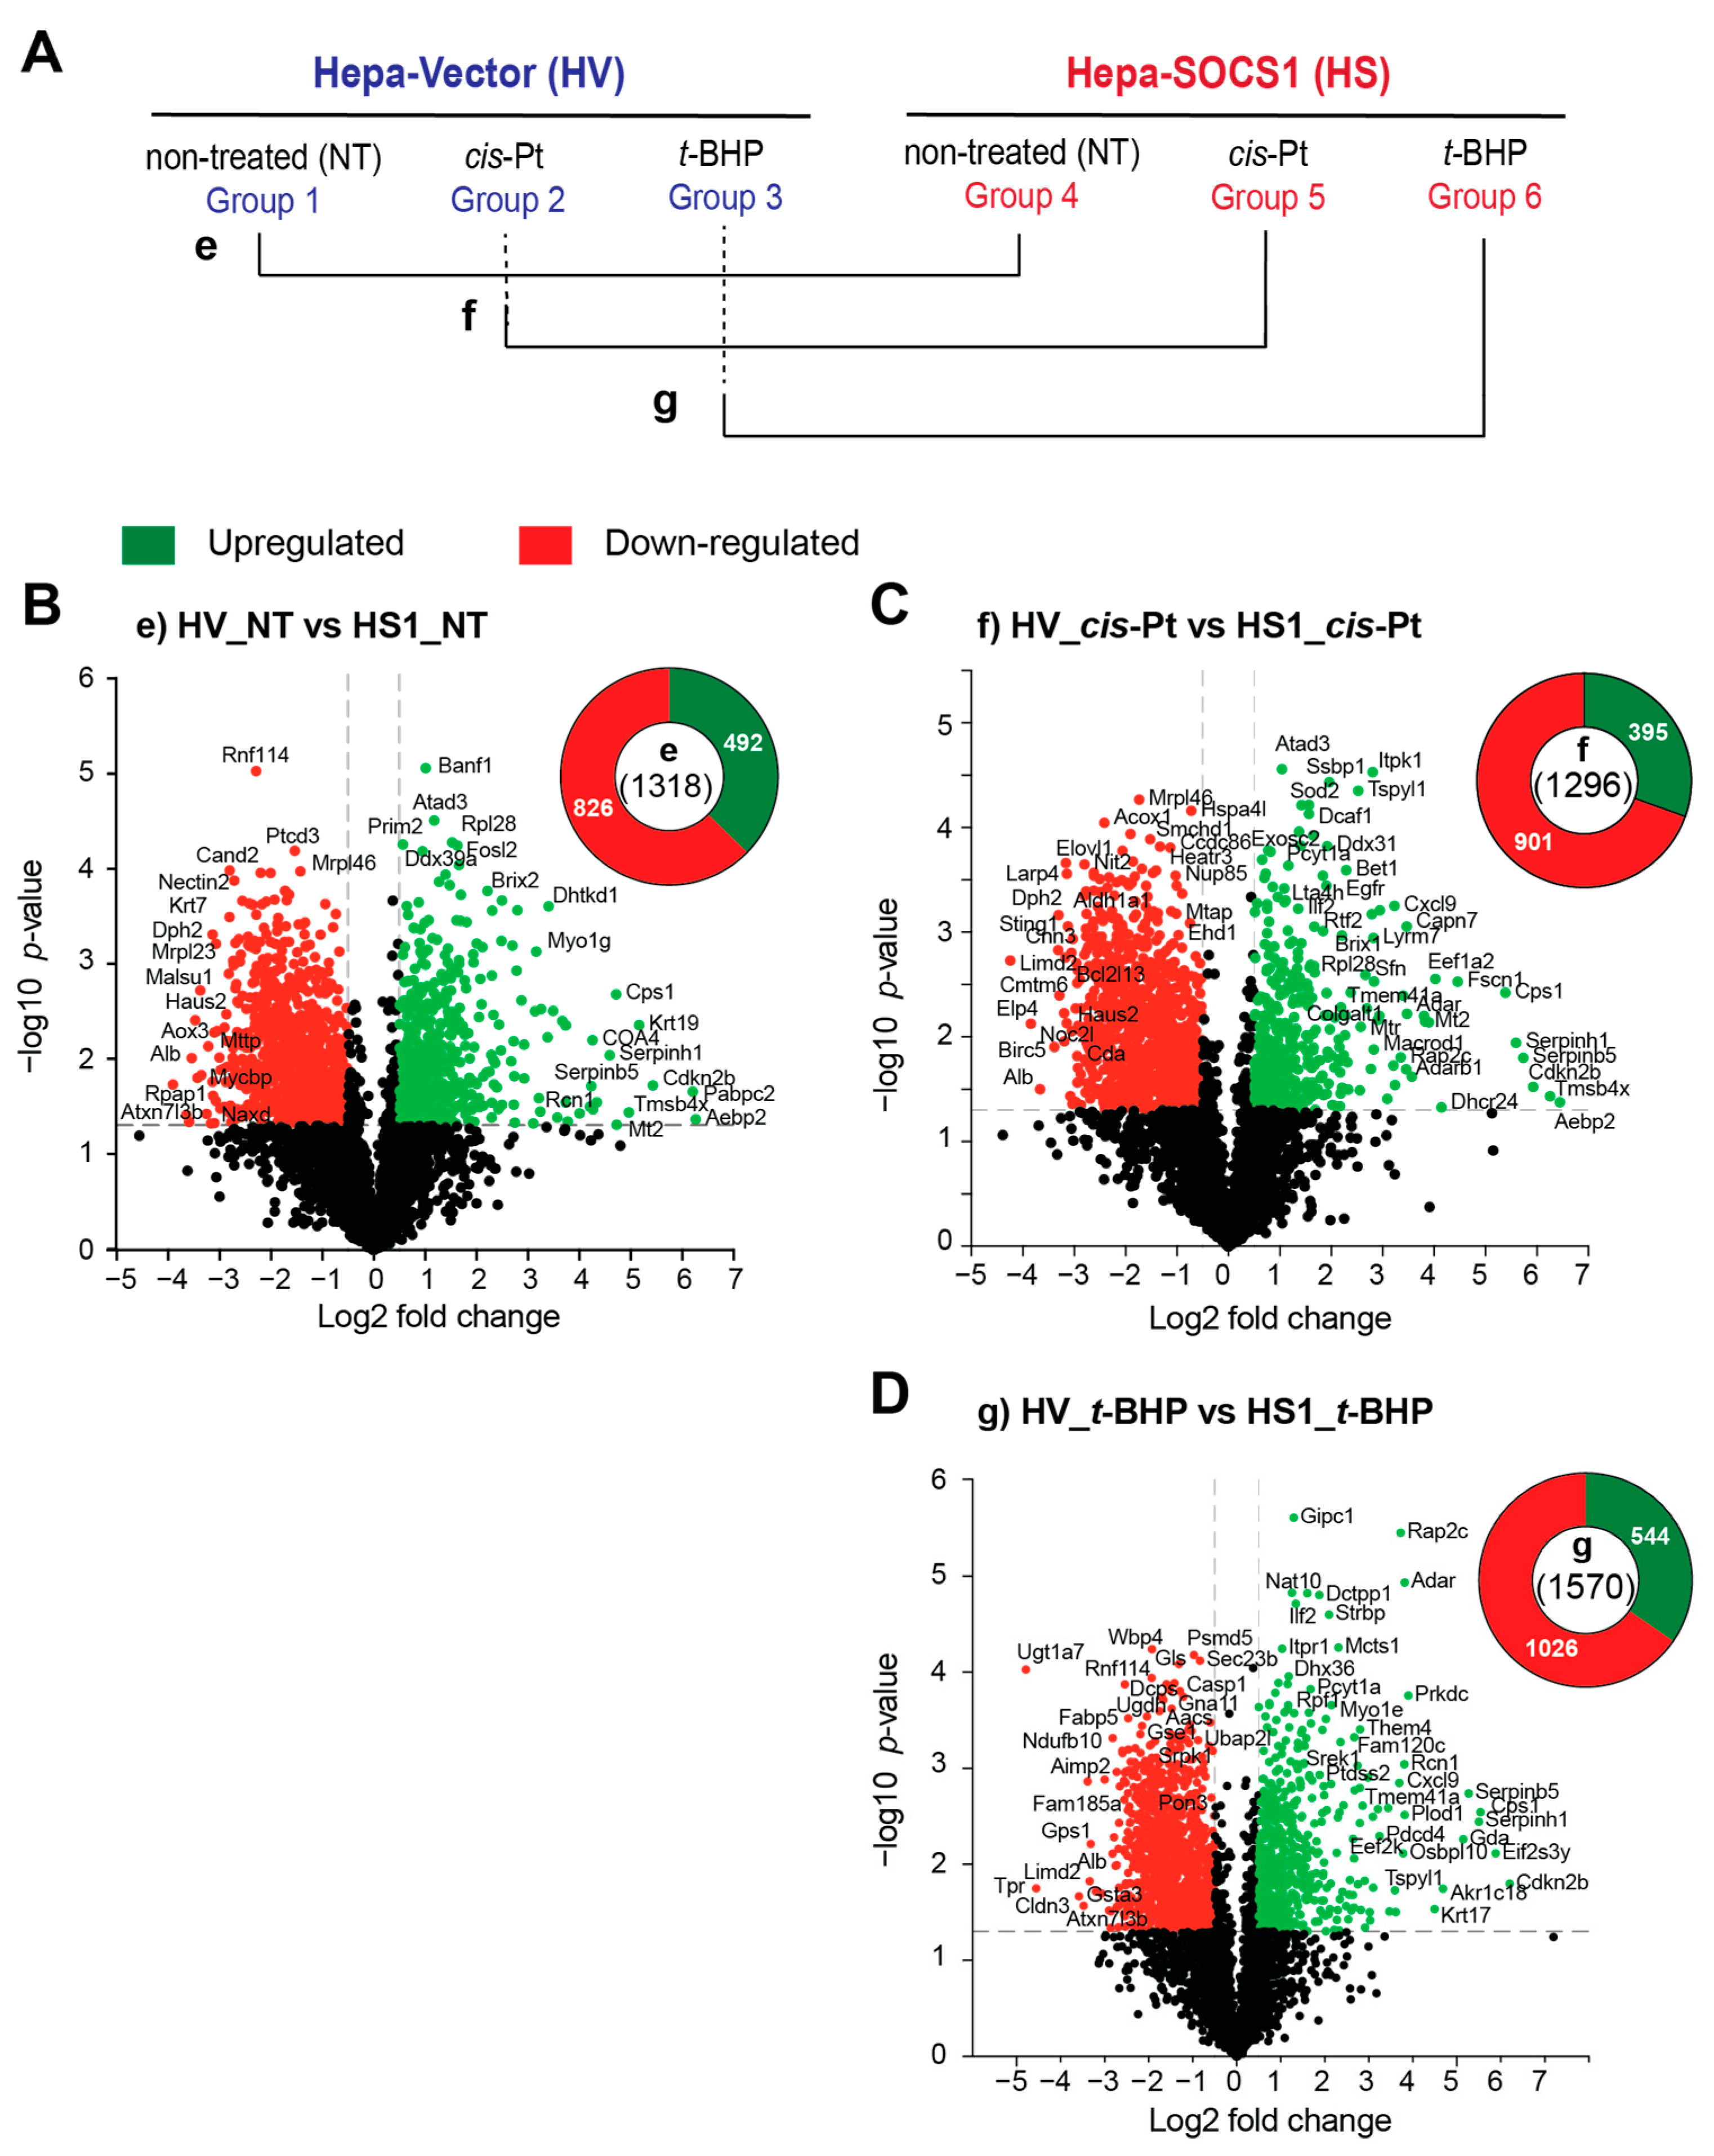
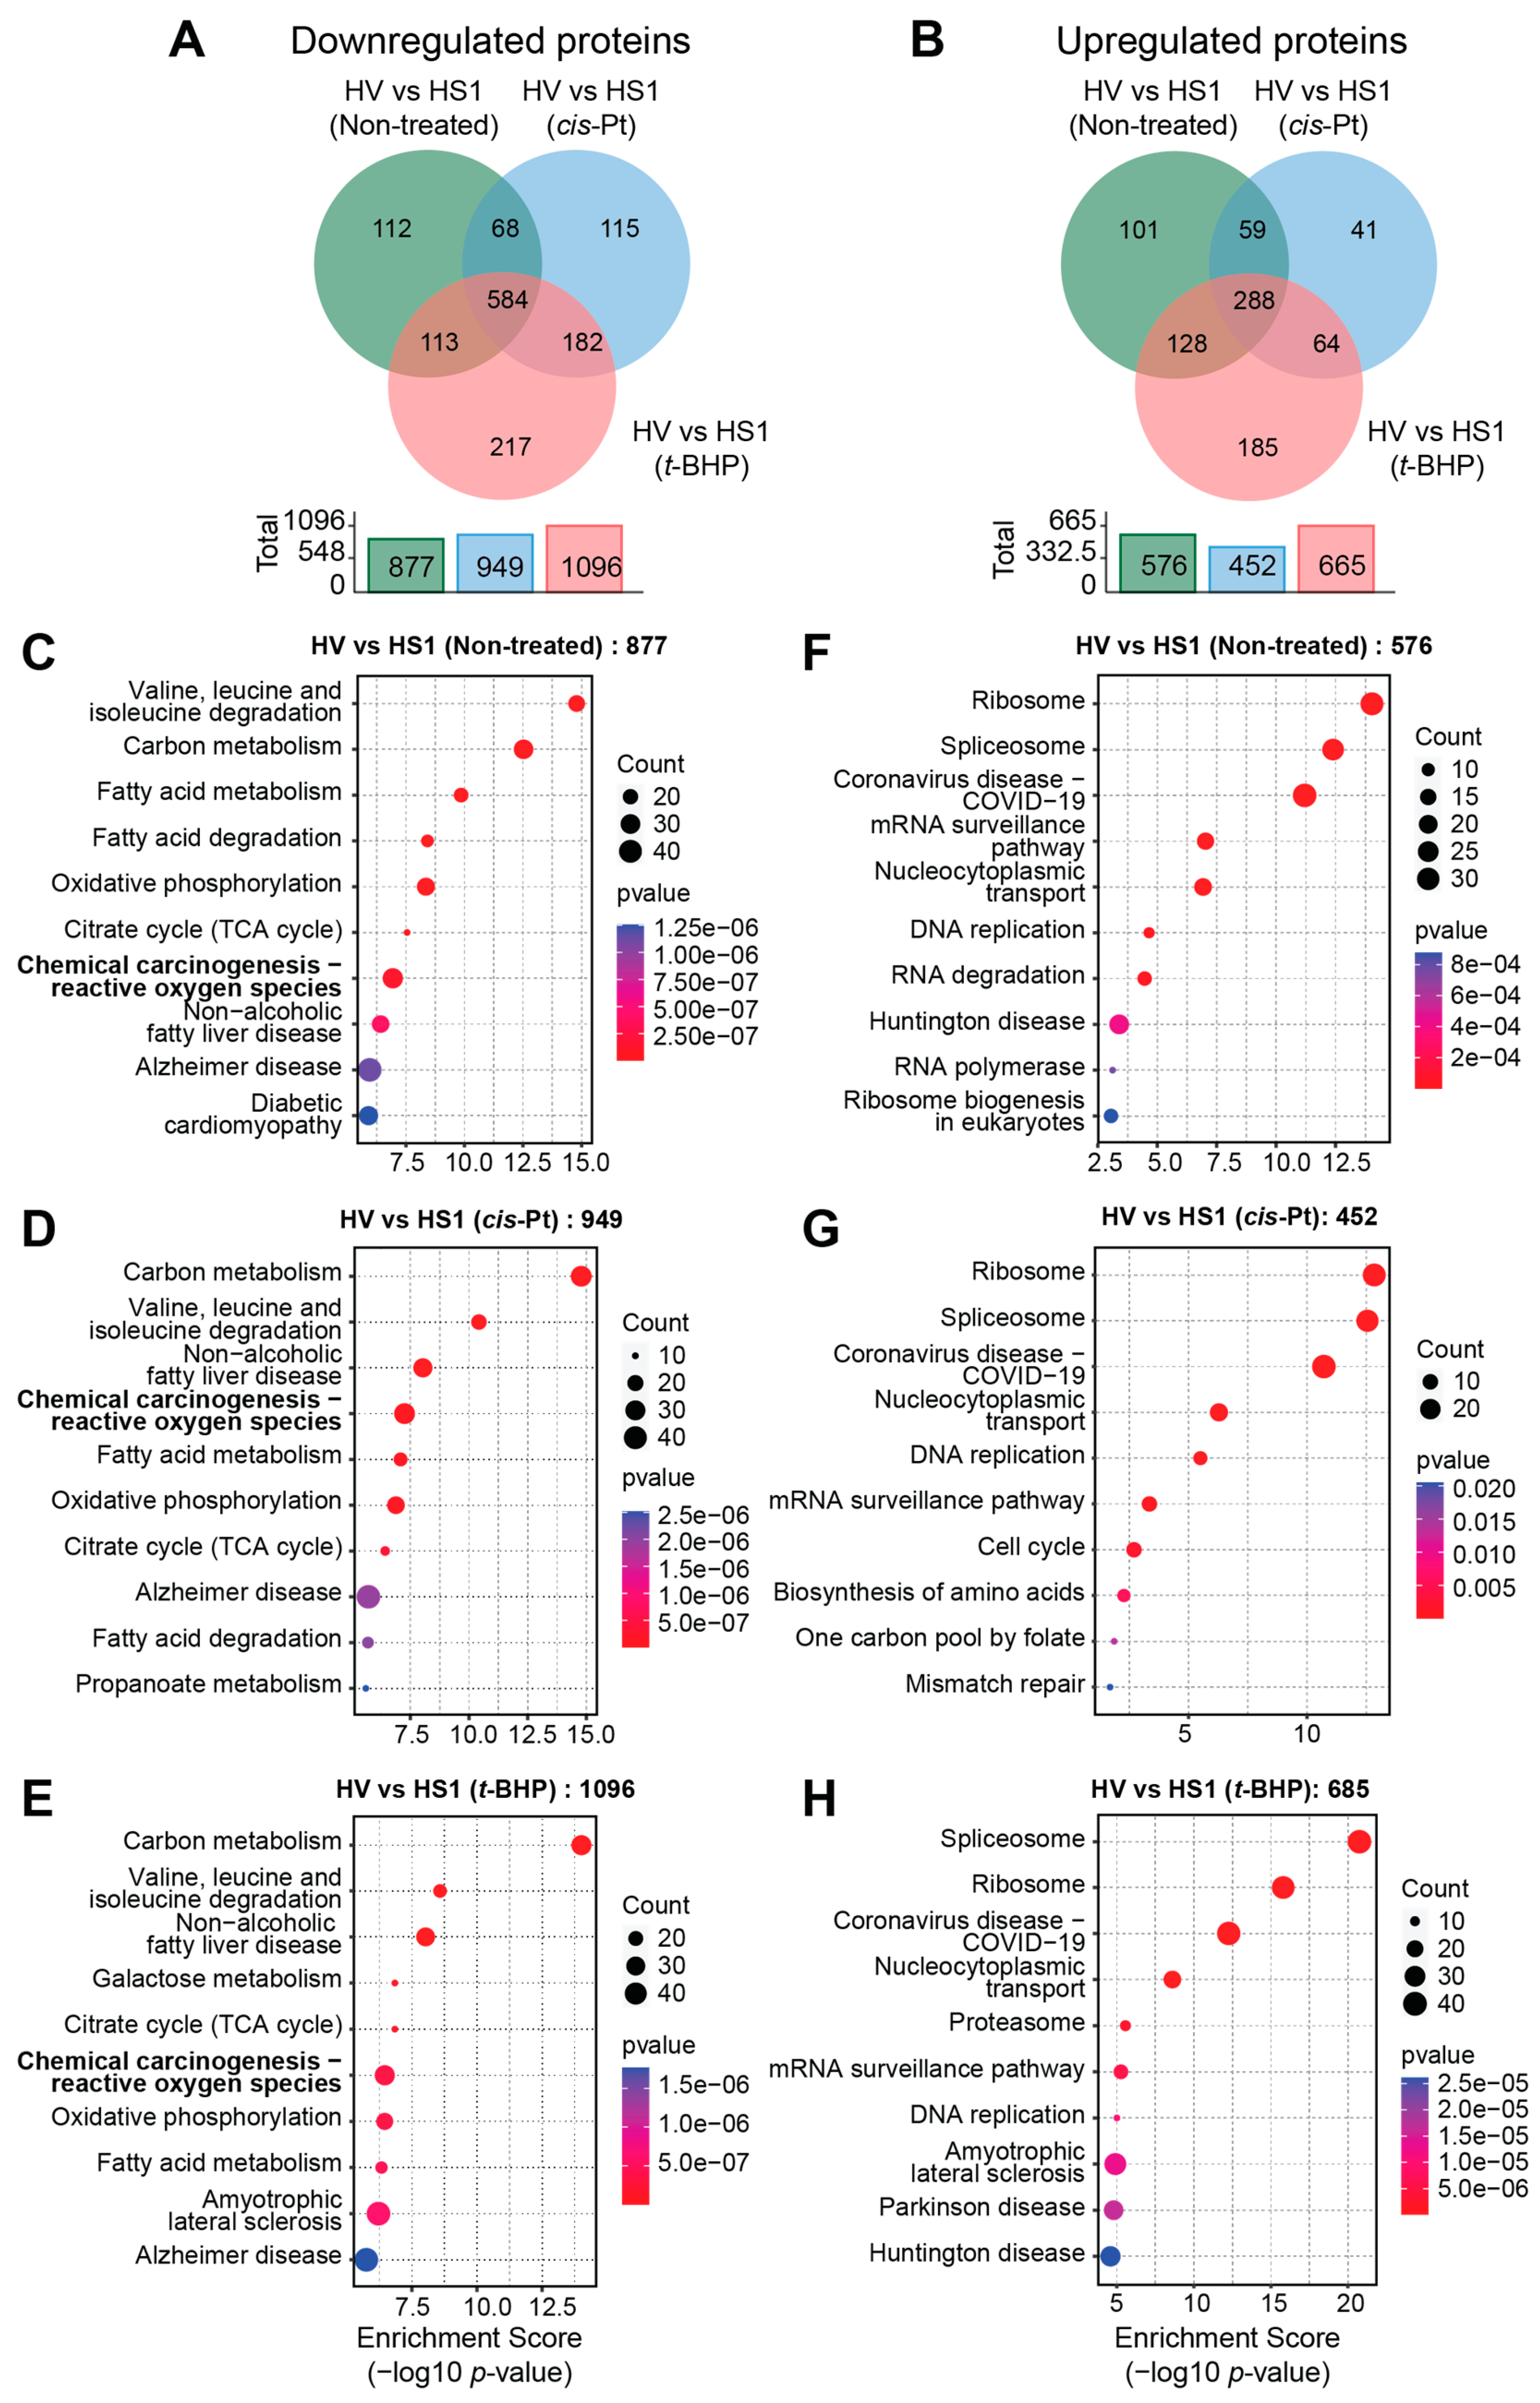
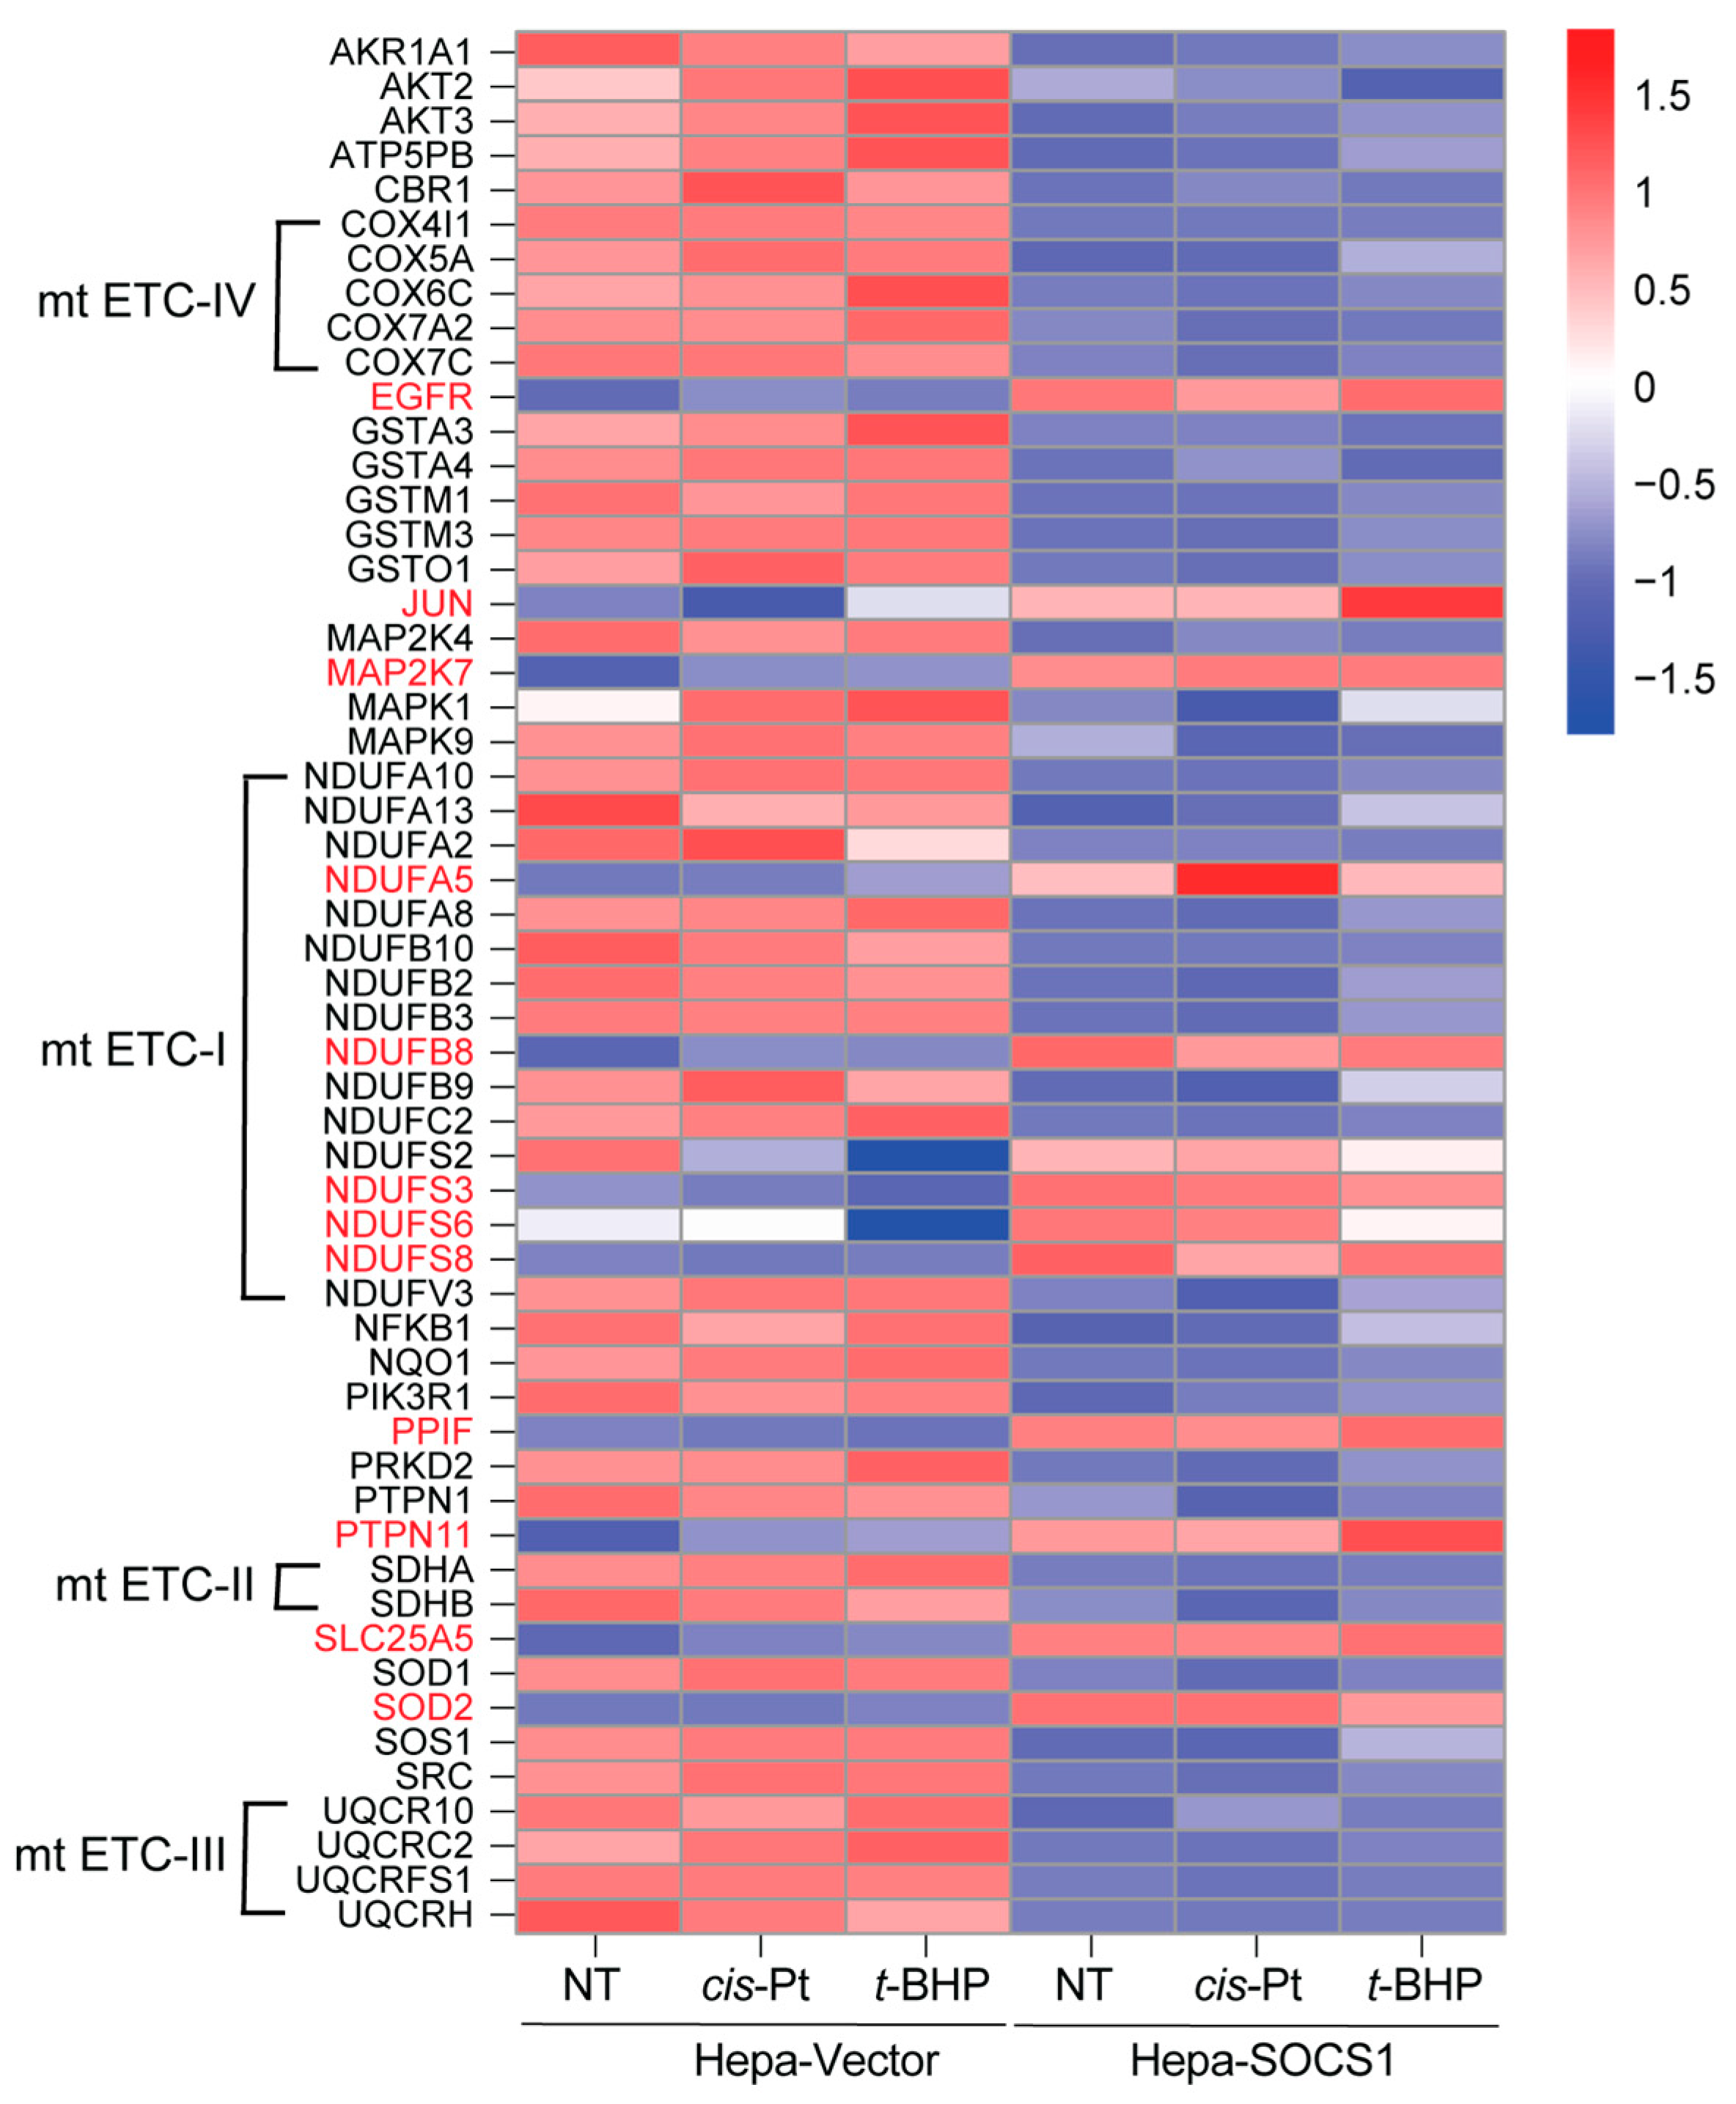
3.7. SOCS1 Downregulates the Oxidative Stress Response Pathway
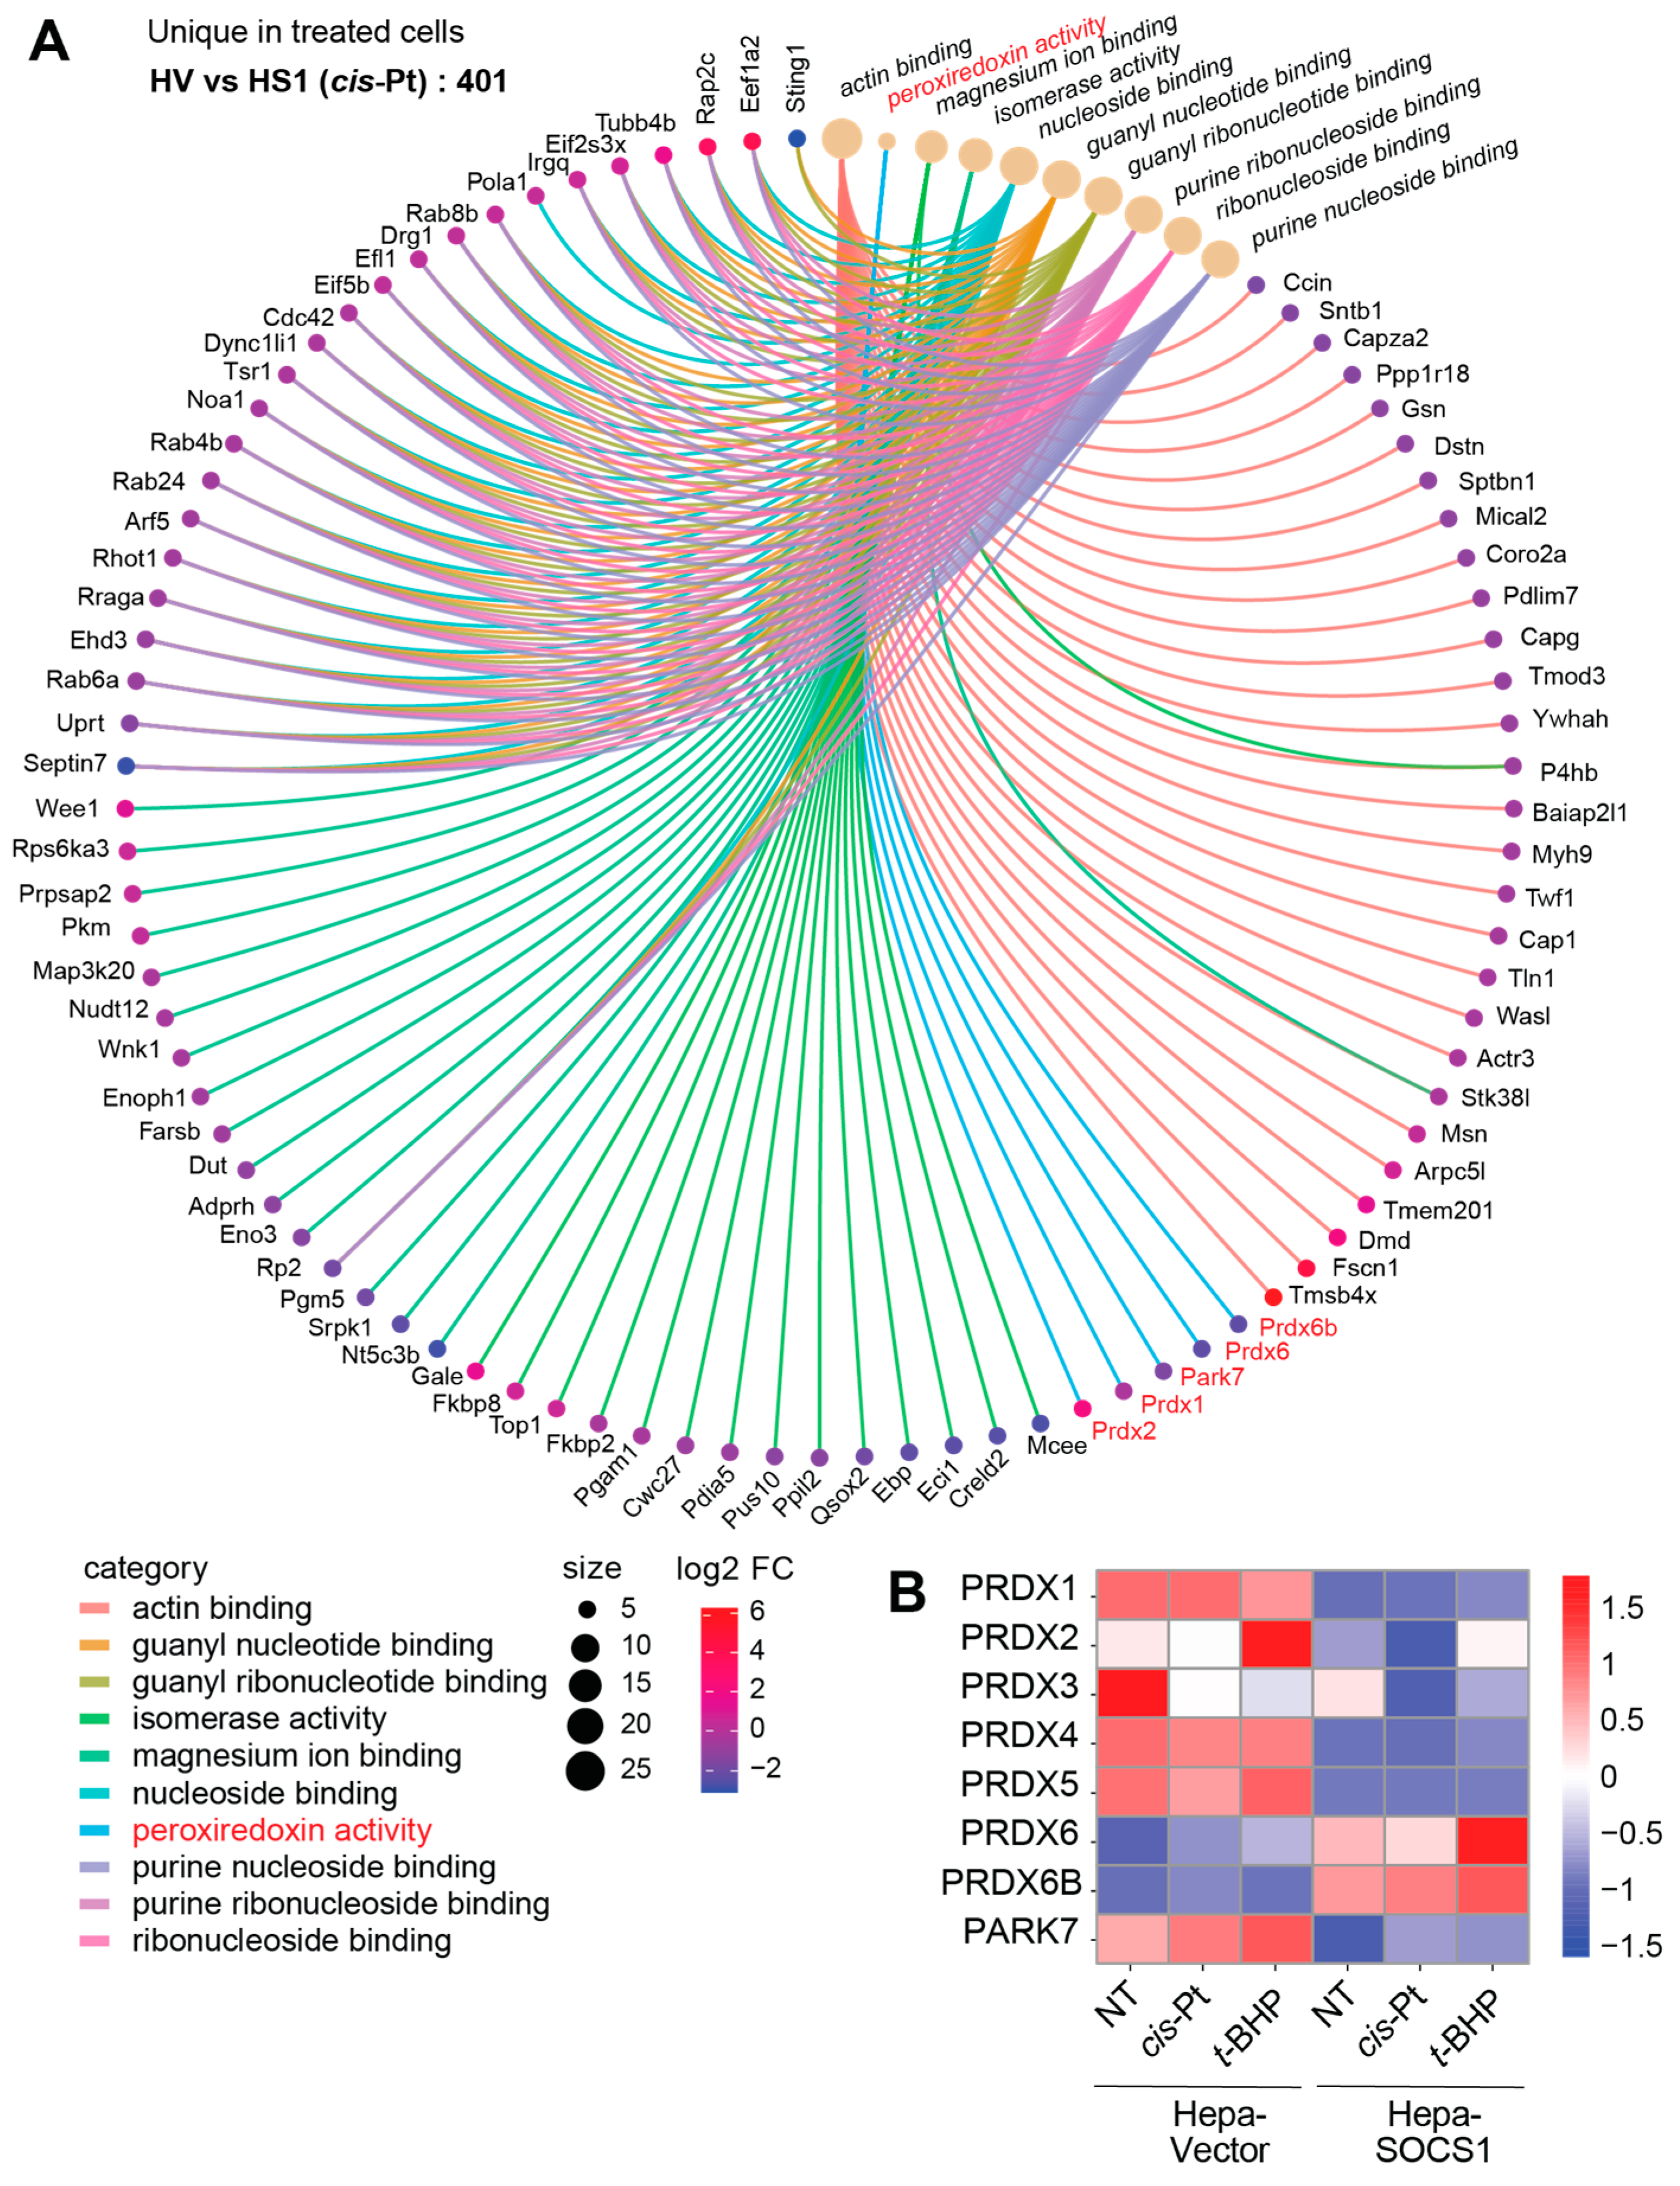
3.8. Modulation of Peroxiredoxins by SOCS1
4. Discussion
5. Conclusions
Supplementary Materials
Author Contributions
Funding
Institutional Review Board Statement
Informed Consent Statement
Data Availability Statement
Acknowledgments
Conflicts of Interest
References
- Starr, R.; Willson, T.A.; Viney, E.M.; Murray, L.J.; Rayner, J.R.; Jenkins, B.J.; Gonda, T.J.; Alexander, W.S.; Metcalf, D.; Nicola, N.A.; et al. A family of cytokine-inducible inhibitors of signalling. Nature 1997, 387, 917–921. [Google Scholar] [CrossRef] [PubMed]
- Endo, T.A.; Masuhara, M.; Yokouchi, M.; Suzuki, R.; Sakamoto, H.; Mitsui, K.; Matsumoto, A.; Tanimura, S.; Ohtsubo, M.; Misawa, H.; et al. A new protein containing an SH2 domain that inhibits JAK kinases. Nature 1997, 387, 921–924. [Google Scholar] [CrossRef] [PubMed]
- Marine, J.C.; Topham, D.J.; McKay, C.; Wang, D.; Parganas, E.; Stravopodis, D.; Yoshimura, A.; Ihle, J.N. SOCS1 deficiency causes a lymphocyte-dependent perinatal lethality. Cell 1999, 98, 609–616. [Google Scholar] [CrossRef] [PubMed]
- Alexander, W.S.; Starr, R.; Fenner, J.E.; Scott, C.L.; Handman, E.; Sprigg, N.S.; Corbin, J.E.; Cornish, A.L.; Darwiche, R.; Owczarek, C.M.; et al. SOCS1 is a critical inhibitor of interferon gamma signaling and prevents the potentially fatal neonatal actions of this cytokine. Cell 1999, 98, 597–608. [Google Scholar] [CrossRef] [PubMed]
- Kinjyo, I.; Hanada, T.; Inagaki-Ohara, K.; Mori, H.; Aki, D.; Ohishi, M.; Yoshida, H.; Kubo, M.; Yoshimura, A. SOCS1/JAB is a negative regulator of LPS-induced macrophage activation. Immunity 2002, 17, 583–591. [Google Scholar] [CrossRef] [PubMed]
- Nakagawa, R.; Naka, T.; Tsutsui, H.; Fujimoto, M.; Kimura, A.; Abe, T.; Seki, E.; Sato, S.; Takeuchi, O.; Takeda, K.; et al. SOCS-1 participates in negative regulation of LPS responses. Immunity 2002, 17, 677–687. [Google Scholar] [CrossRef] [PubMed]
- Alexander, W.S. Suppressors of cytokine signalling (SOCS) in the immune system. Nat. Rev. Immunol. 2002, 2, 410–416. [Google Scholar] [CrossRef]
- Yoshimura, A.; Ito, M.; Chikuma, S.; Akanuma, T.; Nakatsukasa, H. Negative Regulation of Cytokine Signaling in Immunity. Cold Spring Harb. Perspect. Biol. 2018, 10, a028571. [Google Scholar] [CrossRef]
- De Sepulveda, P.; Okkenhaug, K.; Rose, J.L.; Hawley, R.G.; Dubreuil, P.; Rottapel, R. Socs1 binds to multiple signalling proteins and suppresses steel factor- dependent proliferation. EMBO J. 1999, 18, 904–915. [Google Scholar] [CrossRef]
- Xia, L.; Wang, L.; Chung, A.S.; Ivanov, S.S.; Ling, M.Y.; Dragoi, A.M.; Platt, A.; Gilmer, T.M.; Fu, X.Y.; Chin, Y.E. Identification of both positive and negative domains within the epidermal growth factor receptor COOH-terminal region for signal transducer and activator of transcription (STAT) activation. J. Biol. Chem. 2002, 277, 30716–30723. [Google Scholar] [CrossRef]
- Seki, E.; Kondo, Y.; Iimuro, Y.; Naka, T.; Son, G.; Kishimoto, T.; Fujimoto, J.; Tsutsui, H.; Nakanishi, K. Demonstration of cooperative contribution of MET- and EGFR-mediated STAT3 phosphorylation to liver regeneration by exogenous suppressor of cytokine signalings. J. Hepatol. 2008, 48, 237–245. [Google Scholar] [CrossRef] [PubMed]
- Gui, Y.; Yeganeh, M.; Ramanathan, S.; Leblanc, C.; Pomerleau, V.; Ferbeyre, G.; Saucier, C.; Ilangumaran, S. SOCS1 controls liver regeneration by regulating HGF signaling in hepatocytes. J. Hepatol. 2011, 55, 1300–1308. [Google Scholar] [CrossRef] [PubMed]
- Gui, Y.; Yeganeh, M.; Donates, Y.C.; Tobelaim, W.S.; Chababi, W.; Mayhue, M.; Yoshimura, A.; Ramanathan, S.; Saucier, C.; Ilangumaran, S. Regulation of MET receptor tyrosine kinase signaling by suppressor of cytokine signaling 1 in hepatocellular carcinoma. Oncogene 2015, 34, 5718–5728. [Google Scholar] [CrossRef] [PubMed]
- Kazi, J.U.; Kabir, N.N.; Flores-Morales, A.; Ronnstrand, L. SOCS proteins in regulation of receptor tyrosine kinase signaling. Cell. Mol. Life Sci. CMLS 2014, 71, 3297–3310. [Google Scholar] [CrossRef] [PubMed]
- De Sepulveda, P.; Ilangumaran, S.; Rottapel, R. Suppressor of cytokine signaling-1 inhibits VAV function through protein degradation. J. Biol. Chem. 2000, 275, 14005–14008. [Google Scholar] [CrossRef] [PubMed]
- Ilangumaran, S.; Ramanathan, S.; Rottapel, R. Regulation of the immune system by SOCS family adaptor proteins. Semin. Immunol. 2004, 16, 351–365. [Google Scholar] [CrossRef] [PubMed]
- Okumura, F.; Joo-Okumura, A.; Nakatsukasa, K.; Kamura, T. The role of cullin 5-containing ubiquitin ligases. Cell Div. 2016, 11, 1. [Google Scholar] [CrossRef] [PubMed]
- Yoshikawa, H.; Matsubara, K.; Qian, G.S.; Jackson, P.; Groopman, J.D.; Manning, J.E.; Harris, C.C.; Herman, J.G. SOCS-1, a negative regulator of the JAK/STAT pathway, is silenced by methylation in human hepatocellular carcinoma and shows growth-suppression activity. Nat. Genet. 2001, 28, 29–35. [Google Scholar] [CrossRef]
- Zardo, G.; Tiirikainen, M.I.; Hong, C.; Misra, A.; Feuerstein, B.G.; Volik, S.; Collins, C.C.; Lamborn, K.R.; Bollen, A.; Pinkel, D.; et al. Integrated genomic and epigenomic analyses pinpoint biallelic gene inactivation in tumors. Nat. Genet. 2002, 32, 453–458. [Google Scholar] [CrossRef]
- Sutherland, K.D.; Lindeman, G.J.; Choong, D.Y.; Wittlin, S.; Brentzell, L.; Phillips, W.; Campbell, I.G.; Visvader, J.E. Differential hypermethylation of SOCS genes in ovarian and breast carcinomas. Oncogene 2004, 23, 7726–7733. [Google Scholar] [CrossRef]
- Goel, A.; Xicola, R.M.; Nguyen, T.P.; Doyle, B.J.; Sohn, V.R.; Bandipalliam, P.; Rozek, L.S.; Reyes, J.; Cordero, C.; Balaguer, F.; et al. Aberrant DNA methylation in hereditary nonpolyposis colorectal cancer without mismatch repair deficiency. Gastroenterology 2010, 138, 1854–1862. [Google Scholar] [CrossRef] [PubMed]
- Shiovitz, S.; Bertagnolli, M.M.; Renfro, L.A.; Nam, E.; Foster, N.R.; Dzieciatkowski, S.; Luo, Y.; Lao, V.V.; Monnat, R.J., Jr.; Emond, M.J.; et al. CpG island methylator phenotype is associated with response to adjuvant irinotecan-based therapy for stage III colon cancer. Gastroenterology 2014, 147, 637–645. [Google Scholar] [CrossRef] [PubMed]
- Weniger, M.A.; Melzner, I.; Menz, C.K.; Wegener, S.; Bucur, A.J.; Dorsch, K.; Mattfeldt, T.; Barth, T.F.; Moller, P. Mutations of the tumor suppressor gene SOCS-1 in classical Hodgkin lymphoma are frequent and associated with nuclear phospho-STAT5 accumulation. Oncogene 2006, 25, 2679–2684. [Google Scholar] [CrossRef] [PubMed]
- Jiang, S.; Zhang, H.W.; Lu, M.H.; He, X.H.; Li, Y.; Gu, H.; Liu, M.F.; Wang, E.D. MicroRNA-155 functions as an OncomiR in breast cancer by targeting the suppressor of cytokine signaling 1 gene. Cancer Res. 2010, 70, 3119–3127. [Google Scholar] [CrossRef]
- Kobayashi, N.; Uemura, H.; Nagahama, K.; Okudela, K.; Furuya, M.; Ino, Y.; Ito, Y.; Hirano, H.; Inayama, Y.; Aoki, I.; et al. Identification of miR-30d as a novel prognostic maker of prostate cancer. Oncotarget 2012, 3, 1455–1471. [Google Scholar] [CrossRef] [PubMed]
- Inagaki-Ohara, K.; Kondo, T.; Ito, M.; Yoshimura, A. SOCS, inflammation, and cancer. Jak-Stat 2013, 2, e24053. [Google Scholar] [CrossRef]
- Trengove, M.C.; Ward, A.C. SOCS proteins in development and disease. Am. J. Clin. Exp. Immunol. 2013, 2, 1. [Google Scholar]
- Sasi, W.; Sharma, A.K.; Mokbel, K. The role of suppressors of cytokine signalling in human neoplasms. Mol. Biol. Int. 2014, 2014, 630797. [Google Scholar] [CrossRef]
- Metcalf, D.; Mifsud, S.; Di Rago, L.; Nicola, N.A.; Hilton, D.J.; Alexander, W.S. Polycystic kidneys and chronic inflammatory lesions are the delayed consequences of loss of the suppressor of cytokine signaling-1 (SOCS-1). Proc. Natl. Acad. Sci. USA 2002, 99, 943–948. [Google Scholar] [CrossRef]
- Hanada, T.; Kobayashi, T.; Chinen, T.; Saeki, K.; Takaki, H.; Koga, K.; Minoda, Y.; Sanada, T.; Yoshioka, T.; Mimata, H.; et al. IFNgamma-dependent, spontaneous development of colorectal carcinomas in SOCS1-deficient mice. J. Exp. Med. 2006, 203, 1391–1397. [Google Scholar] [CrossRef]
- Yeganeh, M.; Gui, Y.; Kandhi, R.; Bobbala, D.; Tobelaim, W.S.; Saucier, C.; Yoshimura, A.; Ferbeyre, G.; Ramanathan, S.; Ilangumaran, S. Suppressor of cytokine signaling 1-dependent regulation of the expression and oncogenic functions of p21(CIP1/WAF1) in the liver. Oncogene 2016, 35, 4200–4211. [Google Scholar] [CrossRef] [PubMed]
- Khan, M.G.M.; Boufaied, N.; Yeganeh, M.; Kandhi, R.; Petkiewicz, S.; Sharma, A.; Yoshimura, A.; Ferbeyre, G.; Labbe, D.P.; Ramanathan, S.; et al. SOCS1 Deficiency Promotes Hepatocellular Carcinoma via SOCS3-Dependent CDKN1A Induction and NRF2 Activation. Cancers 2023, 15, 905. [Google Scholar] [CrossRef] [PubMed]
- Frantsve, J.; Schwaller, J.; Sternberg, D.W.; Kutok, J.; Gilliland, D.G. Socs-1 Inhibits TEL-JAK2-Mediated Transformation of Hematopoietic Cells through Inhibition of JAK2 Kinase Activity and Induction of Proteasome-Mediated Degradation. Mol. Cell. Biol. 2001, 21, 3547–3557. [Google Scholar] [CrossRef] [PubMed]
- Calabrese, V.; Mallette, F.A.; Deschenes-Simard, X.; Ramanathan, S.; Gagnon, J.; Moores, A.; Ilangumaran, S.; Ferbeyre, G. SOCS1 links cytokine signaling to p53 and senescence. Mol. Cell 2009, 36, 754–767. [Google Scholar] [CrossRef] [PubMed]
- Saint-Germain, E.; Mignacca, L.; Huot, G.; Acevedo, M.; Moineau-Vallee, K.; Calabrese, V.; Bourdeau, V.; Rowell, M.C.; Ilangumaran, S.; Lessard, F.; et al. Phosphorylation of SOCS1 Inhibits the SOCS1-p53 Tumor Suppressor Axis. Cancer Res. 2019, 79, 3306–3319. [Google Scholar] [CrossRef] [PubMed]
- Menegon, S.; Columbano, A.; Giordano, S. The Dual Roles of NRF2 in Cancer. Trends Mol. Med. 2016, 22, 578–593. [Google Scholar] [CrossRef] [PubMed]
- Komatsu, M.; Kurokawa, H.; Waguri, S.; Taguchi, K.; Kobayashi, A.; Ichimura, Y.; Sou, Y.S.; Ueno, I.; Sakamoto, A.; Tong, K.I.; et al. The selective autophagy substrate p62 activates the stress responsive transcription factor Nrf2 through inactivation of Keap1. Nat. Cell Biol. 2010, 12, 213–223. [Google Scholar] [CrossRef]
- Chen, W.; Sun, Z.; Wang, X.J.; Jiang, T.; Huang, Z.; Fang, D.; Zhang, D.D. Direct interaction between Nrf2 and p21(Cip1/WAF1) upregulates the Nrf2-mediated antioxidant response. Mol. Cell 2009, 34, 663–673. [Google Scholar] [CrossRef]
- Schaur, R.J.; Siems, W.; Bresgen, N.; Eckl, P.M. 4-Hydroxy-nonenal—A Bioactive Lipid Peroxidation Product. Biomolecules 2015, 5, 2247–2337. [Google Scholar] [CrossRef]
- Fujimoto, M.; Naka, T. SOCS1, a Negative Regulator of Cytokine Signals and TLR Responses, in Human Liver Diseases. Gastroenterol. Res. Pract. 2010, 2010, 470468. [Google Scholar] [CrossRef]
- Demichev, V.; Messner, C.B.; Vernardis, S.I.; Lilley, K.S.; Ralser, M. DIA-NN: Neural networks and interference correction enable deep proteome coverage in high throughput. Nat. Methods 2020, 17, 41–44. [Google Scholar] [CrossRef] [PubMed]
- Available online: https://hub.docker.com/layers/biocontainers/diann/v1.8.1_cv1/images/sha256-c37bb6b4baa8bcc1552b8ddc103fe5e43731832feb2ed739e4b6c2cb9cf78471 (accessed on 1 November 2023).
- Bardou, P.; Mariette, J.; Escudie, F.; Djemiel, C.; Klopp, C. jvenn: An interactive Venn diagram viewer. BMC Bioinform. 2014, 15, 293. [Google Scholar] [CrossRef] [PubMed]
- Lu, Y.; Cederbaum, A.I. Cisplatin-induced hepatotoxicity is enhanced by elevated expression of cytochrome P450 2E1. Toxicol. Sci. 2006, 89, 515–523. [Google Scholar] [CrossRef] [PubMed]
- Marullo, R.; Werner, E.; Degtyareva, N.; Moore, B.; Altavilla, G.; Ramalingam, S.S.; Doetsch, P.W. Cisplatin induces a mitochondrial-ROS response that contributes to cytotoxicity depending on mitochondrial redox status and bioenergetic functions. PLoS ONE 2013, 8, e81162. [Google Scholar] [CrossRef] [PubMed]
- Kim, H.J.; Lee, J.H.; Kim, S.J.; Oh, G.S.; Moon, H.D.; Kwon, K.B.; Park, C.; Park, B.H.; Lee, H.K.; Chung, S.Y.; et al. Roles of NADPH oxidases in cisplatin-induced reactive oxygen species generation and ototoxicity. J. Neurosci. 2010, 30, 3933–3946. [Google Scholar] [CrossRef] [PubMed]
- Yu, W.; Chen, Y.; Dubrulle, J.; Stossi, F.; Putluri, V.; Sreekumar, A.; Putluri, N.; Baluya, D.; Lai, S.Y.; Sandulache, V.C. Cisplatin generates oxidative stress which is accompanied by rapid shifts in central carbon metabolism. Sci. Rep. 2018, 8, 4306. [Google Scholar] [CrossRef]
- Kleih, M.; Bopple, K.; Dong, M.; Gaissler, A.; Heine, S.; Olayioye, M.A.; Aulitzky, W.E.; Essmann, F. Direct impact of cisplatin on mitochondria induces ROS production that dictates cell fate of ovarian cancer cells. Cell Death Dis. 2019, 10, 851. [Google Scholar] [CrossRef]
- Dumont, P.; Burton, M.; Chen, Q.M.; Gonos, E.S.; Frippiat, C.; Mazarati, J.B.; Eliaers, F.; Remacle, J.; Toussaint, O. Induction of replicative senescence biomarkers by sublethal oxidative stresses in normal human fibroblast. Free Radic. Biol. Med. 2000, 28, 361–373. [Google Scholar] [CrossRef]
- Alia, M.; Ramos, S.; Mateos, R.; Bravo, L.; Goya, L. Response of the antioxidant defense system to tert-butyl hydroperoxide and hydrogen peroxide in a human hepatoma cell line (HepG2). J. Biochem. Mol. Toxicol. 2005, 19, 119–128. [Google Scholar] [CrossRef]
- Kucera, O.; Endlicher, R.; Rousar, T.; Lotkova, H.; Garnol, T.; Drahota, Z.; Cervinkova, Z. The effect of tert-butyl hydroperoxide-induced oxidative stress on lean and steatotic rat hepatocytes in vitro. Oxidative Med. Cell. Longev. 2014, 2014, 752506. [Google Scholar] [CrossRef]
- Wedel, S.; Martic, I.; Hrapovic, N.; Fabre, S.; Madreiter-Sokolowski, C.T.; Haller, T.; Pierer, G.; Ploner, C.; Jansen-Durr, P.; Cavinato, M. tBHP treatment as a model for cellular senescence and pollution-induced skin aging. Mech. Ageing Dev. 2020, 190, 111318. [Google Scholar] [CrossRef] [PubMed]
- Jung, W.K.; Park, S.B.; Yu, H.Y.; Kim, Y.H.; Kim, J. Antioxidant Efficacy of Esculetin against Tert-Butyl Hydroperoxide-Induced Oxidative Stress in HEK293 Cells. Curr. Issues Mol. Biol. 2022, 44, 5986–5994. [Google Scholar] [CrossRef]
- Kwak, M.K.; Itoh, K.; Yamamoto, M.; Kensler, T.W. Enhanced expression of the transcription factor Nrf2 by cancer chemopreventive agents: Role of antioxidant response element-like sequences in the nrf2 promoter. Mol. Cell. Biol. 2002, 22, 2883–2892. [Google Scholar] [CrossRef]
- Kim, M.J.; Jeon, J.H. Recent Advances in Understanding Nrf2 Agonism and Its Potential Clinical Application to Metabolic and Inflammatory Diseases. Int. J. Mol. Sci. 2022, 23, 2846. [Google Scholar] [CrossRef] [PubMed]
- Jaganjac, M.; Milkovic, L.; Sunjic, S.B.; Zarkovic, N. The NRF2, Thioredoxin, and Glutathione System in Tumorigenesis and Anticancer Therapies. Antioxidants 2020, 9, 1151. [Google Scholar] [CrossRef] [PubMed]
- Lu, S.C. Regulation of glutathione synthesis. Mol. Aspects Med. 2009, 30, 42–59. [Google Scholar] [CrossRef] [PubMed]
- Sun, J.; Zhou, C.; Ma, Q.; Chen, W.; Atyah, M.; Yin, Y.; Fu, P.; Liu, S.; Hu, B.; Ren, N.; et al. High GCLC level in tumor tissues is associated with poor prognosis of hepatocellular carcinoma after curative resection. J. Cancer 2019, 10, 3333–3343. [Google Scholar] [CrossRef]
- Thapa, P.; Jiang, H.; Ding, N.; Hao, Y.; Alshahrani, A.; Wei, Q. The Role of Peroxiredoxins in Cancer Development. Biology 2023, 12, 666. [Google Scholar] [CrossRef]
- Nicolussi, A.; D’Inzeo, S.; Capalbo, C.; Giannini, G.; Coppa, A. The role of peroxiredoxins in cancer. Mol. Clin. Oncol. 2017, 6, 139–153. [Google Scholar] [CrossRef]
- Perkins, A.; Nelson, K.J.; Parsonage, D.; Poole, L.B.; Karplus, P.A. Peroxiredoxins: Guardians against oxidative stress and modulators of peroxide signaling. Trends Biochem. Sci. 2015, 40, 435–445. [Google Scholar] [CrossRef]
- Covarrubias, L.; Hernandez-Garcia, D.; Schnabel, D.; Salas-Vidal, E.; Castro-Obregon, S. Function of reactive oxygen species during animal development: Passive or active? Dev. Biol. 2008, 320, 1–11. [Google Scholar] [CrossRef] [PubMed]
- Taverne, Y.J.; Merkus, D.; Bogers, A.J.; Halliwell, B.; Duncker, D.J.; Lyons, T.W. Reactive Oxygen Species: Radical Factors in the Evolution of Animal Life: A molecular timescale from Earth’s earliest history to the rise of complex life. Bioessays 2018, 40, 1700158. [Google Scholar] [CrossRef] [PubMed]
- Wang, Y.; Qi, H.; Liu, Y.; Duan, C.; Liu, X.; Xia, T.; Chen, D.; Piao, H.L.; Liu, H.X. The double-edged roles of ROS in cancer prevention and therapy. Theranostics 2021, 11, 4839–4857. [Google Scholar] [CrossRef] [PubMed]
- Brandes, R.P.; Weissmann, N.; Schroder, K. Nox family NADPH oxidases: Molecular mechanisms of activation. Free Radic. Biol. Med. 2014, 76, 208–226. [Google Scholar] [CrossRef]
- Veal, E.A.; Day, A.M.; Morgan, B.A. Hydrogen peroxide sensing and signaling. Mol. Cell 2007, 26, 1–14. [Google Scholar] [CrossRef]
- Sullivan, L.B.; Chandel, N.S. Mitochondrial reactive oxygen species and cancer. Cancer Metab. 2014, 2, 17. [Google Scholar] [CrossRef] [PubMed]
- Lennicke, C.; Rahn, J.; Lichtenfels, R.; Wessjohann, L.A.; Seliger, B. Hydrogen peroxide—Production, fate and role in redox signaling of tumor cells. Cell. Commun. Signal. 2015, 13, 39. [Google Scholar] [CrossRef]
- Redza-Dutordoir, M.; Averill-Bates, D.A. Activation of apoptosis signalling pathways by reactive oxygen species. Biochim. Biophys. Acta 2016, 1863, 2977–2992. [Google Scholar] [CrossRef]
- Jaramillo, M.C.; Zhang, D.D. The emerging role of the Nrf2-Keap1 signaling pathway in cancer. Genes Dev. 2013, 27, 2179–2191. [Google Scholar] [CrossRef]
- Ma, Q. Role of nrf2 in oxidative stress and toxicity. Annu. Rev. Pharmacol. Toxicol. 2013, 53, 401–426. [Google Scholar] [CrossRef]
- Halliwell, B. Oxidative stress and cancer: Have we moved forward? Biochem. J. 2007, 401, 1–11. [Google Scholar] [CrossRef] [PubMed]
- Liu, B.; Chen, Y.; St Clair, D.K. ROS and p53: A versatile partnership. Free Radic. Biol. Med. 2008, 44, 1529–1535. [Google Scholar] [CrossRef] [PubMed]
- Karplus, P.A. A primer on peroxiredoxin biochemistry. Free Radic. Biol. Med. 2015, 80, 183–190. [Google Scholar] [CrossRef] [PubMed]
- Gorrini, C.; Harris, I.S.; Mak, T.W. Modulation of oxidative stress as an anticancer strategy. Nat. Rev. Drug Discov. 2013, 12, 931–947. [Google Scholar] [CrossRef] [PubMed]
- Perillo, B.; Di Donato, M.; Pezone, A.; Di Zazzo, E.; Giovannelli, P.; Galasso, G.; Castoria, G.; Migliaccio, A. ROS in cancer therapy: The bright side of the moon. Exp. Mol. Med. 2020, 52, 192–203. [Google Scholar] [CrossRef] [PubMed]
- Miao, L.; St Clair, D.K. Regulation of superoxide dismutase genes: Implications in disease. Free Radic. Biol. Med. 2009, 47, 344–356. [Google Scholar] [CrossRef] [PubMed]
- Kang, S.W.; Lee, S.; Lee, J.H.S. Cancer-Associated Function of 2-Cys Peroxiredoxin Subtypes as a Survival Gatekeeper. Antioxidants 2018, 7, 161. [Google Scholar] [CrossRef]
- Matsuzawa, A. Thioredoxin and redox signaling: Roles of the thioredoxin system in control of cell fate. Arch. Biochem. Biophys. 2017, 617, 101–105. [Google Scholar] [CrossRef]
- Oh, J.; Hur, M.W.; Lee, C.E. SOCS1 protects protein tyrosine phosphatases by thioredoxin upregulation and attenuates Jaks to suppress ROS-mediated apoptosis. Oncogene 2009, 28, 3145–3156. [Google Scholar] [CrossRef]
- Polonen, P.; Jawahar Deen, A.; Leinonen, H.M.; Jyrkkanen, H.K.; Kuosmanen, S.; Mononen, M.; Jain, A.; Tuomainen, T.; Pasonen-Seppanen, S.; Hartikainen, J.M.; et al. Nrf2 and SQSTM1/p62 jointly contribute to mesenchymal transition and invasion in glioblastoma. Oncogene 2019, 38, 7473–7490. [Google Scholar] [CrossRef]
- Rooney, J.; Oshida, K.; Vasani, N.; Vallanat, B.; Ryan, N.; Chorley, B.N.; Wang, X.; Bell, D.A.; Wu, K.C.; Aleksunes, L.M.; et al. Activation of Nrf2 in the liver is associated with stress resistance mediated by suppression of the growth hormone-regulated STAT5b transcription factor. PLoS ONE 2018, 13, e0200004. [Google Scholar] [CrossRef] [PubMed]
- Singh, A.; Boldin-Adamsky, S.; Thimmulappa, R.K.; Rath, S.K.; Ashush, H.; Coulter, J.; Blackford, A.; Goodman, S.N.; Bunz, F.; Watson, W.H.; et al. RNAi-mediated silencing of nuclear factor erythroid-2-related factor 2 gene expression in non-small cell lung cancer inhibits tumor growth and increases efficacy of chemotherapy. Cancer Res. 2008, 68, 7975–7984. [Google Scholar] [CrossRef] [PubMed]
- Rojo de la Vega, M.; Chapman, E.; Zhang, D.D. NRF2 and the Hallmarks of Cancer. Cancer Cell. 2018, 34, 21–43. [Google Scholar] [CrossRef] [PubMed]
- Yuan, K.; Xie, K.; Lan, T.; Xu, L.; Chen, X.; Li, X.; Liao, M.; Li, J.; Huang, J.; Zeng, Y.; et al. TXNDC12 promotes EMT and metastasis of hepatocellular carcinoma cells via activation of beta-catenin. Cell Death Differ. 2020, 27, 1355–1368. [Google Scholar] [CrossRef]
- Kocaturk, B. Identification of thioredoxin domain containing family members’ expression pattern and prognostic value in diffuse gliomas via in silico analysis. Cancer Med. 2023, 12, 3830–3844. [Google Scholar] [CrossRef]
- Tang, L.; Yu, Y.; Deng, W.; Liu, J.; Wang, Y.; Ye, F.; Kang, R.; Tang, D.; He, Q. TXNDC12 inhibits lipid peroxidation and ferroptosis. iScience 2023, 26, 108393. [Google Scholar] [CrossRef]
- Saint-Germain, E.; Mignacca, L.; Vernier, M.; Bobbala, D.; Ilangumaran, S.; Ferbeyre, G. SOCS1 regulates senescence and ferroptosis by modulating the expression of p53 target genes. Aging 2017, 9, 2137–2162. [Google Scholar] [CrossRef]
- Vousden, K.H.; Prives, C. Blinded by the Light: The Growing Complexity of p53. Cell 2009, 137, 413–431. [Google Scholar] [CrossRef]
- Tang, D.; Chen, X.; Kang, R.; Kroemer, G. Ferroptosis: Molecular mechanisms and health implications. Cell Res. 2021, 31, 107–125. [Google Scholar] [CrossRef]
- Chen, D.; Tavana, O.; Chu, B.; Erber, L.; Chen, Y.; Baer, R.; Gu, W. NRF2 Is a Major Target of ARF in p53-Independent Tumor Suppression. Mol. Cell 2017, 68, 224–232.e224. [Google Scholar] [CrossRef]
- Chio, I.I.C.; Tuveson, D.A. ROS in Cancer: The Burning Question. Trends Mol. Med. 2017, 23, 411–429. [Google Scholar] [CrossRef] [PubMed]
- Milkovic, L.; Zarkovic, N.; Saso, L. Controversy about pharmacological modulation of Nrf2 for cancer therapy. Redox. Biol. 2017, 12, 727–732. [Google Scholar] [CrossRef] [PubMed]
- Parkinson, E.I.; Hergenrother, P.J. Deoxynyboquinones as NQO1-Activated Cancer Therapeutics. Acc. Chem. Res. 2015, 48, 2715–2723. [Google Scholar] [CrossRef] [PubMed]
- Perez-Riverol, Y.; Csordas, A.; Bai, J.; Bernal-Llinares, M.; Hewapathirana, S.; Kundu, D.J.; Inuganti, A.; Griss, J.; Mayer, G.; Eisenacher, M.; et al. The PRIDE database and related tools and resources in 2019: Improving support for quantification data. Nucleic Acids Res. 2019, 47, D442–D450. [Google Scholar] [CrossRef]
Disclaimer/Publisher’s Note: The statements, opinions and data contained in all publications are solely those of the individual author(s) and contributor(s) and not of MDPI and/or the editor(s). MDPI and/or the editor(s) disclaim responsibility for any injury to people or property resulting from any ideas, methods, instructions or products referred to in the content. |
© 2024 by the authors. Licensee MDPI, Basel, Switzerland. This article is an open access article distributed under the terms and conditions of the Creative Commons Attribution (CC BY) license (https://creativecommons.org/licenses/by/4.0/).
Share and Cite
Shukla, A.; Khan, M.G.M.; Cayarga, A.A.; Namvarpour, M.; Chowdhury, M.M.H.; Levesque, D.; Lucier, J.-F.; Boisvert, F.-M.; Ramanathan, S.; Ilangumaran, S. The Tumor Suppressor SOCS1 Diminishes Tolerance to Oxidative Stress in Hepatocellular Carcinoma. Cancers 2024, 16, 292. https://doi.org/10.3390/cancers16020292
Shukla A, Khan MGM, Cayarga AA, Namvarpour M, Chowdhury MMH, Levesque D, Lucier J-F, Boisvert F-M, Ramanathan S, Ilangumaran S. The Tumor Suppressor SOCS1 Diminishes Tolerance to Oxidative Stress in Hepatocellular Carcinoma. Cancers. 2024; 16(2):292. https://doi.org/10.3390/cancers16020292
Chicago/Turabian StyleShukla, Akhil, Md Gulam Musawwir Khan, Anny Armas Cayarga, Mozhdeh Namvarpour, Mohammad Mobarak H. Chowdhury, Dominique Levesque, Jean-François Lucier, François-Michel Boisvert, Sheela Ramanathan, and Subburaj Ilangumaran. 2024. "The Tumor Suppressor SOCS1 Diminishes Tolerance to Oxidative Stress in Hepatocellular Carcinoma" Cancers 16, no. 2: 292. https://doi.org/10.3390/cancers16020292