Article

YY1 Knockdown Relieves the Differentiation Block and Restores Apoptosis in AML Cells

by
Nelida Ines Noguera
1,2,*,†,
Serena Travaglini
1,2,†,
Stefania Scalea
3,
Caterina Catalanotto
4,
Anna Reale
4,
Michele Zampieri
4,
Alessandra Zaza
2,5,
Maria Rosaria Ricciardi
6,
Daniela Francesca Angelini
7,
Agostino Tafuri
6,
Tiziana Ottone
1,2,
Maria Teresa Voso
1,2 and
Giuseppe Zardo
3,*
1
Department of Biomedicine and Prevention, Tor Vergata University, 00133 Rome, Italy
2
Unit of Neuro-Oncoematologia, Santa Lucia Foundation IRCCS, 00143 Rome, Italy
3
Department of Experimental Medicine, Sapienza University, 00185 Rome, Italy
4
Department of Molecular Medicine, Sapienza University, 00185 Rome, Italy
5
Department of Medical and Surgical Sciences and Biotechnologies, Sapienza University, 00185 Rome, Italy
6
Department of Clinical and Molecular Medicine, Sapienza University, 00185 Rome, Italy
7
Laboratory of Neuro-Immunology and Cytofluorimetry, Santa Lucia Foundation IRCCS, 00143 Rome, Italy
*
Authors to whom correspondence should be addressed.
These authors contributed equally to this work.
Cancers 2023, 15(15), 4010; https://doi.org/10.3390/cancers15154010
Submission received: 19 June 2023 / Revised: 1 August 2023 / Accepted: 2 August 2023 / Published: 7 August 2023
(This article belongs to the Section Molecular Cancer Biology)

Abstract

:

Simple Summary

Acute myeloid leukemia (AML) is characterized by the expansion of clonally derived hematopoietic precursors undergoing a partial or complete maturation block. De novo AML is characterized by recurrent cytogenetic alterations such as chromosomal translocations. However, in the recent past, it was shown that several somatic mutations and epigenetic alterations also contribute to AML onset and progression. Epigenetic mechanisms regulate the equilibrium between self-renewal and differentiation of hematopoietic stem cells and precursors. In this context, Polycomb-group (PcG) proteins regulate the expression of genes involved in cell-cycle regulation and differentiation, and aberrant expression and/or mutations of PcG genes have been shown to occur in hematopoietic neoplasms.

Abstract

In this study we analyzed the expression of Yin and Yang 1 protein (YY1), a member of the noncanonical PcG complexes, in AML patient samples and AML cell lines and the effect of YY1 downregulation on the AML differentiation block. Our results show that YY1 is significantly overexpressed in AML patient samples and AML cell lines and that YY1 knockdown relieves the differentiation block. YY1 downregulation in two AML cell lines (HL-60 and OCI-AML3) and one AML patient sample restored the expression of members of the CEBP protein family, increased the expression of extrinsic growth factors/receptors and surface antigenic markers, induced morphological cell characteristics typical of myeloid differentiation, and sensitized cells to retinoic acid treatment and to apoptosis. Overall, our data show that YY1 is not a secondary regulator of myeloid differentiation but that, if overexpressed, it can play a predominant role in myeloid differentiation block.

1. Introduction

Acute myeloid leukemia (AML) is characterized by the expansion of clonally derived hematopoietic precursors undergoing a partial or a complete maturation block. De novo AML is characterized by recurrent cytogenetic alterations, such as chromosomal translocations [1], somatic mutations [2], and epigenetic alterations [3]. Epigenetic drivers of de novo AML include changes in DNA methylation, histone modifications, and post-transcriptional regulation of mRNAs by noncoding RNAs [4,5,6,7,8,9,10,11,12,13]. The relevance of epigenetic mechanisms in the pathogenesis of AML is so well established that they have become targets for therapy [14,15]. Epigenetic alterations may be the consequence of chromosomal rearrangements and mutations impacting the activity of specific epigenetic writers/readers/erasers. For instance, the fusion products PML-RARα, MLL-r, AML1-ETO, and MOZ-CBP induce epigenetic modifications that have a profound effect on chromatin architecture and the expression of targeted genes through the recruitment of histone deacetylase complexes, DNA methyltransferases, histone methyltransferases, and Polycomb repressor complexes [16,17,18,19,20,21,22]. Similarly, mutations of epigenetic writers/readers/erasers are frequent in AML. Loss of function or gain of function mutations of DNMT3A [23,24,25], EZH2 [26,27], TET2 [28,29], IDH1/2 [30], and ASXL1 [31,32], which may occur concurrently or be mutually exclusive, induce large-scale modifications of the epigenome, resulting in the deregulated expression of genes with a dominant role in normal and leukemic hematopoiesis.
In addition, epigenetic mechanisms regulate the equilibrium between self-renewal and differentiation of hematopoietic stem cells and precursors. In this context, Polycomb-group proteins (PcGs) regulate the expression of genes involved in cell-cycle regulation and differentiation, and aberrant expression and/or mutations of PcG genes have been shown to occur in hematopoietic neoplasms. PcG proteins form two complexes, named PRC1 and PRC2 [33,34]. PRC1 may be present in six different complexes, which are defined as canonical complexes (PRC1.2 and PRC1.4) depending on constitutive Polycomb ring finger proteins (PCGF1-6), and as noncanonical (PRC1.1, PRC1.3, PRC1.5, and PRC1.6) [33], whereas PRC2 has two main conformations, PRC2.1 and PRC2.2 [34]. PRC1 and PRC2 activity causes silencing of the targeted genes through their ability to catalyze posttranslational modifications of histone tails, histone H2A monoubiquitylation for PRC1, and histone H3 lysine 27 methylation for PRC2 [35,36,37,38]. The activity of the PcG complexes is counteracted by the trithorax (Trx) complexes, which, in contrast, deposit activating histone marks (H3K4 methylation) enabling gene transcription.
PcG and Trx proteins have been linked to several different hematological diseases and represent an interesting target for AML therapy [39]. BMI-1 is a main component of the PRC1 and shows oncogenic or tumor suppressor behavior in AML [40,41,42,43,44] and lymphoma [45]. CBX7 (PRC1) has a role in promoting T cell lymphomas and, in cooperation with MYC, in accelerating aggressive B cell lymphomagenesis through the regulation of the Ink4a/Arf locus (similarly to BMI-1) [46,47]. BCOR and BCORL1 products, components of the noncanonical PRC1 complex cooperating in recruiting it to CpG islands, are found frequently mutated in de novo and secondary AML, and often are downregulated in cytogenetically normal AML [48,49,50,51]. The heterozygous translocations of the mixed-lineage leukemia gene product (MLL-AF4; -AF9, -ENL, -AF10, and -ELL), a Trx complex component showing H3K4 histone methyltransferase activity, are found in a very high percentage of pediatric AML leukemias or acute lymphoblastic leukemias and determine the aberrant expression of the HOXA9 and MEIS1 genes, two master regulators of myeloid lineage [52,53,54]. EZH2, a core component of PRC2, is overexpressed in several distinct hematological disorders as well as in solid tumors. In addition, Stasik et al. showed that EZH2 gain- or loss-of-function mutations are quite frequent in de novo AML and seem to have a stage-specific role in AML [55]. SUZ12, EED, and JARID2 are other PRC2 components found to be mutated in myeloid diseases [56,57,58,59].
All these data underline the relevance and complexity of the roles of PcG and Trx complexes in the onset of the AML differentiation block. Thus, components of PcG and Trx complexes may undergo loss and gain of function mutations and chromosomal translocations capable of perturbing the sequential and coordinated expression of genes that control the hierarchical phenomenon of hematopoiesis. However, the mechanism of their recruitment to targeted genes has been a longstanding topic of study because mammalian PcG and Trx proteins lack recognition and binding sequences on DNA. In Drosophila melanogaster, Pleiohomeotic (Pho) protein, a zinc finger DNA binding protein, is responsible for recruiting PcG proteins to the PREs of target genes [60,61]. The mammalian homolog of Pho is Yin Yang 1 (YY1) protein [59], a Polycomb-group protein with sequence-specific DNA binding [62], which is considered a candidate targeting factor [63] able to recruit PcG complexes to targeted genes [64,65,66,67]. YY1 interacts with the PcG proteins EED and BMI1 in separate complexes and colocalizes in the trunks of E12.5 mouse embryos upstream of the repressed HOXA5 and HOXC8 genes [68]. Moreover, YY1 directly interacts with RYBP and YAF2, which are components of noncanonical PRC1 complexes, suggesting that they may link YY1 with the PcG system. YY1 protein may act as an activator or repressor of transcription, depending on posttranslational modifications, binding partners, and cellular context [69,70,71].
YY1 mutations or altered expression frequently occurs in disease. YY1 haploinsufficiency has been reported in a case of Gabriele–de Vries syndrome [72] and in neurodevelopmental disorders [73] in addition to neurodegenerative diseases, such as Alzheimer’s and Parkinson’s [74,75]. The role of YY1 in cancer is highly dependent on the expression level, and it may act as tumor repressor or oncogene [76]. YY1 promotes tumor growth in melanoma as a conditional ablation of one YY1 allele; in a melanoma mouse model, it prevents tumorigenesis [77]. YY1, through several distinct mechanisms, promotes the proliferation of glioma tumor cells [78,79]. YY1 overexpression stimulates cell proliferation and migration in laryngeal cancer cells by directly inhibiting MYCT1 [80]. Kaufhold et al. identified YY1 as a regulatory factor involved in cancer stem cell (CSC) maintenance across 17 different cancer types [81]. YY1 interferes with control of the cell cycle and apoptosis. YY1 overexpression induces cell progression into the S phase, overcoming Rb-induced cell cycle arrest at the G1/S checkpoint [82]. YY1 negatively regulates p53-dependent apoptosis, p16-dependent senescence [83,84], and activates the c-Myc promoter [85].
Regarding the role of YY1 in hematopoiesis, Pan et al. [86] showed that transplantation of bone marrow progenitors ectopically expressing the YY1 gene increased LSK (Lin(-)Sca-1(+)c-Kit(+)) and the LT-HSC (long-term hematopoietic stem cell) populations in mice, highlighting a role for YY1 in enhancing the self-renewal potential of these cells. Moreover, the levels of short-term (ST)-HSCs, multipotent progenitors, myeloid progenitors, monocytes, and neutrophils were also increased, suggesting that YY1 mediates the multipotency and differentiation potential of HSCs [87]. On the other hand, the analyses of the expression levels of PcG genes, including YY1, in bone marrow samples from 126 AML patients vs. 20 healthy donors showed consistent YY1 overexpression [88]. Erkeland et al. [89] showed that YY1 protein levels were high in 32D parental cells maintained in interleukin-3-containing medium, but they dropped when the cells were induced to differentiate with granulocyte-colony-stimulating factor (G-CSF). Furthermore, G-CSF-induced neutrophilic differentiation was reduced in 32D cell transfectants ectopically expressing YY1. In primary bone marrow cells, YY1 overexpression blocked the growth of CFU-GM colonies. In addition, YY1 is associated with the antitumor therapy resistance of leukemia cells [90]. Collectively, these data suggest a possible role for perturbed expression of YY1 in the development of AML through interference with the myeloid differentiation program.
Here, we investigate the overexpression of YY1 in primary AML samples and use knockdown strategies to elucidate the role of YY1 in myeloid differentiation and the development of AML. The results indicate that targeting YY1 relieves the differentiation block in AML and renders cells more sensitive to conventional treatment with the differentiating agent all-trans retinoic acid (ATRA).

2. Materials and Methods

2.1. Reagents

All-trans retinoic acid (ATRA) was purchased from Sigma-Aldrich (CAS N: 302-79-4; Milan, Italy) and used at a concentration of 1 µM for up to 96 h. Bortezomib was purchased from Selleckchem (PS-341; Houston, TX, USA) and used at a concentration of 2.5 nm for up to 96 h.

2.2. Ethics Statement

The study was approved by the ethical committee of the University of Rome Tor Vergata (Study Protocol 171/19).

2.3. Human Samples and AML Cell Lines

Immature CD34+ and mononuclear CD34− cell fractions were purified from the cord blood of four healthy donors with immunomagnetic column separation (Miltenyi Biotec Inc.; Auburn, CA, USA; and STEMCELL Technologies; Cambridge, MA, USA). Cord blood was provided by the UOS Regional Bank of Cord Blood. Cells were labeled with human anti-CD34-APC (Miltenyi Biotech Inc., Gaithersburg, Maryland, MD, USA) and sorted on the FACS Aria III (Becton Dickinson, BD Biosciences; Franklin Lakes, NJ, USA).
Acute myeloid leukemia (AML) samples (n = 24) were obtained from the peripheral blood or bone marrow of newly diagnosed leukemia patients showing more than 60% leukemic infiltration (see Supplementary Table S1 for sample features).
The HL-60 cell line was cultured in RPMI 1640 (Euroclone; Pero, MI, Italy) supplemented with 10% fetal bovine serum (FBS) (Gibco; Thermo Fisher Scientific; Waltham, MA, USA) and 100 U/mL penicillin and 100 µg/mL streptomycin (Euroclone; Pero, MI, Italy). The OCI-AML3 cell line, an AML-M4-derived cell line carrying an NPM1 gene mutation (type A) and the DNMT3A R882C mutation, were kindly provided by Emanuela Colombo, the European Institute of Oncology, Milan, Italy. The OCI-AML3 cells were cultured in RPMI 1640, 10% FBS, 100 U/mL penicillin, and 100 µg/mL streptomycin. ML-2 and ME-1 cell lines were cultured in RPMI 1640 supplemented with 20% FBS and 1% penicillin–streptomycin. The AML-193 cell line was cultured in Iscove’s MDM (Biowest, Nuaillé, Francia) supplemented with 10% FBS, 1% penicillin–streptomycin, and 20% conditioned medium from the cell line 5637 (DSMZ ACC 35)(Braunschweig, Germany). Cultures were maintained at 37°C in a 5% CO2 humidified incubator.

2.4. Plasmid Constructs, Lentiviral Infection, and Cell Transfection

Knockdown of YY1 in the HL-60 cell line was performed by cloning a short hairpin RNA targeting YY1 (AgeI-EcoRI) into the Tet-pLKO.1 puro vector of the tetracycline inducible system. The following shRNA sequences were used:
sh-YY1:
5′-CCGGATGACAGGAAAGAAACTTCCTCTCGAGAGGAAGTTTCTTTCCTGTCATTTTTT-3′;
and sh-scrambled control sequence:
5′-CCGGGCAACAAGATGAAGAGCACCAACTCGAGTTGGTGCTCTTCATCTTGTTGCTTTTT-3′.
Plasmids were verified by sequencing. Lentivirus was produced in HEK293T cells transfected with Tet-pLKO.1 puro-sh-YY1 and Tet-pLKO.1 puro-sh-control constructs (Addagene, Watertown, MA, USA) with a third-generation lentiviral system. The supernatant containing lentivirus particles was collected at 48 and 72 h post-transfection, concentrated by ultracentrifugation, and resuspended in PBS-1% BSA. HL-60 cells were infected twice with concentrated lentiviral particles in medium supplemented with polybrene (8 µg/mL) (Sigma Aldrich, St Luis, MO, USA) and then selected in puromycin (0.25 µg/mL) (Sigma Aldrich, St Luis, MO, USA). After selection, infected HL-60 cells were maintained in culture with a low puromycin concentration of 0.125 µg/mL and treated with doxycycline (300 ng/mL) (Sigma Aldrich, St Luis, MO, USA) to induce shRNA expression.
For siRNA-mediated gene knockdown in OCI-AML3, OCI-AML3 cells (1 × 10⁶ cells/well) were seeded into 12-well plates and transfected with 100 nM of siRNA targeting YY1 (cod. 0007774146 siRNA ID s14960 and s14958, Ambion, Life Technologies, Thermo Fisher Scientific, Waltham, MA, USA) or control siRNA (D-001810-01-05) with Lipofectamine RNAiMAX (4 µL/well; Thermo Fisher Scientific, Waltham, MA, USA). Silencing was performed at 0 and 24 h, and the cells were treated with ATRA (1 µM) at 48 h. Cells were collected at 48 h and 96 h, according to the manufacturer’s protocol.

2.5. Protein Extraction and Western Blot Analysis

Cells were lysed with RIPA lysis buffer containing 1× proteinase inhibitors, and proteins were quantified with the Bradford assay. Equal amounts of protein (20–50 µg) were denatured, separated on SDS polyacrylamide gels, and blotted onto Bio-Rad Immun-Blot PVDF membranes. The following primary antibodies and dilutions were used for immunoblotting detection: rabbit anti-human YY1 (1:600, sc-1703, Santa-Cruz Biotechnology; Dallas, TX, USA); rabbit anti-human PARP1 (1:4000, ALX-210-302-R100, Life Sciences); rabbit anti-human BAX (1:200, #2772, Cell Signaling Technology; Danvers, MA, USA); rabbit anti-human caspase-3 (1:800, #9662, Cell Signaling Technology); rabbit anti-human C/EBPα (1:800, EP709Y-ab40764, Abcam; Cambridge, MA, USA); rabbit anti-human C/EBPδ (1:500, EPR23518-259-ab245214, Abcam); and rabbit anti-human C/EBPε (0.6 μg/mL, ab246861, Abcam). Mouse anti-human α-tubulin (1:5000, #3873, Cell Signaling Technology) and mouse anti-human β-actin (1:10,000, #3700, Cell Signaling Technology) were used for normalization of the samples analyzed. The following horseradish peroxidase-conjugated secondary antibodies were used: anti-mouse polyclonal IgG (Goat anti-Mouse IgG #31430, Invitrogen; Thermo Fisher Scientific) and anti-rabbit polyclonal IgG (Goat anti-Rabbit IgG #31460, Invitrogen; Thermo Fisher Scientific). Chemiluminescence detection was performed with ECL (Amersham Biosciences; Thermo Fisher Scientific, Waltham, MA, USA), and images were captured with the Bio-Rad ChemiDoc XRS+ imaging system. Protein signal intensities were analyzed by densitometric scanning with Quantity One software (Bio-Rad Laboratories, Hercules, CA, USA), and normalized with the loading control β-actin or tubulin. The original western blot figures could be found in File S1.

2.6. RNA Isolated and Analysis

Total RNA was isolated from cells with TRIzol (Invitrogen; Thermo Fisher Scientific; Waltham, MA, USA). cDNA was synthesized from total RNA (1 µg) with the High-Capacity RNA-to-cDNA Kit (Applied Biosystems; Thermo Fisher Scientific), and real-time quantitative RT-PCR was performed to determine expression levels for YY1, HOXA2, HOXD13, C/EBPα, C/EBPδ, C/EBPε, CD11b, CD14, GM-CSFr, CSF1, G-CSFr, CSF2, M-CSFr, CSF3, RARα, and GAPDH. The sequences of the primer pairs used are listed in supplementary methods. All reactions were performed in triplicate on total RNA isolated from three independent cell cultures. Real-time PCR was performed with the SYBR Green dye detection method. Ct values obtained for genes in the samples were normalized with Ct values from GAPDH and calculated following the 2−ΔΔCT or 2−ΔCT method, alternatively.

2.7. Chromatin Immunoprecipitation (ChIp)

Chromatin immunoprecipitations were performed on lysates prepared from HL-60 cells and using rabbit anti-human YY1 (sc-1703, Santa-Cruz Biotechnology) following a standard protocol. Rabbit anti-human IgG antibodies (Merck Millipore; Burlington, MA, USA) were used as immunoprecipitation controls. Genomic regions in 5′ promoter sites, within 1 kb of the putative TSS, of RARα, C/EBPα, C/EBPδ, C/EBPε, and GAPDH genes were amplified from immunoprecipitated DNAs. The sequences of the primer pairs used are listed in supplementary methods. All primer pairs were designed with Primer Express Version 3.0 software (Applied Biosystems; Foster City, CA, USA). qRT-PCR was performed in triplicate with SYBR Green. Values obtained for the DNA in each immunoprecipitated sample were quantified relative to the respective input and calculated following the 2−ΔCT method.

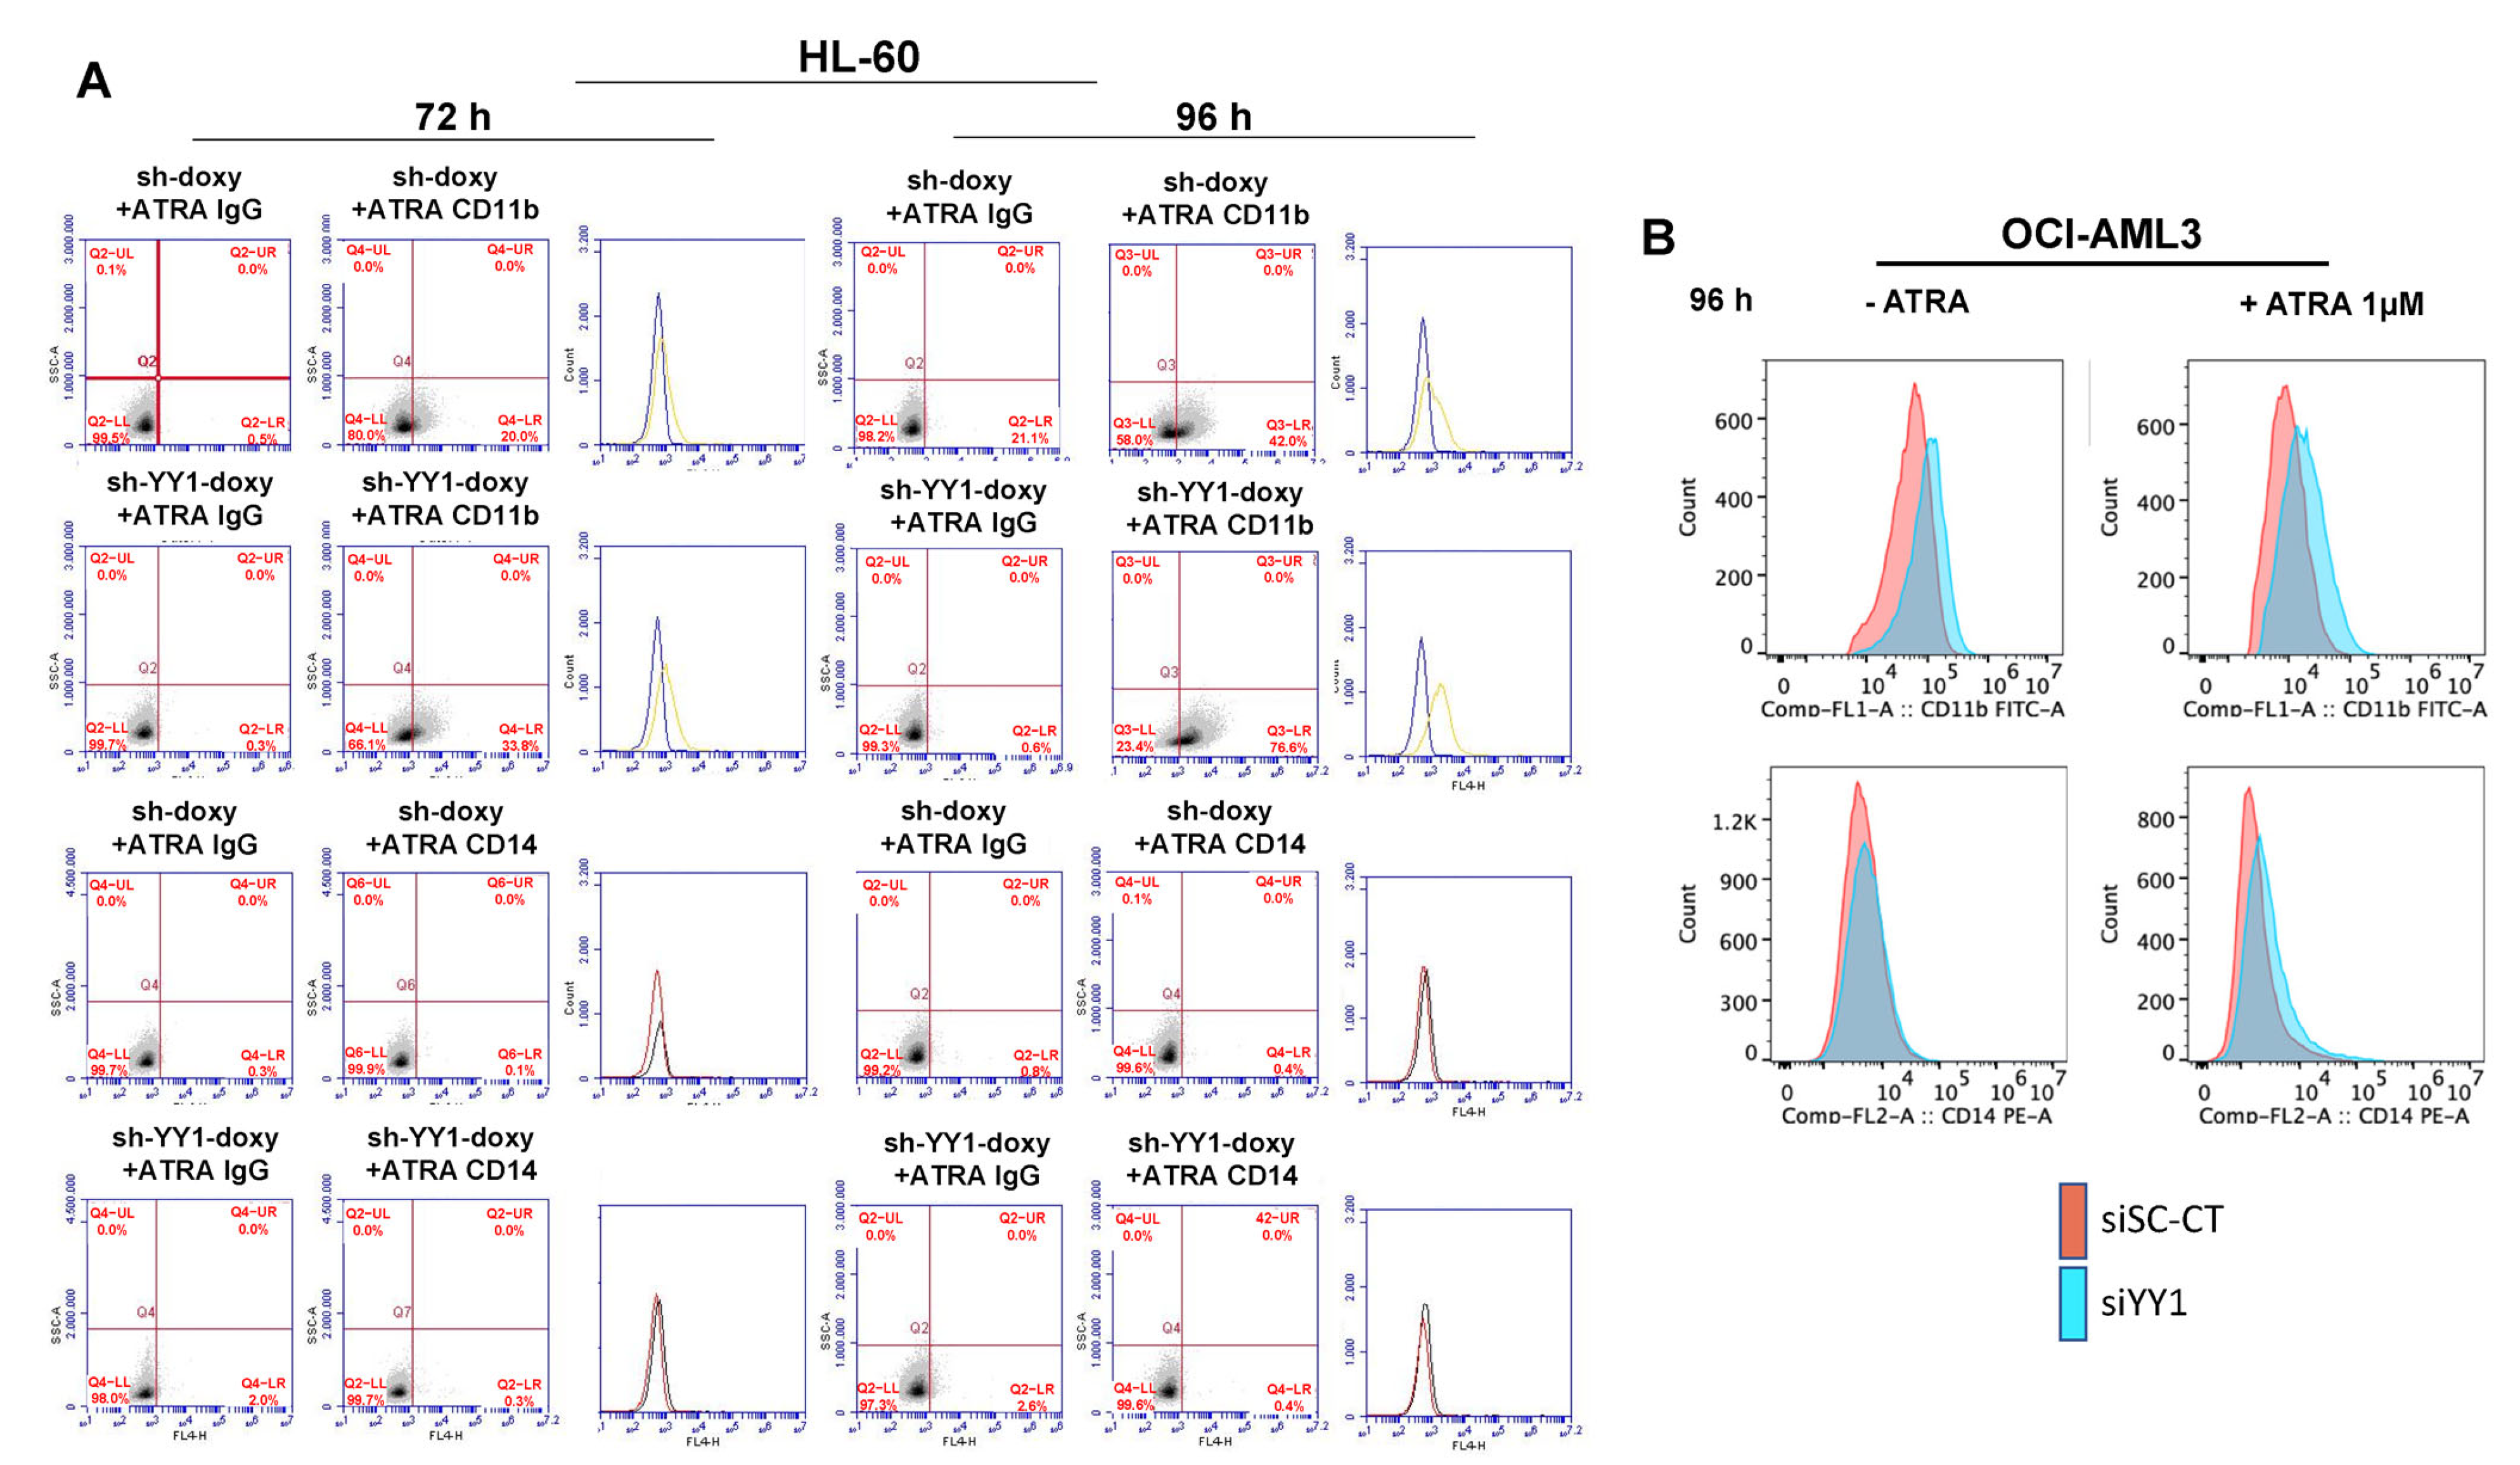
2.8. Immunophenotypic Analysis

Immunophenotyping was performed with direct immunofluorescence staining of cells: for the HL-60 cell line, APC-conjugated mouse anti-human CD11b (clone ICRF44) and CD14 (clone M5E2; Becton Dickinson Pharmingen); and for the OCI-AML3 cell line, APC-conjugated mouse anti-human CD11b (clone ICRF44, Beckton Dickinson Pharmingen) and CD14 (clone M5E2, Beckton Dickinson Pharmingen). A minimum of 50,000 events was recorded for each sample on a FACSCantoII flow cytometer (BD Biosciences) for HL-60 and on a CytoFLEX flow cytometer (Beckman Coulter, Brea, CA, USA) for OCI-AML3. Apoptotic cell death in HL60 cells was evaluated with the APC Annexin-V Apoptosis Detection Kit with PI (BioLegend, San Diego, CA, USA) according to the manufacturer’s instructions on a FACSCantoII flow cytometer (BD Biosciences, Franklin Lakes, NJ, USA), and in OCI-AML3 cells, with Annexin V staining and the ‘Live/Dead’ assay on a CytoFLEX flow cytometer (Beckman Coulter; Brea, CA, USA). Flow cytometric analysis was performed with FlowJo Flow Cytometric Analysis software (TreeStar; Ashland, OR, USA). Cells labeled with a single fluorochrome were used as controls to adjust the compensation.

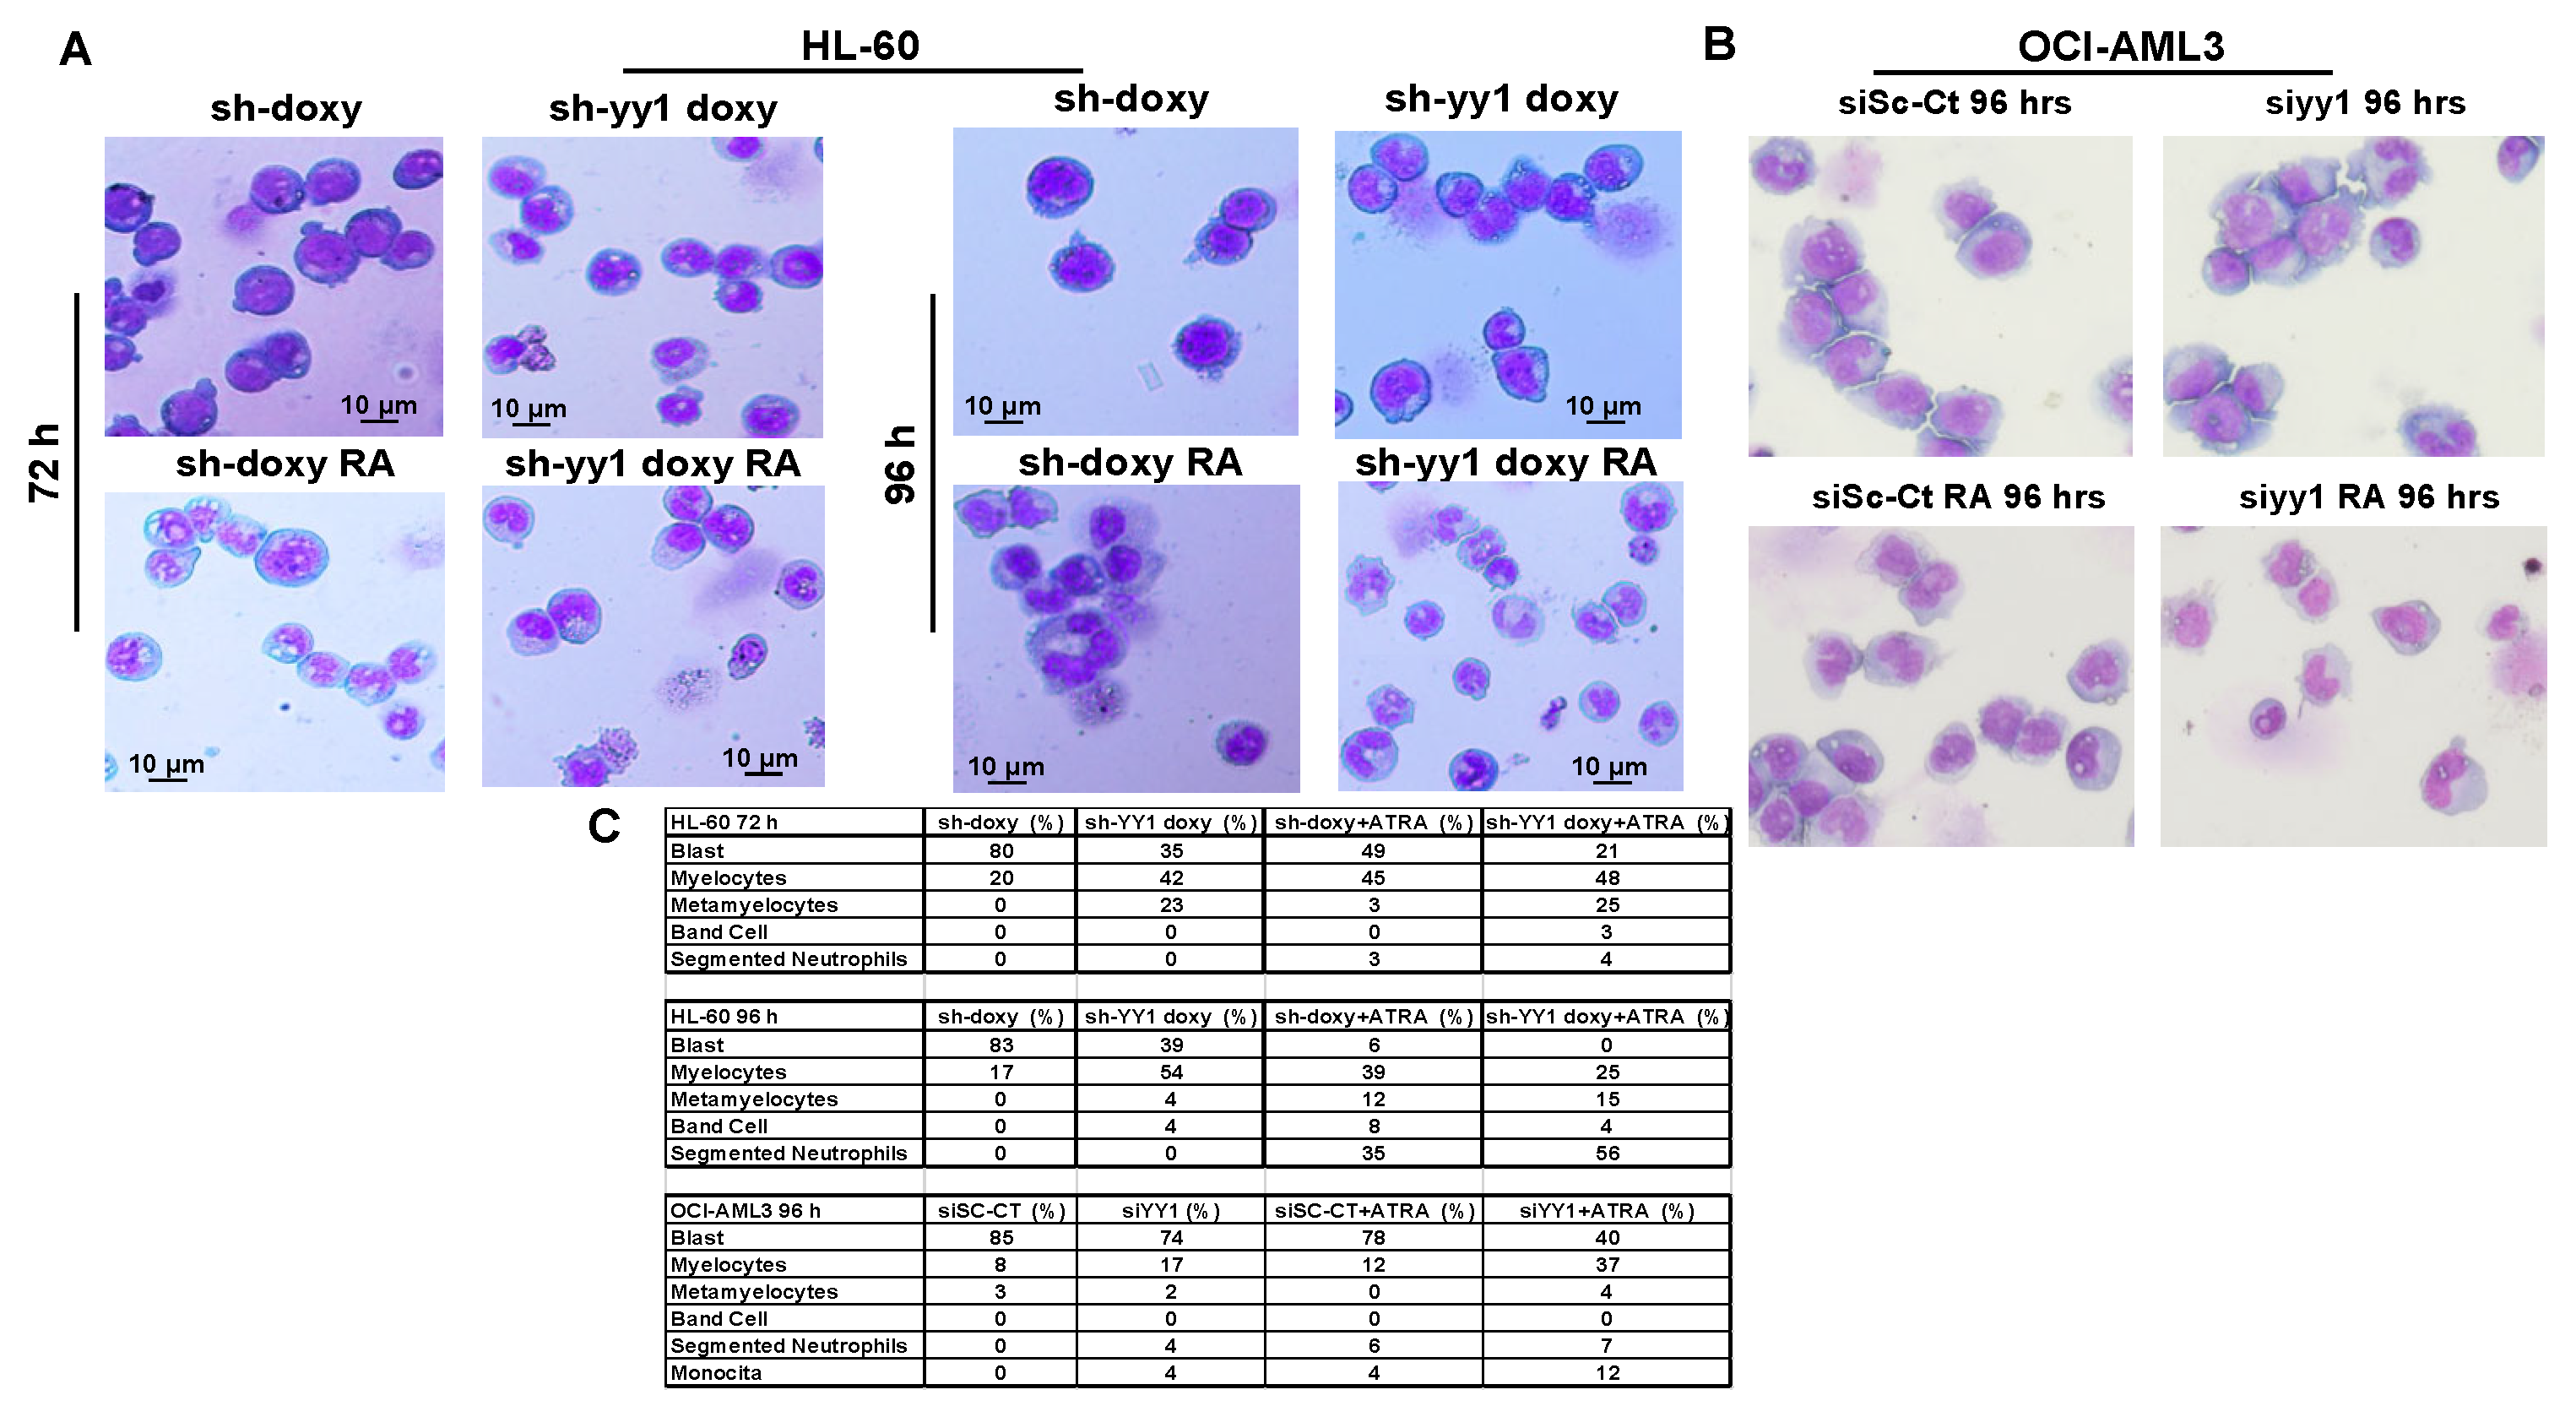
2.9. Morphological Analysis

HL-60 and OCI-AML3 cell morphology was evaluated using staining cytospin (8 min at 900 rpm) with Wright-Giemsa stains, according to the manufacturer’s instructions. Images were captured with a Nikon Eclipse 80i upright microscope.

2.10. Statistical Analysis

All data are expressed as mean ± DS, and the ± DS are represented by error bars. The statistical significance was calculated with a one-tailed Mann–Whitney non-parametric test with GraphPad Prism 5, and a p-value ≤ 0.05 was considered as significant. The experiments were performed at least three times in duplicate unless otherwise stated.

3. Results

3.1. An Inhibitor of NF-kB Activation, Bortezomib, Downregulates YY1 in AML Cells

The proteasome inhibitor Bortezomib, approved by the FDA for clinical use in multiple myeloma and in AML clinical trials [91,92], has been shown to inhibit NF-kB activation [93]. About 40% of AML patients exhibit increased activity of the NF-kB signaling pathway, and it is constitutively active in CD34+/CD38- blasts from M1, M2, M4, and M5 AML patients [94,95]. YY1 is a target of NF-kB activation [96,97]. Therefore, to further elucidate the role of YY1 in hematopoietic differentiation and the development of AML, we investigated whether Bortezomib decreased the expression of YY1 in AML cells. We first analyzed YY1 expression in 24 AML samples (Supplementary Table S1) and 5 AML cell lines (HL-60, AML-193, ML-2, ME-1, and OCI-AML3) [88,89]. qRT-PCR analysis revealed a statistically significant increase in YY1 mRNA levels in the AML patient samples and AML cell lines compared with four immature CD34+ cells and four CD34- mononuclear mature cell samples purified from umbilical cord blood of four healthy donors (Figure 1A). Next, we treated cells from a YY1 high-expressing AML sample (Figure 1B) with 2.5 nM Bortezomib and analyzed YY1 mRNA and protein levels over 72 h at 24 h intervals (Figure 1C). Bortezomib significantly reduced YY1 expression as early as 24 h. However, co-treatment with the vitamin ATRA (1 μM) did not lead to a further decrease in YY1 in Bortezomib+ATRA-treated AML cells (Figure 1C). Indeed, Bortezomib treatment led to an increase in the mRNA and protein levels of transcription factors C/EBPε and C/EBPδ (CCAAT/enhancer binding protein ε, δ) (Figure 1D), which are directly involved in granulocytic terminal differentiation, whereas no difference in C/EBPα expression was observed.
Remarkably, Bortezomib caused an increase in the expression of the granulocytic surface antigen differentiation marker CD11b, whereas no change in expression was observed for the monocytic surface antigen CD14 (Figure 1E).

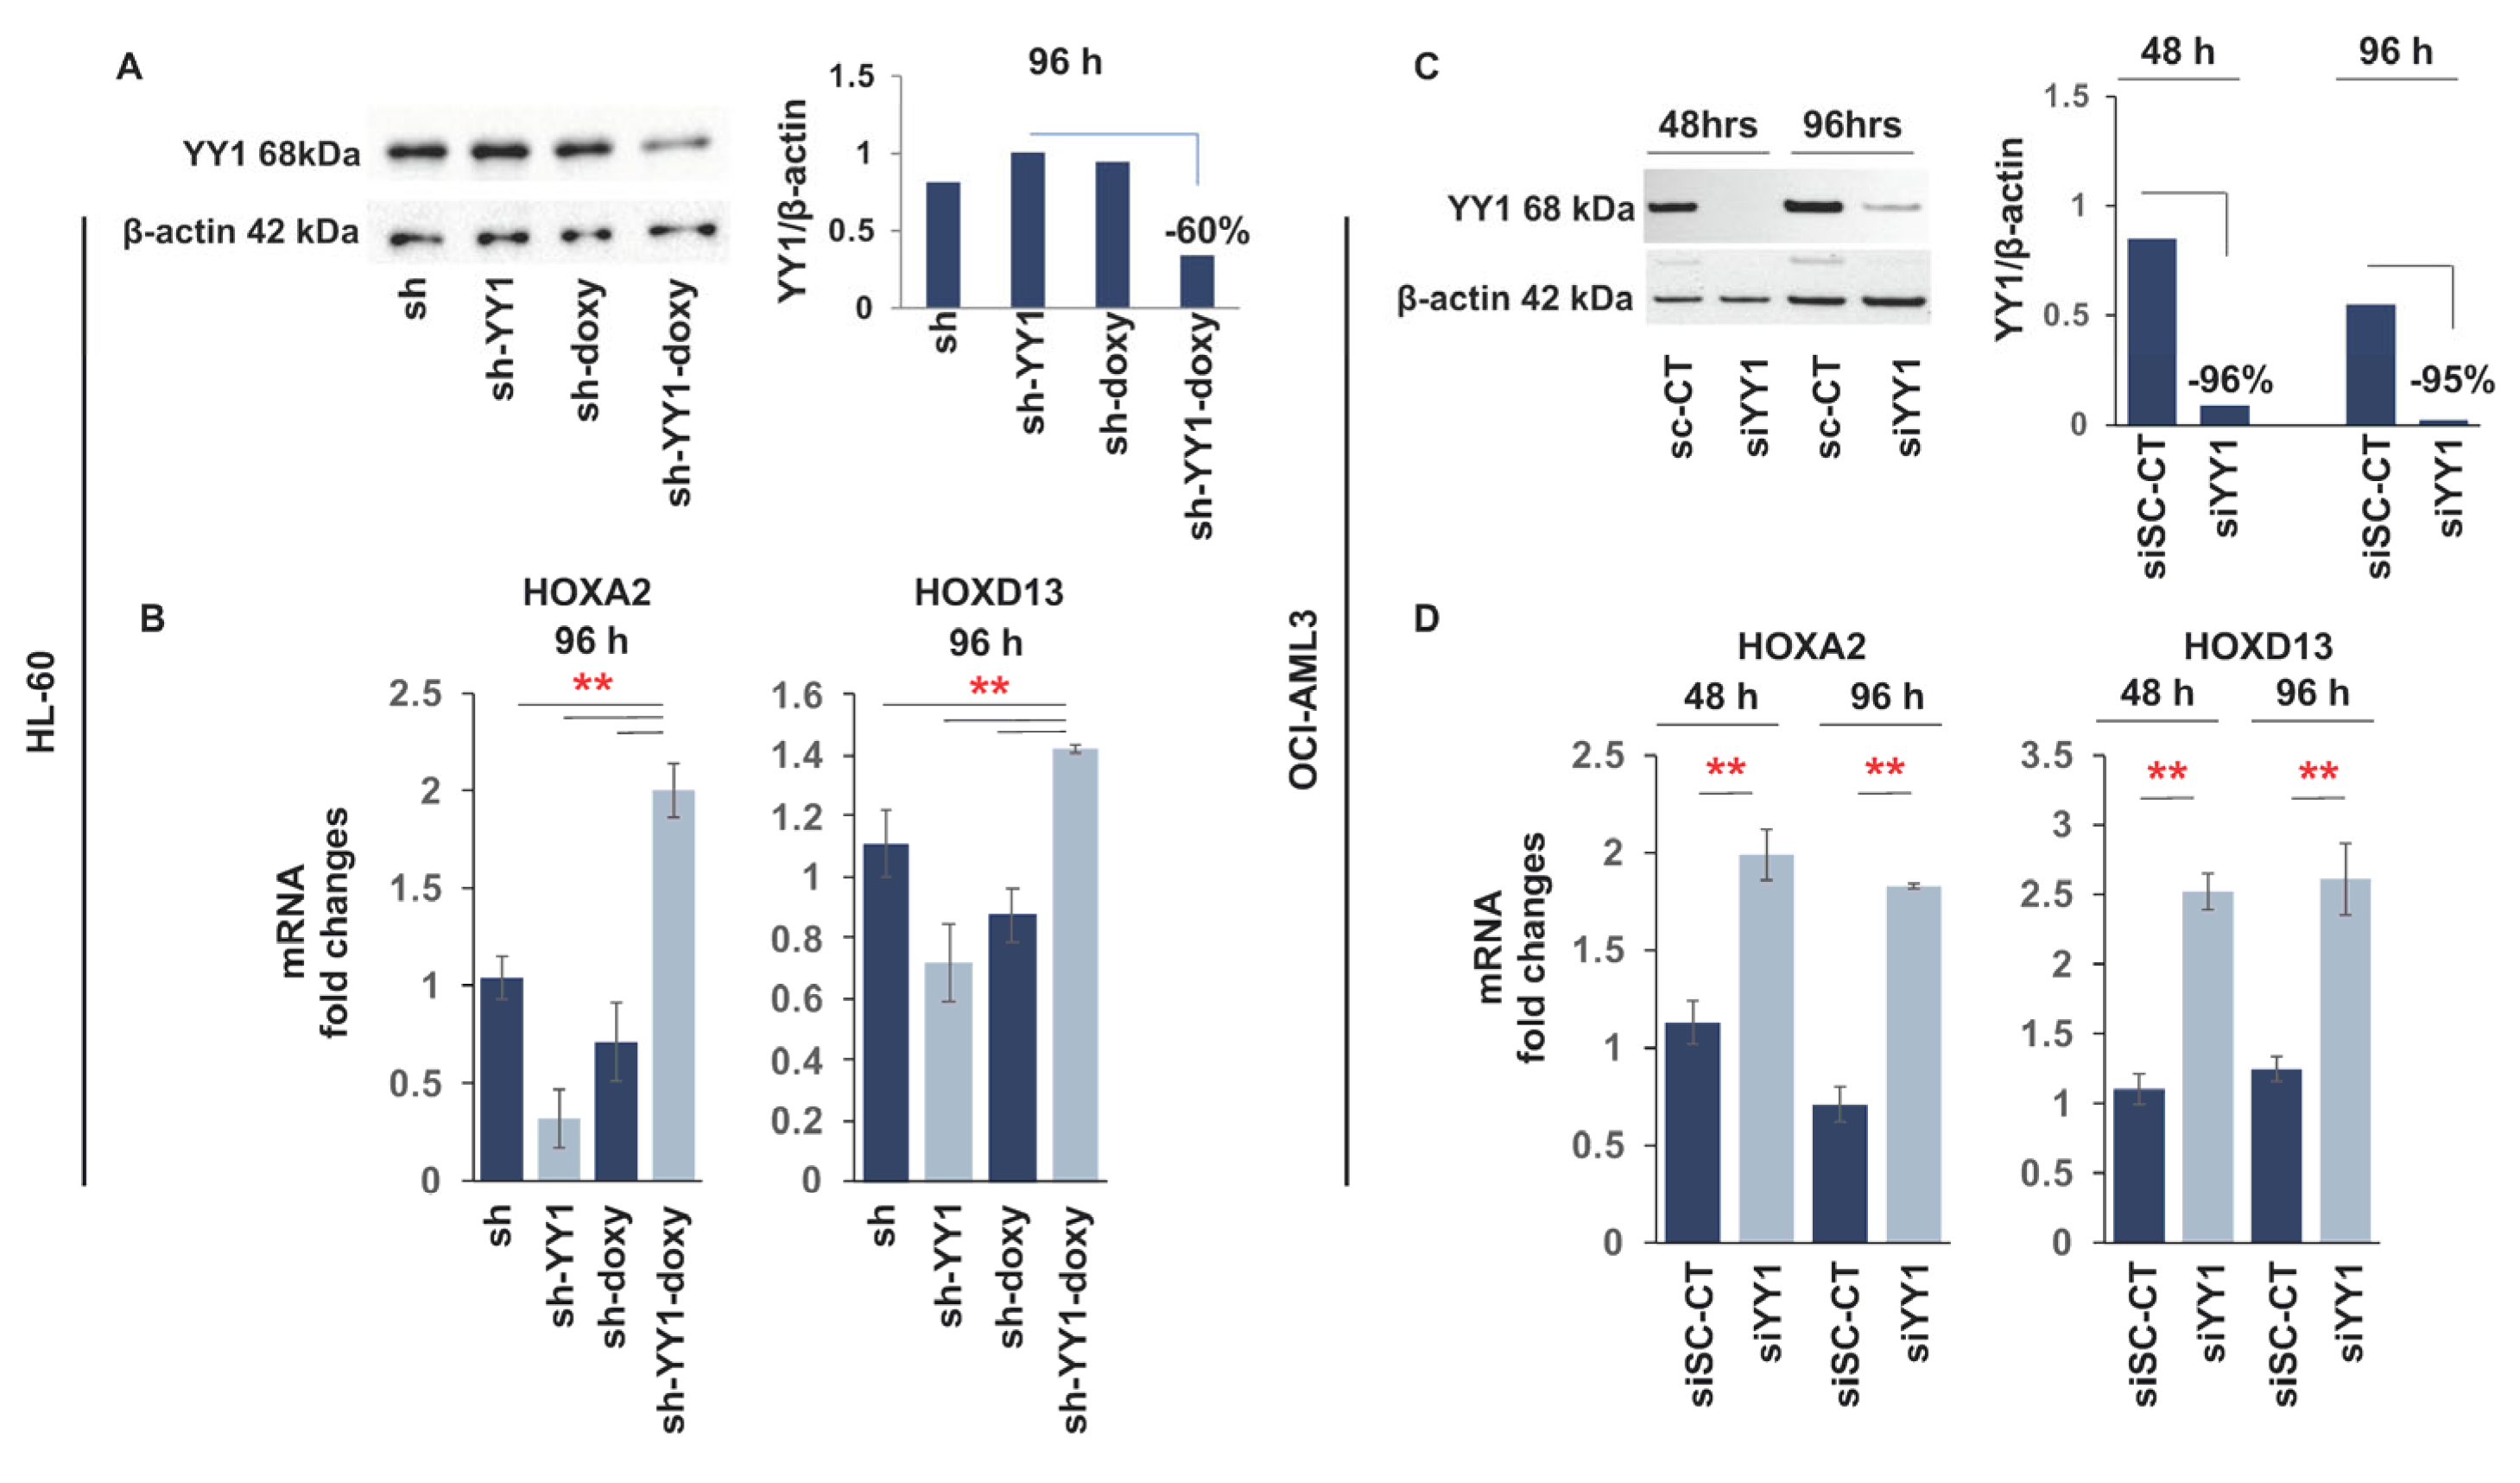
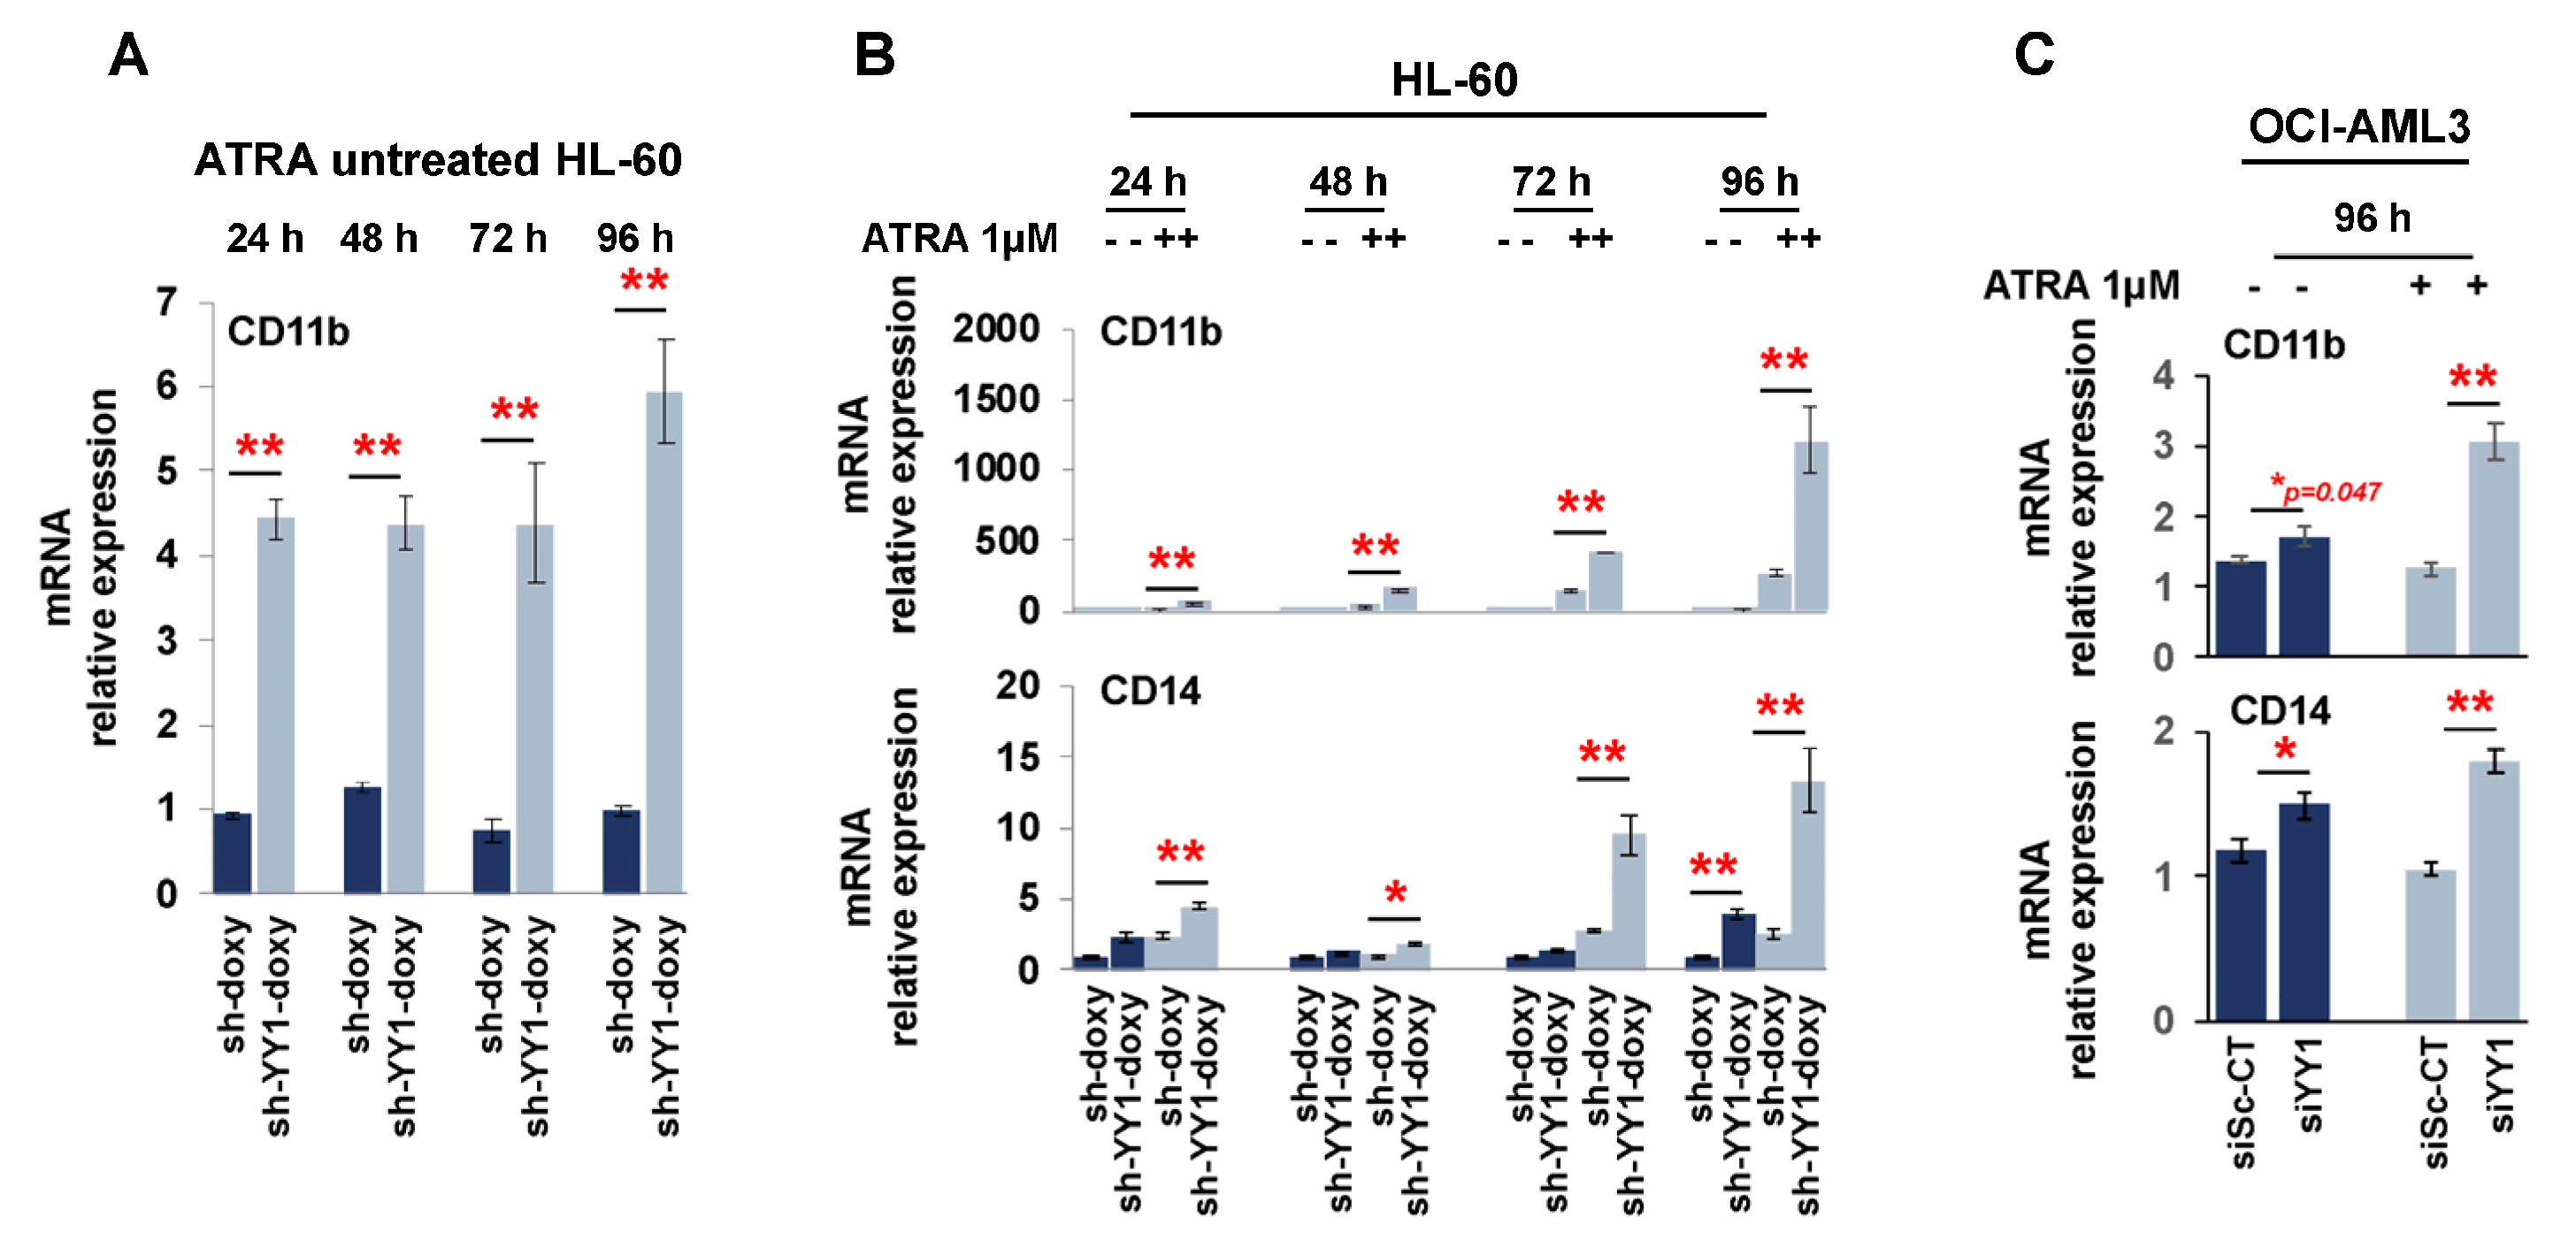
3.2. YY1 Knockdown Induces Expression of Myeloid Differentiation Markers

Based on these results and data in the literature [86,87,88,89], we investigated the possibility that YY1 overexpression could interfere with the myeloid differentiation program in AML cell lines. YY1 protein levels were downregulated in the HL-60 cell line (FAB M2) with a doxycycline inducible lentiviral vector expressing a short hairpin against YY1 mRNA, and in the OCI-AML3 (FAB M4) cell line, with the transfection of a small-interfering RNA targeting YY1. Both knockdown approaches caused a significant reduction in YY1 protein in these cell lines, at 120 h of doxycycline induction (300 ng/mL) in HL-60-sh-YY1-doxy and at 48 h and 96 h in OCI-AML3-siYY1 (Figure 2A,B). Furthermore, the mRNA expression of HOXA2 and HOXD13 genes increased in response to YY1 knockdown, demonstrating that knockdown of YY1 in these cells led to a previously characterized functional response of the downregulation of YY1 protein [96] (Figure 2C,D).
We next investigated the effect of YY1 knockdown on C/EBP family members α, ε, and δ, which have an important role in normal hematopoiesis, mainly in the promotion of myeloid differentiation, and which are decreased in expression or frequently mutated in AML [98,99,100,101]. Knockdown of YY1 in the HL-60-sh-YY1-doxy and OCI-AML3-siYY1 cell lines caused a statistically significant increase in C/EBPε and C/EBPδ expression, both at the transcriptional and protein levels compared with control cells (Figure 3A,B).
Finally, we assessed the expression levels of growth factors involved in myeloid differentiation, including colony-stimulating factor 2 (CSF2), 3 (CSF3), and 1 (CSF1), and the receptors they bind to, granulocyte-macrophage-colony-stimulating factor receptor (GM-CSFr), granulocyte-colony-stimulating factor receptor (G-CSFr), and macrophage-colony-stimulating factor receptor (M-CSFr). We found that while the levels in growth factors did not change, GM-CSFr was significantly upregulated in both HL-60-sh-YY1-doxy and OCI-AML3-siYY1, while G-CSFr was significantly upregulated only in HL-60-sh-YY1-doxy (Supplementary Figure S1).

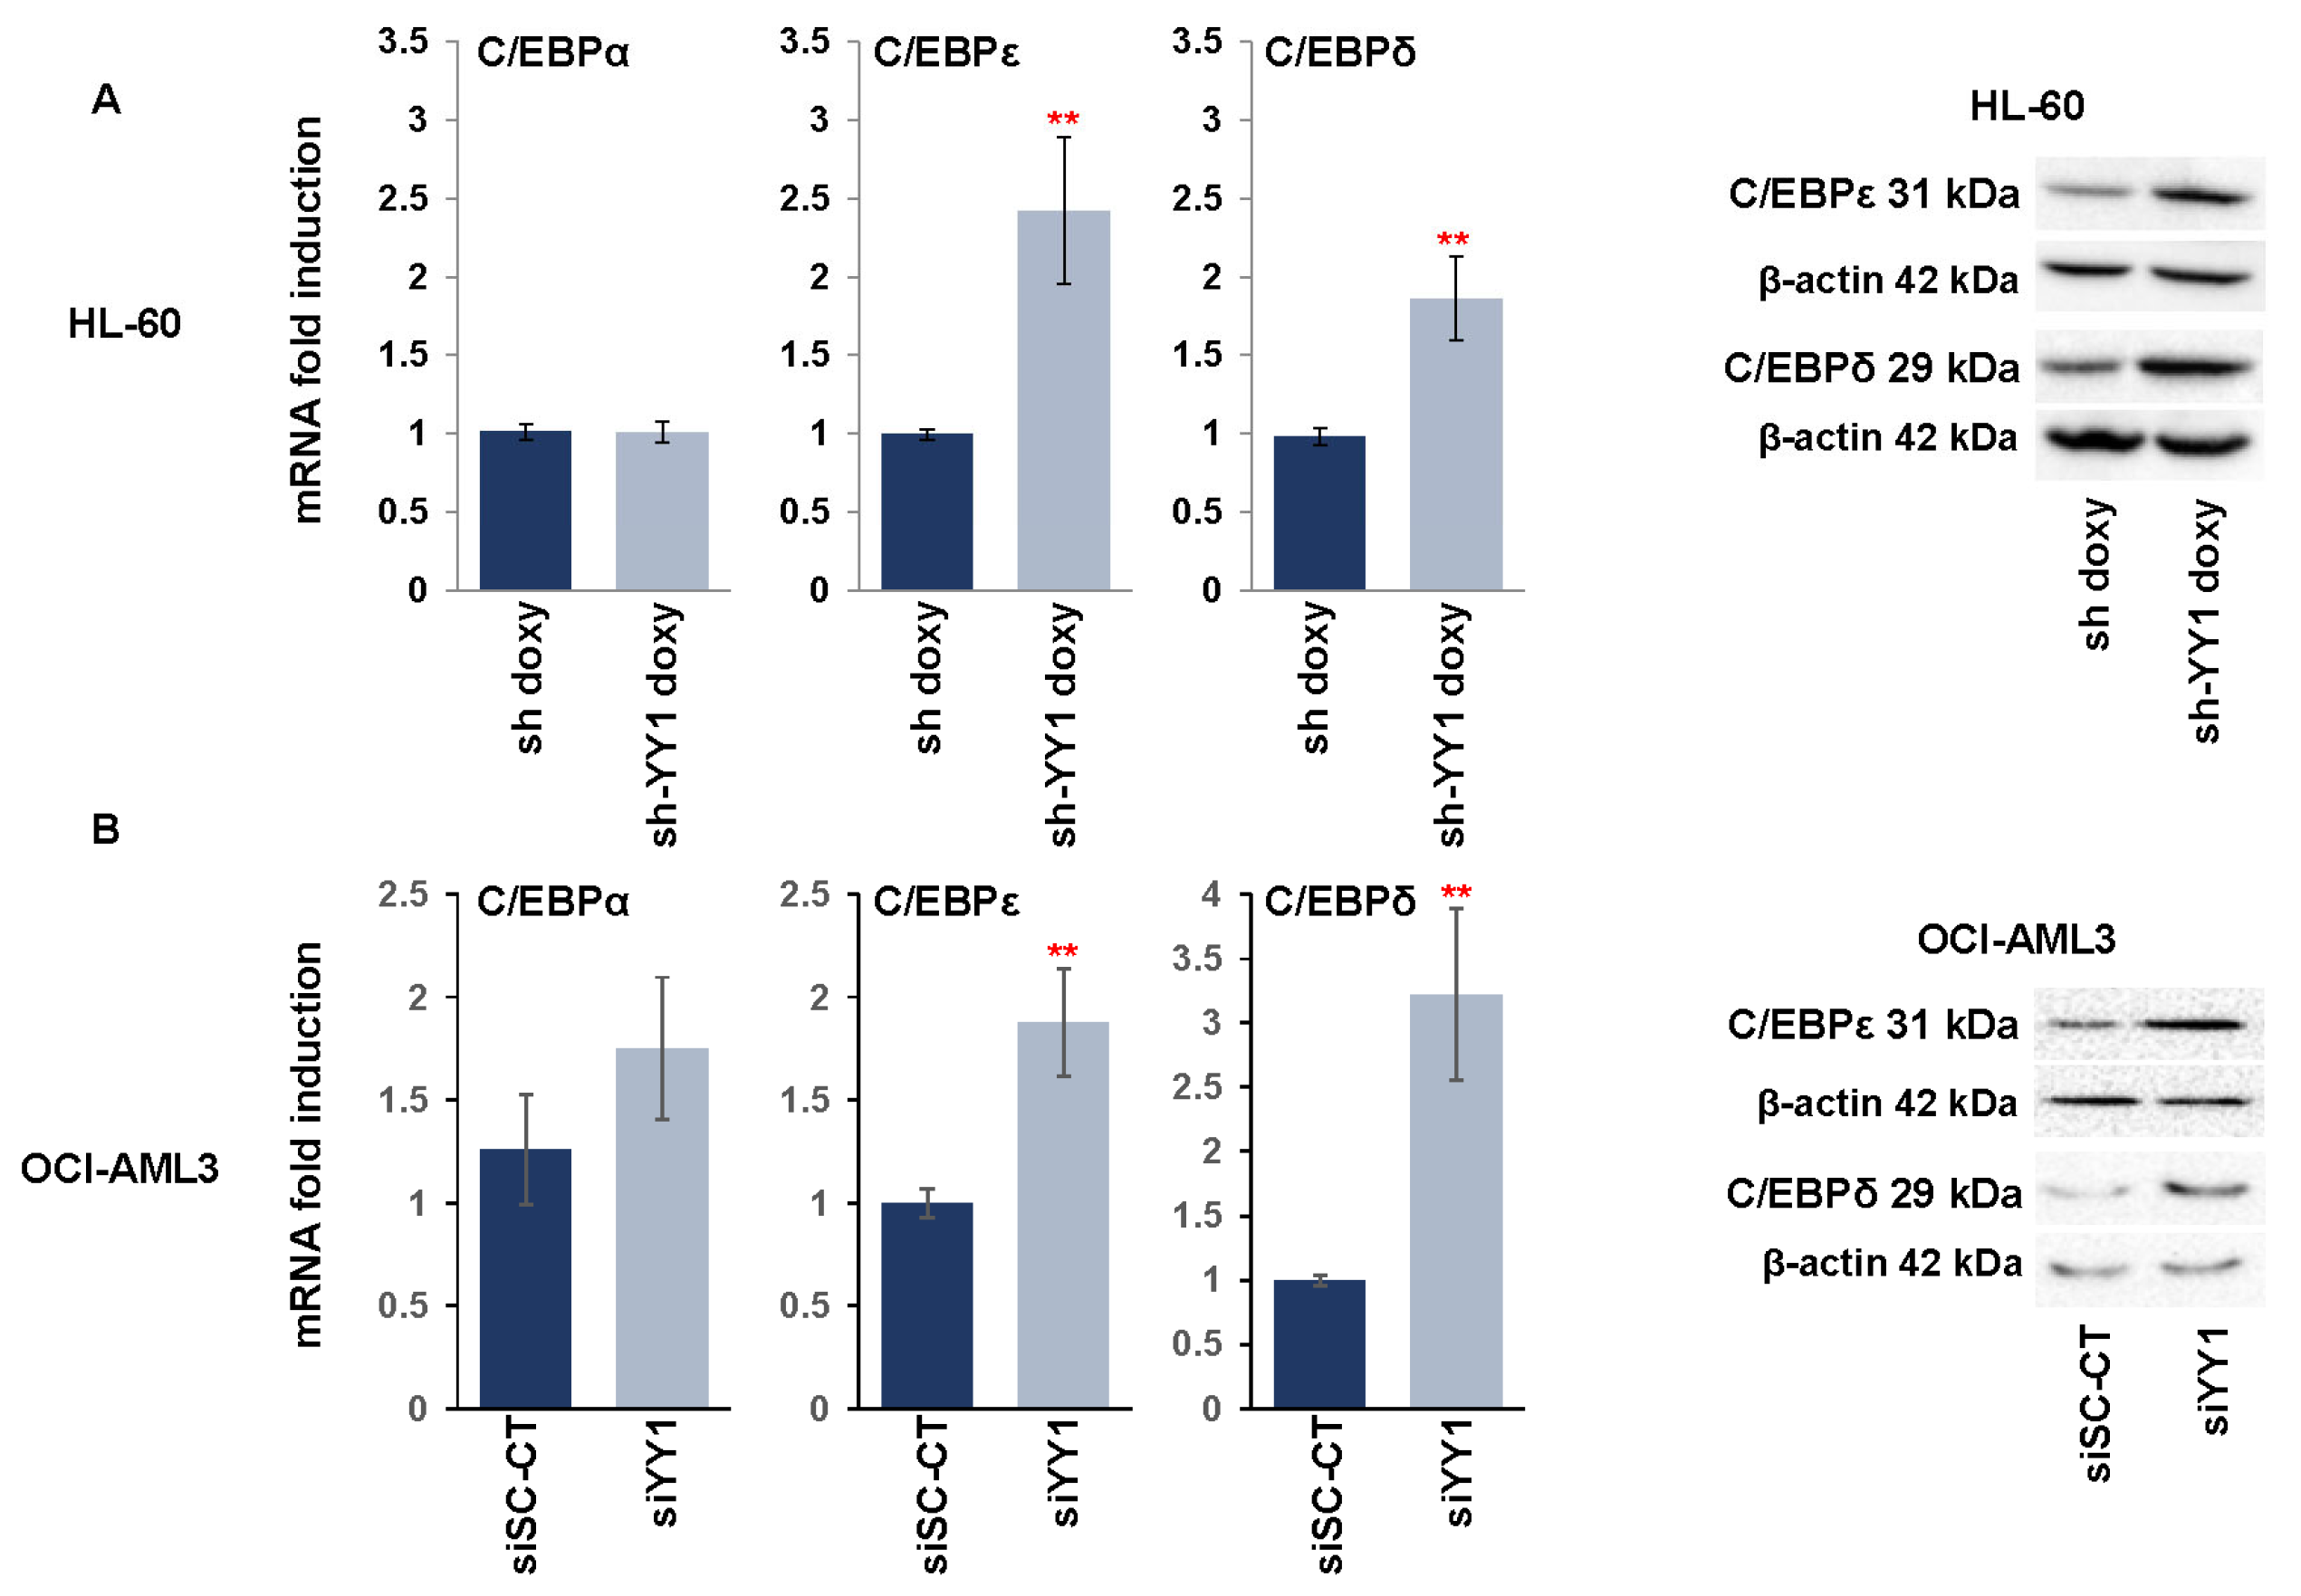
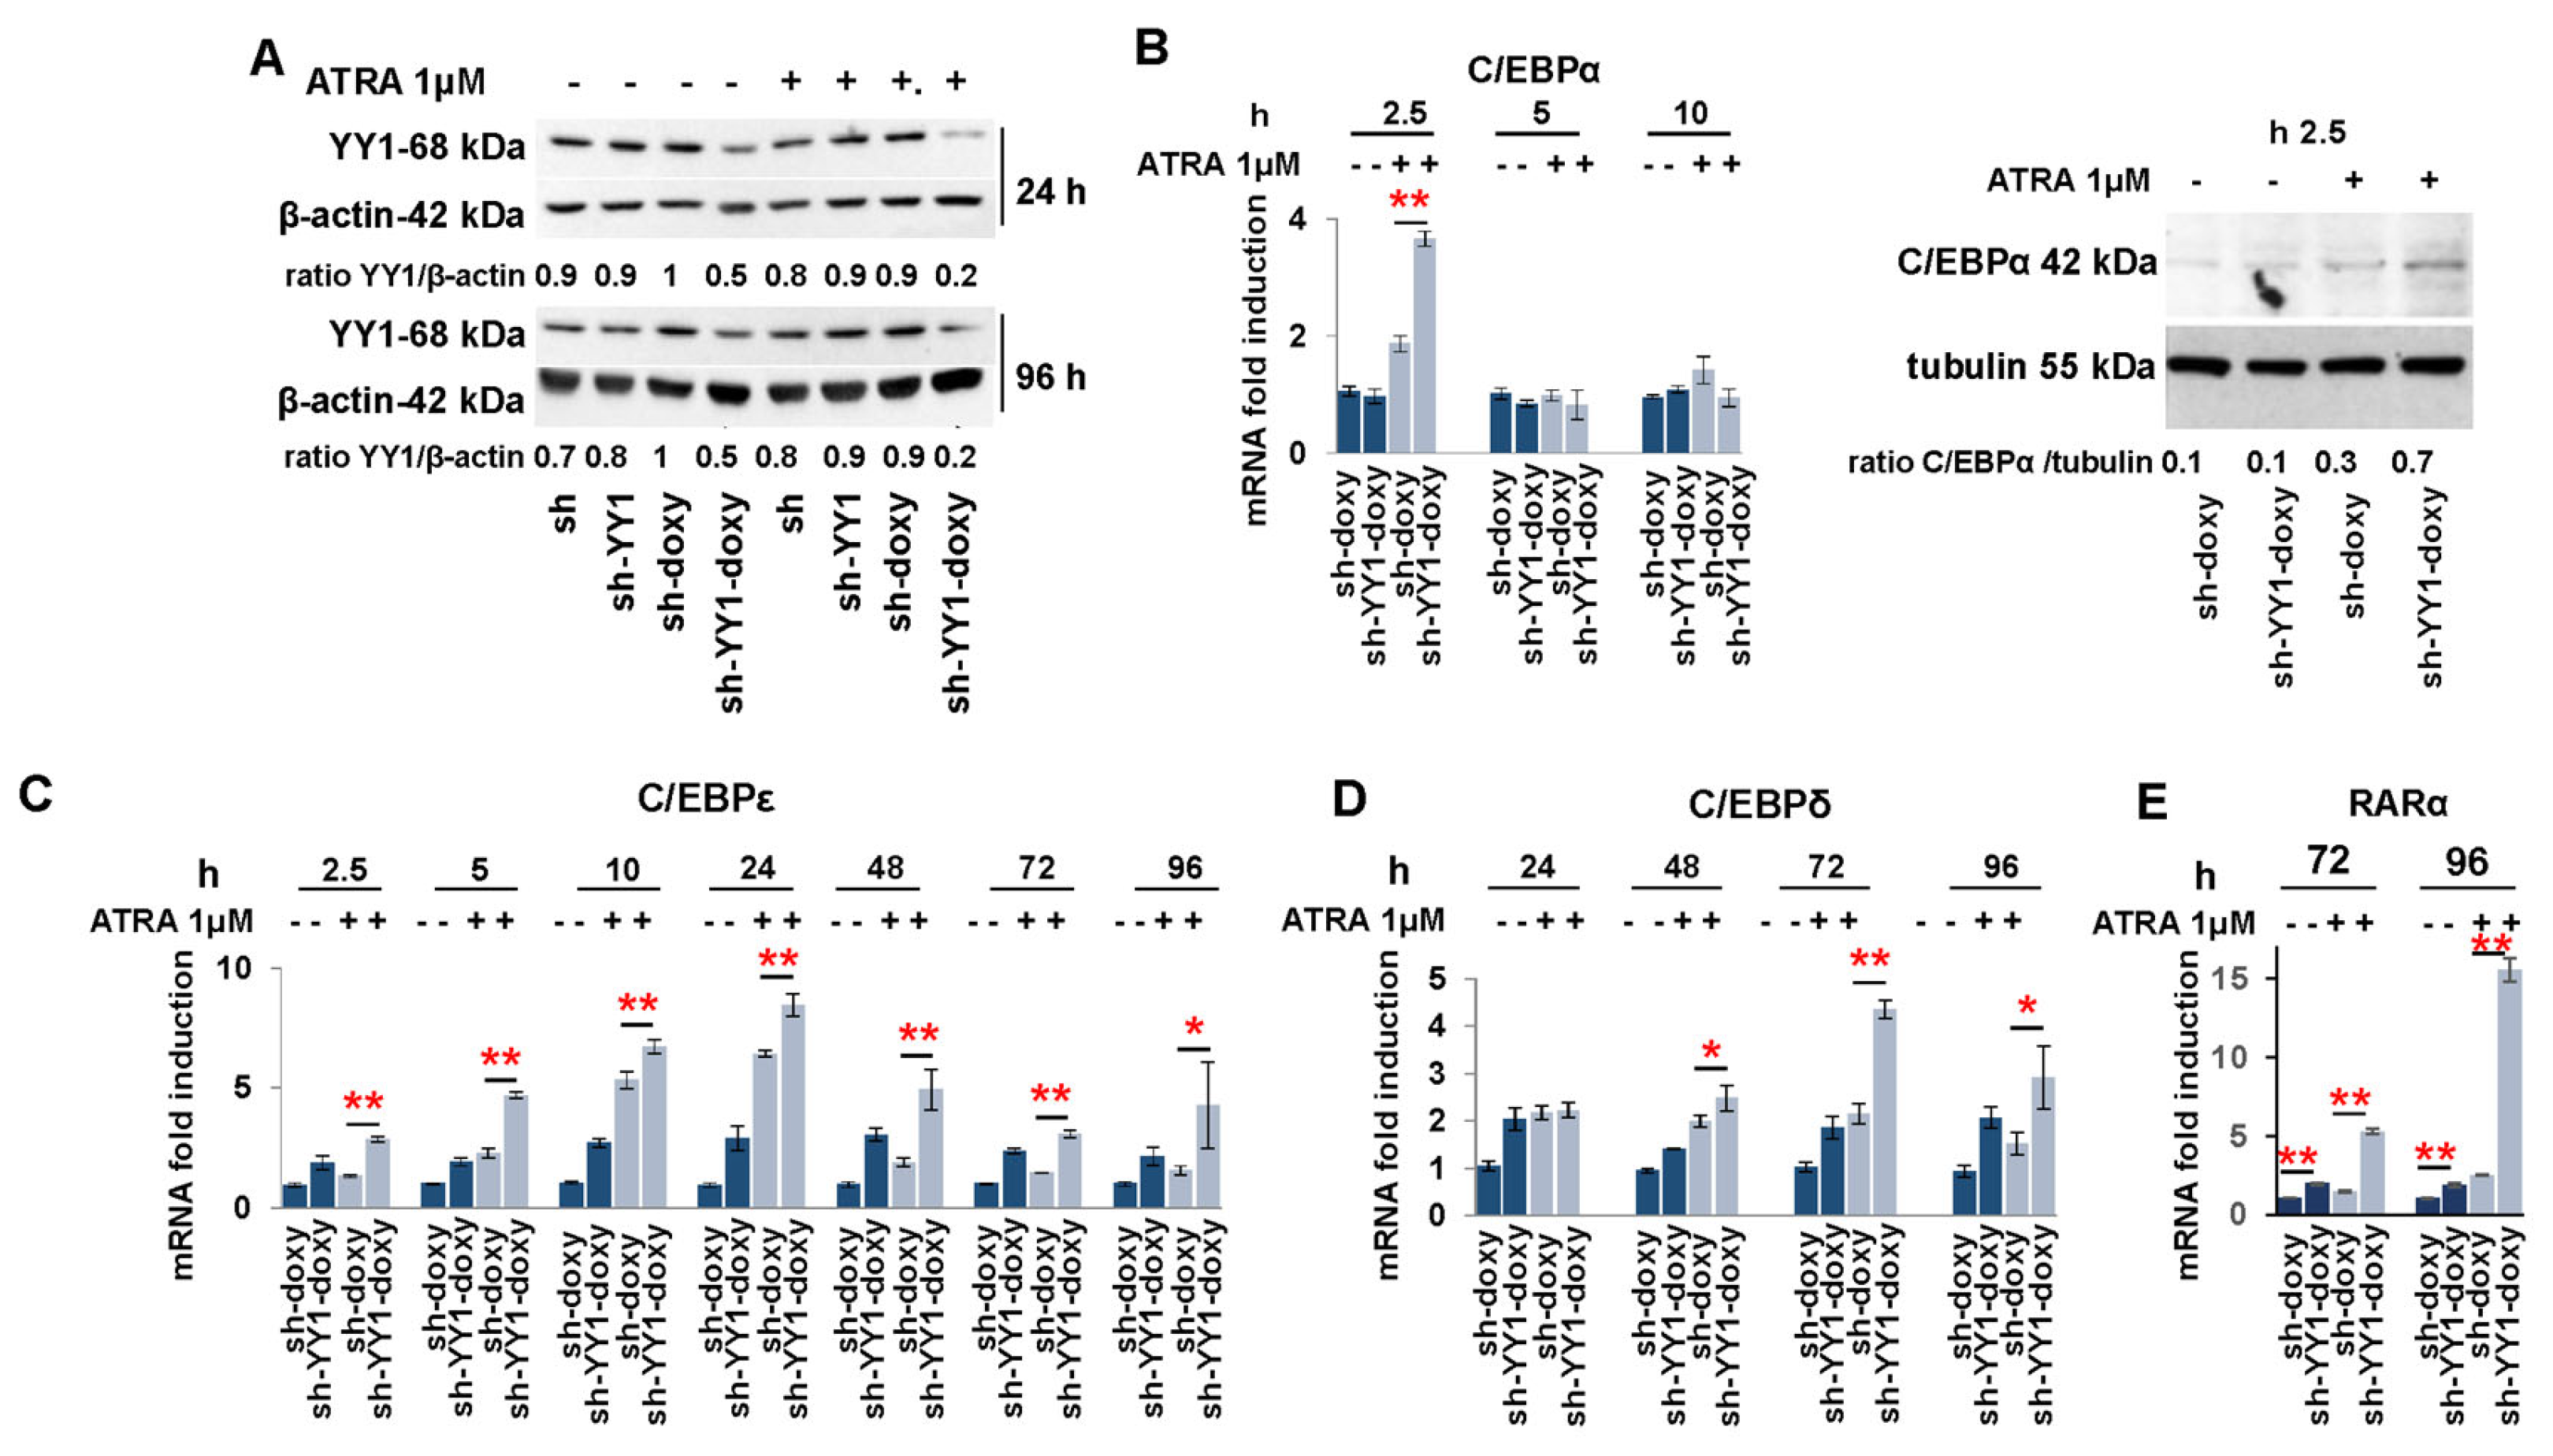
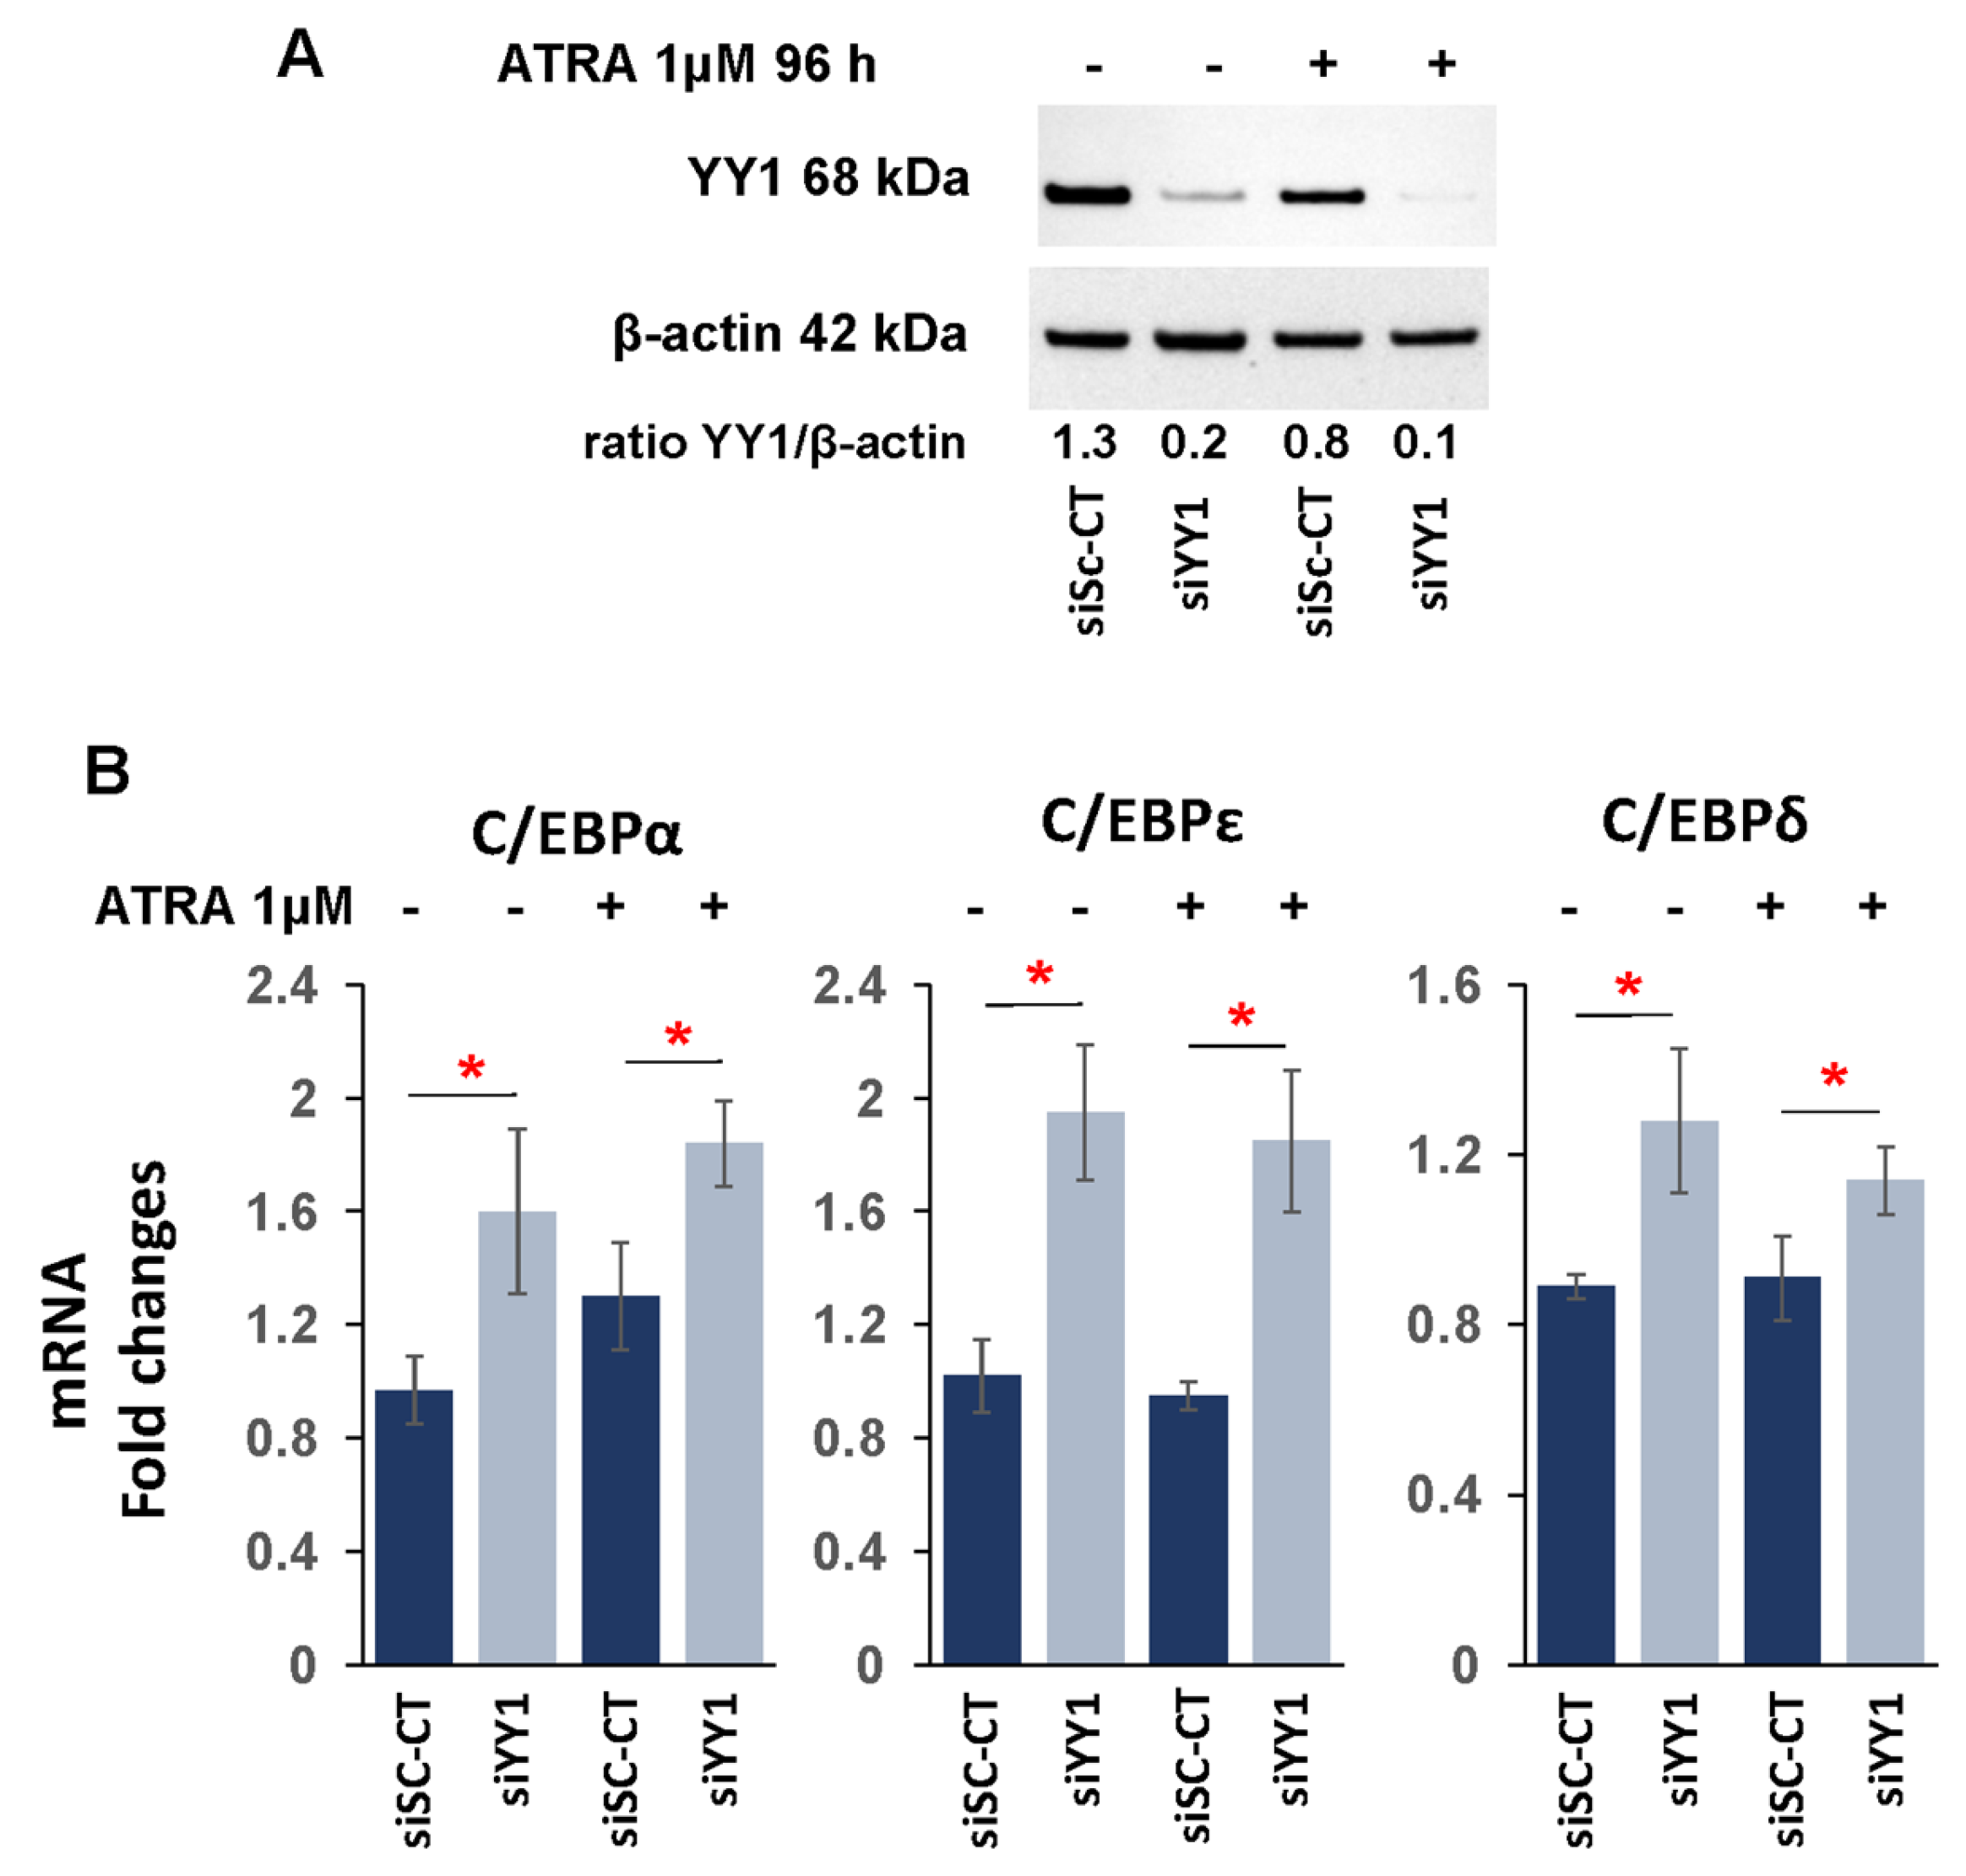
3.3. YY1 Knockdown Increases Expression of C/EBP Family Proteins and Myeloid Growth Factors/Receptors in ATRA-Treated HL-60 and OCI-AML3 Cell Lines

The knockdown of YY1 protein in the AML patient sample and in the HL-60 and OCI-AML3 cell lines led to an increase in the expression of genes associated with myeloid differentiation, including myeloid transcription factors (C/EBPε, C/EBPδ), myeloid growth factors receptors (GM-CSFr, G-CSFr), and the granulocytic differentiation marker (CD11b). The HL-60 cell line is a model for granulocytic differentiation when treated with ATRA [102], although this cell line does not carry the PML/RARα translocation. The OCI-AML3 cell line carries the nucleophosmin gene mutation (NPM1mut), which is found in approximately 30% of adult leukemia cases [103]. Treatment of NPM1mut AMLs with ATRA, or in combination with ATO or chemotherapy, has been shown to increase apoptosis and improve the outcomes of elderly patients [104,105,106]. Therefore, we asked if knockdown of YY1 increased the sensitivity of the HL-60 and OCI-AML3 cell lines to ATRA treatment. HL-60-sh and -sh-doxy, -sh-YY1-doxy following doxycycline induction, and OCI-AML3 siSC-CT and -siYY1 after transfection were collected during treatment with 1 μM ATRA over 96 h at 24 h intervals. YY1 protein levels were efficiently downregulated throughout the ATRA exposure time in HL-60-sh-YY1-doxy relative to control cells (Figure 4A). Exposure to 1 μM ATRA led to a statistically significant increase in expression of C/EBPα, C/EBPε, and C/EBPδ in HL-60-sh-YY1-doxy relative to the control HL-60-sh-doxy at all time points (Figure 4B–D). However, C/EBPα showed increased expression as early as 2.5 h after exposure to ATRA, also confirmed with Western blot (Figure 4B), while C/EBPδ did not show an increase until the 24 h time point for ATRA exposure (Figure 4D).
Expression of the RARα cytoplasmic ATRA receptor was also increased in HL-60-sh-YY1-doxy, and this increase was enhanced several fold with ATRA treatment (Figure 4E). In addition, CSF1, CSF3, GMCSF-r, GCSF-r, and MCSF-r were statistically increased in ATRA-treated HL-60-sh-YY1-doxy relative to ATRA-treated HL-60-sh-doxy and untreated HL-60-sh-YY1-doxy (Supplementary Figure S2). Expression of C/EBPα, C/EBPε, and C/EBPδ was also increased in ATRA-treated OCI-AML3-siYY1 relative to ATRA-treated OCI-AML3-siSc-CT. YY1 protein levels were efficiently downregulated throughout the ATRA exposure time also in OCI-AML3-siYY1 (Figure 5A); however, this increase was not significantly greater than the expression of these genes in untreated OCI-AML3-siYY1 (Figure 5B).

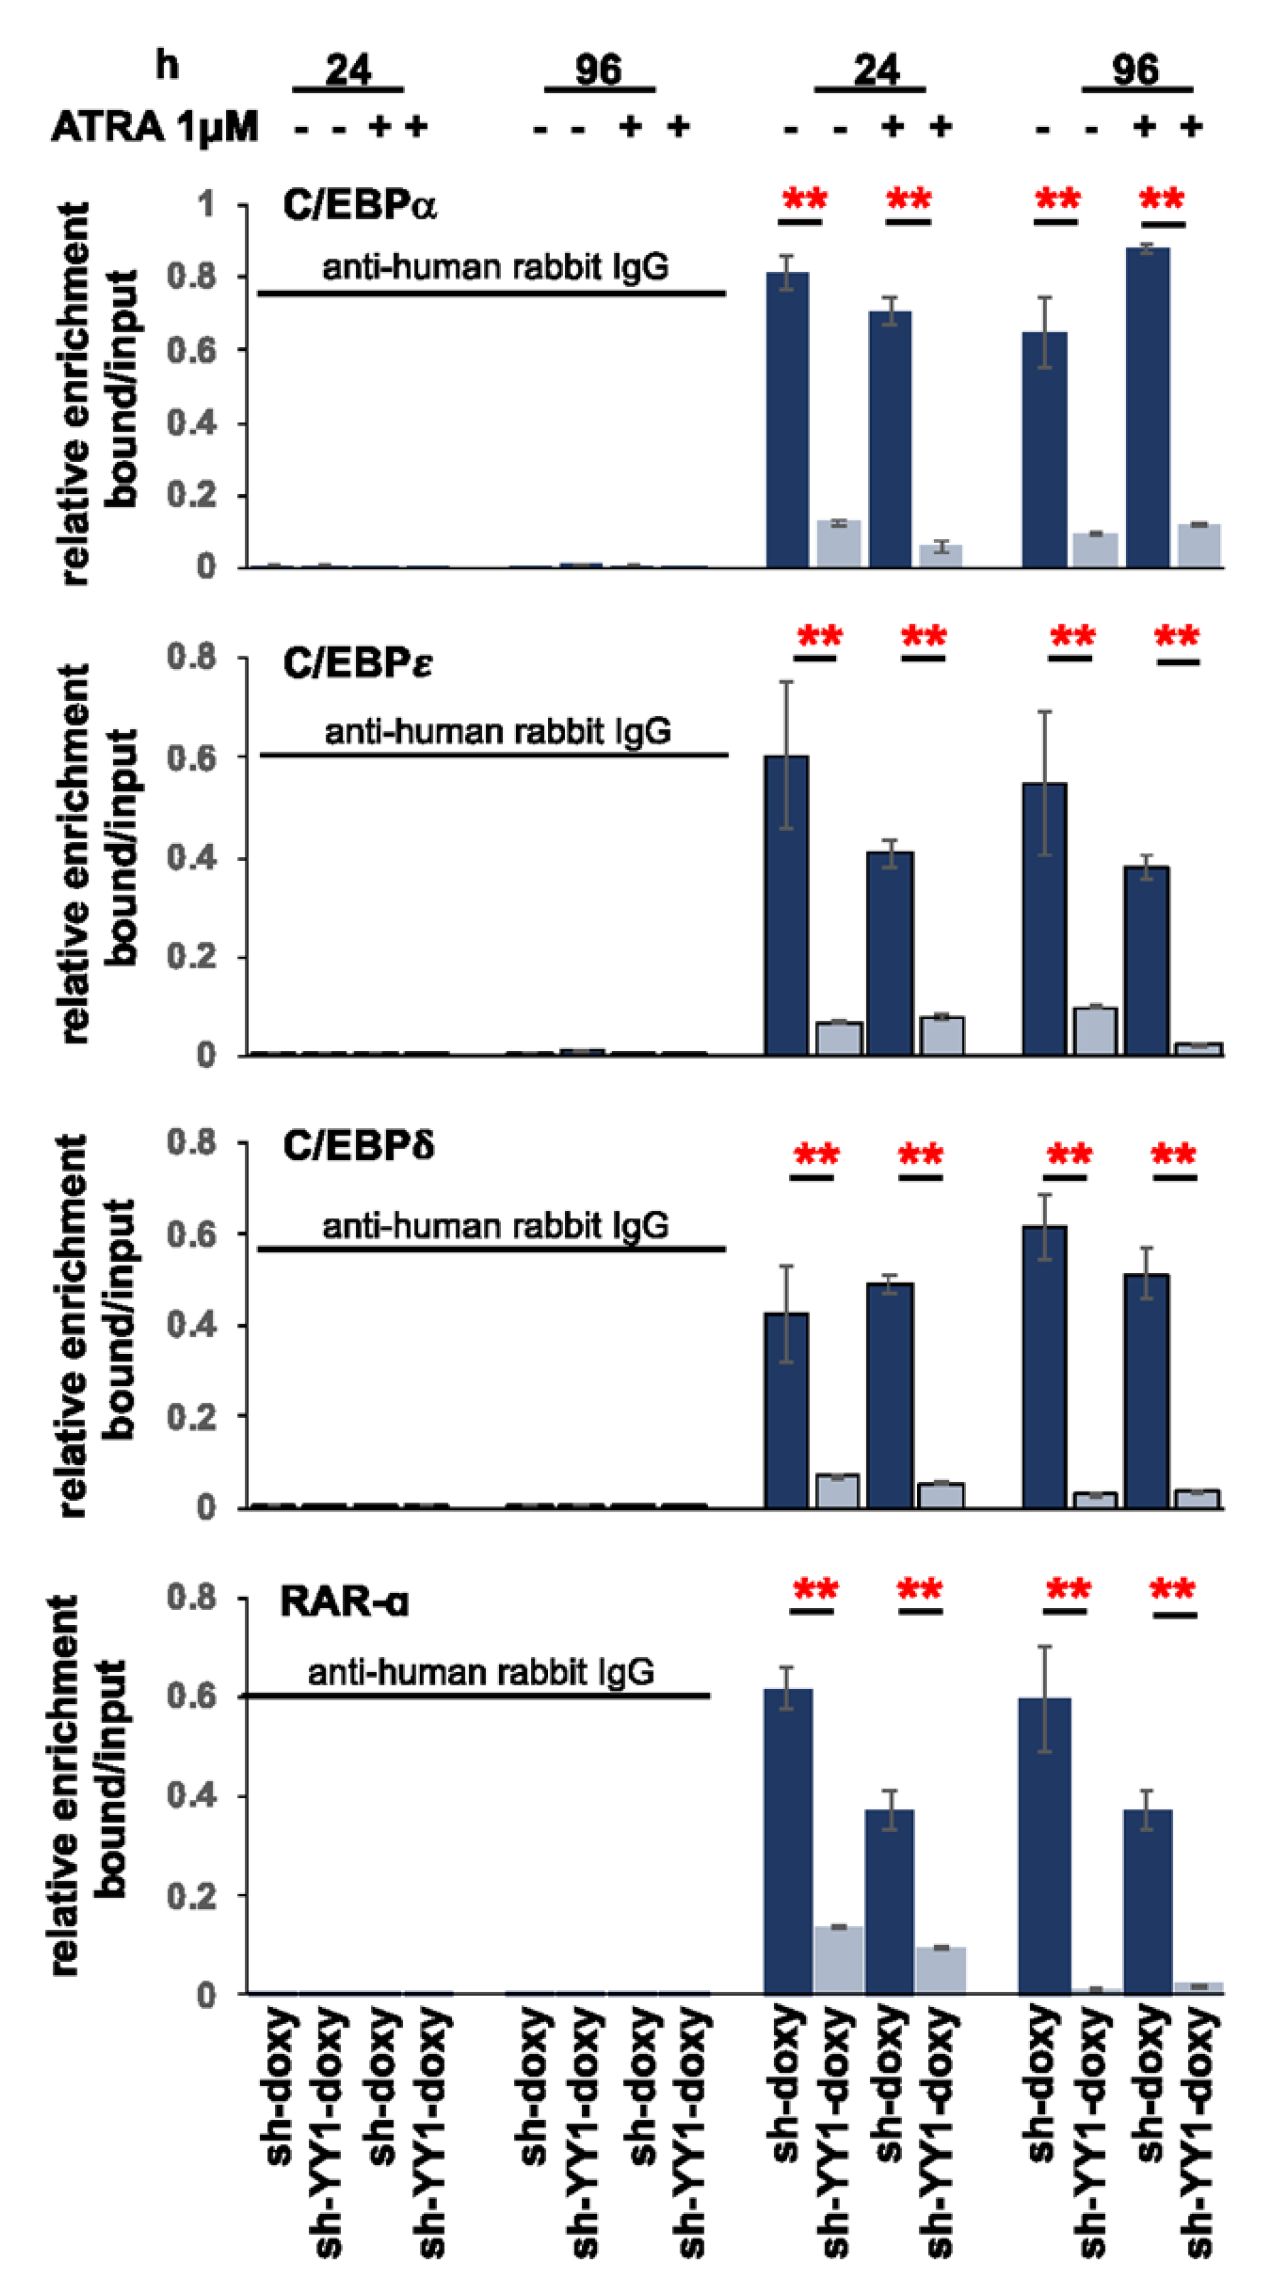
3.4. YY1 binds C/EBPα, C/EBPε, C/EBPδ, and RARα Gene Promoters

Knockdown of YY1 determined an increased expression in some C/EBP protein family members in both cell lines and RARα in HL-60 cells. In these cells, YY1 could act as a transcriptional repressor protein of these genes, and loss of the protein may relieve the promoter regions of the C/EBPs and RARα genes of YY1 transcriptional repression. The Jaspar core 2022 database (consultable on the UCSC genome browser) predicted the presence of putative YY1 binding sites in the 5′ promoter regions of C/EBPα, C/EBPε, C/EBPδ, and RARα. Therefore, we performed chromatin immunoprecipitation (ChIp) with lysates prepared from HL-60-sh-YY1-doxy and -sh-doxy cells to determine YY1 occupancy of the 5′ promoter regions of the C/EBP and RARα genes. Immunoprecipitations were performed on lysates prepared from HL-60-sh-YY1-doxy and -sh-doxy cells induced with doxycycline for 96 h and treated or untreated with ATRA for an additional 96 h. ChIp data showed reduced binding of the 5′ promoter regions of C/EBPα, C/EBPε, C/EBPδ, and RARα in the HL-60-sh-YY1-doxy cells, thus demonstrating that YY1 bound to these putative sites (Figure 6). Consequently, the increased expression of these genes in HL-60 (sh-YY1-doxy) relative to HL-60 (sh-doxy) cells might be due to reduced binding of YY1 to their promoter regions, and thus, the loss of its repressive effect on the transcription of these genes. In the case of C/EBPα, ChIp data confirmed reduced YY1 binding at the 5′ promoter region in sh-YY1-doxy cells; however, this was not accompanied by an increase in the C/EBPα expression, apparently in contradiction with the increased expression observed when the same cells were exposed to ATRA (Figure 4B). A possible explanation might be that the C/EBPα promoter, following YY1 displacement, will became available to the binding of an ATRA-induced transcription factor.

3.5. YY1 Knockdown Enhances Expression of Myeloid Differentiation Markers and Cell Morphological Differentiation Features

To investigate the relationship between YY1 knockdown and myeloid differentiation, we monitored the expression of surface adhesion molecules, granulocytic CD11b and monocytic CD14 [107], and changes in the cell morphology of HL-60-sh-YY1-doxy and -sh-doxy and OCI-AML3-siYY1 and -siSC-CT cells, treated or untreated with 1 μM ATRA. Treatment with 1 μM ATRA increased expression of the granulocytic CD11b marker in HL-60-sh-YY1-doxy at 72 h and 96 h relative to controls (33.8% vs. 20% and 76.6% vs. 42%, ATRA-treated HL-60-sh-YY1-doxy vs. HL-60-sh-doxy, at 72 h and 96 h, respectively). The expression of the monocytic CD14 marker remained unchanged between the samples (Figure 7A).
CD11b showed a slight increase in ATRA-untreated OCI-AML3-siYY1 cells at 96 h after YY1 siRNA transfection (+13% relative to the control OCI-AML3-siSC-CT cells). The effect of the loss of YY1 was more robust in the ATRA-treated cells, with +34% C11b positive OCI-AML3-siYY1 cells compared with OCI-AML3-siSC-CT. CD14 increased by 16% in ATRA-untreated OCI-AML3-siYY1 cells compared with OCI-AML3-siSC-CT, and by 28% in ATRA-treated OCI-AML3-siYY1 compared with ATRA-treated OCI-AML3-siSC-CT (Figure 7B).
We also assessed CD11b and CD14 expression with qRT-PCR. CD11b was significantly higher in ATRA-untreated HL-60-sh-YY1-doxy cells than in ATRA-untreated HL-60-sh-doxy cells (Figure 8A; CD11b data are graphed separately, as the relative increase in CD11b mRNA in ATRA-treated samples was so much higher than in untreated cells), although no significant increase in CD11b was observed on flow cytometry for the same time points.
The exposure to ATRA potently induced CD11b in HL-60-sh-doxy, as expected, and the YY1 knockdown enhanced this effect (Figure 8B). CD14 appeared to be significantly increased in the ATRA-untreated HL-60-sh-YY1-doxy cells at 96 h, despite negative flow cytometry, and in the ATRA-treated HL-60-sh-YY1-doxy cells at all time points, compared with the control HL-60-sh-doxy cells. Thus, YY1 knockdown also enhanced CD14 expression in ATRA-treated cells (Figure 8C).
Finally, cell morphology as assessed with Wright-Giemsa staining and quantitation of the different cell types, showed that in both HL-60 and OCI-AML3, YY1 knockdown was sufficient to induce chromatin condensation with nuclear segmentation, increased granulation, and reduced cytosolic basophilia (Figure 9A,B). In addition, YY1 knockdown enhanced the pro-differentiation effect of ATRA in both HL-60 and OCI-AML3 cell lines, with a surprising effect in HL-60 cells at 96 h (Figure 9A–C).
Collectively, these data demonstrate that YY1 knockdown overcame the differentiation block, driving HL-60 and OCI-AML3 cells towards granulo/mono cell differentiation. In addition, the YY1 knockdown cells seemed more sensitive to ATRA treatment. Overall, these data demonstrate that YY1 downregulation is not only essential for differentiation but also sensitizes AML cells to the therapeutic effect of ATRA.

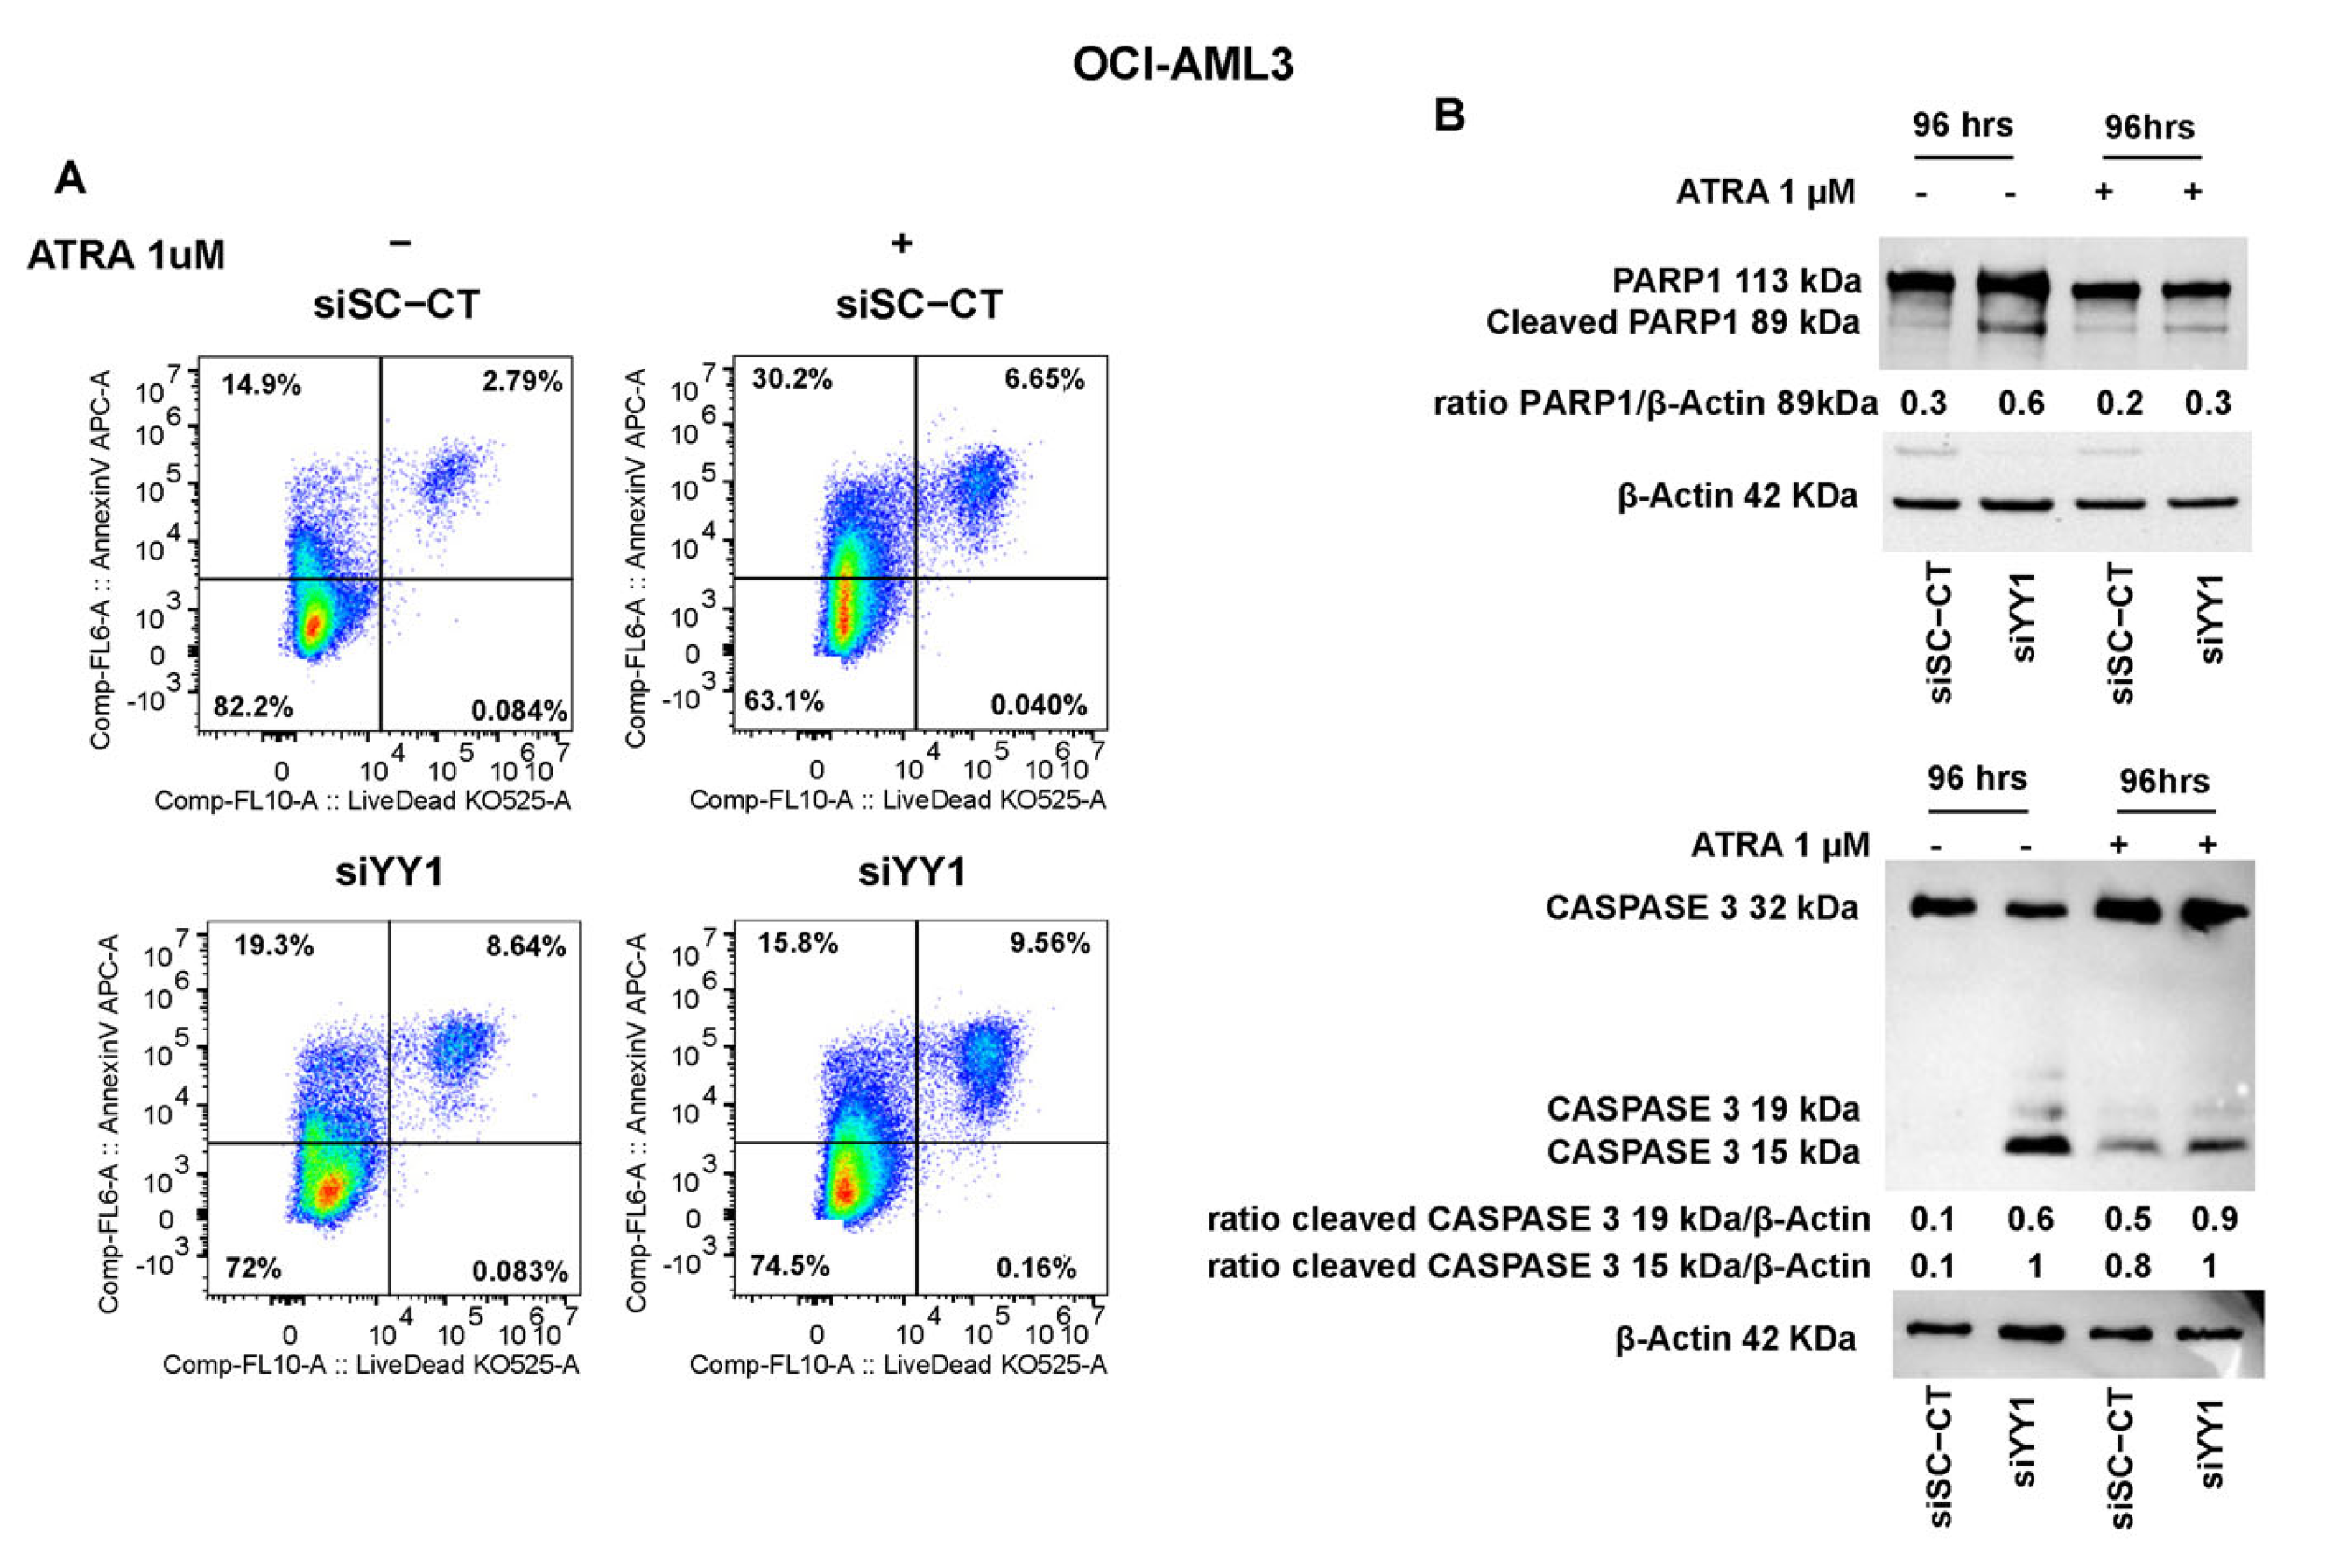
3.6. YY1 Knockdown Reduces Cell Proliferation and Promotes Apoptosis of AML Cell Lines Untreated and Treated with ATRA

YY1 knockdown reduced cell proliferation of HL-60-sh-YY1-doxy and OCI-AML3-siYY1 cells (Supplementary Figure S3); in addition, several studies have shown that YY1 upregulation inhibits apoptosis and favors growth and cell proliferation in both solid tumors and hematological malignancies [108]. To investigate the effect of YY1 downregulation on cell apoptosis, we assessed Annexin V and PI staining in ATRA-treated and -untreated HL-60-sh-doxy and -sh-YY1-doxy cells. YY1 knockdown per se increased the percentage of Annexin V- and PI-positive cells in HL-60 cells (23% vs. 9.9%, HL-60-sh-YY1-doxy vs. HL-60-sh-doxy at 96 h) (Figure 10A). ATRA treatment did not significantly enhance apoptosis in the HL-60-sh-doxy control cells. However, the percentage of apoptotic/dead ATRA-treated HL-60-sh-YY1-doxy cells was significantly increased relative to control ATRA-treated HL-60-sh-doxy cells (13.4% vs. 4.9% and 32.6% vs. 12%, HL-60-sh-YY1-doxy vs. HL-60-sh-doxy, at 72 h and 96 h, respectively; Figure 10A). Furthermore, we assessed the protein levels of the apoptotic markers caspase 3 and PARP1 and the pro-apoptotic factor BAX in HL-60-sh-YY1-doxy and -sh-doxy cells (Figure 10B).
The cleaved forms of caspase 3 and PARP1 appeared at 72 h of ATRA treatment in the HL-60-sh-YY1-doxy cells but were absent in control cells, suggesting the activation of terminal apoptosis. In addition, BAX protein levels were also increased in the HL-60-sh-YY1-doxy cells relative to control HL-60-sh-doxy cells at 72 h and 96 h of ATRA treatment (Figure 10B).
YY1 knockdown also triggered an increase in Annexin V-positive and Live/Dead staining of ATRA-untreated OCI-AML3-siYY1 compared with control OCI-AML3-siSC-CT cells (27.94% vs. 17.69%; Figure 11A). However, the percentage of OCI-AML3-siYY1 Annexin V-positive cells compared with control OCI-AML3-siSC-CT was reduced when these cells were exposed to ATRA, although there was a slight increase in double stained OCI-AML3-siYY1 cells (Annexin V/Dead Live) compared with OCI-AML3-siSC-CT cells (9.56% vs. 6.65%, OCI-AML3-siYY1 vs. OCI-AML3-siSC-CT; Figure 11A).
PARP1 activation and caspase 3 showed the same trend on Western blots. PARP1 and caspase 3 cleaved forms were more abundant in ATRA-untreated and -treated OCI-AML3-siYY1 cells compared with control OCI-AML3-siSC-CT cells (Figure 11B).
In conclusion, these data suggest that YY1 downregulation might not only stimulate commitment in HL-60 and OCI-AML3 cells, but also promote apoptosis in these cells.

4. Discussion

The role of the YY1 protein in carcinogenesis and the progression of solid tumors is well established [76,77,78,79,80,81,82,83,84,85], as well as in lymphoid leukemia [109,110,111,112]. Although YY1 is generally overexpressed in AML [88,89], it is not known if YY1 overexpression may, per se, induce leukemic transformation. In addition, data from the cancer genome atlas (TCGA) database (https://servers.binf.ku.dk/bloodspot/, accessed on 1 July 2023) highlighted a heterogenous YY1 expression among AML samples, without the presence of associations with specific mutational features and patient prognosis (Supplementary Figure S4). However, to date, no molecular studies have been conducted to determine the mechanisms by which YY1 may interfere with normal myelopoiesis, and above all, no data are available on the effect of YY1 downregulation in human AML cells. In this study, we knocked down YY1 in human AML cells, primarily through RNA interference strategies, to investigate the role of YY1 in myeloid differentiation and AML. YY1 knockdown in an AML sample and AML cell lines restored/increased mRNA and protein expression of C/EBP family members, including C/EBPα, C/EBPε, and C/EBPδ, involved in normal and leukemic myelopoiesis [113], and promoted the expression of pro-myeloid growth factor receptors such as GM-CSFr and G-CSFr in HL-60 and of GM-CSFr in OCI-AML3. YY1 knockdown also increased the sensitivity of an AML patient sample and the AML cell lines to ATRA treatment, a standard-of-care therapy used in the clinic. ChIp experiments revealed that YY1 occupied C/EBPα, C/EBPε, and C/EBPδ 5′ promoter regions in the AML cell lines, thus functioning in this context as a suppressor of transcription. Finally, we showed that YY1 is able to bind the RARα promoter region, the ATRA receptor, and that the loss of YY1 increased the expression of RARα per se. Thus, an explanation for the increased sensitivity of AML cells with YY1 knockdown to ATRA may be related to the removal of the repressive effect on RARα transcription and to the increased availability of the ATRA receptor [114].
Remarkably, YY1 knockdown not only induced the expression of C/EBPα, C/EBPε, C/EBPδ, and RARα but also relieved the differentiation block in AML cells. In HL-60 cells, YY1 downregulation generated cell populations that showed robust expression of CD11b but nearly negative CD14 staining. ATRA exposure boosted the expression of CD11b and a significant increase in CD14. In OCI-AML3, YY1 downregulation produced the same results, even if quantitatively less important. This result is probably related to the fact that the cell lines are at a different stage of differentiation block (OCI-AML3 is a FAB M4 acute myelomonocytic leukemia, and HL-60 is a FAB M2 acute myeloblastic leukemia with maturation). These data were supported by the morphological analyses. YY1 knockdown in HL-60 and OCI-AML3 cells clearly showed a recovery of commitment toward mature myeloid lineages, and this direction towards differentiation was even more evident when cells were exposed to ATRA. In particular, ATRA-treated HL-60-sh-YY1-doxy cells appeared to achieve a high degree of granulocytic differentiation. Our data paralleled the morphologic studies conducted by Erkeland et al. [89], showing an impairment of myeloid commitment when YY1 was ectopically expressed in a murine hematopoietic progenitor cell line model.
Evasion from apoptosis is a hallmark of malignant tumor progression, and identifying strategies to induce or restore defective apoptosis is a major priority in the development of cancer therapy. The development of AML has also been shown to be dependent on dysregulation of the apoptotic pathway. For instance, the overexpression of BCL2, which is an important antiapoptotic protein in AML, led to the development of BCL2 inhibitors to promote the induction of apoptosis in AML cells and has led to the discovery of venetoclax, a potent and selective BCL2 inhibitor [115]. More than 250 scientific articles (PubMed) show a direct role for the deregulated expression of YY1 in inhibiting apoptotic pathways through a variety of mechanisms. For the first time, our data show that the reduction in YY1 expression in HL-60 and OCI-AML3 cell lines restored apoptosis as shown by the activation of PARP1 and caspase 3 and the increased expression of the pro-apoptotic protein BAX.

5. Conclusions

Collectively, our data propose a central role for YY1 in the development of AML. YY1 downregulation restored the expression of myeloid C/EBP transcription factors and growth factors; increased the availability of RARα, making cells more sensitive to ATRA exposure; and restored apoptosis in AML cell lines. Therefore, YY1 represents a novel target of investigation in the quest to improve AML patient treatment [39].

Supplementary Materials

The following supporting information can be downloaded at: https://www.mdpi.com/article/10.3390/cancers15154010/s1, File S1: The original western blot figures; Figure S1: mRNA expression of myeloid growth factors and receptors in HL-60 and OCI-AML3 YY1 interfered cell lines. mRNA expression levels were normalized to GAPDH levels and expressed as fold induction to control cells value (=1). Each qRT-PCR amplification was performed in triplicate. Statistical analysis was performed in triplicate using the nonparametric Mann-Whitney test. * p value ≤ 0.05. Error bars: SD, standard deviation; Figure S2: mRNA expression of myeloid growth factors and receptors in HL-60 control sh-doxy and YY1 interfered sh-yy1-doxy cell lines. mRNA expression levels were normalized to GAPDH levels and expressed as fold induction to control cells value (=1). Each qRT-PCR amplification was performed in triplicate. Statistical analysis was performed in triplicate using the nonparametric Mann-Whitney test. * p value ≤ 0.05. Error bars: SD, standard deviation; Figure S3: Cell proliferation of YY1 knocked down HL-60 (sh-yy1 doxy) and OCI-AML3 (siyy1) cells vs. their respective cell controls HL-60 sh-doxy and OCI-AML3 siSC-CT, at the indicated time points. * p value ≤ 0.05; Figure S4: data from the cancer genome atlas (TCGA) database (https://servers.binf.ku.dk/bloodspot/) highlighted a heterogenous YY1 expression among AML samples, without the presence of associations with specific mutational features and patient prognosis; Table S1: AML patient sample characteristics.

Author Contributions

Conceptualization, N.I.N., S.T., S.S., A.T., T.O., M.T.V. and G.Z.; methodology, N.I.N., S.T., S.S., C.C., A.R., M.Z., A.Z., M.R.R. and D.F.A.; statistical analyses, M.Z.; data curation, N.I.N., S.T. and S.S.; investigation and visualization, all authors contributed; writing, review, and editing, G.Z.; supervision and project administration, G.Z. All authors have read and agreed to the published version of the manuscript.

Funding

This research was funded by the University of Rome Sapienza, Progetti di Ricerca C26A15S3JR and by Fondazione AIRC per la ricerca sul cancro ETS, AIRC 5 x 1000 called “Metastatic disease: the key unmet need in oncology” to MYNERVA project, #21267 (MYeloid NEoplasms Research Venture AIRC) (A detailed description of the MYNERVA project is available at http://www.progettoagimm.it, accessed on 2 April 2022.) to M.T.V. PRIN grant no. 2017WXR7ZT to M.V., Ministero della Salute, Rome, Italy (Finalizzata 2018, NET-2018-12365935, Personalized medicine program on myeloid neoplasms: characterization of the patient’s genome for clinical decision making and systematic collection of real-world data to improve quality of health care), by GR-2018-12365529-Santa Lucia to T.O. and by Fondazione Beat Leukaemia Onlus to S.T.

Institutional Review Board Statement

The study was conducted in accordance with the Declaration of Helsinki and approved by the ethical committee of the University of Rome Tor Vergata (Study Protocol 171/19).

Informed Consent Statement

Patient consent was waived due to the study being deemed minimal risk.

Data Availability Statement

Data supporting the reported results are maintained in a research folder in the Department of Experimental Medicine, Epigenetic Laboratory Z.G., University of Rome “Sapienza”.

Conflicts of Interest

The authors declare no conflict of interest.

References

  1. Yang, J.J.; Park, T.S.; Wan, T.S.K. Recurrent Cytogenetic Abnormalities in Acute Myeloid Leukemia. Methods Mol. Biol. 2017, 1541, 223–245. [Google Scholar] [PubMed]
  2. Yin, P.Y.; Wang, R.W.; Jing, R.; Li, X.; Ma, J.H.; Li, K.M.; Wang, H. Research progress on molecular biomarkers of acute myeloid leukemia. Front. Oncol. 2023, 7, 1078556. [Google Scholar] [CrossRef] [PubMed]
  3. Kogan, A.A.; Lapidus, R.G.; Baer, M.R.; Rassool, F.V. Exploiting epigenetically mediated changes: Acute myeloid leukemia, leukemia stem cells and the bone marrow microenvironment. Adv. Cancer Res. 2019, 141, 213–253. [Google Scholar] [PubMed]
  4. Yang, L.; Rau, R.; Goodell, M.A. DNMT3A in haematological malignancies. Nat. Rev. Cancer 2015, 15, 152–165. [Google Scholar] [CrossRef]
  5. Pappalardi, M.B.; Keenan, K.; Cockerill, M.; Kellner, W.A.; Stowell, A.; Sherk, C.; Wong, K.; Pathuri, S.; Briand, J.; Steidel, M.; et al. Discovery of a first-in-class reversible DNMT1-selective inhibitor with improved tolerability and efficacy in acute myeloid leukemia. Nat. Cancer 2021, 2, 1002–1017. [Google Scholar] [CrossRef] [PubMed]
  6. Trempenau, M.L.; Schuster, M.B.; Pundhir, S.; Pereira, M.A.; Kalvisa, A.; Tapia, M.; Su, J.; Ge, Y.; de Boer, B.; Balhuizen, A.; et al. Leukemia The histone demethylase KDM5C functions as a tumor suppressor in AML by repression of bivalently marked immature genes. Leukemia 2023, 37, 593–605. [Google Scholar] [CrossRef]
  7. Scalea, S.; Maresca, C.; Catalanotto, C.; Marino, R.; Cogoni, C.; Reale, A.; Zampieri, M.; Zardo, G. Modifications of H3K4 methylation levels are associated with DNA hypermethylation in acute myeloid leukemia. FEBS J. 2020, 287, 1155–1175. [Google Scholar] [CrossRef]
  8. Khalaj, M.; Woolthuis, C.M.; Hu, W.; Durham, B.H.; Chu, S.H.; Qamar, S.; Armstrong, S.A.; Park, C.Y. miR-99 regulates normal and malignant hematopoietic stem cell self- renewal. J. Exp. Med. 2017, 214, 2453–2470. [Google Scholar] [CrossRef]
  9. Hu, W.; Dooley, J.; Chung, S.S.; Chandramohan, D.; Cimmino, L.; Mukherjee, S.; Mason, C.E.; de Strooper, B.; Liston, A.; Park, C.Y. miR-29a maintains mouse hematopoietic stem cell self-renewal by regulating Dnmt3a. Blood 2015, 125, 2206–2216. [Google Scholar] [CrossRef]
  10. Zardo, G.; Ciolfi, A.; Vian, L.; Starnes, L.M.; Billi, M.; Racanicchi, S.; Maresca, C.; Fazi, F.; Travaglini, L.; Noguera, N.; et al. Polycombs and microRNA-223 regulate human granulopoiesis by transcriptional control of target gene expression. Blood 2012, 119, 4034–4046. [Google Scholar] [CrossRef] [Green Version]
  11. Mishra, S.; Liu, J.; Chai, L.; Tenen, D.G. Diverse functions of long noncoding RNAs in acute myeloid leukemia: Emerging roles in pathophysiology, prognosis, and treatment resistance. Curr. Opin. Hematol. 2022, 29, 34–43. [Google Scholar] [CrossRef] [PubMed]
  12. Zardo, G.; Ciolfi, A.; Vian, L.; Billi, M.; Racanicchi, S.; Grignani, F.; Nervi, C. Transcriptional targeting by microRNA-polycomb complexes: A novel route in cell fate determination. Cell Cycle 2012, 11, 3543–3549. [Google Scholar] [CrossRef] [PubMed] [Green Version]
  13. Leone, G.; D’Alò, F.; Zardo, G.; Voso, M.T.; Nervi, C. Epigenetic treatment of myelodysplastic syndromes and acute myeloid leukemias. Curr. Med. Chem. 2008, 15, 1274–1287. [Google Scholar] [CrossRef] [PubMed] [Green Version]
  14. Tsai, C.T.; So, C.W. Epigenetic therapies by targeting aberrant histone methylome in AML: Molecular mechanisms, current preclinical and clinical development. Oncogene 2017, 36, 1753–1759. [Google Scholar] [CrossRef]
  15. Short, N.J.; Kantarjian, H. Hypomethylating agents for the treatment of myelodysplastic syndromes and acute myeloid leukemia: Past discoveries and future directions. Am. J. Hematol. 2022, 97, 1616–1626. [Google Scholar] [CrossRef]
  16. Di Croce, L.; Raker, V.A.; Corsaro, M.; Fazi, F.; Fanelli, M.; Faretta, M.; Fuks, F.; Lo Coco, F.; Kouzarides, T.; Nervi, C.; et al. Methyltransferase recruitment and DNA hypermethylation of target promoters by an oncogenic transcription factor. Science 2002, 295, 1079–1082. [Google Scholar] [CrossRef] [Green Version]
  17. Grignani, F.; De Matteis, S.; Nervi, C.; Tomassoni, L.; Gelmetti, V.; Cioce, M.; Fanelli, M.; Ruthardt, M.; Ferrara, F.F.; Zamir, I.; et al. Fusion proteins of the retinoic acid receptor-alpha recruit histone deacetylase in promyelocytic leukaemia. Nature 1998, 391, 815–818. [Google Scholar] [CrossRef]
  18. Martens, J.H.; Brinkman, A.B.; Simmer, F.; Francoijs, K.J.; Nebbioso, A.; Ferrara, F.; Altucci, L.; Stunnenberg, H.G. PML-RARalpha/RXR alters the epigenetic landscape in acute promyelocytic leukemia. Cancer Cell 2010, 17, 173–185. [Google Scholar] [CrossRef] [Green Version]
  19. Nguyen, A.T.; Taranova, O.; He, J.; Zhang, Y. DOT1L, the H3K79 methyltransferase, is required for MLL-AF9-mediated leukemogenesis. Blood 2011, 117, 6912–6922. [Google Scholar] [CrossRef] [Green Version]
  20. Bernt, K.M.; Zhu, N.; Sinha, A.U.; Vempati, S.; Faber, J.; Krivtsov, A.V.; Feng, Z.; Punt, N.; Daigle, A.; Bullinger, L.; et al. MLL-rearranged Leukemia is Dependent on Aberrant H3K79 Methylation by DOT1L. Cancer Cells 2011, 20, 66–78. [Google Scholar] [CrossRef] [Green Version]
  21. Fazi, F.; Zardo, G.; Gelmetti, V.; Travaglini, L.; Ciolfi, A.; Di Croce, L.; Rosa, A.; Bozzoni, I.; Grignani, F.; Lo-Coco, F.; et al. Heterochromatic gene repression of the retinoic acid pathway in acute myeloid leukemia. Blood 2007, 109, 4432–4440. [Google Scholar] [CrossRef] [PubMed]
  22. Rejeski, K.; Duque-Afonso, J.; Lübbert, M. AML1/ETO and its function as a regulator of gene transcription via epigenetic mechanisms. Oncogene 2021, 40, 5665–5676. [Google Scholar] [CrossRef] [PubMed]
  23. Mayle, A.; Yang, L.; Rodriguez, B.; Zhou, T.; Chang, E.; Curry, C.V.; Challen, G.A.; Li, W.; Wheeler, D.; Rebel, V.I.; et al. Dnmt3a loss predisposes murine hematopoietic stem cells to malignant transformation. Blood 2015, 125, 629–663. [Google Scholar] [CrossRef] [PubMed] [Green Version]
  24. Roller, A.; Grossmann, V.; Bacher, U.; Poetzinger, F.; Weissmann, S.; Nadarajah, N.; Boeck, L.; Kern, W.; Haferlach, C.; Schnittger, S.; et al. Landmark analysis of DNMT3A mutations in hematological malignancies. Leukemia 2013, 27, 1573–1578. [Google Scholar] [CrossRef] [PubMed]
  25. Yang, L.; Rodriguez, B.; Mayle, A.; Park, H.J.; Lin, X.; Luo, M.; Jeong, M.; Curry, C.V.; Kim, S.B.; Ruau, D.; et al. DNMT3A loss drives enhancer hypomethylation in FLT3-ITD associated leukemias. Cancer Cell 2016, 29, 922–934. [Google Scholar] [CrossRef] [PubMed] [Green Version]
  26. Bejar, R.; Stevenson, K.; Abdel-Wahab, O.; Galili, N.; Nilsson, B.; Garcia-Manero, G.; Kantarjian, H.; Raza, A.; Levine, R.L.; Neuberg, D.; et al. Clinical effect of point mutations in myelodysplastic syndromes. N. Engl. J. Med. 2011, 364, 2496–2506. [Google Scholar] [CrossRef] [PubMed] [Green Version]
  27. Nakagawa, M.; Kitabayashi, I. Oncogenic roles of enhancer of zeste homolog 1/2 in hematological malignancies. Cancer Sci. 2018, 109, 2342–2348. [Google Scholar] [CrossRef] [PubMed] [Green Version]
  28. Delhommeau, F.; Dupont, S.; Della Valle, V.; James, C.; Trannoy, S.; Massé, A.; Kosmider, O.; Le Couedic, J.P.; Robert, F.; Alberdi, A.; et al. Mutation in TET2 in myeloid cancers. N. Engl. J. Med. 2009, 360, 2289–2301. [Google Scholar] [CrossRef]
  29. Langemeijer, S.M.; Kuiper, R.P.; Berends, M.; Knops, R.; Aslanyan, M.G.; Massop, M.; Stevens-Linders, E.; van Hoogen, P.; van Kessel, A.G.; Raymakers, R.A.; et al. Acquired mutations in TET2 are common in myelodysplastic syndromes. Nat. Genet. 2009, 41, 838–842. [Google Scholar] [CrossRef]
  30. Figueroa, M.E.; Abdel-Wahab, O.; Lu, C.; Ward, P.S.; Patel, J.; Shih, A.; Li, Y.; Bhagwat, N.; Vasanthakumar, A.; Fernandez, H.F.; et al. Leukemic IDH1 and IDH2 mutations result in a hypermethylation phenotype, disrupt TET2 function, and impair hematopoietic differentiation. Cancer Cell 2010, 18, 553–567. [Google Scholar] [CrossRef] [Green Version]
  31. Chou, W.C.; Huang, H.H.; Hou, H.A.; Chen, C.Y.; Tang, J.L.; Yao, M.; Tsay, W.; Ko, B.S.; Wu, S.J.; Huang, S.Y.; et al. Distinct clinical and biological features of de novo acute myeloid leukemia with additional sex comb-like 1 (ASXL1) mutations. Blood 2010, 116, 4086–4094. [Google Scholar] [CrossRef] [PubMed] [Green Version]
  32. Asada, S.; Kitamura, T. Aberrant histone modifications induced by mutant ASXL1 in myeloid neoplasms. Int. J. Hematol. 2019, 110, 179–186. [Google Scholar] [CrossRef] [PubMed] [Green Version]
  33. Shao, Z.; Raible, R.F.; Mollaaghababa, J.R.; Guyon, J.R.; Wu, C.T.; Bender, W.; Kingston, R.E. Stabilization of chromatin structure by PRC1, a Polycomb complex. Cell 1999, 98, 37–46. [Google Scholar] [CrossRef] [Green Version]
  34. Kuzmichev, A.; Nishioka, H.K.; Erdjument-Bromage, P.; Tempst, P.; Reinberg, D. Histone methyltransferase activity associated with a human multiprotein complex containing the Enhancer of Zeste protein. Genes Dev. 2002, 16, 2893–2905. [Google Scholar] [CrossRef] [Green Version]
  35. Gao, Z.; Zhang, J.; Bonasio, R.; Strino, F.; Sawai, A.; Parisi, F.; Kluger, Y.; Reinberg, D. PCGF homologs, CBX proteins, and RYBP define functionally distinct PRC1 family complexes. Mol. Cell 2012, 45, 344–356. [Google Scholar] [CrossRef] [Green Version]
  36. Healy, E.; Mucha, M.; Glancy, E.; Fitzpatrick, D.J.; Conway, E.; Neikes, H.K.; Monger, C.; Van Mierlo, G.; Baltissen, M.P.; Koseki, Y.; et al. PRC2.1 and PRC2.2 Synergize to Coordinate H3K27 Trimethylation. Mol. Cell 2019, 76, 437–452. [Google Scholar] [CrossRef]
  37. Wang, H.; Wang, L.; Erdjument-Bromage, H.; Vidal, M.; Tempst, P.; Jones, R.S.; Zhang, Y. Role of histone H2A ubiquitination in Polycomb silencing. Nature 2004, 431, 873–878. [Google Scholar] [CrossRef]
  38. Cao, R.; Wang, L.; Wang, H.; Xia, L.; Erdjument-Bromage, H.; Tempst, P.; Jones, R.S.; Zhang, Y. Role of histone H3 lysine 27 methylation in Polycomb-group silencing. Science 2002, 298, 1039–1043. [Google Scholar] [CrossRef] [Green Version]
  39. Zeisig, B.B.; So, C.W.E. Therapeutic Opportunities of Targeting Canonical and Noncanonical PcG/TrxG Functions in Acute Myeloid Leukemia. Ann. Rev. Genom. Hum. Genet. 2021, 22, 103–125. [Google Scholar] [CrossRef]
  40. Rizo, A.; Olthof, S.; Han, L.; Vellenga, E.; de Haan, G.; Schuringa, J.J. Repression of BMI1 in normal and leukemic human CD34(+) cells impairs self-renewal and induces apoptosis. Blood 2009, 114, 1498–1505. [Google Scholar] [CrossRef] [Green Version]
  41. Park, I.K.; Qian, D.; Kiel, M.; Becker, M.W.; Pihalja, M.; Weissman, I.L.; Morrison, S.J.; Clarke, M.F. Bmi-1 is required for maintenance of adult self-renewing haematopoietic stem cells. Nature 2003, 423, 302–305. [Google Scholar] [CrossRef] [PubMed] [Green Version]
  42. Mihara, K.; Chowdhury, M.; Nakaju, N.; Hidani, S.; Ihara, A.; Hyodo, H.; Yasunaga, S.; Takihara, Y.; Kimura, A. Bmi-1 is useful as a novel molecular marker for predicting progression of myelodysplastic syndrome and patient prognosis. Blood 2006, 107, 305–308. [Google Scholar] [CrossRef] [PubMed] [Green Version]
  43. Oguro, H.; Yuan, J.; Tanaka, S.; Miyagi, S.; Mochizuki-Kashio, M.; Ichikawa, H.; Yamazaki, S.; Koseki, H.; Nakauchi, H.; Iwama, A.; et al. Lethal myelofibrosis induced by Bmi1-deficient hematopoietic cells unveils a tumor suppressor function of the polycomb group genes. J. Exp. Med. 2012, 209, 445–454. [Google Scholar] [CrossRef] [PubMed]
  44. Jacobs, J.J.L.; Scheijen, B.; Voncken, J.-W.; Kieboom, K.; Berns, A.; van Lohuizen, M. Bmi-1 collaborates with c-Myc in tumorigenesis by inhibiting c-Myc-induced apoptosis via INK4a/ARF. Genes Dev. 1999, 13, 2678–2690. [Google Scholar] [CrossRef]
  45. Beà, S.; Tort, F.; Pinyol, M.; Puig, X.; Hernández, L.; Hernández, S.; Fernandez, P.L.; van Lohuizen, M.; Colomer, D.; Campo, E. BMI-1 gene amplification and overexpression in hematological malignancies occur mainly in mantle cell lymphomas. Cancer Res. 2001, 61, 2409–2412. [Google Scholar]
  46. Klauke, K.; Radulović, V.; Broekhuis, M.; Weersing, E.; Zwart, E.; Olthof, S.; Ritsema, M.; Bruggeman, S.; Wu, X.; Helin, K.; et al. Polycomb Cbx family members mediate the balance between haematopoietic stem cell self-renewal and differentiation. Nat. Cell Biol. 2013, 15, 353–362. [Google Scholar] [CrossRef]
  47. Scott, C.L.; Gil, J.; Hernando, E.; Teruya-Feldstein, J.; Narita, M.; Martínez, D.; Visakorpi, T.; Mu, D.; Cordon-Cardo, C.; Peters, G.; et al. Role of the chromobox protein CBX7 in lymphomagenesis. Proc. Natl. Acad. Sci. USA 2007, 104, 5389–5394. [Google Scholar] [CrossRef]
  48. Grossmann, V.; Tiacci, E.; Holmes, A.B.; Kohlmann, A.; Martelli, M.P.; Kern, W.; Spanhol-Rosseto, A.; Klein, H.U.; Dugas, M.; Schindela, S.; et al. Whole-exome sequencing identifies somatic mutations of BCOR in acute myeloid leukemia with normal karyotype. Blood 2011, 118, 6153–6163. [Google Scholar] [CrossRef] [Green Version]
  49. Li, M.; Collins, R.; Jiao, Y.; Ouillette, P.; Bixby, D.; Erba, H.; Vogelstein, B.; Kinzler, K.W.; Papadopoulos, N.; Malek, S.N.; et al. Somatic mutations in the transcriptional corepressor gene BCORL1 in adult acute myelogenous leukemia. Blood 2011, 118, 5914–5917. [Google Scholar] [CrossRef] [Green Version]
  50. Damm, F.; Chesnais, V.; Nagata, Y.; Yoshida, K.; Scourzic, L.; Okuno, Y.; Itzykson, R.; Sanada, M.; Shiraishi, Y.; Gelsi-Boyer, V.; et al. BCOR and BCORL1 mutations in myelodysplastic syndromes and related disorders. Blood 2013, 122, 3169–3177. [Google Scholar] [CrossRef] [Green Version]
  51. Pettirossi, V.; Venanzi, A.; Spanhol-Rosseto, A.; Schiavoni, G.; Santi, A.; Tasselli, L.; Naccari, M.; Pensato, V.; Pucciarini, A.; Martelli, M.P.; et al. The gene mutation landscape of acute myeloid leukemia cell lines and its exemplar use to study the BCOR tumor suppressor. Leukemia 2023, 37, 473–477. [Google Scholar] [CrossRef] [PubMed]
  52. Ziemin-van der Poel, S.; McCabe, N.R.; Gill, H.J.; Espinosa, R., 3rd; Patel, Y.; Harden, A.; Rubinelli, P.; Smith, S.D.; LeBeau, M.M.; Rowley, J.D.; et al. Identification of a gene, MLL, that spans the breakpoint in 11q23 translocations associated with human leukemias. Proc. Natl. Acad. Sci. USA 1991, 88, 10735–10739. [Google Scholar] [CrossRef] [PubMed]
  53. Faber, J.; Krivtsov, A.V.; Stubbs, M.C.; Wright, R.; Davis, T.N.; van den Heuvel-Eibrink, M.; Zwaan, C.M.; Kung, A.L.; Armstrong, S.A. HOXA9 is required for survival in human MLL-rearranged acute leukemias. Blood 2009, 113, 2375–2385. [Google Scholar] [CrossRef] [PubMed] [Green Version]
  54. Li, Z.; Chen, P.; Su, R.; Hu, C.; Li, Y.; Elkahloun, A.G.; Zuo, Z.; Gurbuxani, S.; Arnovitz, S.; Weng, H.; et al. PBX3 and MEIS1 Cooperate in Hematopoietic Cells to Drive Acute Myeloid Leukemias Characterized by a Core Transcriptome of the MLL-Rearranged Disease. Cancer Res. 2016, 76, 619–629. [Google Scholar] [CrossRef] [Green Version]
  55. Stasik, S.; Middeke, J.M.; Kramer, M.; Röllig, C.; Krämer, A.; Scholl, S.; Hochhaus, A.; Crysandt, M.; Brümmendorf, T.H.; Naumann, R.; et al. EZH2 mutations and impact on clinical outcome: An analysis in 1604 patients with newly diagnosed acute myeloid leukemia. Haematologica 2020, 105, e228–e231. [Google Scholar] [CrossRef] [Green Version]
  56. Score, J.; Hidalgo-Curtis, C.; Jones, A.V.; Winkelmann, N.; Skinner, A.; Ward, D.; Zoi, K.; Ernst, T.; Stegelmann, F.; Döhner, K.; et al. Inactivation of polycomb repressive complex 2 components in myeloproliferative and myelodysplastic/myeloproliferative neoplasms. Blood 2012, 119, 1208–1213. [Google Scholar] [CrossRef] [PubMed] [Green Version]
  57. Su, C.-L.; Deng, T.-R.; Shang, Z.; Xiao, Y. JARID2 inhibits leukemia cell proliferation by regulating CCND1 expression. Int. J. Hematol. 2015, 102, 76–85. [Google Scholar] [CrossRef]
  58. Puda, A.; Milosevic, J.D.; Berg, T.; Klampfl, T.; Harutyunyan, A.S.; Gisslinger, B.; Rumi, E.; Pietra, D.; Malcovati, L.; Elena, C.; et al. Frequent deletions of JARID2 in leukemic transformation of chronic myeloid malignancies. Am. J. Hematol. 2012, 87, 245–250. [Google Scholar] [CrossRef]
  59. Ueda, T.; Nakata, Y.; Nagamachi, A.; Yamasaki, N.; Kanai, A.; Sera, Y.; Sasaki, M.; Matsui, H.; Honda, Z.; Oda, H.; et al. Propagation of trimethylated H3K27 regulated by polycomb protein EED is required for embryogenesis, hematopoietic maintenance, and tumor suppression. Proc. Natl. Acad. Sci. USA 2016, 113, 10370–10375. [Google Scholar] [CrossRef]
  60. Klymenko, T.; Papp, B.; Fischle, W.; Köcher, T.; Schelder, M.; Fritsch, C.; Wild, B.; Wilm, M.; Müller, J. A Polycomb group protein complex with sequence-specific DNA-binding and selective methyl-lysine-binding activities. Genes Dev. 2006, 20, 1110–1122. [Google Scholar] [CrossRef] [Green Version]
  61. Brown, J.L.; Mucci, D.; Whiteley, M.; Dirksen, M.L.; Kassis, J.A. The Drosophila Polycomb group gene pleiohomeotic encodes a DNA binding protein with homology to the transcription factor YY1. Mol. Cell 1998, 1, 1057–1064. [Google Scholar] [CrossRef]
  62. Atchison, L.; Ghias, A.; Wilkinson, F.; Bonini, N.; Atchison, M.L. Transcription factor YY1 functions as a PcG protein in vivo. EMBO J. 2003, 22, 1347–1358. [Google Scholar] [CrossRef] [PubMed]
  63. Wang, L.; Brown, J.L.; Cao, R.; Zhang, Y.; Kassis, J.A.; Jones, R.S. Hierarchical recruitment of polycomb group silencing complexes. Mol. Cell 2004, 14, 637–646. [Google Scholar] [CrossRef]
  64. Woo, C.J.; Kharchenko, P.V.; Daheron, L.; Park, P.J.; Kingston, R.E. A region of the human HOXD cluster that confers polycomb-group responsiveness. Cell 2010, 140, 99–110. [Google Scholar] [CrossRef] [PubMed] [Green Version]
  65. Wilkinson, F.H.; Park, K.; Atchison, M.L. Polycomb recruitment to DNA in vivo by the YY1 REPO domain. Proc. Natl. Acad. Sci. USA 2006, 103, 19296–19301. [Google Scholar] [CrossRef]
  66. Caretti, G.; Di Padova, M.; Micales, B.; Lyons, G.E.; Sartorelli, V. The Polycomb Ezh2 methyltransferase regulates muscle gene expression and skeletal muscle differentiation. Genes Dev. 2004, 18, 2627–2638. [Google Scholar] [CrossRef] [PubMed] [Green Version]
  67. Yi, C.; Li, G.; Wang, W.; Sun, Y.; Zhang, Y.; Zhong, C.; Stovall, D.B.; Li, D.; Shi, J.; Sui, G.; et al. Disruption of YY1-EZH2 Interaction Using Synthetic Peptides Inhibits Breast Cancer Development. Cancers 2021, 13, 2402. [Google Scholar] [CrossRef]
  68. Kim, S.Y.; Paylor, S.W.; Magnuson, T.; Schumacher, A. Juxtaposed Polycomb complexes co-regulate vertebral identity. Development 2006, 133, 4957–4968. [Google Scholar] [CrossRef] [Green Version]
  69. Yao, Y.L.; Yang, W.M.; Seto, E. Regulation of transcription factor YY1 by acetylation and deacetylation. Mol. Cell Biol. 2001, 21, 5979–5991. [Google Scholar] [CrossRef] [Green Version]
  70. Seto, E.; Lewis, B.; Shenk, T. Interaction between transcription factors Sp1 and YY1. Nature 1993, 365, 462–464. [Google Scholar] [CrossRef]
  71. Shrivastava, A.; Saleque, S.; Kalpana, G.V.; Artandi, S.; Goff, S.P.; Calame, K. Inhibition of transcriptional regulator Yin-Yang-1 by association with c-Myc. Science 1993, 262, 1889–1892. [Google Scholar] [CrossRef] [PubMed]
  72. Morales-Rosado, J.A.; Kaiwar, C.; Smith, B.E.; Klee, E.W.; Dhamija, R. A case of YY1-associated syndromic learning disability or Gabriele-de vries syndrome with myasthenia gravis. Am. J. Med. Genet. A 2018, 176, 2846–2849. [Google Scholar] [CrossRef]
  73. Gabriele, M.; Vulto-van Silfhout, A.T.; Germain, P.L.; Vitriolo, A.; Kumar, R.; Douglas, E.; Haan, E.; Kosaki, K.; Takenouchi, T.; Rauch, A.; et al. YY1 Haploinsufficiency Causes an Intellectual Disability Syndrome Featuring Transcriptional and Chromatin Dysfunction. Am. J. Hum. Genet. 2017, 100, 907–925. [Google Scholar] [CrossRef] [Green Version]
  74. Aubry, S.; Shin, W.; Crary, J.F.; Lefort, R.; Qureshi, Y.H.; Lefebvre, C.; Califano, A.; Shelanski, M.L. Assembly and interrogation of Alzheimer’s disease genetic networks reveal novel regulators of progression. PLoS ONE 2015, 10, e0120352. [Google Scholar] [CrossRef] [Green Version]
  75. Pal, R.; Tiwari, P.C.; Nath, R.; Pant, K.K. Role of neuroinflammation and latent transcription factors in pathogenesis of Parkinson’s disease. Neurol. Res. 2016, 38, 1111–1122. [Google Scholar] [CrossRef] [PubMed]
  76. Meliala, I.T.S.; Hosea, R.; Kasim, V.; Wu, S. The biological implications of Yin Yang 1 in the hallmarks of cancer. Theranostics 2020, 10, 4183–4200. [Google Scholar] [CrossRef] [PubMed]
  77. Varum, S.; Baggiolini, A.; Zurkirchen, L.; Atak, Z.K.; Cantù, C.; Marzorati, E.; Bossart, R.; Wouters, J.; Häusel, J.; Tuncer, E.; et al. Yin Yang 1 Orchestrates a Metabolic Program Required for Both Neural Crest Development and Melanoma Formation. Cell Stem Cell 2019, 24, 637–653. [Google Scholar] [CrossRef] [PubMed] [Green Version]
  78. Gao, Y.; Sun, L.; Wu, Z.; Xuan, C.; Zhang, J.; You, Y.; Chen, X. miR218 inhibits the proliferation of human glioma cells through downregulation of Yin Yang 1. Mol. Med. Rep. 2018, 17, 1926–1932. [Google Scholar]
  79. Li, H.; Li, T.; Huang, D.; Zhang, P. Long noncoding RNA SNHG17 induced by YY1 facilitates the glioma progression through targeting miR-506- 3p/CTNNB1 axis to activate Wnt/beta-catenin signaling pathway. Cancer Cell Int. 2020, 20, 29. [Google Scholar] [CrossRef] [Green Version]
  80. Galloway, N.R.; Ball, K.F.; Stiff, T.; Wall, N.R. Yin Yang 1 (YY1): Regulation of Survivin and Its Role in Invasion and Metastasis. Crit. Rev. Oncog. 2017, 22, 23–36. [Google Scholar] [CrossRef]
  81. Kaufhold, S.; Garban, H.; Bonavida, B. Yin Yang 1 is associated with cancer stem cell transcription factors (SOX2, OCT4, BMI1) and clinical implication. J. Exp. Clin. Cancer Res. 2016, 35, 84. [Google Scholar] [CrossRef] [PubMed] [Green Version]
  82. Petkova, V.; Romanowski, M.J.; Sulijoadikusumo, I.; Rohne, D.; Kang, P.; Shenk, T.; Usheva, A. Interaction between YY1 and the retinoblastoma protein. Regulation of cell cycle progression in differentiated cells. J. Biol. Chem. 2001, 276, 7932–7936. [Google Scholar] [CrossRef] [PubMed] [Green Version]
  83. Sui, G.; Affarel, B.; Shi, Y.; Brignone, C.; Wall, N.R.; Yin, P.; Donohoe, M.; Luke, M.P.; Calvo, D.; Grossman, S.R.; et al. Yin Yang 1 is a negative regulator of p53. Cell 2004, 117, 859–872. [Google Scholar] [CrossRef] [Green Version]
  84. Feng, Y.; Wang, X.; Xu, L.; Pan, H.; Zhu, S.; Liang, Q.; Huang, B.; Lu, J. The transcription factor ZBP-89 suppresses p16 expression through a histone modification mechanism to affect cell senescence. FEBS J. 2009, 276, 4197–4206. [Google Scholar] [CrossRef] [PubMed]
  85. Riggs, K.J.; Saleque, S.; Wong, K.K.; Merrell, K.T.; Lee, J.S.; Shi, Y.; Calame, K. Yin-yang 1 activates the c-myc promoter. Mol. Cell Biol. 1993, 13, 7487–7495. [Google Scholar] [PubMed] [Green Version]
  86. Pan, X.; Jones, M.; Jiang, J.; Zaprazna, K.; Yu, D.; Pear, W.; Maillard, I.; Atchison, M.L. Increased expression of PcG protein YY1 negatively regulates B cell development while allowing accumulation of myeloid cells and LT-HSC cells. PLoS ONE 2012, 7, e30656. [Google Scholar] [CrossRef] [PubMed] [Green Version]
  87. Lu, Z.; Hong, C.C.; Kong, G.; Assumpção, A.L.F.V.; Ong, I.M.; Bresnick, E.H.; Zhang, J.; Pan, X. Polycomb group protein YY1 is an essential regulator of hematopoietic stem cell quiescence. Cell Rep. 2018, 22, 1545–1559. [Google Scholar] [CrossRef] [Green Version]
  88. Grubach, L.; Juhl-Christensen, C.; Rethmeier Olesen, L.H.; Aggerholm, A.; Hokland, P.; Ostergaard, M. Gene expression profiling of Polycomb, Hox and Meis genes in patients with acute myeloid leukaemia. Eur. J. Haematol. 2008, 81, 112–122. [Google Scholar] [CrossRef]
  89. Erkeland, S.J.; Valkhof, M.; Heijmans-Antonissen, C.; Delwel, R.; Valk, P.J.; Hermans, M.H.; Touw, I.P. The gene encoding the transcriptional regulator Yin Yang 1 (YY1) is a myeloid transforming gene interfering with neutrophilic differentiation. Blood 2003, 101, 1111–1117. [Google Scholar] [CrossRef] [Green Version]
  90. Antonio-Andres, G.; Rangel-Santiago, J.; Tirado-Rodriguez, B.; Martinez-Ruiz, G.U.; Klunder-Klunder, M.; Vega, M.I.; Lopez-Martinez, B.; Jiménez-Hernández, E.; Torres Nava, J.; Medina-Sanson, A.; et al. Role of Yin Yang-1 (YY1) in the transcription regulation of the multi-drug resistance (MDR1) gene. Leuk. Lymphoma. 2018, 59, 2628–2638. [Google Scholar] [CrossRef]
  91. Roboz, G.J.; Mandrekar, S.J.; Desai, P.; Laumann, K.; Walker, A.R.; Wang, E.S.; Kolitz, J.E.; Powell, B.L.; Attar, E.C.; Stock, W.; et al. Randomized trial of 10 days of decitabine ± bortezomib in untreated older patients with AML: CALGB 11002 (Alliance). Blood Adv. 2018, 2, 3608–3617. [Google Scholar] [CrossRef] [PubMed] [Green Version]
  92. Oh, S.; Kim, E. Efficacy of epigenetic agents for older patients with acute myeloid leukemia and myelodysplastic syndrome in randomized controlled trials: A systematic review and network meta-analysis. Clin. Exp. Med. 2023, 1–10. [Google Scholar] [CrossRef]
  93. Hideshima, T.; Chauhan, D.; Richardson, P.; Mitsiades, C.; Mitsiades, N.; Hayashi, T.; Munshi, N.; Dang, L.; Castro, A.; Palombella, V.; et al. NF-kappa B as a therapeutic target in multiple myeloma. J. Biol. Chem. 2002, 10, 16639–16647. [Google Scholar] [CrossRef] [PubMed] [Green Version]
  94. Guzman, M.L.; Neering, S.J.; Upchurch, D.; Grimes, B.; Howard, D.S.; Rizzieri, D.A.; Luger, S.M.; Jordan, C.T. Nuclear Factor-KappaB Is Constitutively Activated in Primitive Human Acute Myelogenous Leukemia Cells. Blood 2001, 98, 2301–2307. [Google Scholar] [CrossRef]
  95. Baumgartner, B.; Weber, M.; Quirling, M.; Fischer, C.; Page, S.; Adam, M.; Von Schilling, C.; Waterhouse, C.; Schmid, C.; Neumeier, D.; et al. Increased IkappaB Kinase Activity Is Associated with Activated NF-KappaB in Acute Myeloid Blasts. Leukemia 2002, 16, 2062–2071. [Google Scholar] [CrossRef] [Green Version]
  96. Wang, H.; Hertlein, E.; Bakkar, N.; Sun, H.; Acharyya, S.; Wang, J.; Carathers, M.; Davuluri, R.; Guttridge, D.C. NF-κB regulation of YY1 inhibits skeletal myo-genesis through transcriptional silencing of myofibrillar genes. Mol. Cell Biol. 2007, 27, 4374–4387. [Google Scholar] [CrossRef] [Green Version]
  97. Wang, H.; Garzon, R.; Sun, H.; Ladner, K.J.; Singh, R.; Dahlman, J.; Cheng, A.; Hall, B.M.; Qualman, S.J.; Chandler, D.S.; et al. NF-κB–YY1–miR-29 regulatory circuitry in skeletal myogenesis and rhabdomyosarcoma. Cancer Cell 2008, 14, 369–381. [Google Scholar] [CrossRef] [Green Version]
  98. Pulikkan, J.A.; Tenen, D.G.; Behre, G. C/EBPα deregulation as a paradigm for leukemogenesis. Leukemia 2017, 31, 2279–2285. [Google Scholar] [CrossRef]
  99. Larsen, M.T.; Häger, M.; Glenthøj, A.; Asmar, F.; Clemmensen, S.N.; Mora-Jensen, H.; Borregaard, N.; Cowland, J.B. miRNA-130a regulates C/EBP-ε expression during granulopoiesis. Blood 2014, 123, 1079–1089. [Google Scholar] [CrossRef] [Green Version]
  100. Agrawal, S.; Hofmann, W.K.; Tidow, N.; Ehrich, M.; van den Boom, D.; Koschmieder, S.; Berdel, W.E.; Serve, H.; Müller-Tidow, C. The C/EBPdelta tumor suppressor is silenced by hypermethylation in acute myeloid leukemia. Blood 2007, 109, 3895–3905. [Google Scholar] [CrossRef]
  101. Tolomeo, M.; Grimaudo, S. The “Janus” Role of C/EBPs Family Members in Cancer Progression. Int. J. Mol. Sci. 2020, 21, 4308. [Google Scholar] [CrossRef]
  102. Tasseff, R.; Jensen, H.A.; Congleton, J. An Effective Model of the Retinoic Acid Induced HL-60 Differentiation Program. Sci. Rep. 2017, 7, 14327. [Google Scholar] [CrossRef] [Green Version]
  103. Falini, B.; Mecucci, C.; Tiacci, E.; Alcalay, M.; Rosati, R.; Pasqualucci, L.; La Starza, R.; Diverio, D.; Colombo, E.; Santucci, A.; et al. Cytoplasmic nucleophosmin in acute myelogenous leukemia with a normal karyotype. N. Engl. J. Med. 2005, 352, 254–266. [Google Scholar] [CrossRef]
  104. Huang, M.; Thomas, D.; Li, M.X.; Feng, W.; Chan, S.M.; Majeti, R.; Mitchell, B.S. Role of cysteine 288 in nucleophosmin cytoplasmic mutations: Sensitization to toxicity induced by arsenic trioxide and bortezomib. Leukemia 2013, 27, 1970–1980. [Google Scholar] [CrossRef]
  105. Martelli, M.P.; Gionfriddo, I.; Mezzasoma, F.; Milano, F.; Pierangeli, S.; Mulas, F.; Pacini, R.; Tabarrini, A.; Pettirossi, V.; Rossi, R.; et al. Arsenic trioxide and all-trans retinoic acid target NPM1 mutant oncoprotein levels and induce apoptosis in NPM1-mutated AML cells. Blood 2015, 125, 3455–3465. [Google Scholar] [CrossRef] [PubMed]
  106. Schlenk, R.F.; Dohner, K.; Kneba, M.; Götze, K.; Hartmann, F.; Del Valle, F.; Kirchen, H.; Koller, E.; Fischer, J.T.; Bullinger, L.; et al. Gene mutations and response to treatment with all-trans retinoic acid in elderly patients with acute myeloid leukemia. Results from the AMLSG Trial AML HD98B. Haematologica 2009, 94, 54–60. [Google Scholar] [CrossRef] [PubMed]
  107. Lanotte, M.; Martin-Thouvenin, V.; Najman, S.; Balerini, P.; Valensi, F.; Berger, R. NB4, a maturation inducible cell line with t(15;17) marker isolated from a human acute promyelocytic leukemia (M3). Blood 1991, 77, 1080–1086. [Google Scholar] [CrossRef] [PubMed] [Green Version]
  108. Bonavida, B.; Kaufhold, S. Prognostic significance of YY1 protein expression and mRNA levels by bioinformatics analysis in human cancers: A therapeutic target. Pharmacol. Ther. 2015, 150, 149–168. [Google Scholar]
  109. Yin, Q.; Shen, X.; Xu, H.; Feng, W.; Shi, X.; Ju, S. YY1-induced LncRNA-TUG1 elevates YOD1 to promote cell proliferation and inhibit bortezomib sensitivity in multiple myeloma. Leuk. Lymphoma. 2023, 64, 1–14. [Google Scholar] [CrossRef]
  110. Tameni, A.; Sauta, E.; Mularoni, V.; Torricelli, F.; Manzotti, G.; Inghirami, G.; Bellazzi, R.; Fragliasso, V.; Ciarrocchi, A. The DNA-helicase HELLS drives ALK-ALCL proliferation by the transcriptional control of a cytokinesis-related program. Cell Death Dis. 2021, 12, 130. [Google Scholar] [CrossRef]
  111. Morales-Martinez, M.; Vega, G.G.; Neri, N.; Nambo, M.J.; Alvarado, I.; Cuadra, I.; Duran-Padilla, M.A.; Huerta-Yepez, S.; Vega, M.I. MicroRNA-7 Regulates Migration and Chemoresistance in Non-Hodgkin Lymphoma Cells Through Regulation of KLF4 and YY1. Front. Oncol. 2020, 10, 588893. [Google Scholar] [CrossRef] [PubMed]
  112. Morales-Martinez, M.; Valencia-Hipolito, A.; Vega, G.G.; Neri, N.; Nambo, M.J.; Alvarado, I.; Cuadra, I.; Duran-Padilla, M.A.; Martinez-Maza, O.; Huerta-Yepez, S.; et al. Regulation of Krüppel-Like Factor 4 (KLF4) expression through the transcription factor Yin-Yang 1 (YY1) in non-Hodgkin B-cell lymphoma. Oncotarget 2019, 10, 2173–2188. [Google Scholar] [CrossRef] [PubMed] [Green Version]
  113. Antonio-Andres, G.; Martinez-Ruiz, G.U.; Morales-Martinez, M.; Jiménez-Hernandez, E.; Martinez-Torres, E.; Lopez-Perez, T.V.; Estrada-Abreo, L.A.; Patino-Lopez, G.; Juarez-Mendez, S.; Davila-Borja, V.M.; et al. Transcriptional Regulation of Yin-Yang 1 Expression through the Hypoxia Inducible Factor-1 in Pediatric Acute Lymphoblastic Leukemia. Int. J. Mol. Sci. 2022, 23, 1728. [Google Scholar] [CrossRef] [PubMed]
  114. Marchwicka, A.; Marcinkowska, E. Regulation of Expression of CEBP Genes by Variably Expressed Vitamin D Receptor and Retinoic Acid Receptor α in Human Acute Myeloid Leukemia Cell Lines. Int. J. Mol. Sci. 2018, 19, 1918. [Google Scholar] [CrossRef] [Green Version]
  115. Konopleva, M.; Pollyea, D.A.; Potluri, J.; Chyla, B.; Hogdal, L.; Busman, T.; McKeegan, E.; Salem, A.H.; Zhu, M.; Ricker, J.L.; et al. Efficacy and Biological Correlates of Response in a Phase II Study of Venetoclax Monotherapy in Patients with Acute Myelogenous Leukemia. Cancer Discov. 2016, 6, 1106–1117. [Google Scholar] [CrossRef] [Green Version]
Figure 1. Bortezomib downregulates YY1 expression in patient AML samples. (A) qRT-PCR showing YY1 mRNA relative expression in 24 AML human samples and 5 AML cell lines compared with immature CD34+ and mature CD34- cells. (B) qRT-PCR showing YY1 mRNA relative expression in the acute myeloid leukemia (AML) human sample compared with immature CD34+ and mature CD34- cells, successively treated with Bortezomib (Bor) alone or in association with 1 μM ATRA up to 72 h. (C) qRT-PCR and Western blot showing YY1 mRNA relative expression and protein amount in the AML samples, untreated and Bor- and Bor+ATRA-treated. (D) qRT-PCR and Western blot showing YY1 mRNA relative expression and protein amount of C/EBPε and C/EBPδ in the AML samples, untreated and Bor- and Bor+ATRA-treated. (E) qRT-PCR showing YY1 mRNA relative expression of CD11b and CD14 in the AML samples, untreated and Bor- and Bor+ATRA-treated. In qRT-PCR, the expression levels were normalized to GAPDH levels. Each sample was analyzed in triplicate. Statistical analysis was performed with the nonparametric Mann–Whitney test; * p-value ≤ 0.05; ** p-value ≤ 0.01. Error bars: SD, standard deviation.
Cancers 15 04010 g001
Figure 2. YY1 knockdown in HL-60 and OCI-AML3 cell lines induces expression of HOXA2 and HOXD13. (A) Western blot and quantitative analysis showing YY1 knockdown in HL-60 cells with shRNA. YY1 knockdown was achieved with lentiviral infection of a short hairpin RNA targeting YY1 cloned into a Tet-pLKO.1 puro vector. Infected HL-60 cells were maintained in culture with a low puromycin concentration and treated with doxycycline (300 ng/mL) to induce shRNA expression. sh: HL-60 cells carrying a short hairpin scrambled control sequence; sh-YY1: HL-60 cells carrying a short hairpin RNA targeting YY1; sh-doxy: HL-60 cells treated with doxycycline to induce scrambled shRNA expression; and sh-YY1-doxy: HL-60 cells treated with doxycycline to induce YY1 shRNA expression. (B) qRT-PCR measuring the relative expression of HOXA2 and HOXD13 mRNAs in HL-60 cells with YY1 knockdown. (C) Western blot and quantitative analysis showing YY1 knockdown in the OCI-AML3 cell line with siRNA. YY1 knockdown was achieved with transfection of an siRNA targeting YY1 (siYY1). YY1 expression in siYY1 cells was compared with the expression in OCI-AML3 cells transfected with a control siRNA (siSc-CT) sequence. Cells were collected after 48 h and 96 h following transfection. (D) qRT-PCR measuring the relative expression of HOXA2 and HOXD13 mRNAs in OCI-AML3 cells with YY1 knockdown. ** p-value ≤ 0.01. Error bars: SD, standard deviation.
Cancers 15 04010 g002
Figure 3. YY1 knockdown increases expression of C/EBP family transcription factors. (A) qRT-PCR and Western blots measuring CEBPα, CEBPε, and CEBPδ mRNA and protein expression levels performed in doxycycline-induced HL-60-sh-YY1-doxy cells compared with doxycycline-induced HL-60 control sh-doxy cells. mRNA expression levels were normalized to GAPDH levels and expressed as fold induction relative to the values of the control sh-doxy cells (=1). (B) qRT-PCR and Western blots assessing CEBPα, CEBPε, and CEBPδ expression in OCI-AML3 siYY1 cells compared with OCI-AML3 siSc-CT cells. mRNA expression levels were normalized to GAPDH levels and expressed as fold induction relative to the value of the control cells (=1). Each qRT-PCR amplification was performed in triplicate. Statistical analysis was performed with the nonparametric Mann–Whitney test. ** p-value ≤ 0.01. Error bars: SD, standard deviation.
Cancers 15 04010 g003
Figure 4. YY1 knockdown increases the sensitivity of HL-60 cells to ATRA treatment. (A) Western blot analysis of YY1 protein levels in sh and sh-YY1 cells, induced with doxycycline or not, collected at 24 h and 96 h of ATRA treatment. (B) qRT-PCR and Western blot to quantify C/EBPα in sh-YY1-doxy and control sh-doxy cells treated or untreated with 1 μM ATRA for the indicated time points. (CE) qRT-PCR to quantify C/EBPε, C/EBPδ, and RARα in sh-YY1-doxy and control sh-doxy cells treated or untreated with 1 μM ATRA for the indicated time points. Expression levels were normalized to GAPDH levels and expressed as fold induction to the value for sh-doxy cells (=1). Each qRT-PCR amplification was performed in triplicate. Statistical analysis was performed in triplicate using with the nonparametric Mann–Whitney test. * p value ≤ 0.05; ** p value ≤ 0.01. Error bars: SD, standard deviation.
Cancers 15 04010 g004
Figure 5. YY1 knockdown does not sensitize the OCI-AML3 cell line to ATRA exposure. (A) Western blot analysis of YY1 protein level in siSc-CT and siYY1 cells, treated with ATRA or not, for 96 h. (B) qRT-PCR assessing C/EBPα, C/EBPɛ, and C/EBP-δ mRNA relative expression in siSc-CT and siYY1 cells, treated with ATRA or not, for 96 h. Each qRT-PCR amplification was performed in triplicate. Statistical analysis was performed with the nonparametric Mann–Whitney test. * p-value ≤ 0.05; Error bars: SD, standard deviation.
Cancers 15 04010 g005
Figure 6. YY1 binds 5′ promoter regions of C/EBPα, C/EBPε, C/EBPδ, and RARα genes. Chromatin immunoprecipitation showing the YY1 occupancy at the 5′ promoter regions of C/EBPα, C/EBPε, C/EBPδ, and RARα genes in 1 μM ATRA-treated or -untreated HL-60-YY1-sh-doxy and -sh-YY1-doxy cells. Experiments were conducted with two different preparations of HL-60 cells. Each qRT-PCR amplification was executed in triplicate three times, and the results of the two independent experiments were collected and used for calculation (two different experiments and a total of eighteen measurements for each sample). Rabbit anti-human IgG was used as the immunoprecipitation control. Statistical analyses were performed with the nonparametric Mann–Whitney test. ** p-value ≤ 0.01. Error bars: SD, standard deviation.
Cancers 15 04010 g006
Figure 7. YY1 knockdown induces differentiation immunophenotype in 1 μM ATRA-treated or -untreated HL-60 and OCI-AML3 cells with YY1 knockdown. (A) Flow cytometry plots showing the detection of CD11b and CD14 surface differentiation markers in HL-60-sh-doxy and sh-YY1-doxy cells treated with 1 μM ATRA for 72 h and 96 h. (B) Flow cytometry plots showing the detection of CD11b and CD14 surface differentiation markers in OCI-AML3 siSc-CT and siYY1 cells treated with 1 μM ATRA for 96 h.
Cancers 15 04010 g007
Figure 8. YY1 knockdown promotes expression of surface differentiation markers CD11b and CD14 in HL-60 and OCI-AML3 cells treated or untreated with 1 μM ATRA. (A) Relative mRNA expression of CD11b and CD14 surface differentiation markers in ATRA-untreated HL-60-sh-doxy and sh-doxy-YY1 cells over 96 h at 24 h intervals. (B) Relative mRNA expression of CD11b and CD14 surface differentiation markers in HL-60-sh-doxy and sh-doxy-YY1 cells untreated and treated with 1 μM ATRA over 96 h at 24 h intervals. (C) Relative mRNA expression of CD11b and CD14 surface differentiation markers in OCI-AML3-siSc-CT and siYY1 cells untreated and treated with 1 μM ATRA for 96 h. * p-value ≤ 0.05, ** p-value ≤ 0.01.
Cancers 15 04010 g008
Figure 9. YY1 knockdown induces differentiation morphology in 1 μM ATRA-treated or -untreated HL-60 and OCI-AML3 cells with YY1 knockdown. (A) Wright-Giemsa staining of HL-60-sh-doxy and sh-YY1-doxy cells treated and untreated with 1 μM ATRA for 72 h and 96 h. (B) Wright-Giemsa staining of siSc-CT and siYY1 cells treated or untreated with 1 μM ATRA for 96 h. (C) Table showing the percentage of blasts, myelocytes, metamyelocytes, band cells, and segmented neutrophils in HL-60-sh-doxy and sh-YY1 doxy, in OCI-AML3-siSC-CT and siYY1 cells treated or untreated with ATRA 1μM at indicated time points (50 cells analyzed per field).
Cancers 15 04010 g009
Figure 10. YY1 knockdown induces apoptosis in HL-60 cells. (A) Flow cytometry plots showing Annexin V and propidium iodide (PI) double staining in HL-60-sh-doxy (control) and sh-doxy-YY1 cells untreated and treated with 1 μM ATRA for 72 h and 96 h. (B) Western blots detecting PARP1, BAX, and caspase 3 protein levels in HL-60-sh-doxy (control) and HL-60-YY1 sh-YY1-doxy cells.
Cancers 15 04010 g010
Figure 11. YY1 knockdown induces apoptosis in OCI-AML3 cells. (A) Flow cytometry plots showing Annexin V and Live/Dead double staining in OCI-AML3-siSc-CT (control) and siYY1 cells untreated and treated with 1 μM ATRA for 96 h. (B) Western blots detecting PARP1 and caspase 3 protein levels in OCI-AML3 siSc-CT (control) and siYY1 cells untreated and treated with ATRA 1 μM for 96 h.
Cancers 15 04010 g011
Disclaimer/Publisher’s Note: The statements, opinions and data contained in all publications are solely those of the individual author(s) and contributor(s) and not of MDPI and/or the editor(s). MDPI and/or the editor(s) disclaim responsibility for any injury to people or property resulting from any ideas, methods, instructions or products referred to in the content.

