
KLF4 Induces Mesenchymal–Epithelial Transition (MET) by Suppressing Multiple EMT-Inducing Transcription Factors

 , , , and
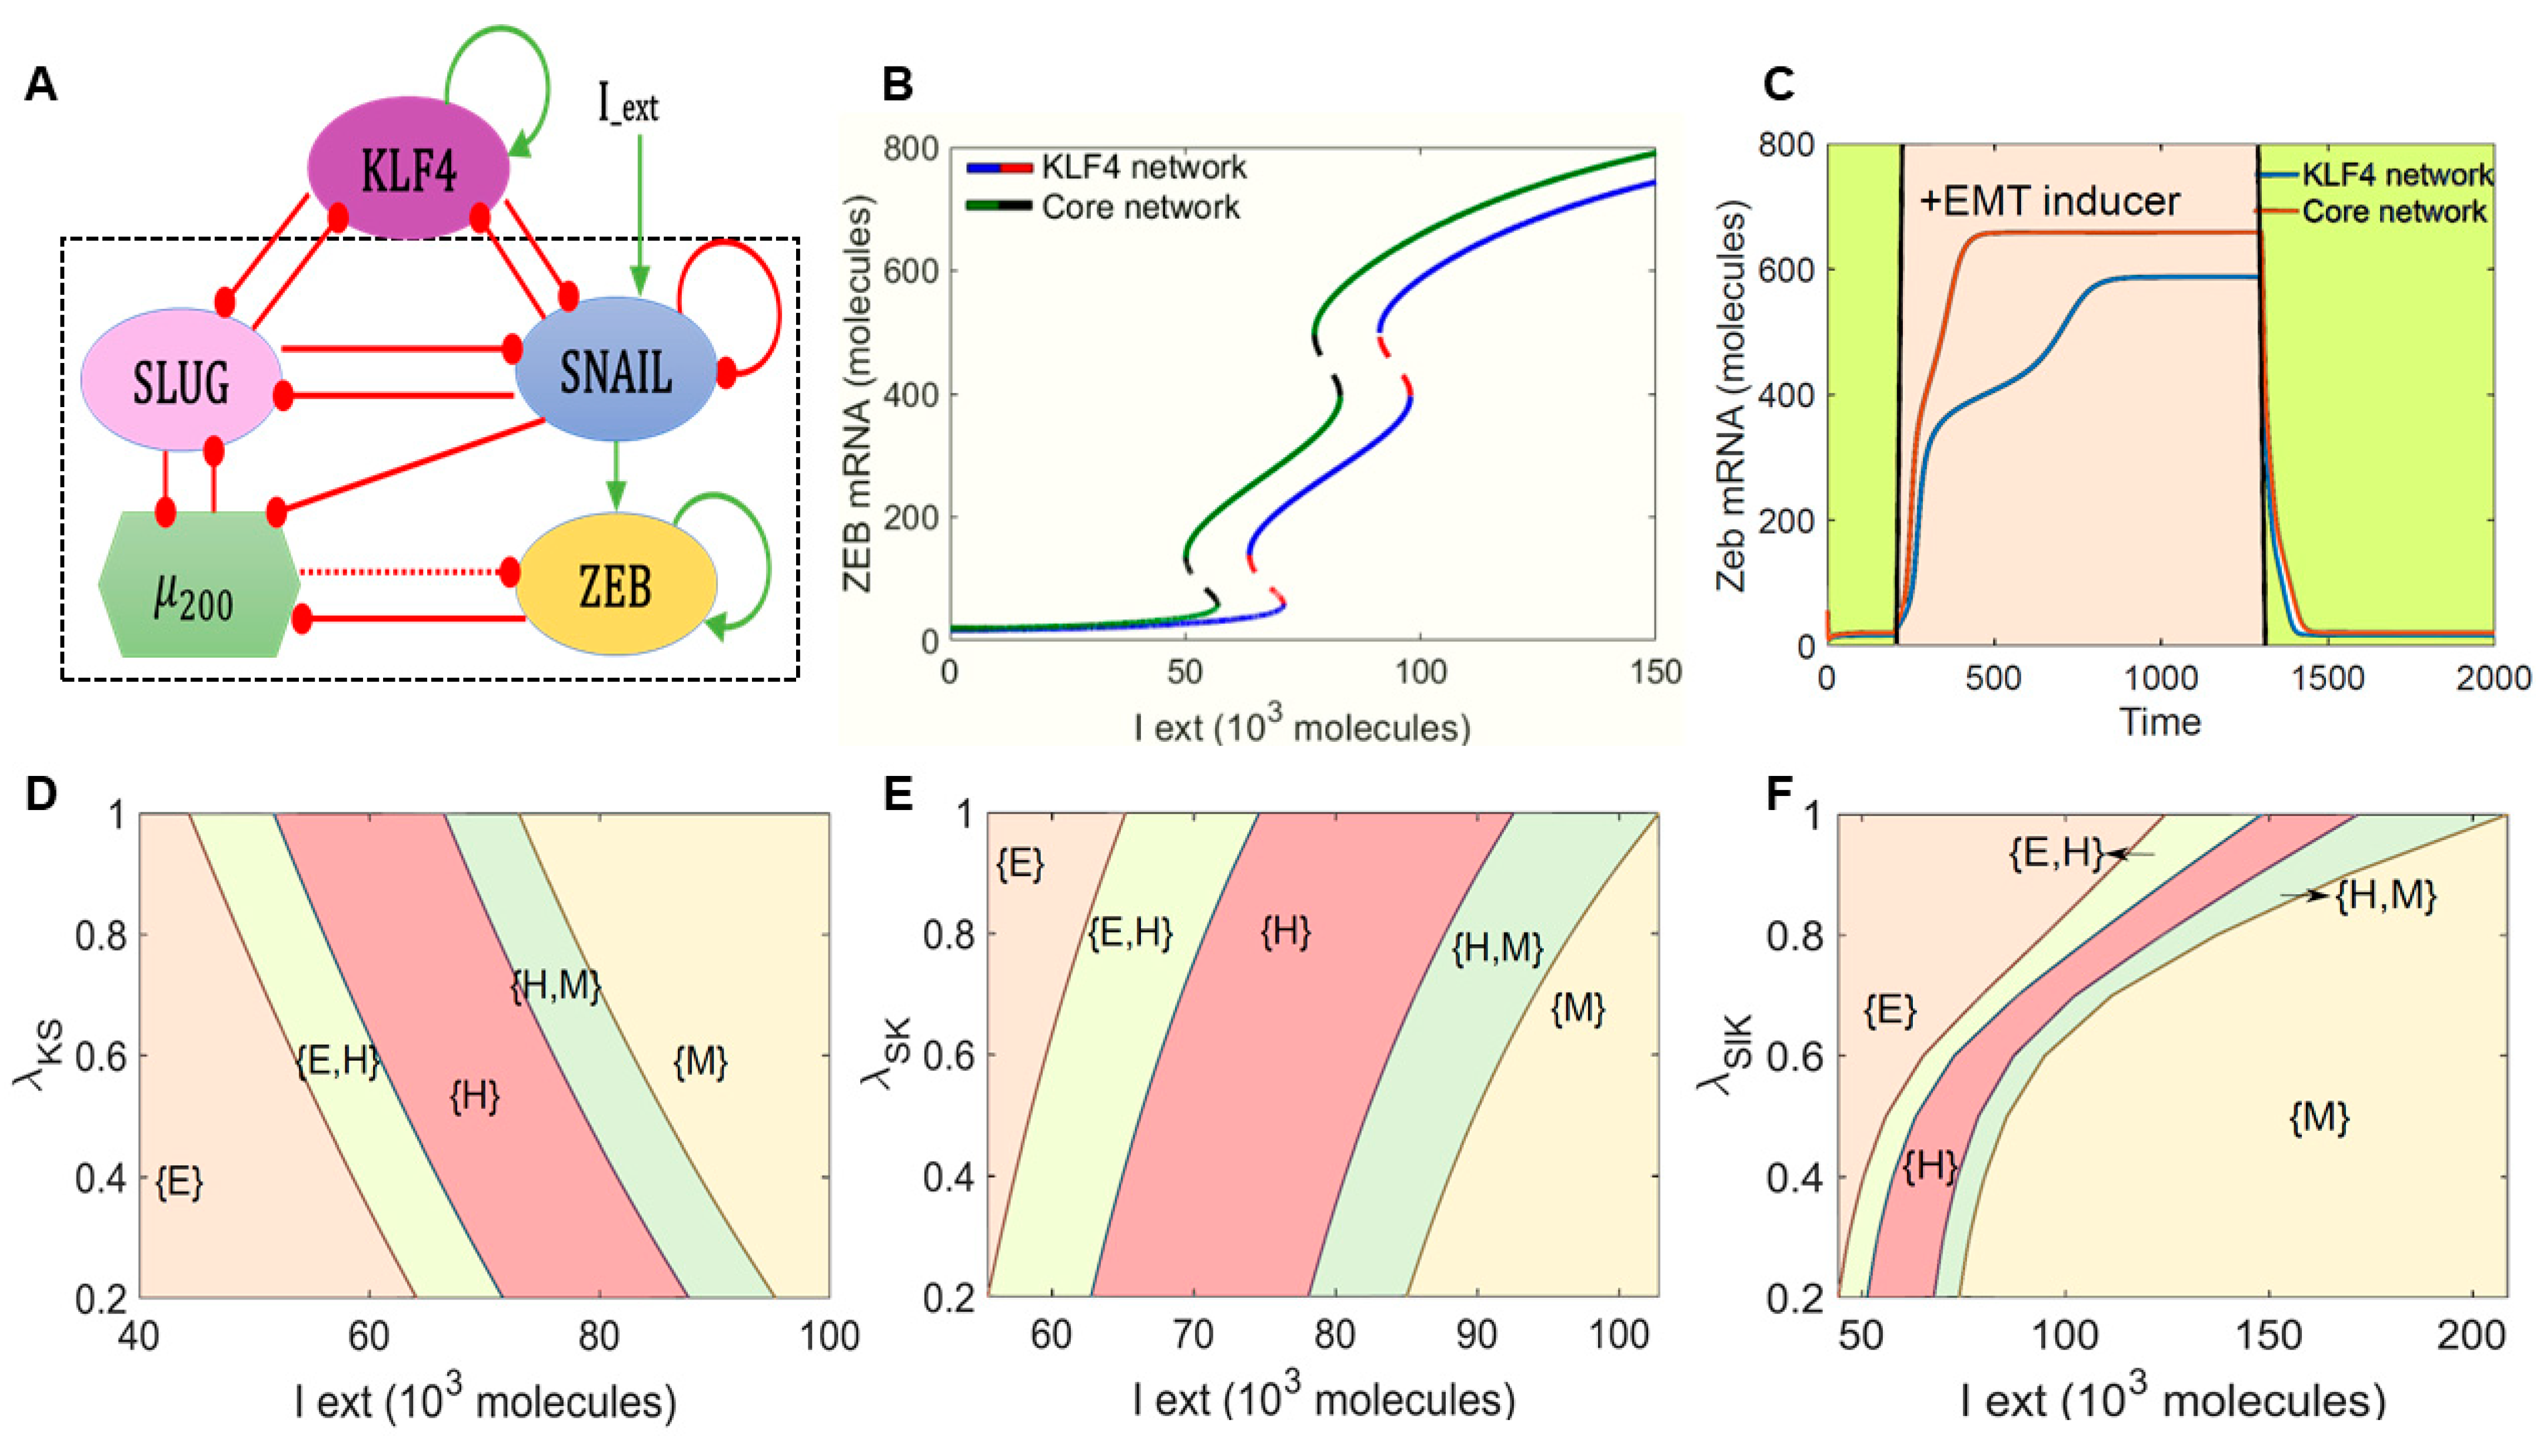
Abstract
:Simple Summary
Abstract
1. Introduction
2. Results
2.1. KLF4 Inhibits the Progression of EMT
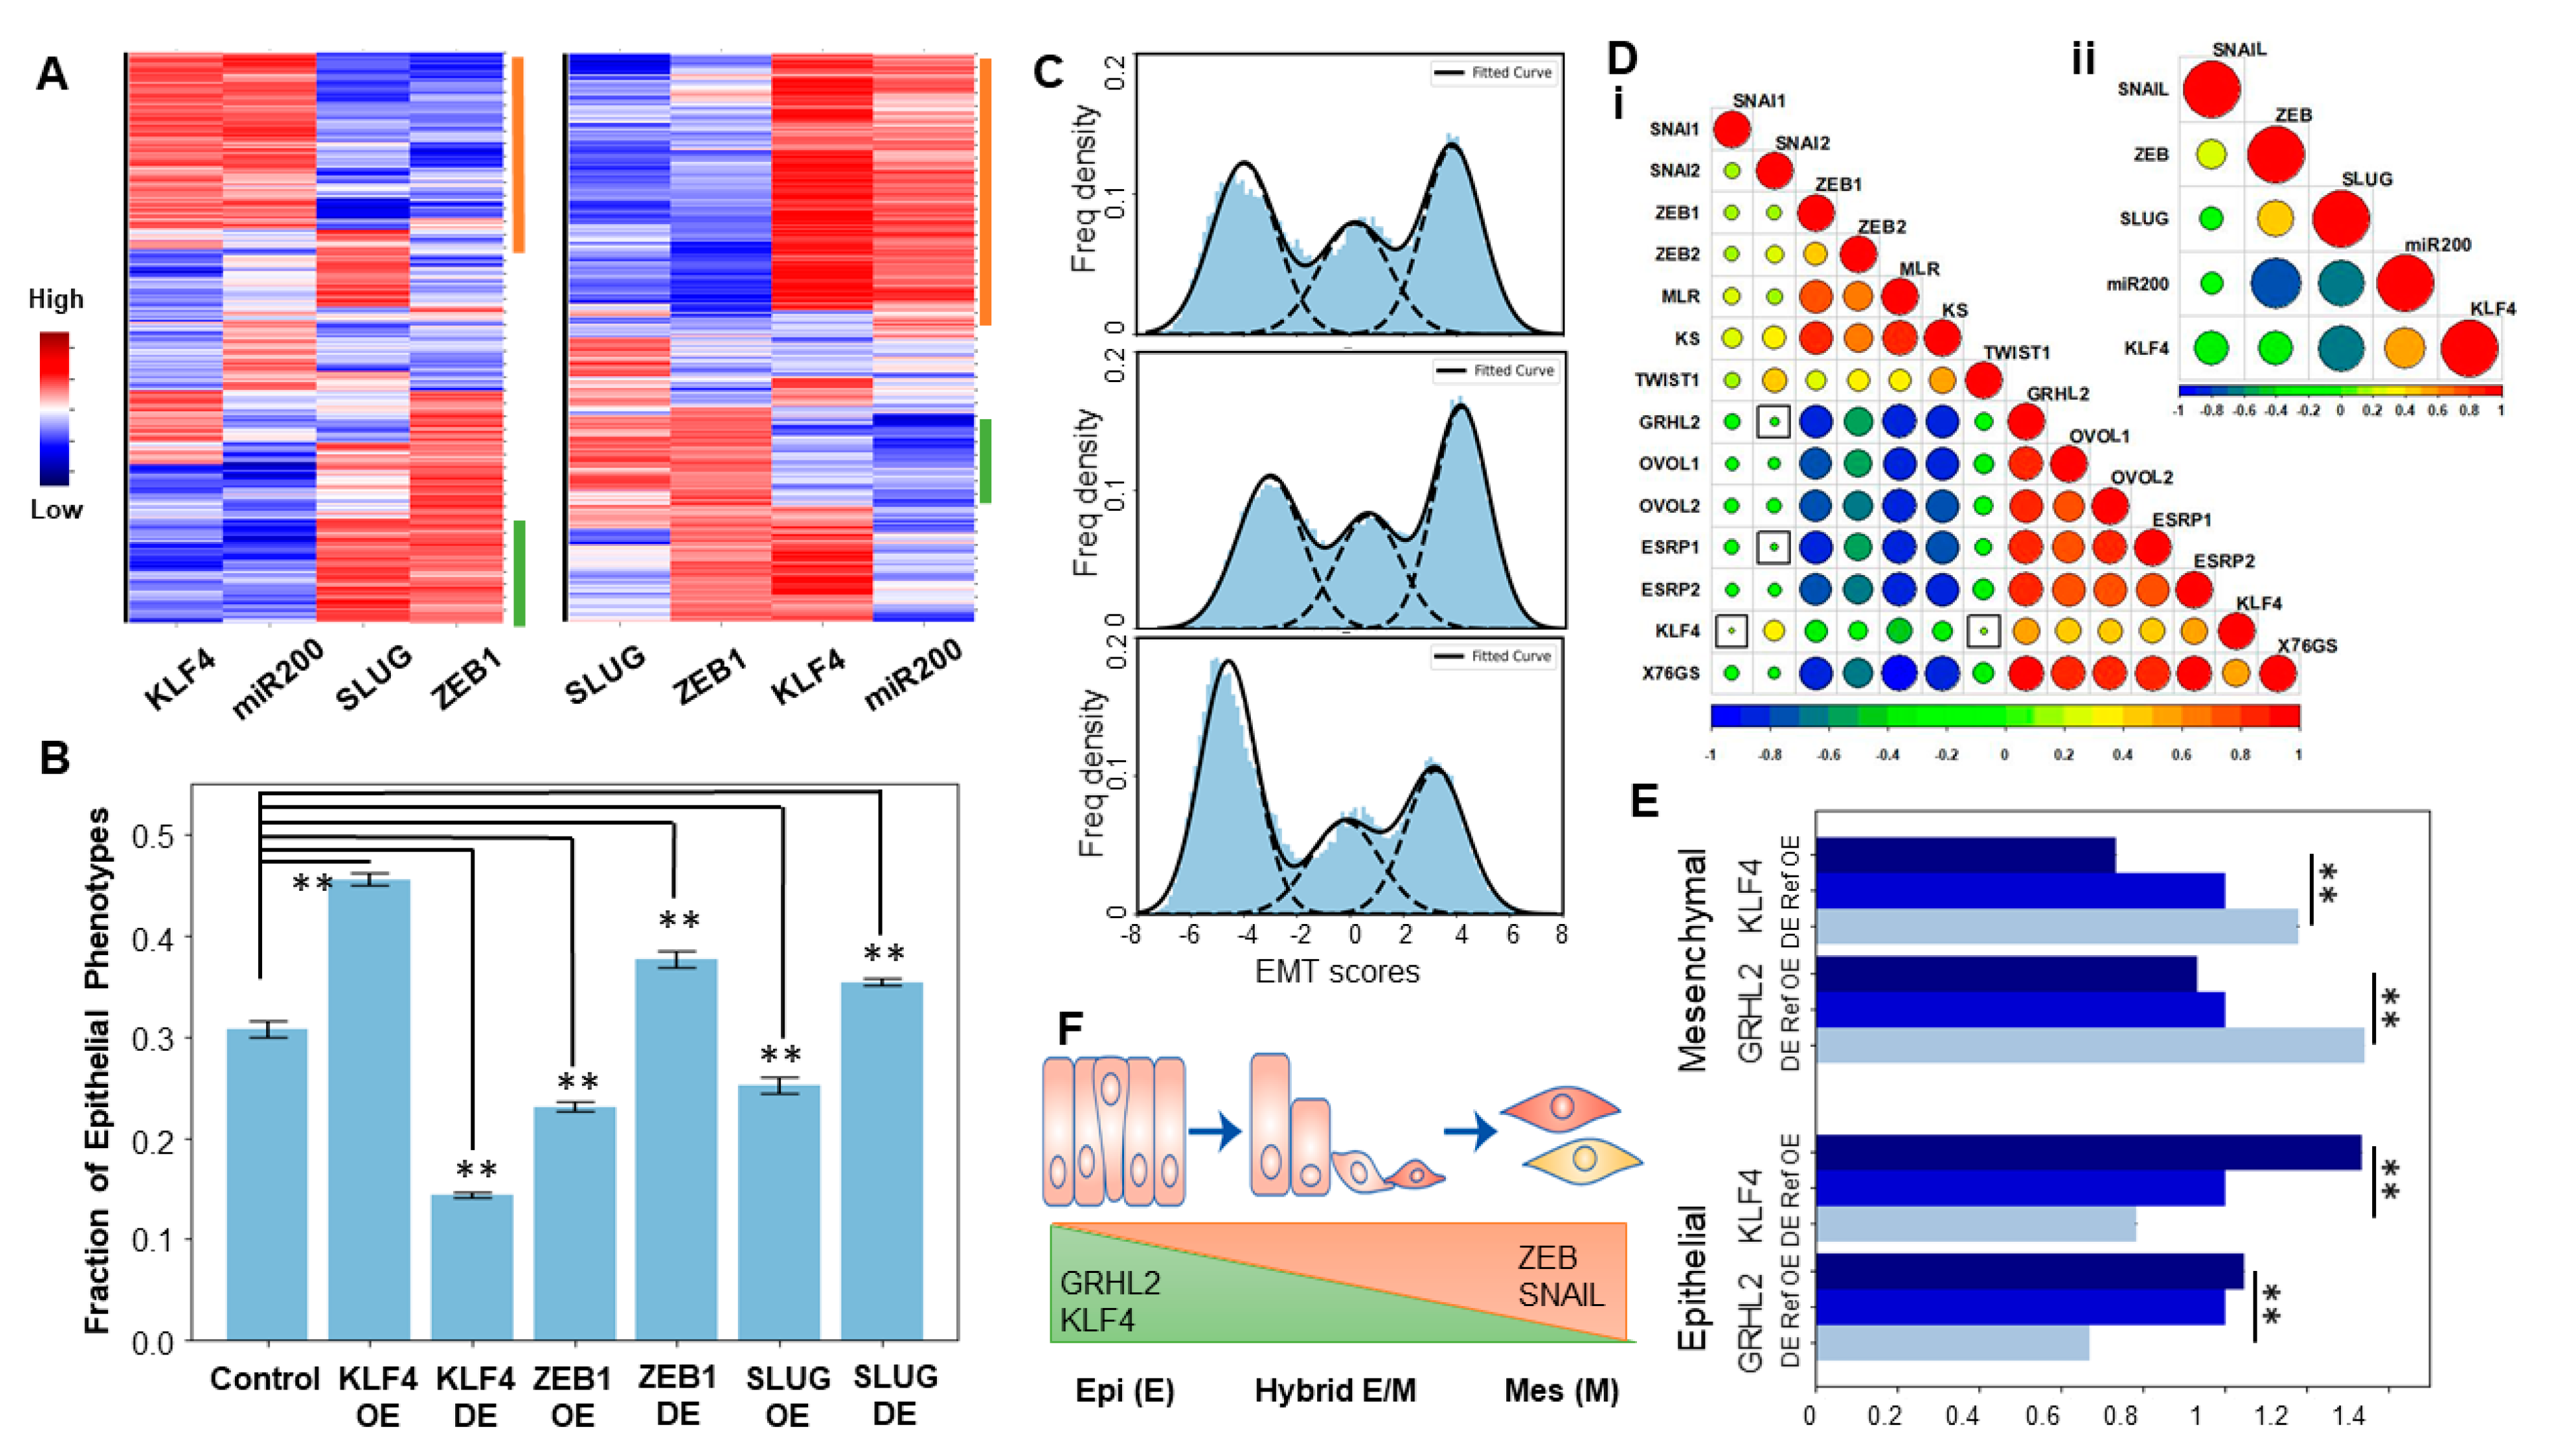
2.2. KLF4 Promotes an Epithelial Phenotype
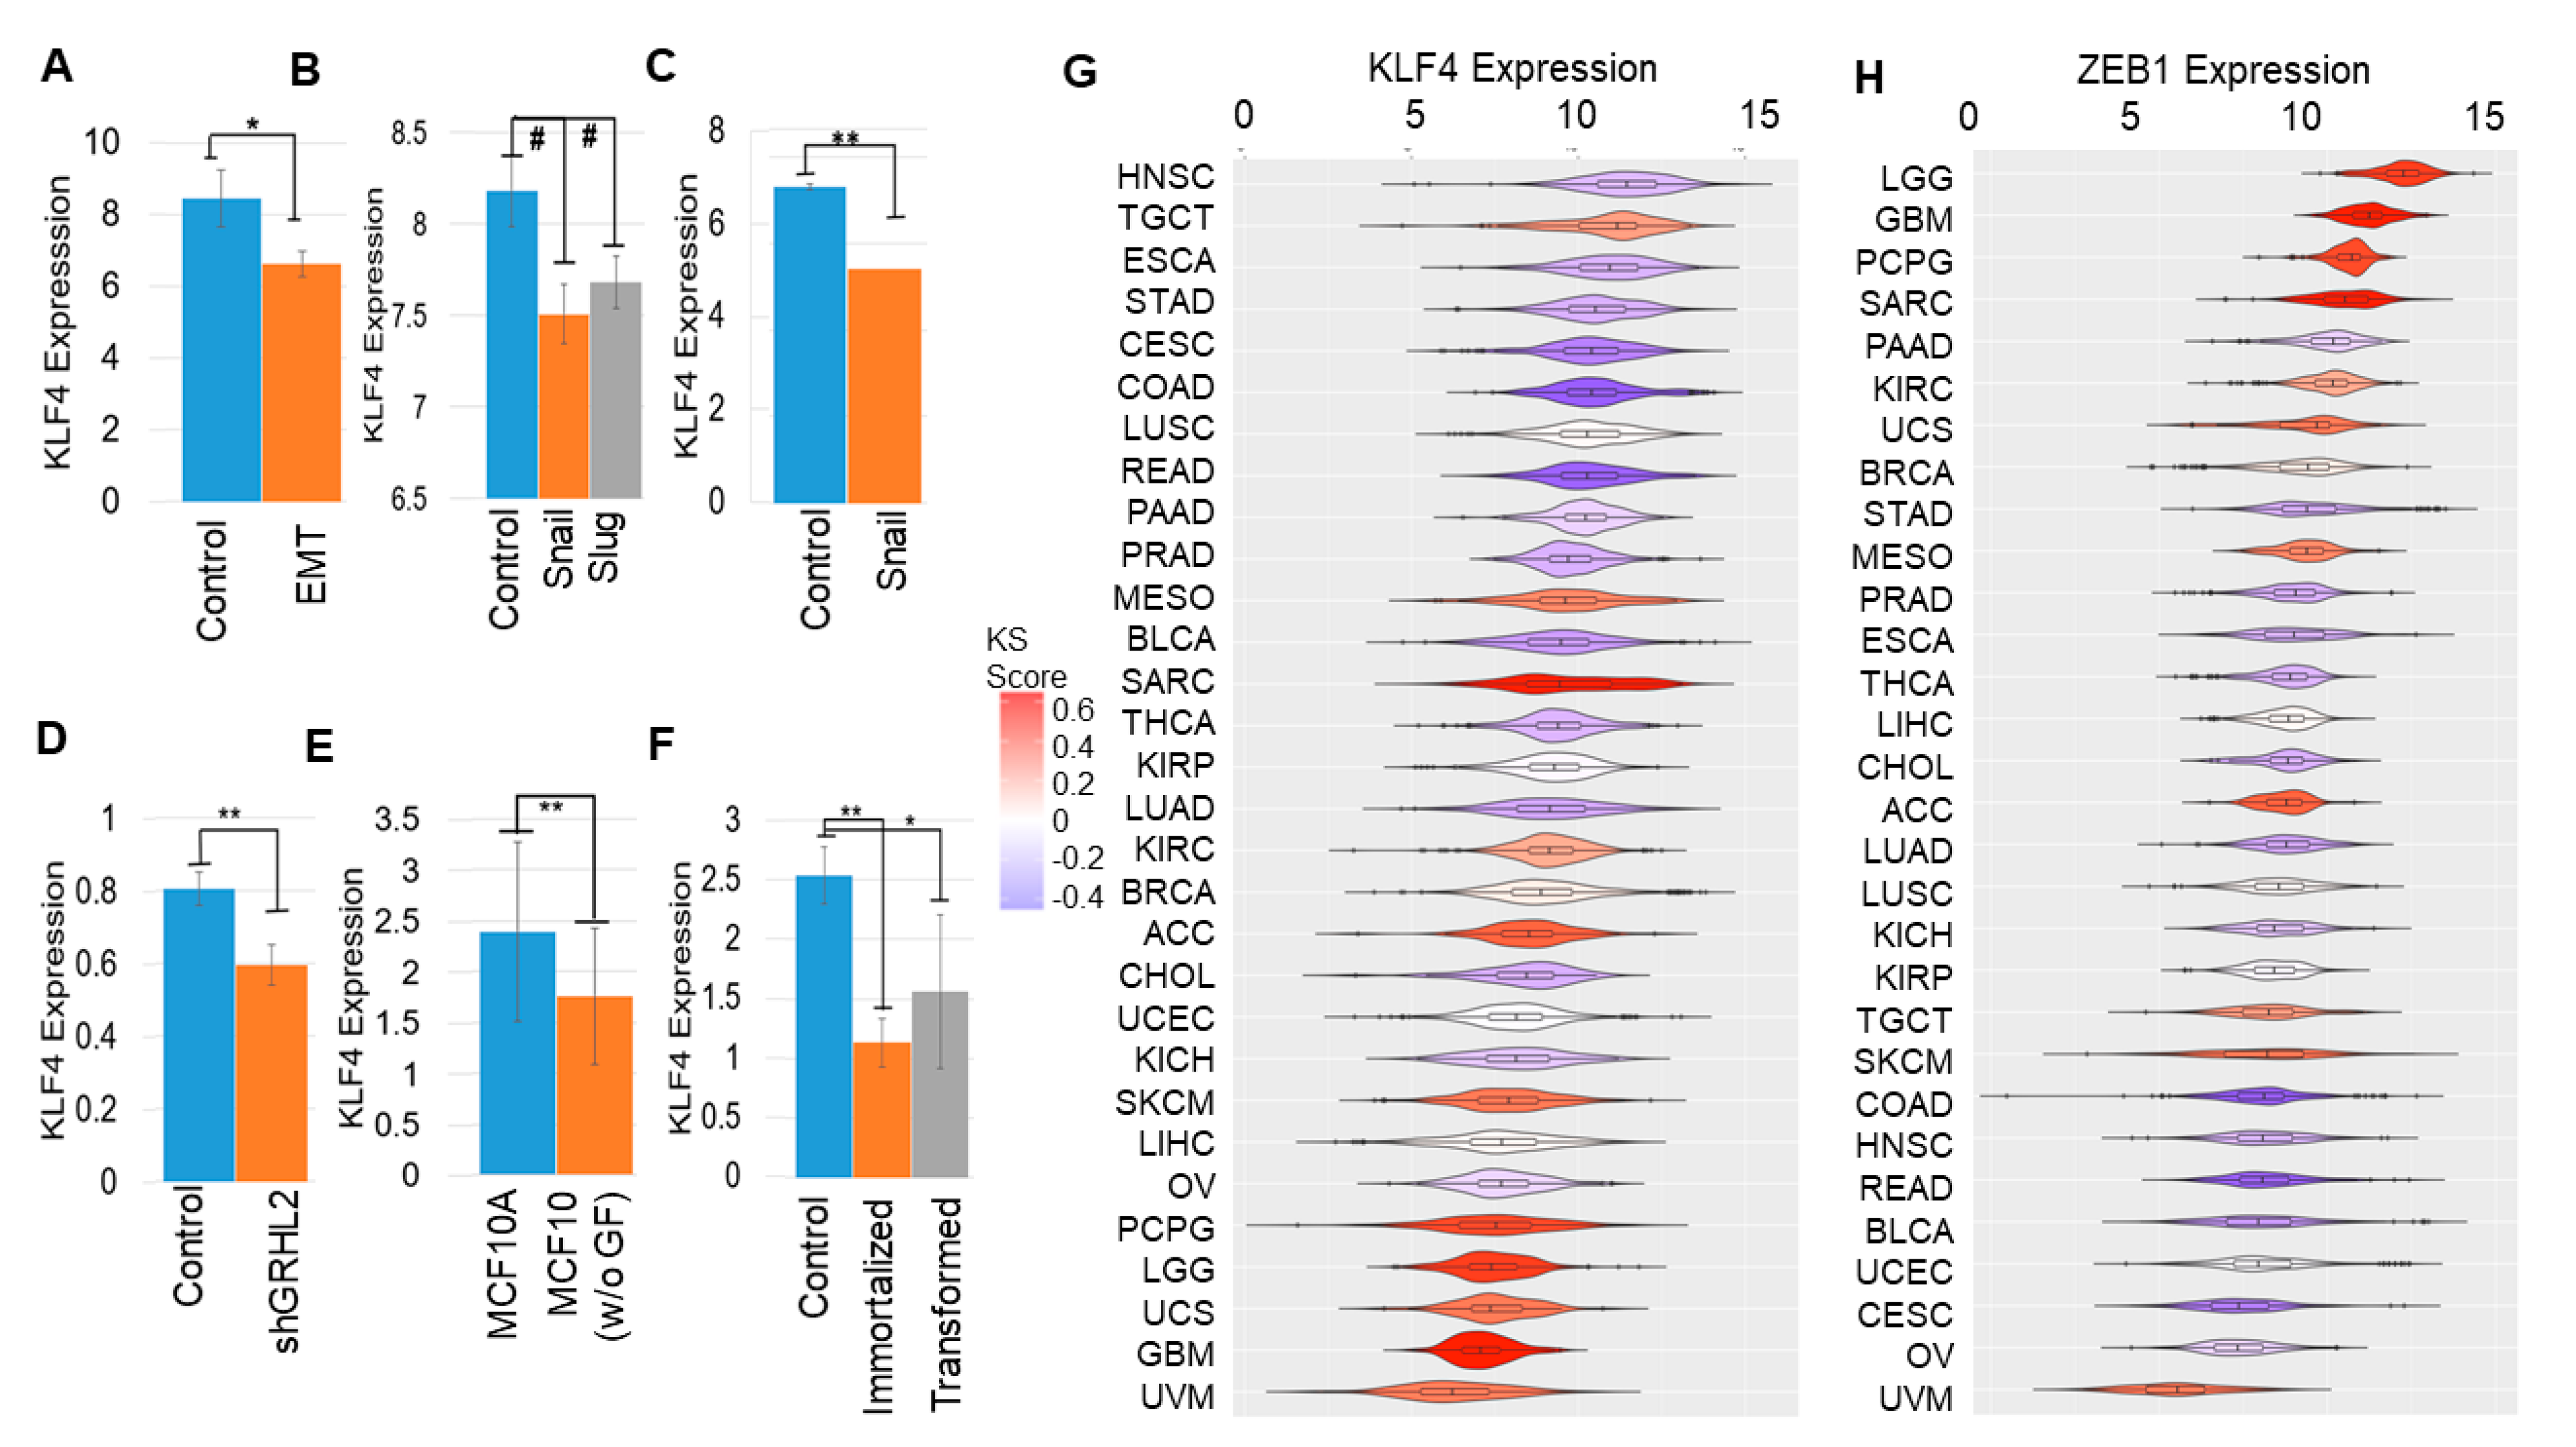
2.3. KLF4 Is Inhibited during EMT
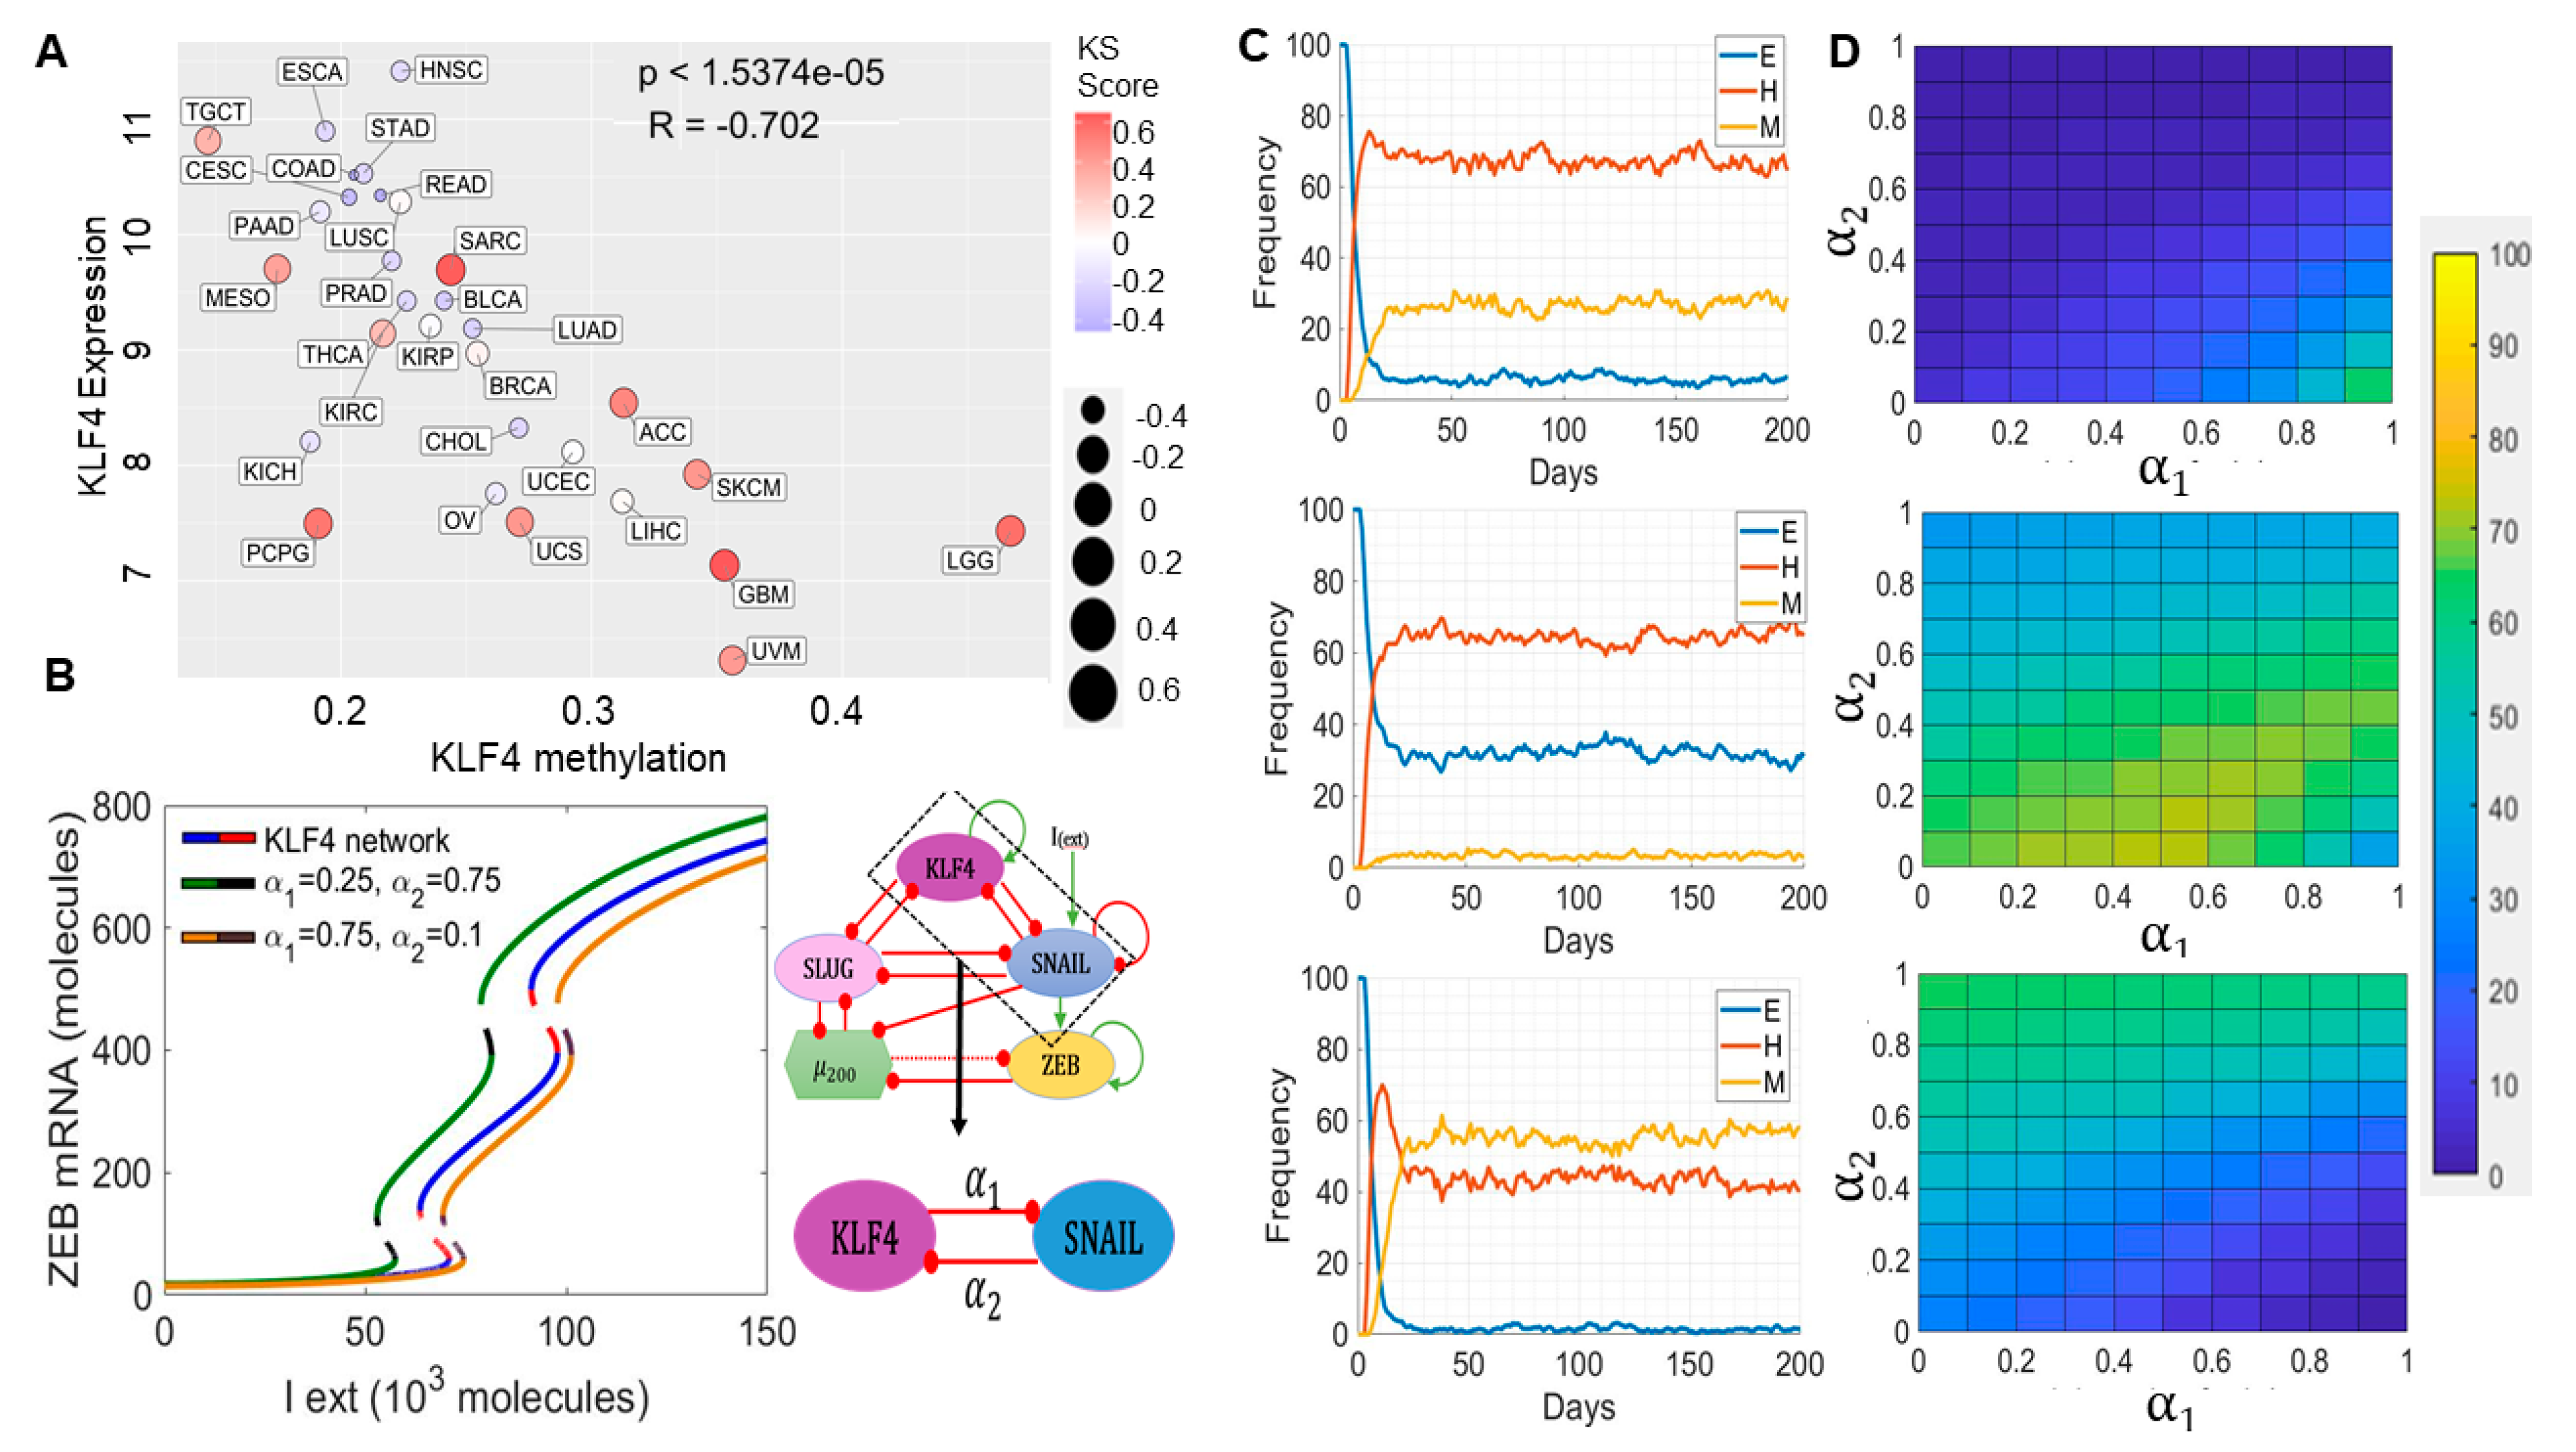
2.4. Epigenetic Changes, including KLF4 Promoter Methylation, Can Alter Population Distributions along the EMT Spectrum
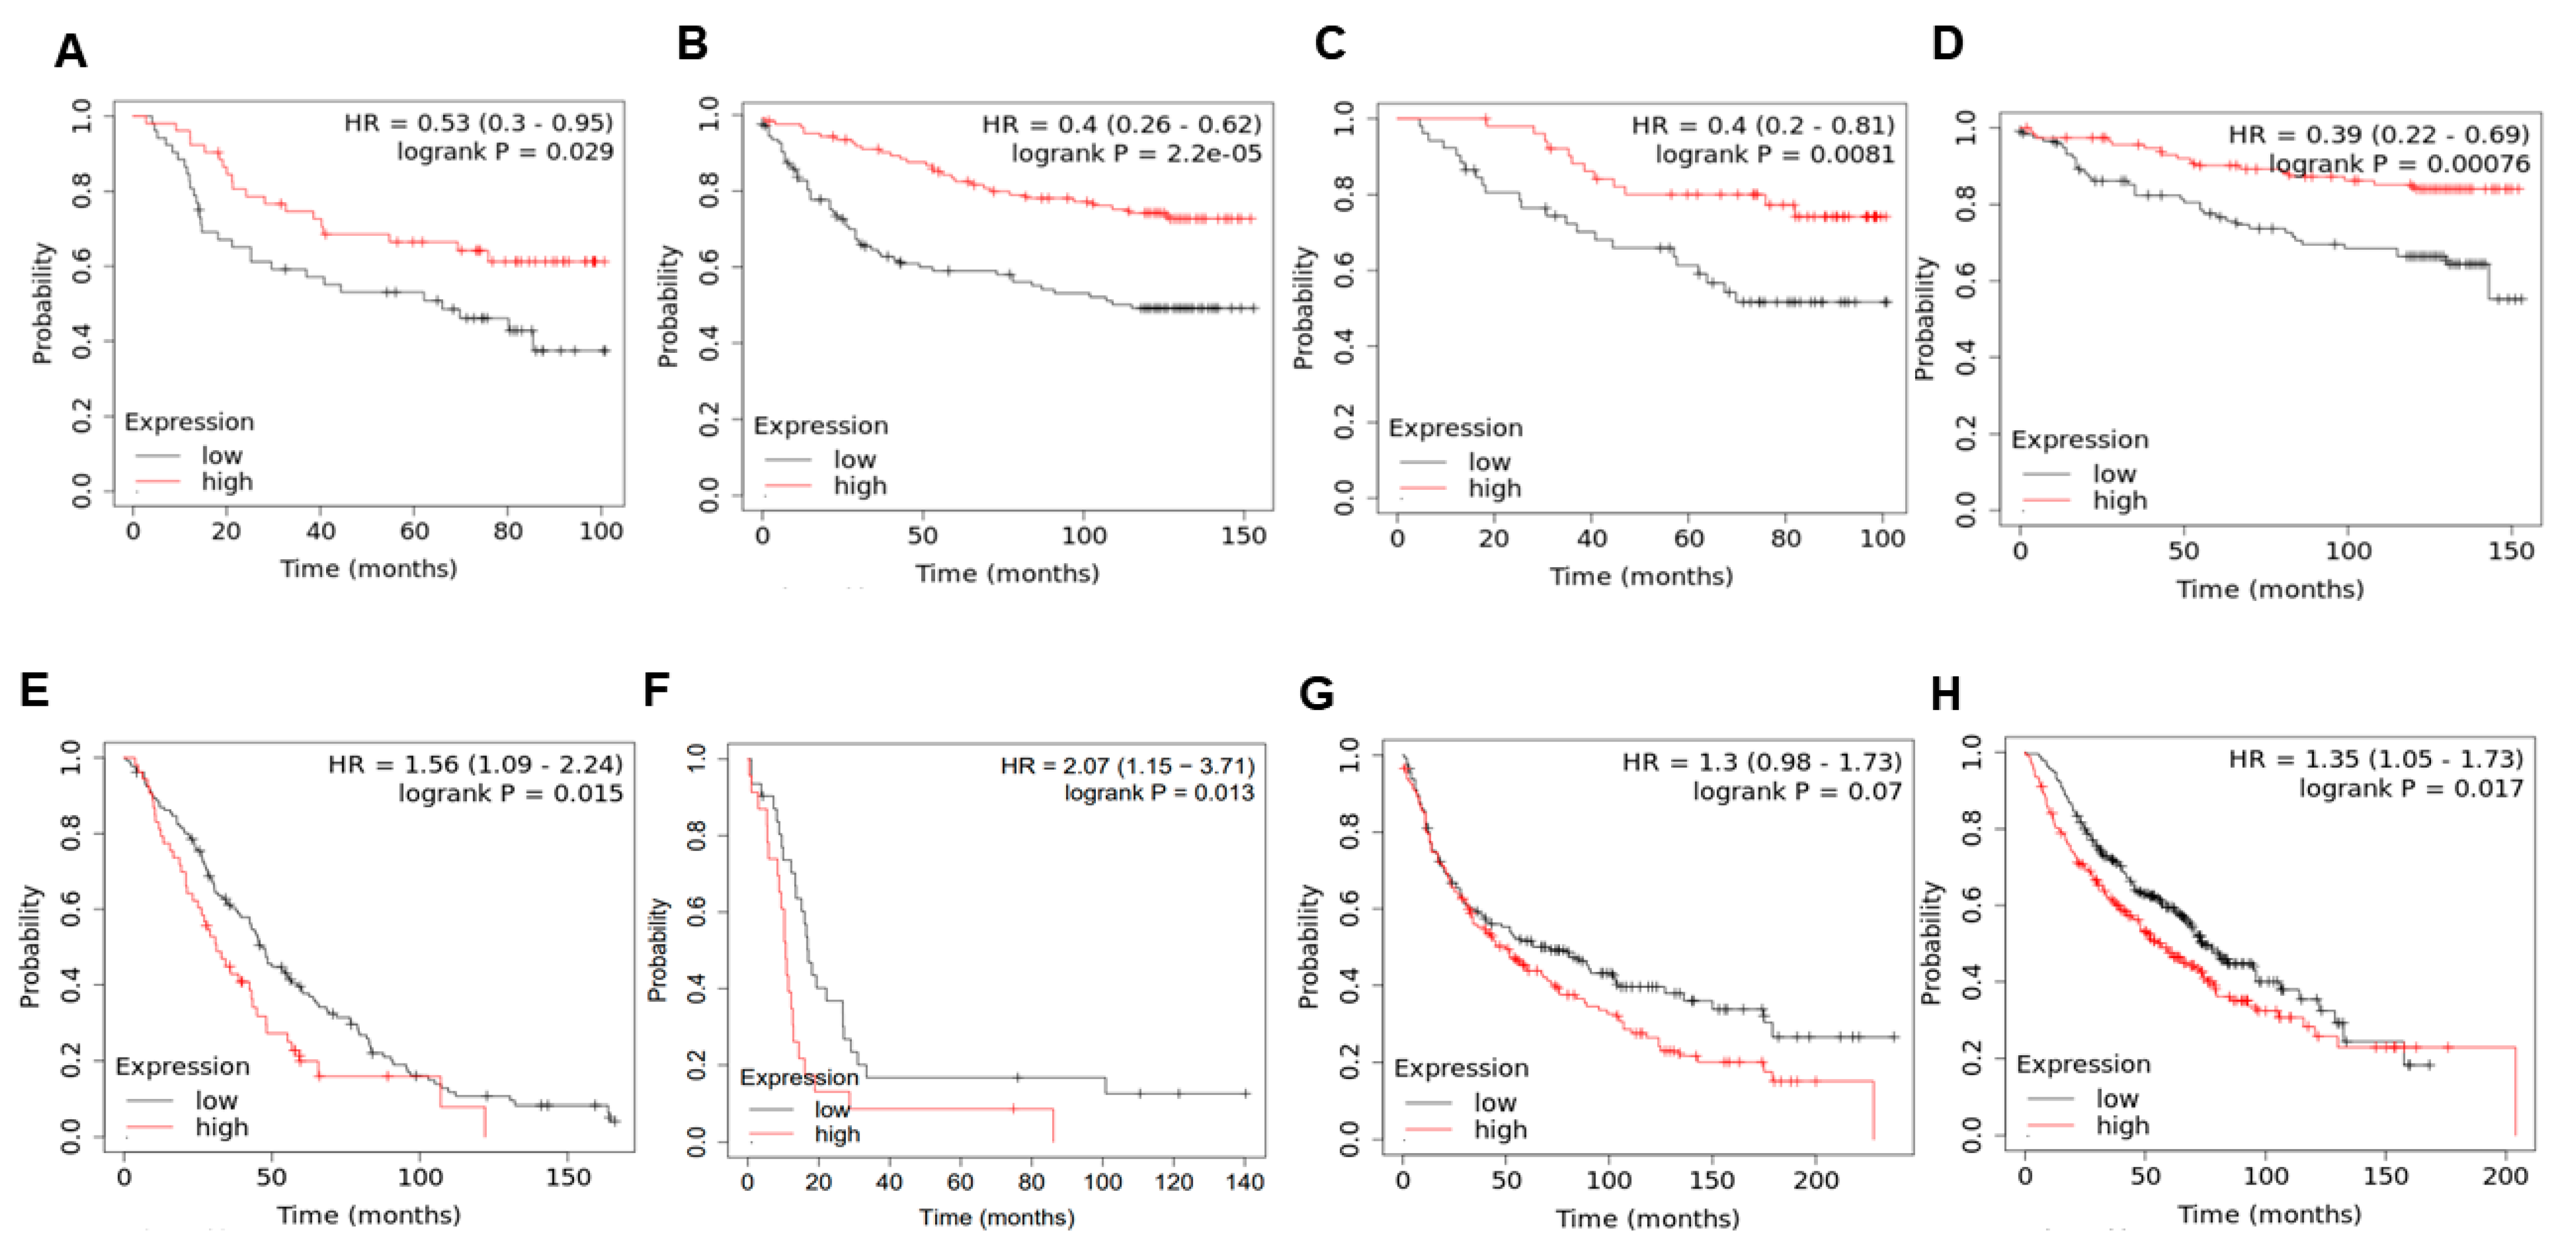
2.5. KLF4 Correlates with Patient Survival
3. Discussion
4. Materials and Methods
4.1. Mathematical Modeling
4.2. RACIPE (Random Network Simulation)
4.3. Gene Expression Datasets
4.4. External Signal Noise and Epigenetic Feedback on KLF4 and SNAIL
- Noise on External signal:
- Epigenetic feedback:
4.5. Kaplan-Meier Analysis
4.6. Patient Data
4.7. EMT Score
4.8. Methylation Status
5. Conclusions
Supplementary Materials
Author Contributions
Funding
Institutional Review Board Statement
Informed Consent Statement
Data Availability Statement
Acknowledgments
Conflicts of Interest
References
- Bray, F.; Ferlay, J.; Soerjomataram, I.; Siegel, R.L.; Torre, L.A.; Jemal, A. Global cancer statistics 2018: GLOBOCAN estimates of incidence and mortality worldwide for 36 cancers in 185 countries. CA. Cancer J. Clin. 2018, 68, 394–424. [Google Scholar] [CrossRef] [PubMed] [Green Version]
- Gupta, G.P.; Massagué, J. Cancer metastasis: Building a framework. Cell 2006, 127, 679–695. [Google Scholar] [CrossRef] [PubMed] [Green Version]
- Chaffer, C.L.; Weinberg, R.A. A perspective on cancer cell metastasis. Science 2011, 331, 1559–1564. [Google Scholar] [CrossRef] [PubMed]
- Celià-Terrassa, T.; Jolly, M.K. Cancer Stem Cells and Epithelial-to-Mesenchymal Transition in Cancer Metastasis. Cold Spring Harb. Perspect. Med. 2020, 10, a036905. [Google Scholar] [CrossRef]
- Welch, D.R.; Hurst, D.R. Defining the Hallmarks of Metastasis. Cancer Res. 2019, 79, 3011–3027. [Google Scholar] [CrossRef] [PubMed]
- Jolly, M.K.; Celià-Terrassa, T. Dynamics of Phenotypic Heterogeneity Associated with EMT and Stemness during Cancer Progression. J. Clin. Med. 2019, 8, 1542. [Google Scholar] [CrossRef] [Green Version]
- Nieto, M.A.; Huang, R.Y.; Jackson, R.A.; Thiery, J.P. EMT: 2016. Cell 2016, 166, 21–45. [Google Scholar] [CrossRef] [Green Version]
- Drápela, S.; Bouchal, J.; Jolly, M.K.; Culig, Z.; Souček, K. ZEB1: A Critical Regulator of Cell Plasticity, DNA Damage Response, and Therapy Resistance. Front. Mol. Biosci. 2020, 7, 36. [Google Scholar] [CrossRef]
- Gras, B.; Jacqueroud, L.; Wierinckx, A.; Lamblot, C.; Fauvet, F.; Lachuer, J.; Puisieux, A.; Ansieau, S. Snail family members unequally trigger EMT and thereby differ in their ability to promote the neoplastic transformation of mammary epithelial cells. PLoS ONE 2014, 9, e92254. [Google Scholar]
- Burk, U.; Schubert, J.; Wellner, U.; Schmalhofer, O.; Vincan, E.; Spaderna, S.; Brabletz, T. A reciprocal repression between ZEB1 and members of the miR-200 family promotes EMT and invasion in cancer cells. EMBO Rep. 2008, 9, 582–589. [Google Scholar] [CrossRef] [Green Version]
- Cook, D.P.; Vanderhyden, B.C. Context specificity of the EMT transcriptional response. Nat. Commun. 2020, 11, 2142. [Google Scholar] [CrossRef]
- Celià-Terrassa, T.; Bastian, C.; Liu, D.D.; Ell, B.; Aiello, N.M.; Wei, Y.; Zamalloa, J.; Blanco, A.M.; Hang, X.; Kunisky, D.; et al. Hysteresis control of epithelial-mesenchymal transition dynamics conveys a distinct program with enhanced metastatic ability. Nat. Commun. 2018, 9, 5005. [Google Scholar] [CrossRef]
- Taube, J.H.; Herschkowitz, J.I.; Komurov, K.; Zhou, A.Y.; Gupta, S.; Yang, J.; Hartwell, K.; Onder, T.T.; Gupta, P.B.; Evans, K.W.; et al. Core epithelial-to-mesenchymal transition interactome gene-expression signature is associated with claudin-low and metaplastic breast cancer subtypes. Proc. Natl. Acad. Sci. USA 2010, 107, 15449–15454. [Google Scholar] [CrossRef] [Green Version]
- Somarelli, J.A.; Shetler, S.; Jolly, M.K.; Wang, X.; Bartholf Dewitt, S.; Hish, A.J.; Gilja, S.; Eward, W.C.; Ware, K.E.; Levine, H.; et al. Mesenchymal-epithelial transition in sarcomas is controlled by the combinatorial expression of microRNA 200s and GRHL2. Mol. Cell. Biol. 2016, 36, 2503–2513. [Google Scholar] [CrossRef] [PubMed] [Green Version]
- Mooney, S.M.; Talebian, V.; Jolly, M.K.; Jia, D.; Gromala, M.; Levine, H.; McConkey, B.J. The GRHL2/ZEB Feedback Loop-A Key Axis in the Regulation of EMT in Breast Cancer. J. Cell. Biochem. 2017, 118, 2559–2570. [Google Scholar] [CrossRef] [PubMed]
- Saxena, K.; Srikrishnan, S.; Celia-Terrassa, T.; Jolly, M.K. OVOL1/2: Drivers of Epithelial Differentiation in Development, Disease, and Reprogramming. Cells Tissues Organs 2020, 1–10. [Google Scholar] [CrossRef] [PubMed]
- Frisch, S.M.; Farris, J.C.; Pifer, P.M. Roles of Grainyhead-like transcription factors in cancer. Oncogene 2017, 36, 6067–6073. [Google Scholar] [CrossRef]
- Sundararajan, V.; Pang, Q.Y.; Choolani, M.; Huang, R.Y.-J. Spotlight on the Granules (Grainyhead-Like Proteins)—From an Evolutionary Conserved Controller of Epithelial Trait to Pioneering the Chromatin Landscape. Front. Mol. Biosci. 2020, 7, 213. [Google Scholar] [CrossRef]
- Subbalakshmi, A.R.; Kundnani, D.; Biswas, K.; Ghosh, A.; Hanash, S.M.; Tripathi, S.C.; Jolly, M.K. NFATc Acts as a Non-Canonical Phenotypic Stability Factor for a Hybrid Epithelial/Mesenchymal Phenotype. Front. Oncol. 2020, 10, 1794. [Google Scholar] [CrossRef] [PubMed]
- Pastushenko, I.; Mauri, F.; Song, Y.; de Cock, F.; Meeusen, B.; Swedlund, B.; Impens, F.; Van Haver, D.; Opitz, M.; Thery, M.; et al. Fat1 deletion promotes hybrid EMT state, tumour stemness and metastasis. Nature 2021, 589, 448–455. [Google Scholar] [CrossRef]
- Selvaggio, G.; Canato, S.; Pawar, A.; Monteiro, P.T.; Guerreiro, P.S.; Brás, M.M.; Janody, F.; Chaouiya, C. Hybrid Epithelial-Mesenchymal Phenotypes Are Controlled by Microenvironmental Factors. Cancer Res. 2020, 80, 2407–2420. [Google Scholar] [CrossRef] [PubMed] [Green Version]
- Bui, N.H.B.; Napoli, M.; Davis, A.J.; Abbas, H.A.; Rajapakshe, K.; Coarfa, C.; Flores, E.R. Spatiotemporal regulation of ∆Np63 by TGFβ-regulated miRNAs is essential for cancer metastasis. Cancer Res. 2020, 80, 2833–2847. [Google Scholar] [CrossRef] [PubMed] [Green Version]
- Bocci, F.; Tripathi, S.C.; Vilchez Mercedes, S.A.; George, J.T.; Casabar, J.P.; Wong, P.K.; Hanash, S.M.; Levine, H.; Onuchic, J.N.; Jolly, M.K. NRF2 activates a partial epithelial-mesenchymal transition and is maximally present in a hybrid epithelial/mesenchymal phenotype. Integr. Biol. 2019, 11, 251–263. [Google Scholar] [CrossRef] [Green Version]
- Campbell, K.; Rossi, F.; Adams, J.; Pitsidianaki, I.; Barriga, F.M.; Garcia-Gerique, L.; Batlle, E.; Casanova, J.; Casali, A. Collective cell migration and metastases induced by an epithelial-to-mesenchymal transition in Drosophila intestinal tumors. Nat. Commun. 2019, 10, 2311. [Google Scholar] [CrossRef] [PubMed] [Green Version]
- Jolly, M.K.; Mani, S.A.; Levine, H. Hybrid epithelial/mesenchymal phenotype(s): The ‘fittest’ for metastasis? Biochim. Biophys. Acta-Rev. Cancer 2018, 1870, 151–157. [Google Scholar] [CrossRef]
- Aceto, N.; Bardia, A.; Miyamoto, D.T.; Donaldson, M.C.; Wittner, B.S.; Spencer, J.A.; Yu, M.; Pely, A.; Engstrom, A.; Zhu, H. Circulating tumor cell clusters are oligoclonal precursors of breast cancer metastasis. Cell 2014, 158, 1110–1122. [Google Scholar] [CrossRef] [Green Version]
- Godin, L.; Balsat, C.; Van Eycke, Y.; Allard, J.; Royer, C.; Remmelink, M.; Pastushenko, I.; Haene, N.D.; Blanpain, C.; Salmon, I.; et al. A Novel Approach for Quantifying Cancer Cells Showing Hybrid Epithelial/Mesenchymal States in Large Series of Tissue Samples: Towards a New Prognostic Marker. Cancers 2020, 12, 906. [Google Scholar] [CrossRef] [Green Version]
- Jolly, M.K.; Somarelli, J.A.; Sheth, M.; Biddle, A.; Tripathi, S.C.; Armstrong, A.J.; Hanash, S.M.; Bapat, S.A.; Rangarajan, A.; Levine, H. Hybrid epithelial/mesenchymal phenotypes promote metastasis and therapy resistance across carcinomas. Pharmacol. Ther. 2019, 194, 161–184. [Google Scholar] [CrossRef]
- Grigore, A.; Jolly, M.K.; Jia, D.; Farach-Carson, M.; Levine, H. Tumor Budding: The Name is EMT. Partial EMT. J. Clin. Med. 2016, 5, 51. [Google Scholar] [CrossRef]
- Tripathi, S.; Levine, H.; Jolly, M.K. The Physics of Cellular Decision-Making during Epithelial-Mesenchymal Transition. Annu. Rev. Biophys. 2020, 49, 1–18. [Google Scholar] [CrossRef] [Green Version]
- Ghaleb, A.M.; Yang, V.W. Krüppel-like factor 4 (KLF4): What we currently know. Gene 2017, 611, 27037. [Google Scholar] [CrossRef] [PubMed]
- Nandan, M.O.; Yang, V.W. The role of Krüppel-like factors in the reprogramming of somatic cells to induced pluripotent stem cells. Histol. Histopathol. 2009, 24, 1343–1355. [Google Scholar] [PubMed]
- Segre, J.A.; Bauer, C.; Fuchs, E. Klf4 is a transcription factor required for establishing the barrier function of the skin. Nat. Genet. 1999, 22, 356–360. [Google Scholar] [CrossRef] [PubMed]
- Cowan, C.E.; Kohler, E.E.; Dugan, T.A.; Mirza, M.K.; Malik, A.B.; Wary, K.K. Krüppel-like factor-4 transcriptionally regulates VE-cadherin expression and endothelial barrier function. Circ. Res. 2010, 107, 959–966. [Google Scholar] [CrossRef] [Green Version]
- Zhang, P.; Andrianakos, R.; Yang, Y.; Liu, C.; Lu, W. Kruppel-like factor 4 (Klf4) prevents embryonic stem (ES) cell differentiation by regulating Nanog gene expression. J. Biol. Chem. 2010, 285, 9180–9189. [Google Scholar] [CrossRef] [Green Version]
- Tiwari, A.; Loughner, C.L.; Swamynathan, S.; Swamynathan, S.K. KLF4 plays an essential role in corneal epithelial homeostasis by promoting epithelial cell fate and suppressing epithelial-mesenchymal transition. Investig. Ophthalmol. Vis. Sci. 2017, 58, 2785–2795. [Google Scholar] [CrossRef]
- Fujimoto, S.; Hayashi, R.; Hara, S.; Sasamoto, Y.; Harrington, J.; Tsujikawa, M.; Nishida, K. KLF4 prevents epithelial to mesenchymal transition in human corneal epithelial cells via endogenous TGF-β2 suppression. Regen. Ther. 2019, 11, 249–257. [Google Scholar] [CrossRef]
- Lin, L.; Han, Q.; Xiong, Y.; Li, T.; Liu, Z.; Xu, H.; Wu, Y.; Wang, N.; Liu, X. Krüpple-like-factor 4 Attenuates Lung Fibrosis via Inhibiting Epithelial-mesenchymal Transition. Sci. Rep. 2017, 7, 15847. [Google Scholar] [CrossRef]
- Leng, Z.; Tao, K.; Xia, Q.; Tan, J.; Yue, Z.; Chen, J.; Xi, H.; Li, J.; Zheng, H. Krüppel-Like Factor 4 Acts as an Oncogene in Colon Cancer Stem Cell-Enriched Spheroid Cells. PLoS ONE 2013, 8, 56082. [Google Scholar] [CrossRef] [Green Version]
- Guan, H.; Xie, L.; Leithäuser, F.; Flossbach, L.; Möller, P.; Wirth, T.; Ushmorov, A. KLF4 is a tumor suppressor in B-cell non-Hodgkin lymphoma and in classic Hodgkin lymphoma. Blood 2010, 116, 1469–1478. [Google Scholar] [CrossRef]
- Yu, F.; Li, J.; Chen, H.; Fu, J.; Ray, S.; Huang, S.; Zheng, H.; Ai, W. Kruppel-like factor 4 (KLF4) is required for maintenance of breast cancer stem cells and for cell migration and invasion. Oncogene 2011, 30, 2161–2172. [Google Scholar] [CrossRef] [PubMed] [Green Version]
- Rowland, B.D.; Bernards, R.; Peeper, D.S. The KLF4 tumour suppressor is a transcriptional repressor of p53 that acts as a context-dependent oncogene. Nat. Cell Biol. 2005, 7, 1074–1082. [Google Scholar] [CrossRef] [PubMed]
- Yori, J.L.; Seachrist, D.D.; Johnson, E.; Lozada, K.L.; Schiemann, W.P.; Keri, R.A. Krüppel-like Factor 4 Inhibits Tumorigenic Progression and Metastasis in a Mouse Model of Breast Cancer. Neoplasia 2011, 13, 601–610. [Google Scholar] [CrossRef] [Green Version]
- Li, Z.; Huang, J.; Shen, S.; Ding, Z.; Luo, Q.; Chen, Z.; Lu, S. SIRT6 drives epithelial-to-mesenchymal transition and metastasis in non-small cell lung cancer via snail-dependent transrepression of KLF4. J. Exp. Clin. Cancer Res. 2018, 37, 323. [Google Scholar] [CrossRef] [PubMed] [Green Version]
- Liu, Y.-N.; Abou-Kheir, W.; Yin, J.J.; Fang, L.; Hynes, P.; Casey, O.; Hu, D.; Wan, Y.; Seng, V.; Sheppard-Tillman, H.; et al. Critical and Reciprocal Regulation of KLF4 and SLUG in Transforming Growth Factor-Initiated Prostate Cancer Epithelial-Mesenchymal Transition. Mol. Cell. Biol. 2012, 32, 941–953. [Google Scholar] [CrossRef] [Green Version]
- Bolós, V.; Peinado, H.; Pérez-Moreno, M.A.; Fraga, M.F.; Esteller, M.; Cano, A. The transcription factor Slug represses E-cadherin expression and induces epithelial to mesenchymal transitions: A comparison with Snail and E47 repressors. J. Cell Sci. 2003, 116, 499–511. [Google Scholar] [CrossRef] [Green Version]
- Brabletz, S.; Brabletz, T. The ZEB/miR-200 feedback loop—A motor of cellular plasticity in development and cancer? EMBO Rep. 2010, 11, 670–677. [Google Scholar] [CrossRef] [Green Version]
- Subbalakshmi, A.R.; Sahoo, S.; Biswas, K.; Jolly, M.K. A computational systems biology approach identifies SLUG as a mediator of partial Epithelial-Mesenchymal Transition (EMT). Cells Tissues Organs 2021, 1–14. [Google Scholar] [CrossRef]
- Duddu, A.S.; Sahoo, S.; Hati, S.; Jhunjhunwala, S.; Jolly, M.K. Multi-stability in cellular differentiation enabled by a network of three mutually repressing master regulators. J. R. Soc. Interface 2020, 17, 20200631. [Google Scholar] [CrossRef]
- Dang, D.T.; Zhao, W.; Mahatan, C.S.; Geiman, D.E.; Yang, V.W. Opposing effects of Krüppel-like factor 4 (gut-enriched Krüppel-like factor) and Krüpple-like factor 5 (intestinal-enriched Krüppel-like factor) on the promoter of the Krüppel-like factor 4 gene. Nucleic Acids Res. 2002, 30, 2736–2741. [Google Scholar] [CrossRef] [Green Version]
- Jolly, M.K.; Preca, B.-T.; Tripathi, S.C.; Jia, D.; George, J.T.; Hanash, S.M.; Brabletz, T.; Stemmler, M.P.; Maurer, J.; Levine, H. Interconnected feedback loops among ESRP1, HAS2, and CD44 regulate epithelial-mesenchymal plasticity in cancer. APL BioEng. 2018, 2, 031908. [Google Scholar] [CrossRef] [PubMed]
- Varma, S.; Cao, Y.; Tagne, J.B.; Lakshminarayanan, M.; Li, J.; Friedman, T.B.; Morell, R.J.; Warburton, D.; Kotton, D.N.; Ramirez, M.I. The transcription factors grainyhead-like 2 and NK2-homeobox 1 form a regulatory loop that coordinates lung epithelial cell morphogenesis and differentiation. J. Biol. Chem. 2012, 287, 37282–37295. [Google Scholar] [CrossRef] [PubMed] [Green Version]
- Farris, J.C.; Pifer, P.M.; Zheng, L.; Gottlieb, E.; Denvir, J.; Frisch, S.M. Grainyhead-like 2 reverses the metabolic changes induced by the oncogenic epithelial-mesenchymal transition: Effects on anoikis. Mol. Cancer Res. 2016, 14, 528–538. [Google Scholar] [CrossRef] [Green Version]
- Aue, A.; Hinze, C.; Walentin, K.; Ruffert, J.; Yurtdas, Y.; Werth, M.; Chen, W.; Rabien, A.; Kilic, E.; Schulzke, J.D.; et al. A grainyhead-like 2/Ovo-like 2 pathway regulates renal epithelial barrier function and lumen expansion. J. Am. Soc. Nephrol. 2015, 26, 2704–2715. [Google Scholar] [CrossRef] [Green Version]
- Huang, B.; Lu, M.; Jia, D.; Ben-Jacob, E.; Levine, H.; Onuchic, J.N. Interrogating the topological robustness of gene regulatory circuits by randomization. PLoS Comput. Biol. 2017, 13, e1005456. [Google Scholar] [CrossRef] [Green Version]
- Chakraborty, P.; George, J.T.; Tripathi, S.; Levine, H.; Jolly, M.K. Comparative Study of Transcriptomics-Based Scoring Metrics for the Epithelial-Hybrid-Mesenchymal Spectrum. Front. Bioeng. Biotechnol. 2020, 8, 220. [Google Scholar] [CrossRef] [PubMed] [Green Version]
- Chakraborty, P.; Chen, E.L.; McMullen, I.; Armstrong, A.J.; Jolly, M.K.; Somarelli, J.A. Analysis of immune subtypes across the epithelial-mesenchymal plasticity spectrum. Comput. Struct. Biotechnol. J. 2021, 19, 3842–3851. [Google Scholar] [CrossRef] [PubMed]
- Chauhan, L.; Ram, U.; Hari, K.; Jolly, M.K. Topological signatures in regulatory network enable phenotypic heterogeneity in small cell lung cancer. Elife 2021, 10, e64522. [Google Scholar] [CrossRef]
- Johansson, J.; Tabor, V.; Wikell, A.; Jalkanen, S.; Fuxe, J. TGF-b1-Induced Epithelial-Mesenchymal Transition Promotes Monocyte/Macrophage Properties in Breast Cancer Cells. Front. Oncol. 2015, 5, 3. [Google Scholar] [CrossRef] [Green Version]
- McGrail, D.J.; Mezencev, R.; Kieu, Q.M.N.; McDonald, J.F.; Dawson, M.R. SNAIL-induced epithelial-to-mesenchymal transition produces concerted biophysical changes from altered cytoskeletal gene expression. FASEB J. 2015, 29, 1280–1289. [Google Scholar] [CrossRef] [Green Version]
- Chung, V.Y.; Tan, T.Z.; Ye, J.; Huang, R.-L.; Lai, H.-C.; Kappei, D.; Wollmann, H.; Guccione, E.; Huang, R.Y.-J. The role of GRHL2 and epigenetic remodeling in epithelial–mesenchymal plasticity in ovarian cancer cells. Commun. Biol. 2019, 2, 272. [Google Scholar] [CrossRef] [PubMed] [Green Version]
- Hong, D.; Messier, T.L.; Tye, C.E.; Dobson, J.R.; Fritz, A.J.; Sikora, K.R.; Browne, G.; Stein, J.L.; Lian, J.B.; Stein, G.S. Runx1 stabilizes the mammary epithelial cell phenotype and prevents epithelial to mesenchymal transition. Oncotarget 2017, 8, 17610–17627. [Google Scholar] [CrossRef] [Green Version]
- Tan, T.Z.; Miow, Q.H.; Miki, Y.; Noda, T.; Mori, S.; Huang, R.Y.-J.; Thiery, J.P. Epithelial-mesenchymal transition spectrum quantification and its efficacy in deciphering survival and drug responses of cancer patients. EMBO Mol. Med. 2014, 6, 1279–1293. [Google Scholar] [CrossRef] [PubMed]
- Xiao, X.; Tang, W.; Yuan, Q.; Peng, L.; Yu, P. Epigenetic repression of Krüppel-like factor 4 through Dnmt1 contributes to EMT in renal fibrosis. Int. J. Mol. Med. 2015, 35, 1596–1602. [Google Scholar] [CrossRef] [PubMed] [Green Version]
- Li, H.; Wang, J.; Xiao, W.; Xia, D.; Lang, B.; Yu, G.; Guo, X.; Guan, W.; Wang, Z.; Hu, Z.; et al. Epigenetic alterations of krüppel-like factor 4 and its tumor suppressor function in renal cell carcinoma. Carcinogenesis 2013, 34, 2262–2270. [Google Scholar] [CrossRef] [Green Version]
- Jia, W.; Tripathi, S.; Chakraborty, P.; Chedere, A.; Rangarajan, A.; Levine, H.; Jolly, M.K. Epigenetic feedback and stochastic partitioning during cell division can drive resistance to EMT. Oncotarget 2020, 11, 2611–2624. [Google Scholar] [CrossRef]
- Jia, W.; Deshmukh, A.; Mani, S.A.; Jolly, M.K.; Levine, H. A possible role for epigenetic feedback regulation in the dynamics of the epithelial-mesenchymal transition (EMT). Phys. Biol. 2019, 16, 066004. [Google Scholar] [CrossRef] [Green Version]
- Miyamoto, T.; Furusawa, C.; Kaneko, K. Pluripotency, Differentiation, and Reprogramming: A Gene Expression Dynamics Model with Epigenetic Feedback Regulation. PLoS Comput. Biol. 2015, 11, e1004476. [Google Scholar] [CrossRef] [Green Version]
- Clarke, C.; Madden, S.; Doolan, P.; Aherne, S.; Joyce, H.; O’Driscoll, L.; Gallagher, W.; Hennessy, B.; Moriarty, M.; Crown, J.; et al. Correlating transcriptional networks to breast cancer survival: A large-scale coexpression analysis. Carcinogenesis 2013, 34, 2300–2308. [Google Scholar] [CrossRef]
- Miller, L.; Smeds, J.; George, J.; Vega, V.; Vergara, L.; Ploner, A.; Pawitan, Y.; Hall, P.; Klaar, S.; Liu, E.; et al. An expression signature for p53 status in human breast cancer predicts mutation status, transcriptional effects, and patient survival. Proc. Natl. Acad. Sci. USA 2005, 102, 13550–13555. [Google Scholar] [CrossRef] [Green Version]
- Bonome, T.; Levine, D.A.; Shih, J.; Randonovich, M.; Pise-Masison, C.A.; Bogomolniy, F.; Ozbun, L.; Brady, J.; Barrett, J.C.; Boyd, J.; et al. A Gene Signature Predicting for Survival in Suboptimally DebulkedPatients with Ovarian Cancer. Cancer Res. 2008, 68, 5478. [Google Scholar] [CrossRef] [PubMed] [Green Version]
- Ferriss, J.S.; Kim, Y.; Duska, L.; Birrer, M.; Levine, D.A.; Moskaluk, C.; Theodorescu, D.; Lee, J.K. Multi-Gene Expression Predictors of Single Drug Responses to Adjuvant Chemotherapy in Ovarian Carcinoma: Predicting Platinum Resistance. PLoS ONE 2012, 7, e30550. [Google Scholar] [CrossRef] [PubMed] [Green Version]
- Rousseaux, S.; Debernardi, A.; Jacquiau, B.; Vitte, A.-L.; Vesin, A.; Nagy-Mignotte, H.; Moro-Sibilot, D.; Brichon, P.-Y.; Lantuejoul, S.; Hainaut, P.; et al. Ectopic Activation of Germline and Placental Genes Identifies Aggressive Metastasis-Prone Lung Cancers. Sci. Transl. Med. 2013, 5, 186ra66. [Google Scholar] [CrossRef] [PubMed] [Green Version]
- Győrffy, B.; Surowiak, P.; Budczies, J.; Lánczky, A. Online survival analysis software to assess the prognostic value of biomarkers using transcriptomic data in non-small-cell lung cancer. PLoS ONE 2013, 8, e82241. [Google Scholar] [CrossRef] [Green Version]
- George, J.T.; Jolly, M.K.; Xu, S.; Somarelli, J.A.; Levine, H. Survival outcomes in cancer patients predicted by a partial EMT gene expression scoring metric. Cancer Res. 2017, 77, 6415–6428. [Google Scholar] [CrossRef] [PubMed] [Green Version]
- Chen, X.; Whitney, E.M.; Gao, S.Y.; Yang, V.W. Transcriptional profiling of Krüppel-like factor 4 reveals a function in cell cycle regulation and epithelial differentiation. J. Mol. Biol. 2003, 326, 665–677. [Google Scholar] [CrossRef] [Green Version]
- Li, X.; Zhao, Z.; Zhang, X.; Yang, S.; Lin, X.; Yang, X.; Lin, X.; Shi, J.; Wang, S.; Zhao, W.; et al. Klf 4 reduces stemness phenotype triggers mesenchymal-epithelial transition (MET)-like molecular changes, and prevents tumor progression in nasopharygeal carcinoma. Oncotarget 2017, 8, 93924–93941. [Google Scholar] [CrossRef] [Green Version]
- Yori, J.L.; Johnson, E.; Zhou, G.; Jain, M.K.; Keri, R.A. Krüppel-like factor 4 inhibits epithelial-to-mesenchymal transition through regulation of E-cadherin gene expression. J. Biol. Chem. 2010, 285, 16854–16863. [Google Scholar] [CrossRef] [Green Version]
- Chen, Z.; Wang, Y.; Liu, W.; Zhao, G.; Lee, S.; Balogh, A.; Zou, Y.; Guo, Y.; Zhang, Z.; Gu, W.; et al. Doxycycline inducible Kruppel-like factor 4 lentiviral vector mediates mesenchymal to epithelial transition in ovarian cancer cells. PLoS ONE 2014, 9, e105331. [Google Scholar] [CrossRef]
- Xiong, X.; Schober, M.; Tassone, E.; Khodadadi-Jamayran, A.; Sastre-Perona, A.; Zhou, H.; Tsirigos, A.; Shen, S.; Chang, M.; Melamed, J.; et al. KLF4, A Gene Regulating Prostate Stem Cell Homeostasis, Is a Barrier to Malignant Progression and Predictor of Good Prognosis in Prostate Cancer. Cell Rep. 2018, 25, 3006–3020. [Google Scholar] [CrossRef] [Green Version]
- Zhu, Z.; Yu, Z.; Wang, J.; Zhou, L.; Zhang, J.; Yao, B.; Dou, J.; Qiu, Z.; Huang, C. Krüppel-Like Factor 4 Inhibits Pancreatic Cancer Epithelial-to-Mesenchymal Transition and Metastasis by Down-Regulating Caveolin-1 Expression. Cell. Physiol. Biochem. 2018, 46, 238–252. [Google Scholar] [CrossRef] [PubMed]
- Jolly, M.K.; Tripathi, S.C.; Somarelli, J.A.; Hanash, S.M.; Levine, H. Epithelial-mesenchymal plasticity: How have quantitative mathematical models helped improve our understanding? Mol. Oncol. 2017, 11, 739–754. [Google Scholar] [CrossRef] [PubMed] [Green Version]
- Yu, F.; Shi, Y.; Wang, J.; Li, J.; Fan, D.; Ai, W. Deficiency of Kruppel-like factor KLF4 in mammary tumor cells inhibits tumor growth and pulmonary metastasis and is accompanied by compromised recruitment of myeloid-derived suppressor cells. Int. J. Cancer 2013, 133, 2872–2883. [Google Scholar] [CrossRef] [PubMed]
- Karagonlar, Z.F.; Akbari, S.; Karabicici, M.; Sahin, E.; Avci, S.T.; Ersoy, N.; Ates, K.E.; Balli, T.; Karacicek, B.; Kaplan, K.N. A Novel Function for KLF4 in Modulating the De-differentiation of EpCAM-/CD133- nonStem Cells into EpCAM+/CD133+ Liver Cancer Stem Cells in HCC Cell Line HuH7. Cells 2020, 9, 1198. [Google Scholar] [CrossRef] [PubMed]
- Li, Y.; Xian, M.; Yang, B.; Ying, M.; He, Q. Inhibition of KLF4 by Statins Reverses Adriamycin-Induced Metastasis and Cancer Stemness in Osteosarcoma Cells. Stem Cell Rep. 2017, 8, 1617–1629. [Google Scholar] [CrossRef] [Green Version]
- Qi, X.-T.; Li, Y.-L.; Zhang, Y.-Q.; Xu, T.; Lu, B.; Fang, L.; Gao, J.-Q.; Yu, L.-S.; Zhu, D.-F.; Yang, B.; et al. KLF4 functions as an oncogene in promoting cancer stem cell-like characteristics in osteosarcoma cells. Acta Pharmacol. Sin. 2019, 40, 546–555. [Google Scholar] [CrossRef]
- Martins-Neve, S.R.; Corver, W.E.; Paiva-Oliviera, D.I.; van den Akker, B.E.W.M.; Briaire-de-Bruijn, I.H.; Bovee, J.V.M.G.; Gomes, C.M.F.; Cleton-Jansen, A.-M. Osteosarcoma Stem Cells Have Active Wnt/β-catenin and Overexpress SOX2 and KLF4. J. Cell. Physiol. 2016, 231, 876–886. [Google Scholar] [CrossRef]
- Liu, S.; Cong, Y.; Wang, D.; Sun, Y.; Deng, L.; Liu, Y.; Martin-Trevino, R.; Shang, L.; McDermott, S.P.; Landis, M.D.; et al. Breast cancer stem cells transition between epithelial and mesenchymal states reflective of their normal counterparts. Stem Cell Rep. 2014, 2, 78–91. [Google Scholar] [CrossRef]
- Luo, M.; Shang, L.; Brooks, M.D.; Jiagge, E.; Zhu, Y.; Buschhaus, J.; Conley, S.; Fath, M.A.; Davis, A.; Gheordunescu, E.; et al. Targeting Breast Cancer Stem Cell State Equilibrium through Modulation of Redox Signaling. Cell Metab. 2018, 28, 69–86.e6. [Google Scholar] [CrossRef] [Green Version]
- Nishimura, K.; Aizawa, S.; Nugroho, F.L.; Shiomitsu, E.; Tran, Y.T.H.; Bui, P.L.; Borisova, E.; Sakuragi, Y.; Takada, H.; Kurisaki, A.; et al. A Role for KLF4 in Promoting the Metabolic Shift via TCL1 during Induced Pluripotent Stem Cell Generation. Stem Cell Rep. 2017, 8, 787–801. [Google Scholar] [CrossRef] [Green Version]
- Moon, J.S.; Kim, H.E.; Koh, E.; Park, S.H.; Jin, W.J.; Park, B.W.; Park, S.W.; Kim, K.S. Krüppel-like factor 4 (KLF4) activates the transcription of the gene for the platelet isoform of phosphofructokinase (PFKP) in breast cancer. J. Biol. Chem. 2011, 286, 23808–23816. [Google Scholar] [CrossRef] [PubMed] [Green Version]
- Tiwari, N.; Meyer-Schaller, N.; Arnold, P.; Antoniadis, H.; Pachkov, M.; van Nimwegen, E.; Christofori, G. Klf4 Is a Transcriptional Regulator of Genes Critical for EMT, Including Jnk1 (Mapk8). PLoS ONE 2013, 8, e57329. [Google Scholar] [CrossRef]
- Yan, Y.; Li, Z.; Kong, X.; Jia, Z.; Zuo, X.; Gagea, M.; Huang, S.; Wei, D.; Xie, K. KLF4-mediated suppression of CD44 signaling negatively impacts pancreatic cancer stemness and metastasis. Cancer Res. 2016, 76, 2419–2431. [Google Scholar] [CrossRef] [Green Version]
- Murgai, M.; Ju, W.; Eason, M.; Kline, J.; Beury, D.W.; Kaczanowska, S.; Miettinen, M.M.; Kruhlak, M.; Lei, H.; Shern, J.F.; et al. KLF4-dependent perivascular cell plasticity mediates pre-metastatic niche formation and metastasis. Nat. Med. 2017, 23, 1176–1190. [Google Scholar] [CrossRef] [PubMed]
- Zhou, Z.; Feng, Z.; Hu, D.; Yang, P.; Gur, M.; Bahar, I.; Cristofanilli, M.; Gradishar, W.J.; Xie, X.-q.; Wan, Y. A novel small-molecule antagonizes PRMT5-mediated KLF4 methylation for targeted therapy. EBioMedicine 2019, 44, 98–111. [Google Scholar] [CrossRef] [PubMed] [Green Version]
- Cercek, A.; Wheler, J.; Murray, P.E.; Zhou, S.; Saltz, L. Phase 1 study of APTO-253 HCl, an inducer of KLF4, in patients with advanced or metastatic solid tumors. Investig. New Drugs 2015, 33, 1086–1092. [Google Scholar] [CrossRef]
- Karacosta, L.G.; Anchang, B.; Ignatiadis, N.; Kimmey, S.C.; Benson, J.A.; Shrager, J.B.; Tibshirani, R.; Bendall, S.C.; Plevritis, S.K. Mapping Lung Cancer Epithelial-Mesenchymal Transition States and Trajectories with Single-Cell Resolution. Nat. Commun. 2019, 10, 5587. [Google Scholar] [CrossRef] [Green Version]
- Tripathi, S.; Chakraborty, P.; Levine, H.; Jolly, M.K. A mechanism for epithelial-mesenchymal heterogeneity in a population of cancer cells. PLoS Comput. Biol. 2020, 16, e1007619. [Google Scholar] [CrossRef] [Green Version]
- Dhooge, A.; Govaerts, W.; Kuznetsov, Y.A. MATCONT: A MATLAB Package for Numerical Bifurcation Analysis of ODEs. ACM Trans. Math. Softw. 2003, 29, 141–164. [Google Scholar] [CrossRef]
- Davis, S.; Meltzer, P.S. GEOquery: A bridge between the Gene Expression Omnibus (GEO) and BioConductor. Bioinformatics 2007, 23, 1846–1847. [Google Scholar] [CrossRef] [Green Version]
- Wang, Z.; Wu, X.; Wang, Y. A framework for analyzing DNA methylation data from Illumina Infinium HumanMethylation450 BeadChip. BMC Bioinform. 2018, 19, 115. [Google Scholar] [CrossRef] [PubMed] [Green Version]
- Mandal, S.; Tejaswi, T.; Janivara, R.; Srikrishnan, S.; Thakur, P.; Sahoo, S.; Chakraborty, P.; Sohal, S.S.; Levine, H.; George, J.T.; et al. Transcriptomic-based quantification of the epithelial-hybrid-mesenchymal spectrum across biological contexts. bioRxiv 2021. [Google Scholar] [CrossRef]


Publisher’s Note: MDPI stays neutral with regard to jurisdictional claims in published maps and institutional affiliations. |
© 2021 by the authors. Licensee MDPI, Basel, Switzerland. This article is an open access article distributed under the terms and conditions of the Creative Commons Attribution (CC BY) license (https://creativecommons.org/licenses/by/4.0/).
Share and Cite
Subbalakshmi, A.R.; Sahoo, S.; McMullen, I.; Saxena, A.N.; Venugopal, S.K.; Somarelli, J.A.; Jolly, M.K. KLF4 Induces Mesenchymal–Epithelial Transition (MET) by Suppressing Multiple EMT-Inducing Transcription Factors. Cancers 2021, 13, 5135. https://doi.org/10.3390/cancers13205135
Subbalakshmi AR, Sahoo S, McMullen I, Saxena AN, Venugopal SK, Somarelli JA, Jolly MK. KLF4 Induces Mesenchymal–Epithelial Transition (MET) by Suppressing Multiple EMT-Inducing Transcription Factors. Cancers. 2021; 13(20):5135. https://doi.org/10.3390/cancers13205135
Chicago/Turabian StyleSubbalakshmi, Ayalur Raghu, Sarthak Sahoo, Isabelle McMullen, Aaditya Narayan Saxena, Sudhanva Kalasapura Venugopal, Jason A. Somarelli, and Mohit Kumar Jolly. 2021. "KLF4 Induces Mesenchymal–Epithelial Transition (MET) by Suppressing Multiple EMT-Inducing Transcription Factors" Cancers 13, no. 20: 5135. https://doi.org/10.3390/cancers13205135