
Lensoside Aβ as an Adjuvant to the Anti-Glioma Potential of Sorafenib

 , , , ,
  , , , , and
Abstract
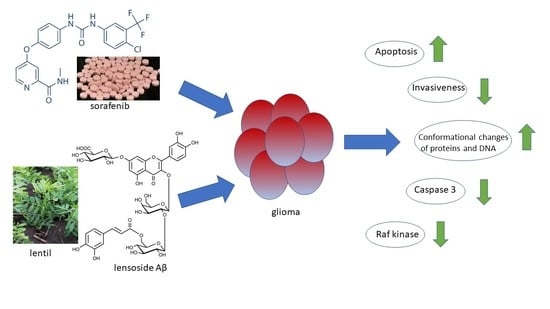
:Simple Summary
Abstract
1. Introduction
2. Results
2.1. Sensitivity of Malignant Glioma Cell Lines to Lensoside Aβ and Sorafenib Application
2.1.1. Lensoside Aβ
2.1.2. Sorafenib
2.1.3. Combination of Lensoside Aβ and Sorafenib
2.2. Effect of Lensoside Aβ and Sorafenib on Apoptosis, Necrosis, and Mitochondrial Membrane Potential Estimated by Flow Cytometry
2.3. Estimation of the Level of Caspase 3, Beclin 1, and Raf Kinase upon Lensoside Aβ and Sorafenib Treatment
2.4. Scanning Electron Microscopy of Cells Treated with Lensoside Aβ and/or Sorafenib
2.5. FTIR Spectroscopy of T98G, MOGGCCM, LN-18, LN229, and SW1783 Cells
2.6. FLIM Microscopy of T98G Cells
3. Discussion
4. Materials and Methods
4.1. Cells and Culture Conditions
4.2. Lensoside Aβ (LAβ) Isolation
4.3. Drug Treatment
4.4. Microscopic Detection of Apoptosis, Autophagy, and Necrosis with Fluorochromes
4.5. Cell Death Detection by Flow Cytometry
4.6. Detection of Mitochondrial Membrane Potential by Flow Cytometry
4.7. Immunoblotting
4.8. Fourier-Transform Infrared Absorption Spectroscopy (FTIR) of Cells
4.9. Scanning Electron Microscopy (SEM) of Cells
4.10. Fluorescence Lifetime Imaging Microscopy (FLIM)
4.11. Chou–Talalay Method
4.12. Statistical Analysis
5. Conclusions
Supplementary Materials
Author Contributions
Funding
Institutional Review Board Statement
Informed Consent Statement
Data Availability Statement
Conflicts of Interest
Appendix A


References
- Gumienna, M.; Lasik, M.; Czarnecki, Z. Influence of plant extracts addition on the antioxidative properties of products obtained from green lentil seeds during in vitro digestion process. Pol. J. Food Nutr. Sci. 2009, 59, 295–298. [Google Scholar]
- Marathe, S.A.; Rajalakshmi, V.; Jamdar, S.N.; Sharma, A. Comparative study on antioxidant activity of different varieties of commonly consumed legumes in India. Food Chem. Toxicol. 2011, 49, 2005–2012. [Google Scholar] [CrossRef]
- Costa, G.E.A.; Queiroz-Monici, K.S.; Reis, S.M.P.M.; de Oliveira, A.C. Chemical composition, dietary fibre and resistant starch contents of raw and cooked pea, common bean, chickpea and lentil legumes. Food Chem. 2006, 94, 327–330. [Google Scholar] [CrossRef]
- Margier, M.; Georgé, S.; Hafnaoui, N.; Remond, D.; Nowicki, M.; Du Chaffaut, L.; Amiot, M.J.; Reboul, E. Nutritional composition and bioactive content of legumes: Characterization of pulses frequently consumed in France and effect of the cooking method. Nutrients 2018, 10, 1668. [Google Scholar] [CrossRef] [Green Version]
- Iwashina, T. The structure and distribution of the flavonoids in plants. J. Plant Res. 2000, 113, 287–299. [Google Scholar] [CrossRef]
- Perez-Vizcaino, F.; Fraga, C.G. Research trends in flavonoids and health. Arch. Biochem. Biophys. 2018, 646, 107–112. [Google Scholar] [CrossRef]
- Treutter, D. Significance of flavonoids in plant resistance: A review. Environ. Chem. Lett. 2006, 64, 147–157. [Google Scholar] [CrossRef]
- López, J.G. Flavonoids in Health and Disease. Curr. Med. Chem. 2019, 26, 6972–6975. [Google Scholar] [CrossRef]
- Pallauf, K.; Duckstein, N.; Rimbach, G. A literature review of flavonoids and lifespan in model organisms. Proc. Nutr. Soc. 2017, 76, 145–162. [Google Scholar] [CrossRef] [Green Version]
- Singh, B.; Singh, J.P.; Kaur, A.; Singh, N. Phenolic composition and antioxidant potential of grain legume seeds: A review. Food Res. Int. 2017, 101, 1–16. [Google Scholar] [CrossRef]
- Zou, Y.; Chang, S.K.; Gu, Y.; Qian, S.Y. Antioxidant activity and phenolic composition of lentil (Lens culinris var. Morton L.) extract and its fractions. J. Agric. Food Chem. 2011, 59, 2268–2276. [Google Scholar] [CrossRef] [Green Version]
- Grusak, M.A. Nutritional and health-beneficial quality. In Lentil: Botany, Production and Uses; Erskine, W., Muehlbauer, F., Sarker, A., Sharma, B., Eds.; CABI: Wallingford, UK, 2009; pp. 368–390. [Google Scholar]
- Troszyńska, A.; Estrella, I.; Lamparski, G.; Hernández, T.; Amarowicz, R.; Pegg, R.B. Relationship between the sensory quality of lentil (Lens culinaris) sprouts and their phenolic constituents. Food Res. Int. 2011, 44, 3195–3201. [Google Scholar] [CrossRef]
- Świeca, M.; Gawlik-Dziki, U.; Jakubczyk, A. Impact of density of breeding on the growth and some nutraceutical properties of ready-to-eat lentil (Lens culinaris) sprouts. Acta Sci. Pol. Hortorum Cultus 2013, 12, 19–29. [Google Scholar]
- Świeca, M.; Baraniak, B. Influence of elicitation with H2O2 on phenolics content, antioxidant potential and nutritional quality of Lens culinaris sprouts. J. Sci. Food Agric. 2014, 94, 489–496. [Google Scholar] [CrossRef]
- Żuchowski, J.; Pecio, Ł.; Stochmal, A. Novel flavonol glycosides from the aerial parts of lentil (Lens culinaris). Molecules 2014, 19, 18152–18178. [Google Scholar] [CrossRef] [PubMed] [Green Version]
- Żuchowski, J.; Rolnik, A.; Adach, W.; Stochmal, A.; Olas, B. Modulation of oxidative stress and hemostasis by flavonoids from lentil aerial parts. Molecules 2021, 26, 497. [Google Scholar] [CrossRef] [PubMed]
- Pawlikowska-Pawlega, B.; Kapral, J.; Gawron, A.; Stochmal, A.; Zuchowski, J.; Pecio, L.; Luchowski, R.; Grudzinski, W.; Gruszecki, W.I. Interaction of a quercetin derivative—Lensoside Aβ with liposomal membranes. Biochim. Biophys. Acta Biomembr. 2018, 1860, 292–299. [Google Scholar] [CrossRef] [PubMed]
- Jakubowicz-Gil, J.; Langner, E.; Bądziul, D.; Wertel, I.; Rzeski, W. Silencing of Hsp27 and Hsp72 in glioma cells as a tool for programmed cell death induction upon temozolomide and quercetin treatment. Toxicol. Appl. Pharmacol. 2013, 273, 580–589. [Google Scholar] [CrossRef]
- Jakubowicz-Gil, J.; Langner, E.; Wertel, I.; Piersiak, T.; Rzeski, W. Temozolomide, quercetin and cell death in the MOGGCCM astrocytoma cell line. Chem. Biol. Interact. 2010, 188, 190–203. [Google Scholar] [CrossRef] [PubMed]
- Weller, M.; Wick, W.; Aldape, K.; Brada, M.; Berger, M.; Pfister, S.M.; Nishikawa, R.; Rosenthal, M.; Wen, P.Y.; Stupp, R.; et al. Glioma. Nat. Rev. Dis. Primers 2015, 16, 15017. [Google Scholar] [CrossRef]
- Weller, M.; van den Bent, J.C.; Tonn, R.; Stupp, M.; Preusser, E.; Cohen-Jonathan-Moyal, E.; Henriksson, R.; Le Rhun, E.; Balana, C.; Chinot, O.; et al. European Association for Neuro-Oncology (EANO) guideline on the diagnosis and treatment of adult astrocytic and oligodendroglial gliomas. Lancet Oncol. 2017, 18, e315–e329. [Google Scholar] [CrossRef] [Green Version]
- Louis, D.N.; Perry, A.; Reifenberger, G.; von Deimling, A.; Figarella-Branger, D.; Cavenee, W.K.; Ohgaki, H.; Wiestler, O.D.; Kleihues, P.; Ellison, D.W. The 2016 World Health Organization classification of tumors of the central nervous system: A summary. Acta Neuropathol. 2016, 131, 803–820. [Google Scholar] [CrossRef] [PubMed] [Green Version]
- Maraka, S.; Janku, F. BRAF alterations in primary brain tumors. Discov. Med. 2018, 26, 51–60. [Google Scholar] [PubMed]
- Jo, Y.; Kim, E.H.; Sai, S.; Kim, J.S.; Cho, J.M.; Kim, H.; Baek, J.H.; Kim, J.Y.; Hwang, S.G.; Yoon, M. Functional biological activity of sorafenib as a tumor-treating field sensitizer for glioblastoma therapy. Int. J. Mol. Sci. 2018, 19, 3684. [Google Scholar] [CrossRef] [Green Version]
- Sieglin, M.D.; Raskett, C.M.; Gilbert, C.A.; Ross, A.H.; Altieri, D.C. Sorafenib exerts anti-glioma activity in vitro and in vivo. Neurosci. Lett. 2010, 478, 165–170. [Google Scholar] [CrossRef] [Green Version]
- Jakubowicz-Gil, J.; Langner, E.; Bądziul, D.; Wertel, I.; Rzeski, W. Quercetin and sorafenib as a novel and effective couple in programmed cell death induction in human gliomas. Neurotox. Res. 2014, 26, 64–77. [Google Scholar] [CrossRef] [Green Version]
- Tamm, L.K.; Tatulian, S.A. Infrared spectroscopy of proteins and peptides in lipid bilayers. Q. Rev. Biophys. 1997, 30, 365–429. [Google Scholar] [CrossRef] [Green Version]
- Omuro, A.M.; Faivre, S.; Raymond, E. Lessons learned in the development of targeted therapy for malignant gliomas. Mol. Cancer Ther. 2007, 6, 1909–1919. [Google Scholar] [CrossRef] [Green Version]
- Shingu, T.; Holmes, L.; Henry, V.; Wang, Q.; Latha, K.; Gururaj, A.E.; Gibson, L.A.; Doucette, T.; Lang, F.F.; Rao, G.; et al. Suppression of RAF/MEK or PI3K synergizes cytotoxicity of receptor tyrosine kinase inhibitors in glioma tumor-initiating cells. J. Transl. Med. 2016, 14, 46. [Google Scholar] [CrossRef] [Green Version]
- Le Rhun, E.; Preusser, M.; Roth, P.; Reardon, D.A.; van den Bent, M.; Wen, P.; Reifenberger, G.; Weller, M. Molecular targeted therapy of glioblastoma. Cancer Treat. Rev. 2019, 80, 101896. [Google Scholar] [CrossRef] [PubMed]
- Lo, H.W. Targeting Ras–RAF–ERK and its interactive pathways as a novel therapy for malignant gliomas. Curr. Cancer Drug Targets 2010, 10, 840–848. [Google Scholar] [CrossRef] [PubMed]
- Hahn, O.; Stadler, W. Sorafenib. Curr. Opin. Oncol. 2006, 18, 615–662. [Google Scholar] [CrossRef]
- Yang, F.; Brown, C.; Buettner, R.; Hedvat, M.; Starr, R.; Scuto, A.; Schroeder, A.; Jensen, M.; Jove, R. Sorafenib induces growth arrest and apoptosis of human glioblastoma cells through the dephosphorylation of signal transducers and activators of transcription 3. Mol. Cancer Ther. 2010, 9, 953–962. [Google Scholar] [CrossRef] [PubMed] [Green Version]
- Xiao, J. Dietary flavonoid aglycones and their glycosides: Which show better biological significance? Crit. Rev. Food Sci. Nutr. 2017, 57, 1874–1905. [Google Scholar] [CrossRef] [PubMed]
- Lefranc, F.; Kiss, R. Autophagy, the Trojan horse to combat glioblastomas. Neurosurg. Focus 2006, 20, E7. [Google Scholar] [CrossRef]
- Feng, F.; Zhang, M.; Yang, C.; Heng, X.; Wu, X. The dual roles of autophagy in gliomagenesis and clinical therapy strategies based on autophagic regulation mechanisms. Biomed. Pharmacother. 2019, 120, 109441. [Google Scholar] [CrossRef]
- Luo, S.; Rubinsztein, D.C. Apoptosis blocks beclin 1-dependent autophagosome synthesis—an effect reduced by Bcl-xL. Cell Death Differ. 2010, 17, 268–277. [Google Scholar] [CrossRef] [Green Version]
- Wirawan, E.V.W.; van de Walle, L.; Kersse, K.; Cornelis, S.; Claerhout, S.; Vanoverberghe, I.; Roelandt, R.; De Rycke, R.; Verspurten, J.; Declerq, W.; et al. Caspase-mediated cleavage of beclin 1 inactivates beclin1-induced autophagy and enhances apoptosis by promoting the release of proapoptotic factors from mito- chondria. Cell Death Dis. 2010, 1, e18. [Google Scholar] [CrossRef] [PubMed]
- Zelig, U.; Kapelushnik, J.; Moreh, R.; Mordechai, S.; Nathan, I. Diagnosis of cell death by means of infrared spectroscopy. Biophys. J. 2009, 97, 2107–2114. [Google Scholar] [CrossRef] [Green Version]
- Gasparri, F.; Muzio, M. Monitoring of apoptosis of HL 60 cells by Fourier-transform infrared spectroscopy. Biochem. J. 2003, 369, 239–248. [Google Scholar] [CrossRef] [Green Version]
- Raouf, G.A.; Khorsid, F.A.; Kumosani, T.A. Ft-IR spectroscopy as a tool for identification of apoptosis-induced structural changes in A549 cells treated with PM 701. Int. J. Nano Biomater. 2009, 2, 396–408. [Google Scholar]
- Liu, K.Z.; Jia, L.; Kelsey, J.S.M.; Newland, S.M.; Mantsch, A.C. Quantitative determination of apoptosis on leukemia cells by infrared spectroscopy. Apoptosis 2001, 6, 269–278. [Google Scholar] [CrossRef] [PubMed]
- Hoa, N.T.; Ge, L.; Erickson, K.L.; Kruse, C.A.; Cornforth, A.N.; Kuznetsov, Y.; McPherson, A.; Martini, F.; Jadus, M.R. Fascin-1 knock-down of human glioma cells reduces their microvilli/filopodia while improving their susceptibility to lymphocyte-mediated cytotoxicity. Am. J. Transl. Res. 2015, 7, 271–284. [Google Scholar]
- Hoa, N.T.; Ge, L.; Kuznetsov, Y.; McPherson, A.; Cornforth, A.N.; Pham, J.T.H.; Myers, M.P.; Ahmed, N.M.; Salsman, V.S.; Lamb, L.S.; et al. Glioma cells display complex cell surface topographies that resist the actions of cytolytic effector lymphocytes. J. Immunol. 2010, 185, 4793–4803. [Google Scholar] [CrossRef] [Green Version]
- Bradford, M.M. A rapid and sensitive method for quantitation of microgram quantities of protein utilizing the principle of protein-dye binding. Anal. Biochem. 1976, 72, 248–254. [Google Scholar] [CrossRef]
- Laemmli, U.K. Cleavage of structural proteins during the assembly of the head of bacteriophage T4. Nature 1970, 227, 680–685. [Google Scholar] [CrossRef] [PubMed]
- Pawlikowska-Pawlęga, B.; Dziubińska, H.; Król, E.; Trębacz, K.; Jarosz-Wilkołazka, A.; Paduch, R.; Gawron, A.; Gruszecki, W.I. Characteristics of quercetin interactions with liposomal and vacuolar membranes. Biochim. Biophys. Acta Biomembr. 2014, 1838, 254–265. [Google Scholar] [CrossRef] [Green Version]
- Pawlikowska-Pawlega, B.; Misiak, L.E.; Jarosz-Wilkołazaka, A.; Zarzyka, B.; Paduch, R.; Gawron, A.; Gruszecki, W.I. Biophysical characterization of genistein-membrane interaction and its correlation with biological effect on cells—The case of EYPC liposomes and human erythrocyte membranes. Biochim. Biophys. Acta 2014, 1838, 2127–2138. [Google Scholar] [CrossRef] [PubMed] [Green Version]
- Grela, E.; Zdybicka-Barabas, A.; Pawlikowska-Pawlega, B.; Cytrynska, M.; Wlodarczyk, M.; Grudzinski, W.; Luchowski, R.; Gruszecki, W.I. Modes of the antibiotic activity of amphotericin B against Candida albicans. Sci. Rep. 2019, 9, 17029. [Google Scholar] [CrossRef] [PubMed] [Green Version]


Publisher’s Note: MDPI stays neutral with regard to jurisdictional claims in published maps and institutional affiliations. |
© 2021 by the authors. Licensee MDPI, Basel, Switzerland. This article is an open access article distributed under the terms and conditions of the Creative Commons Attribution (CC BY) license (https://creativecommons.org/licenses/by/4.0/).
Share and Cite
Maciejczyk, A.; Kapral-Piotrowska, J.; Sumorek-Wiadro, J.; Zając, A.; Grela, E.; Luchowski, R.; Gruszecki, W.I.; Lemieszek, M.K.; Wertel, I.; Pecio, Ł.; et al. Lensoside Aβ as an Adjuvant to the Anti-Glioma Potential of Sorafenib. Cancers 2021, 13, 2637. https://doi.org/10.3390/cancers13112637
Maciejczyk A, Kapral-Piotrowska J, Sumorek-Wiadro J, Zając A, Grela E, Luchowski R, Gruszecki WI, Lemieszek MK, Wertel I, Pecio Ł, et al. Lensoside Aβ as an Adjuvant to the Anti-Glioma Potential of Sorafenib. Cancers. 2021; 13(11):2637. https://doi.org/10.3390/cancers13112637
Chicago/Turabian StyleMaciejczyk, Aleksandra, Justyna Kapral-Piotrowska, Joanna Sumorek-Wiadro, Adrian Zając, Ewa Grela, Rafał Luchowski, Wiesław I. Gruszecki, Marta Kinga Lemieszek, Iwona Wertel, Łukasz Pecio, and et al. 2021. "Lensoside Aβ as an Adjuvant to the Anti-Glioma Potential of Sorafenib" Cancers 13, no. 11: 2637. https://doi.org/10.3390/cancers13112637