lncRNAs–mRNAs Co–Expression Network Underlying Childhood B–Cell Acute Lymphoblastic Leukaemia: A Pilot Study

 , ,
, ,  , and
, and
Abstract
:Simple Summary
Abstract
1. Introduction
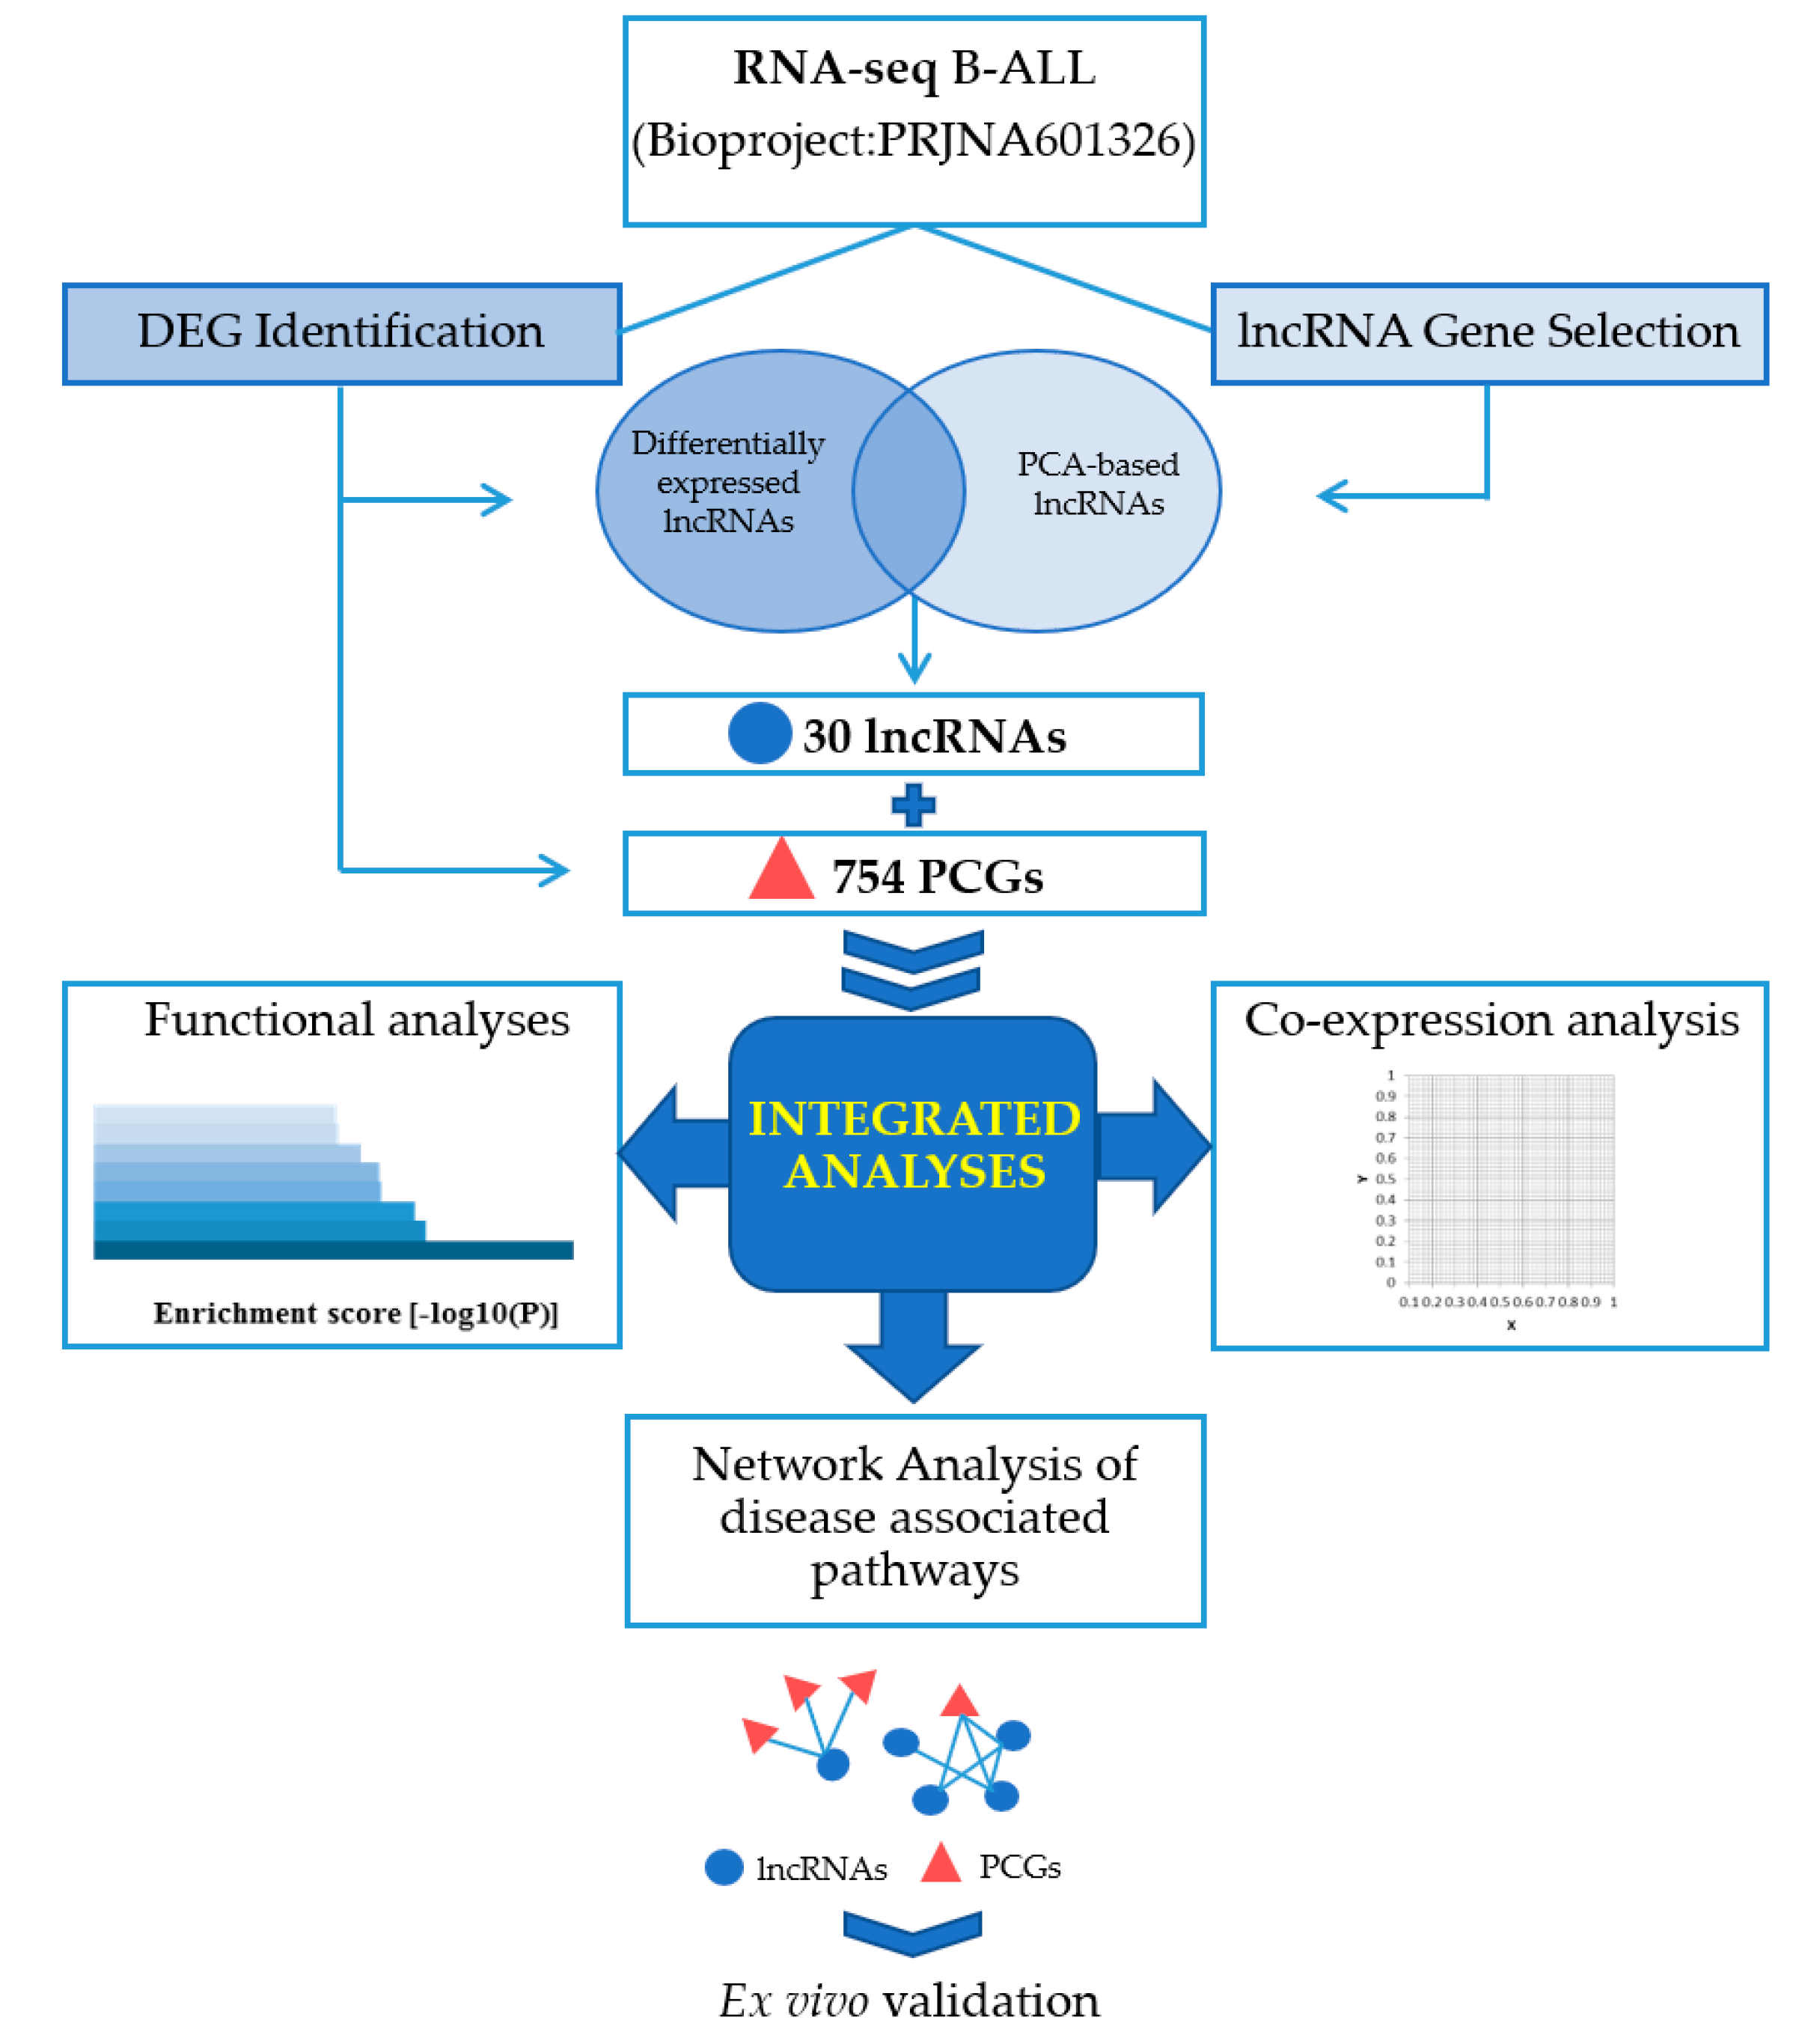
2. Results
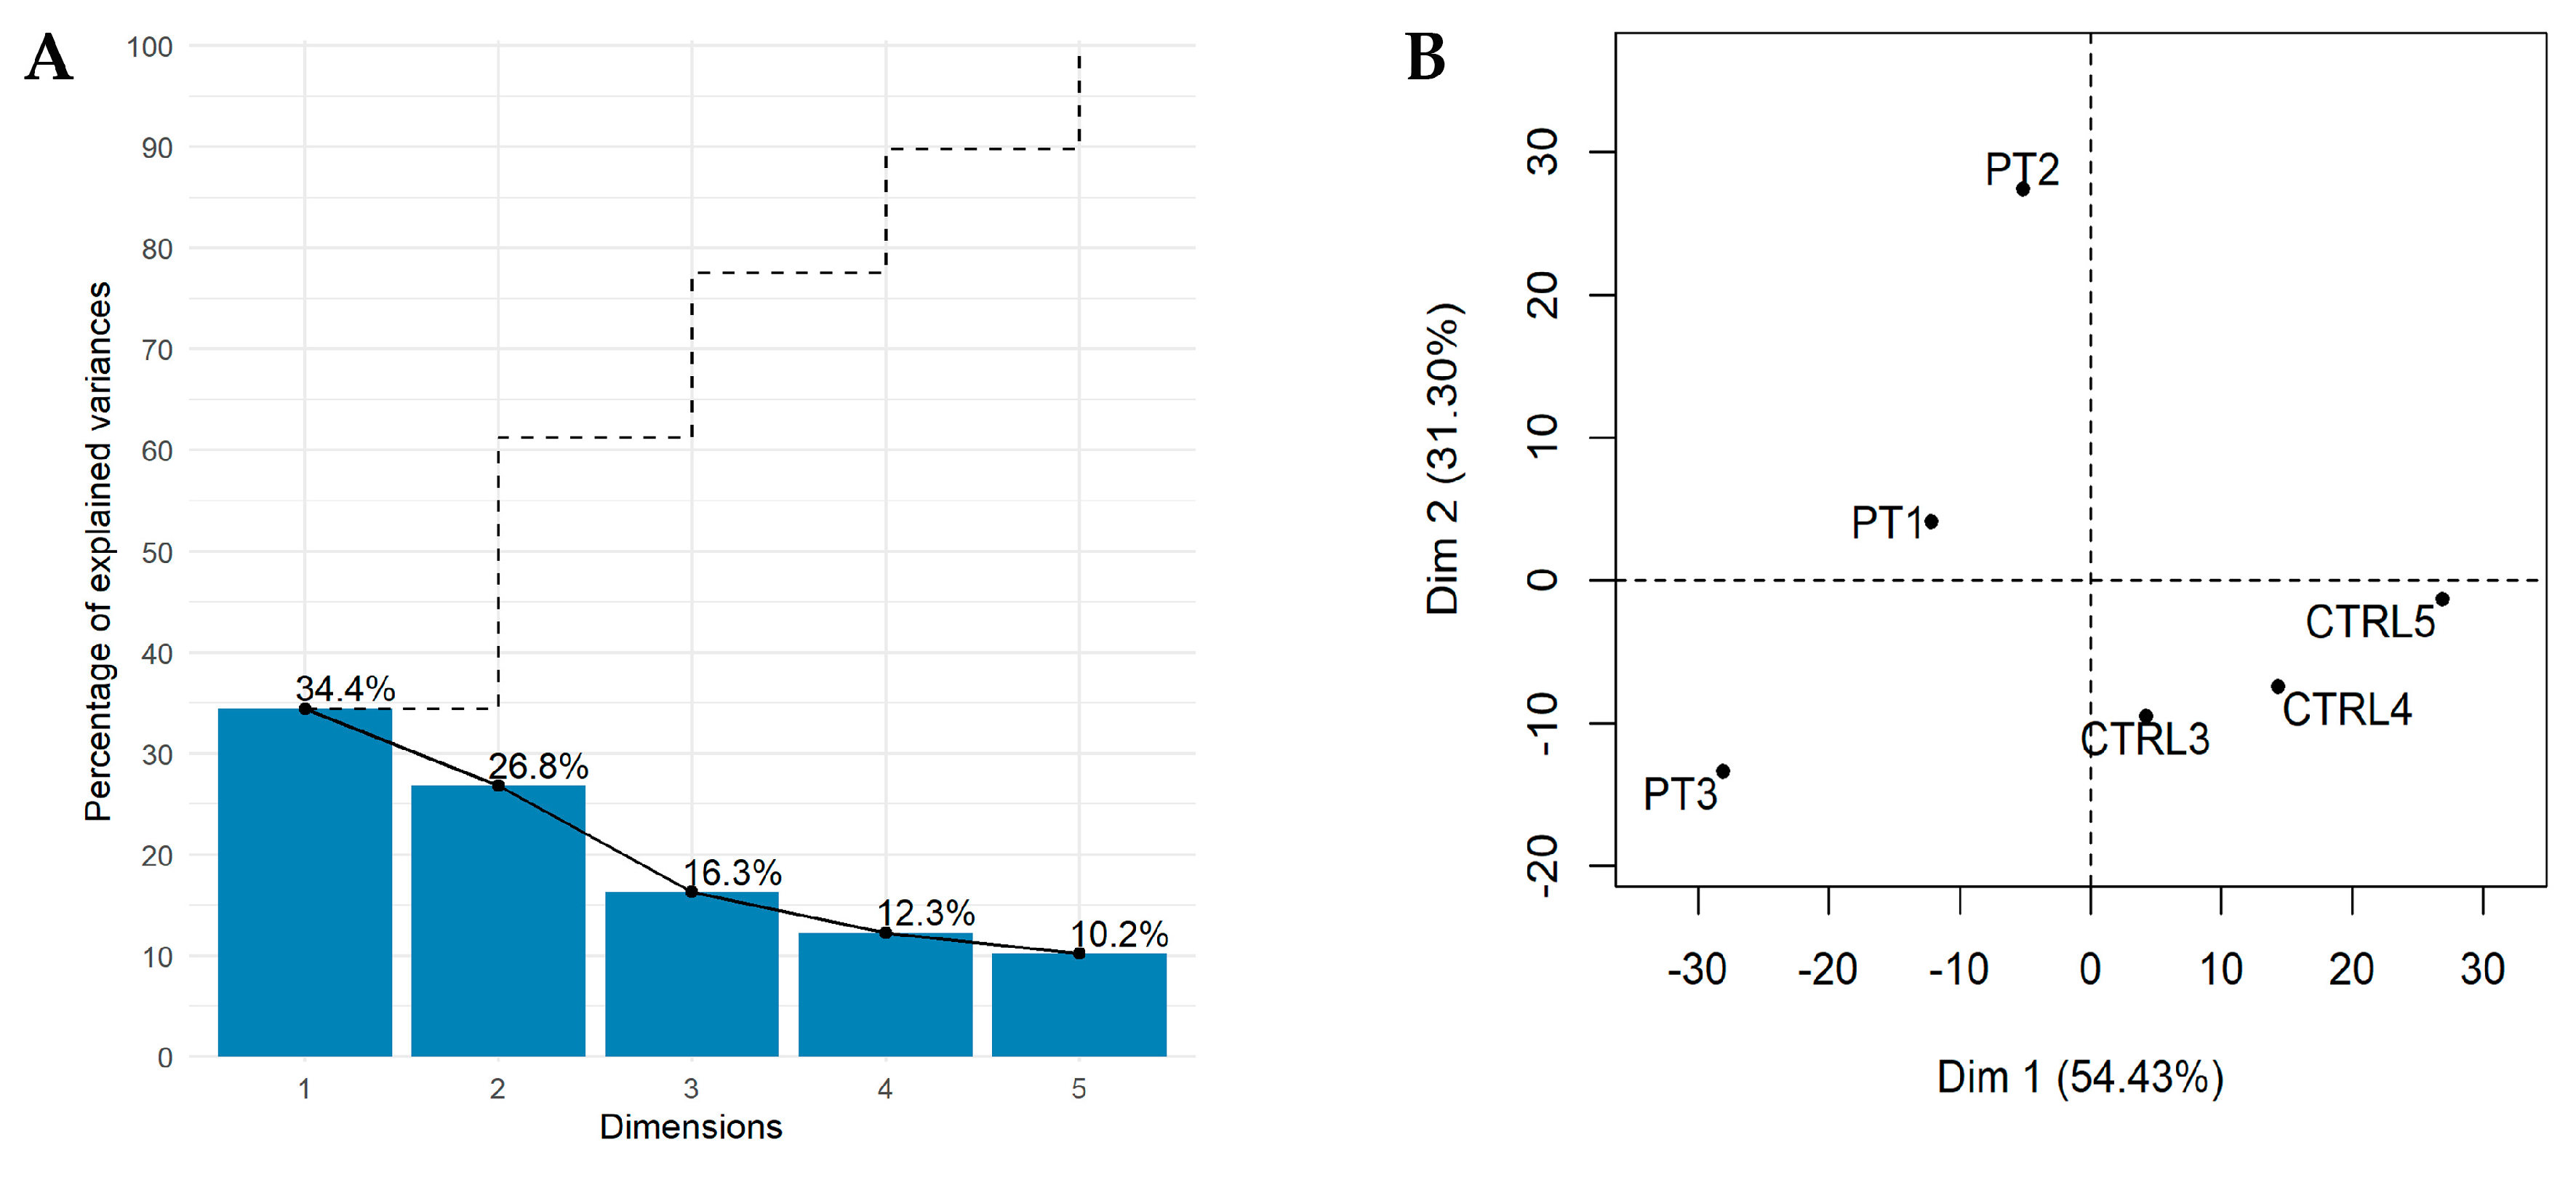
2.1. The Landscape of B–ALL Transcriptome
2.2. Identification of Key lncRNAs in B–ALL through Unsupervised PCA–Based Feature Extraction (FE) Approach
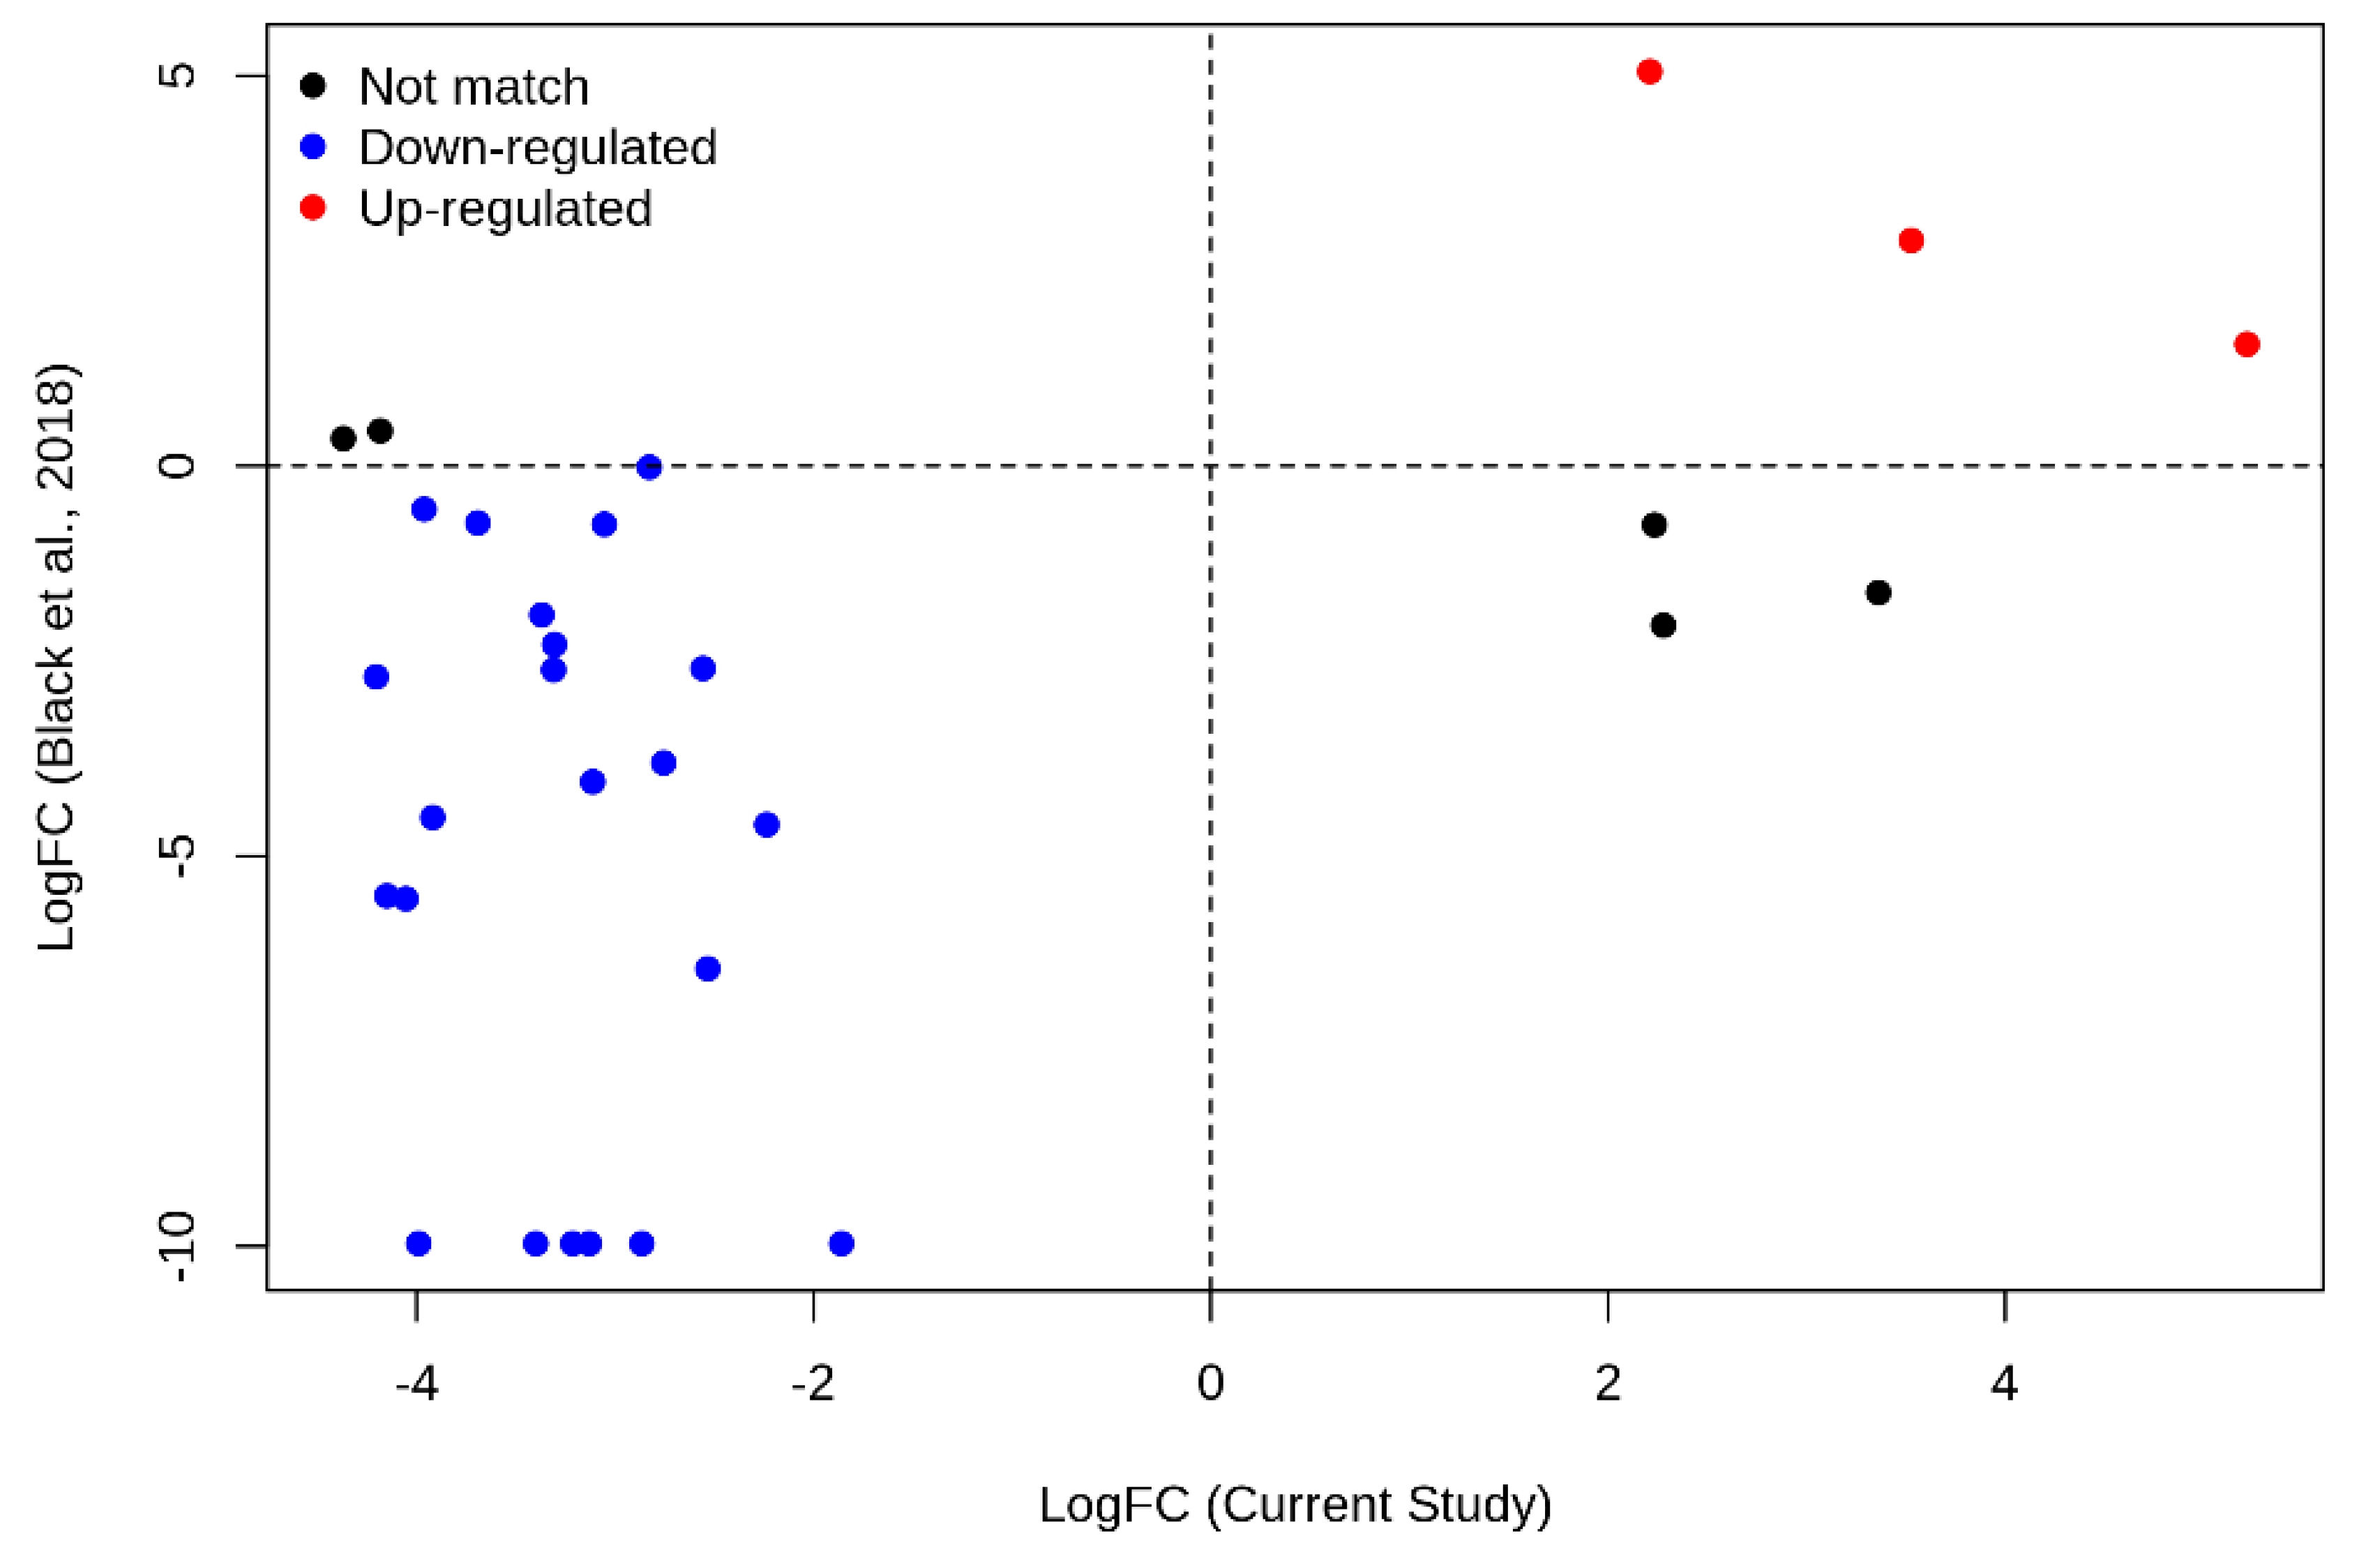
2.3. lncRNA Signature as Diagnostic Candidate for B–ALL
2.4. Functional Analyses and Co–Expression Network
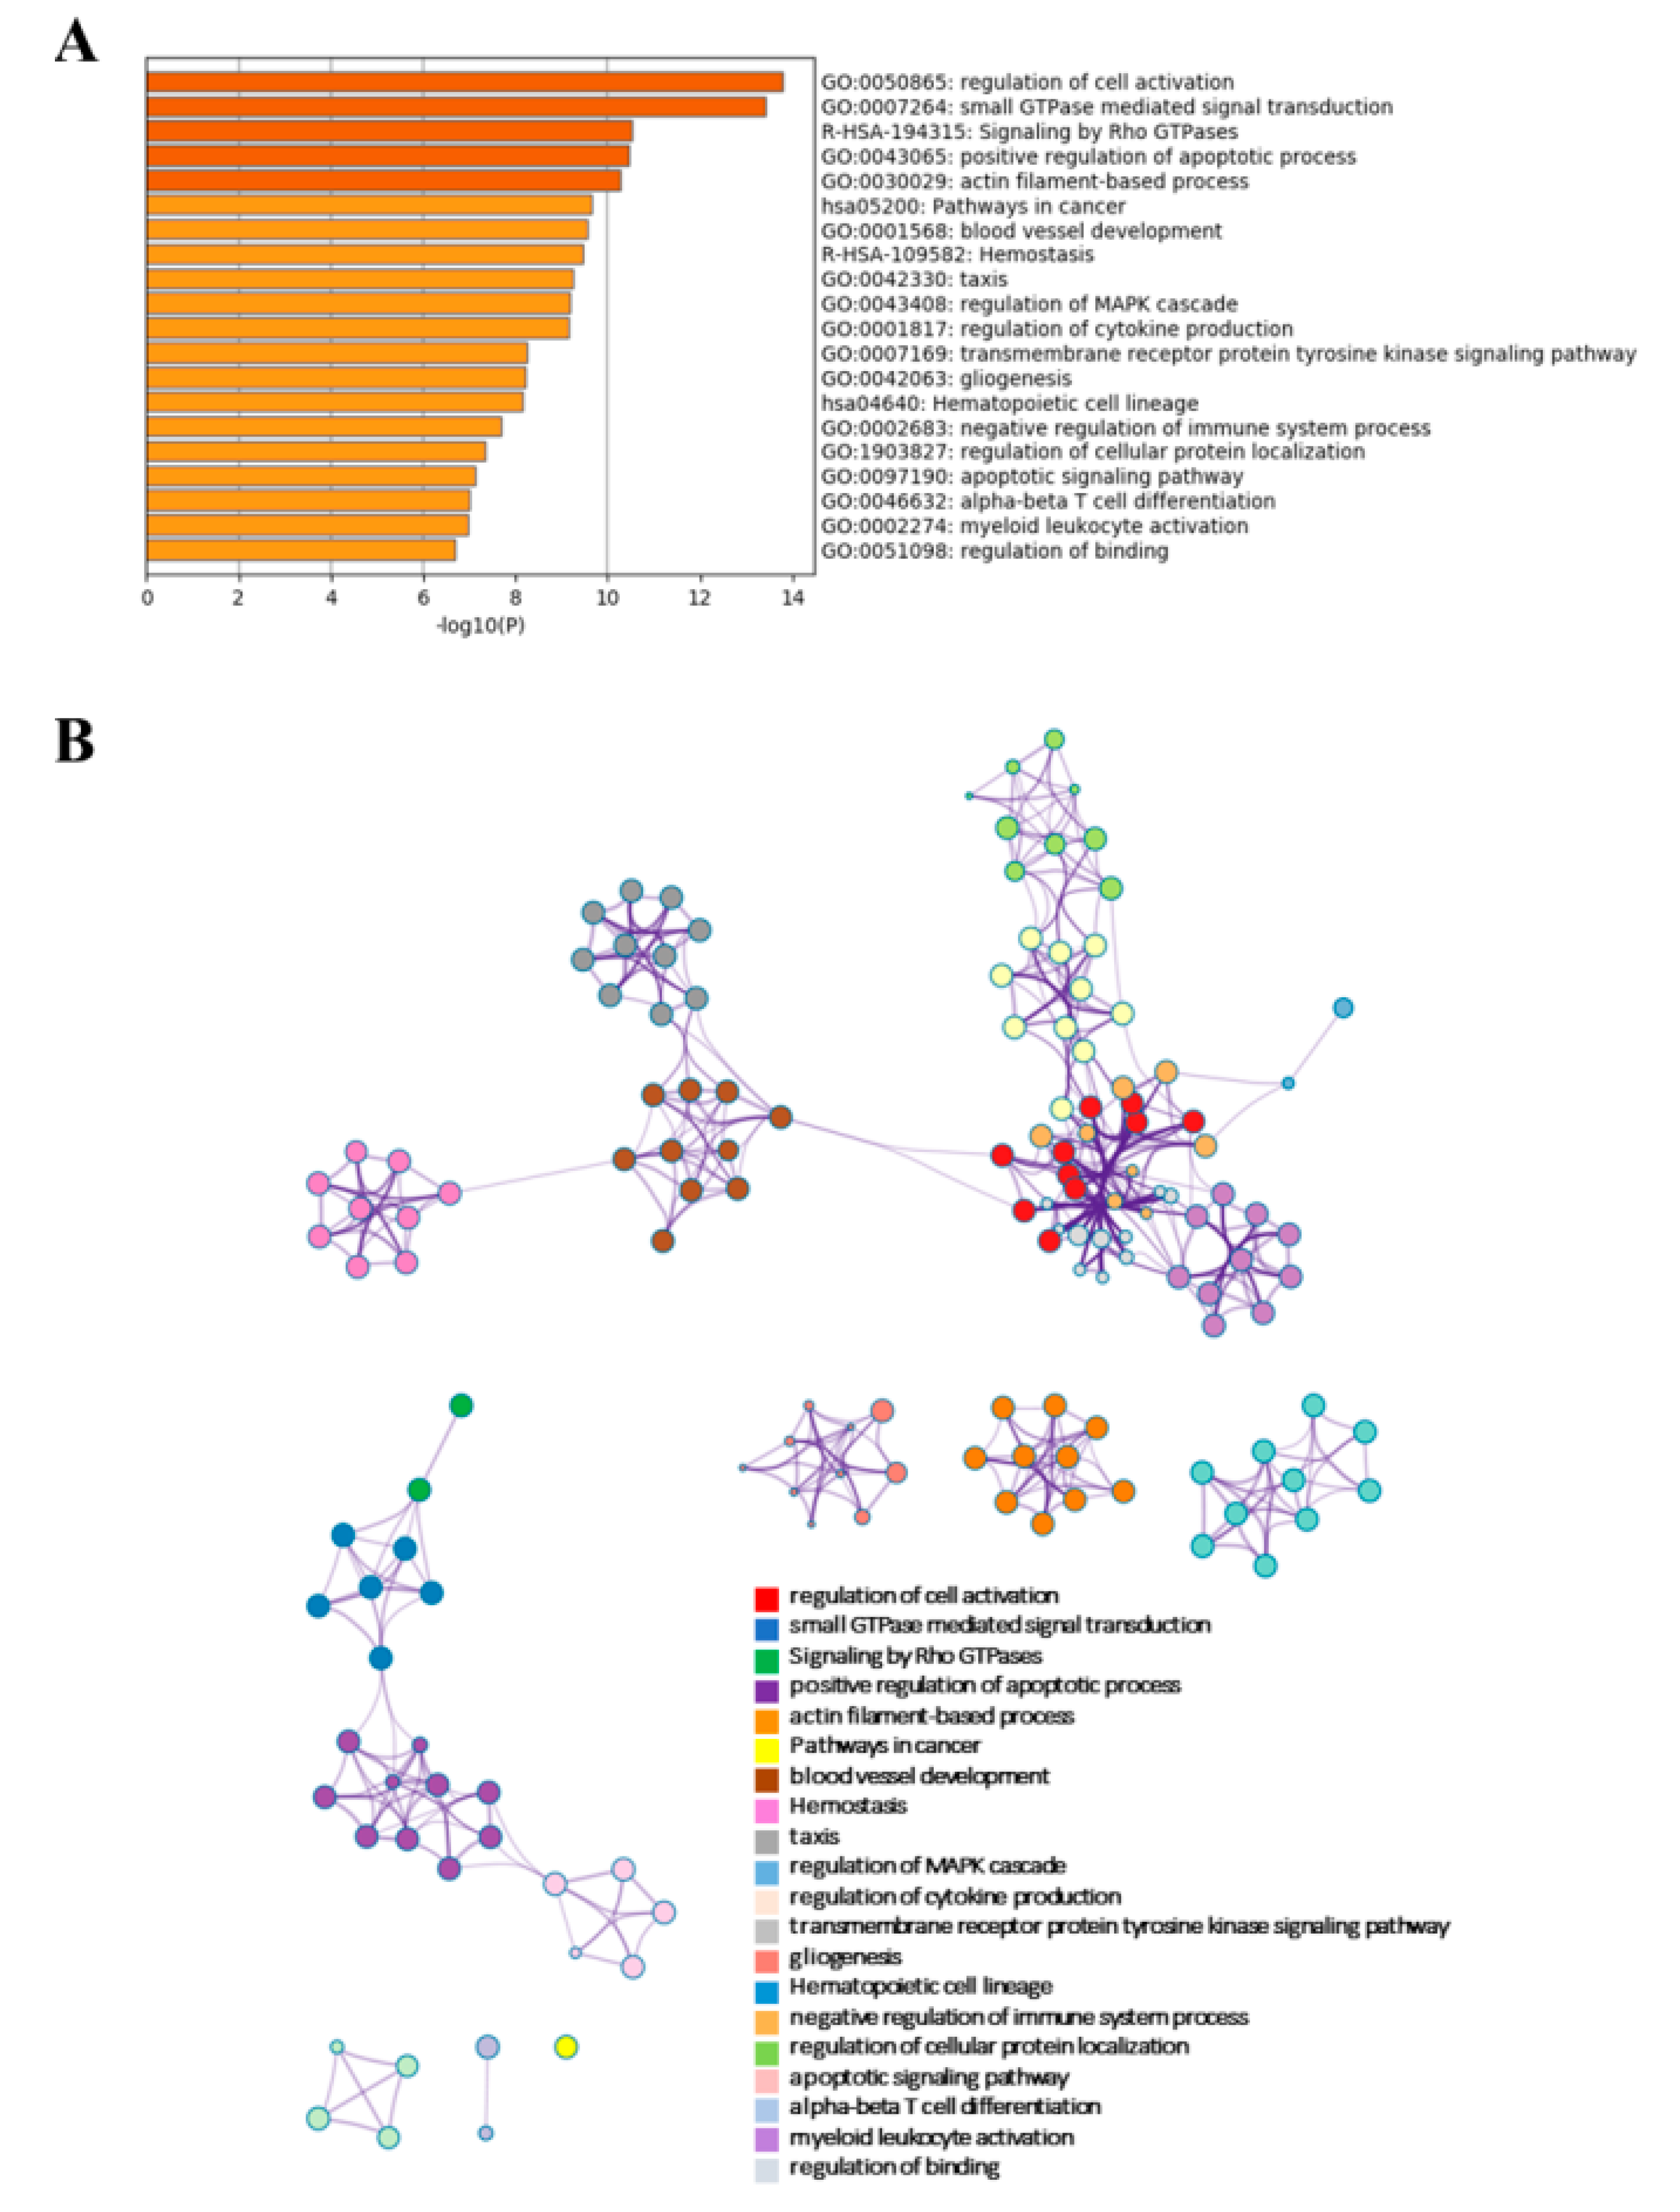
2.4.1. Signalling Pathways of Differentially Expressed mRNAs and lncRNAs
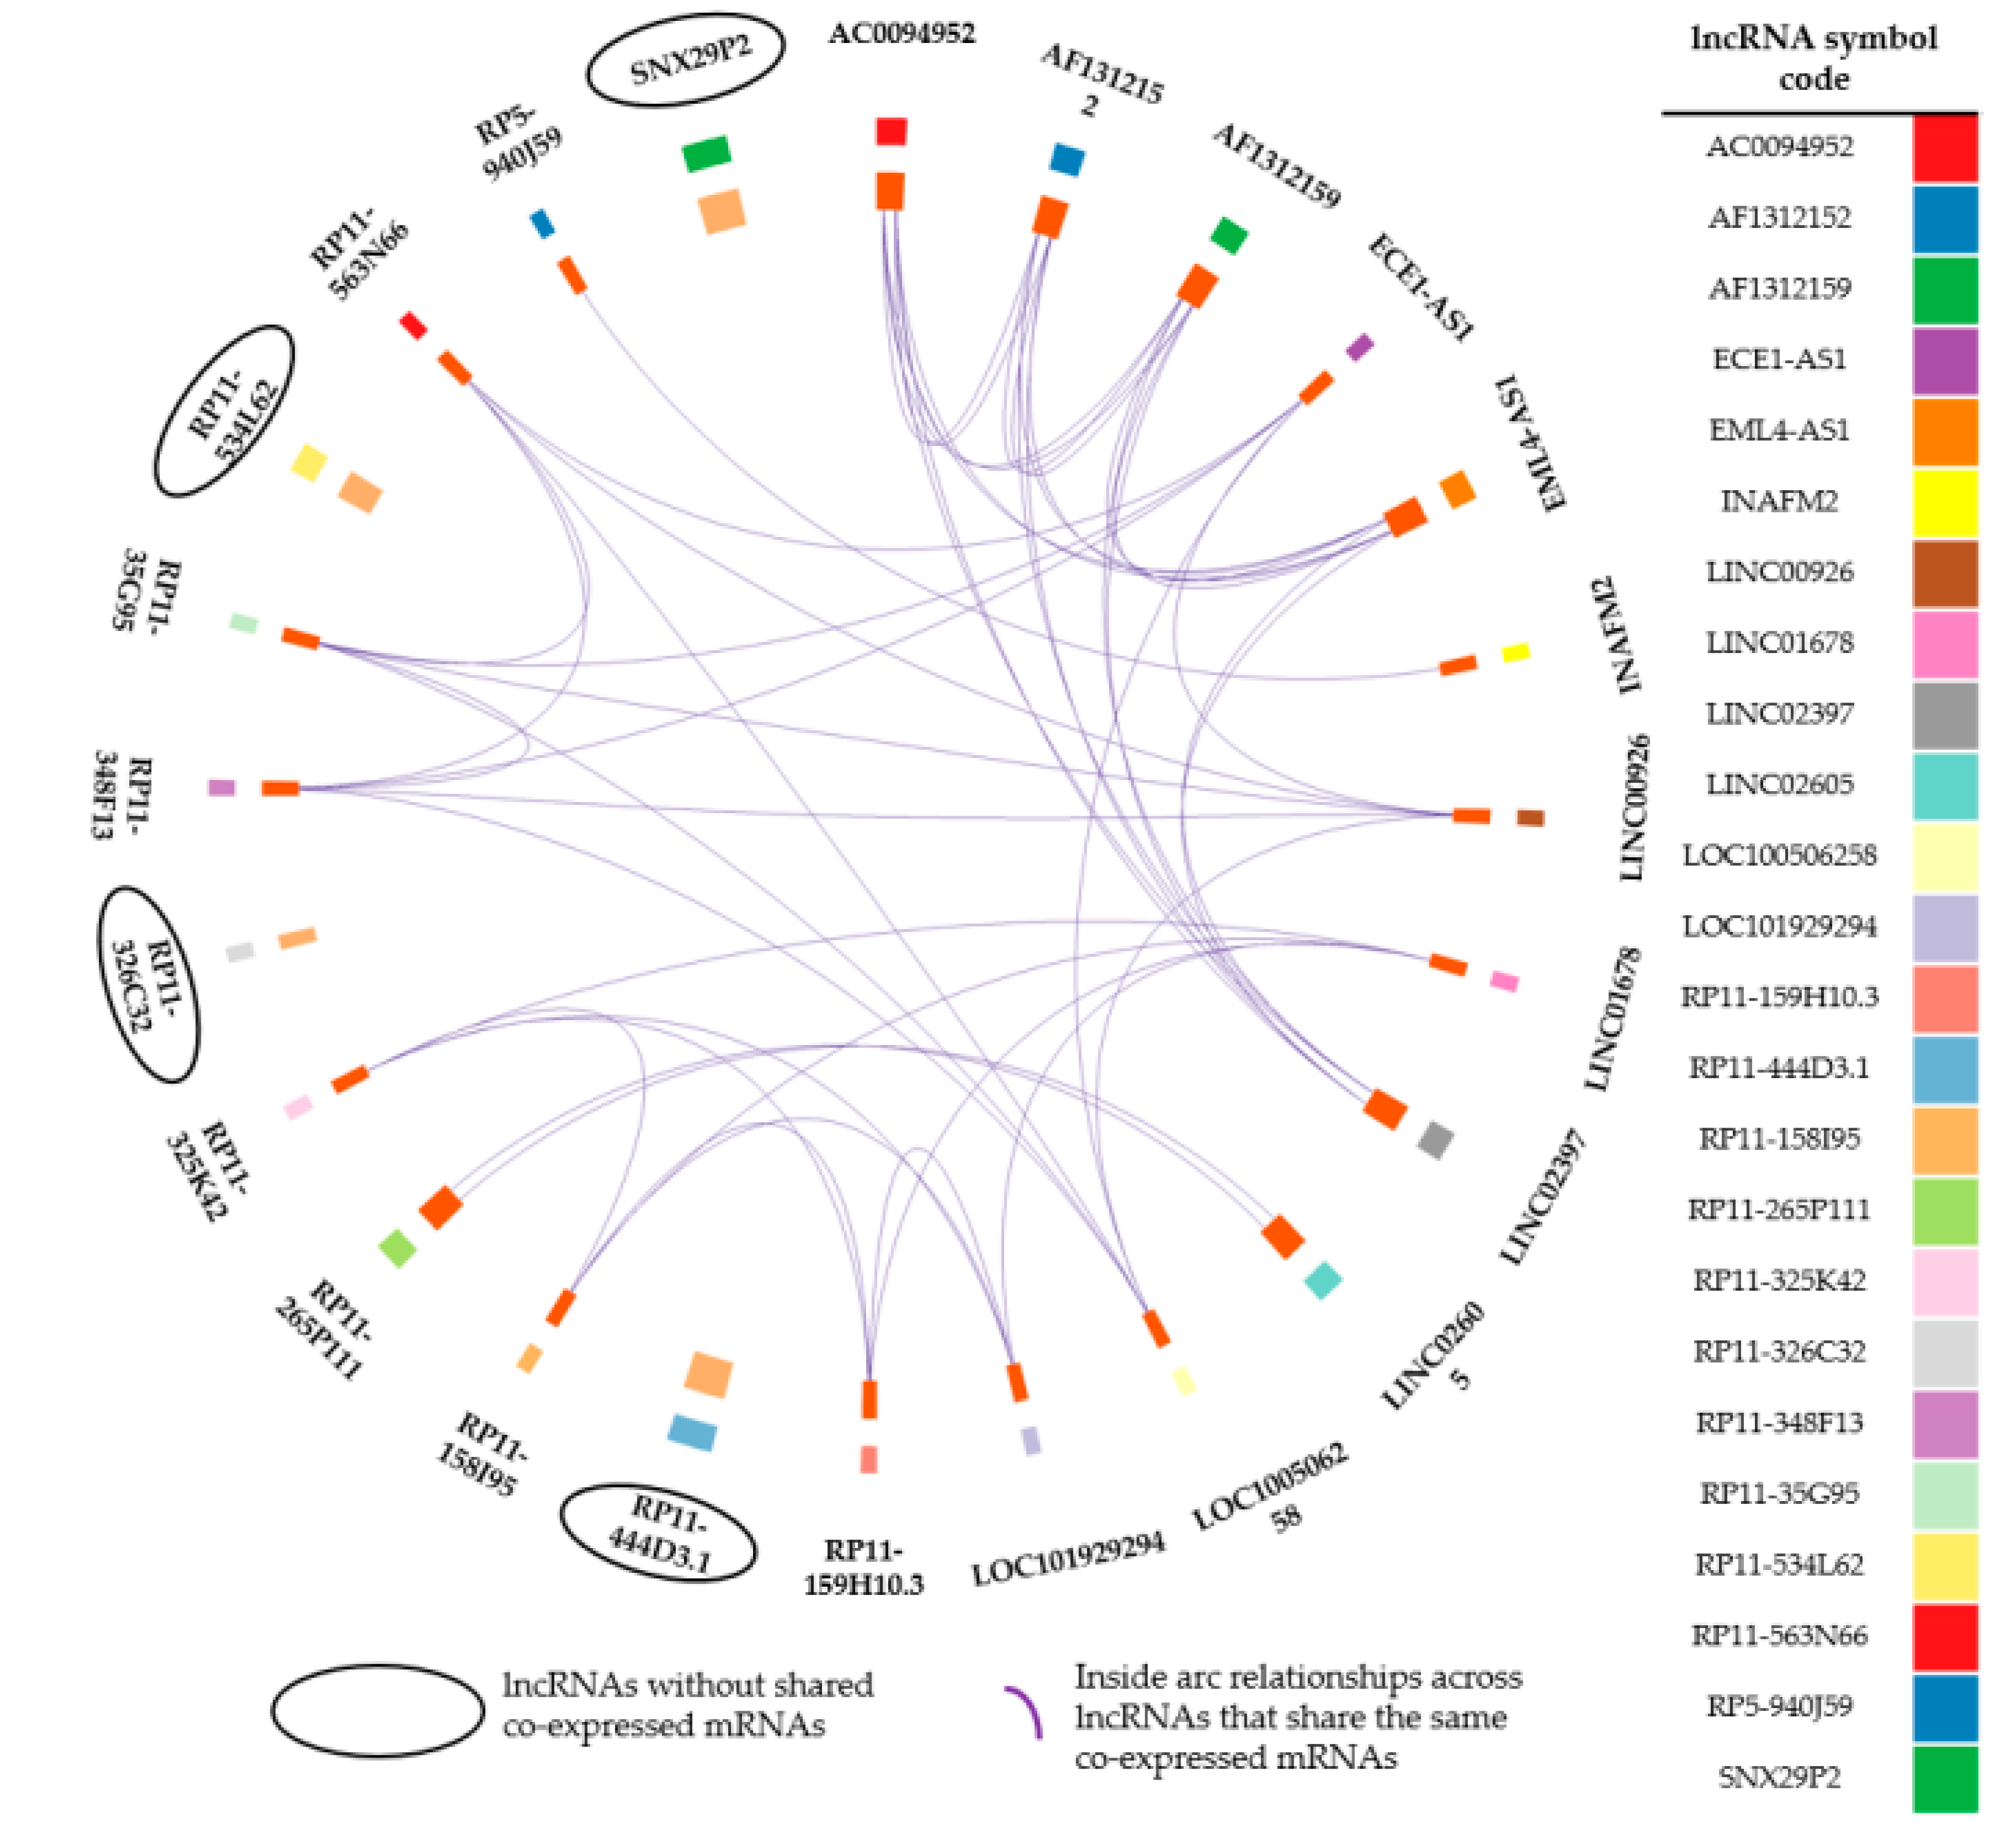
2.4.2. lncRNA–mRNA Co–Expression Network
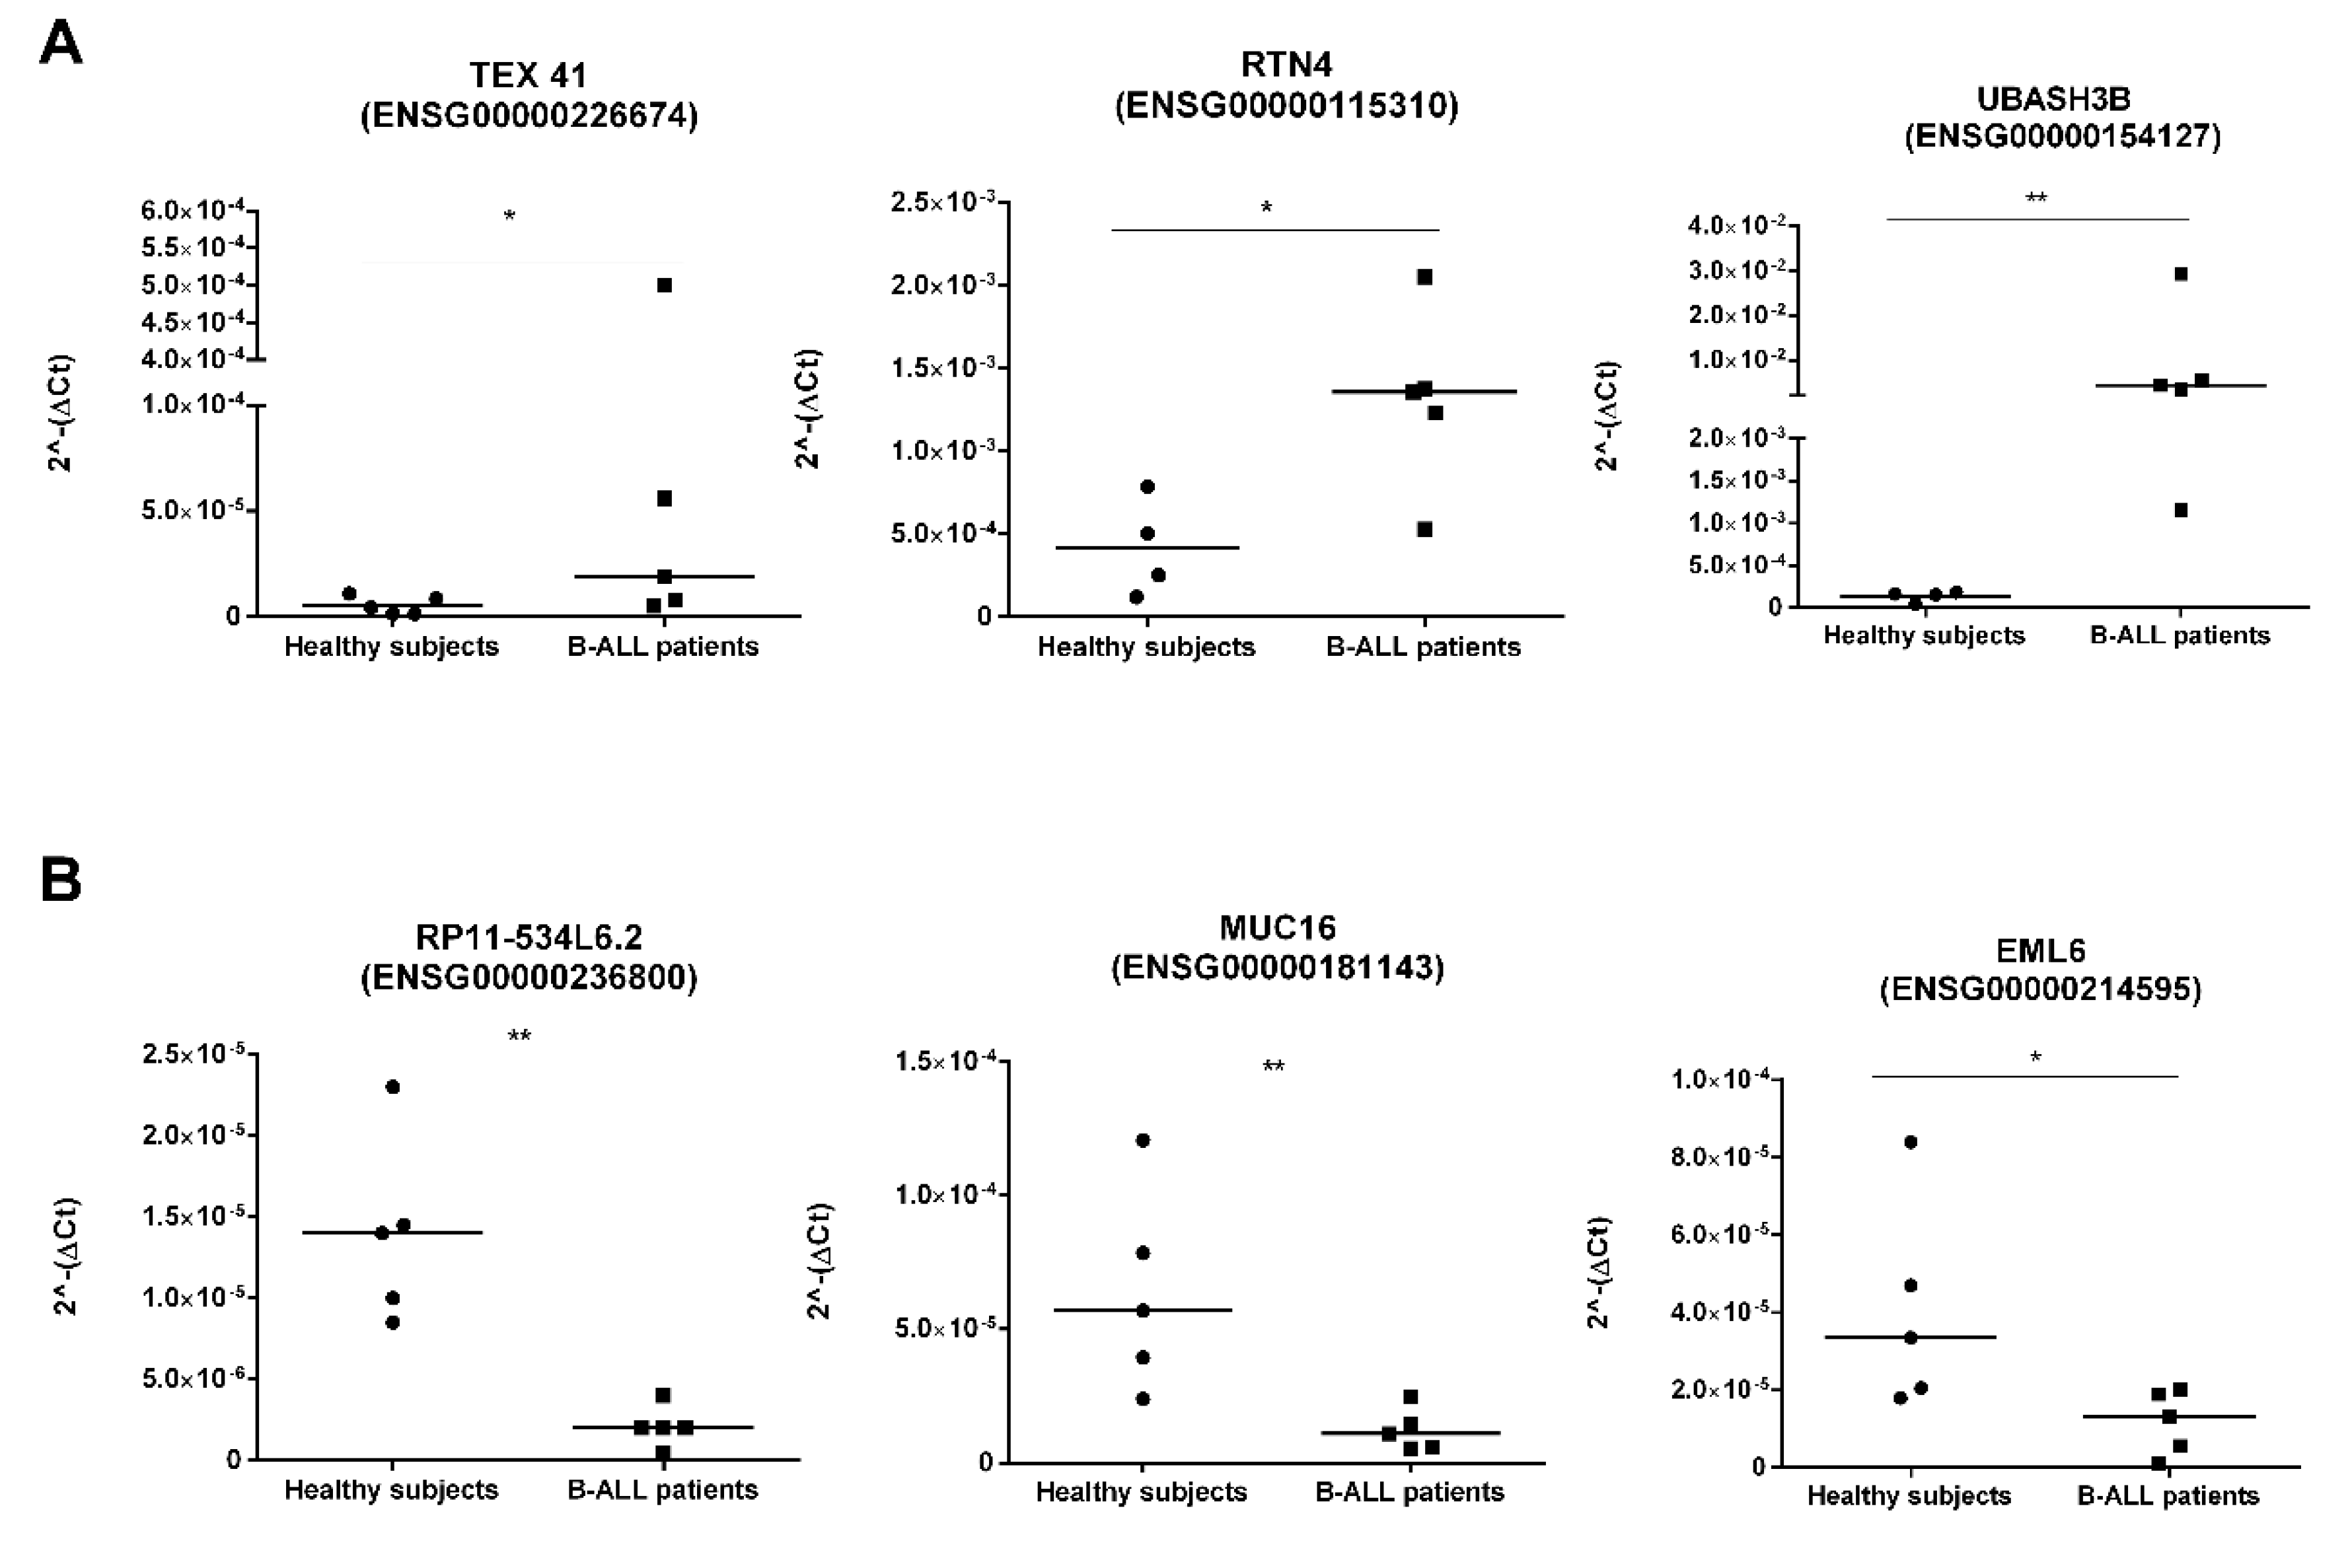
2.4.3. Ex–Vivo Validation
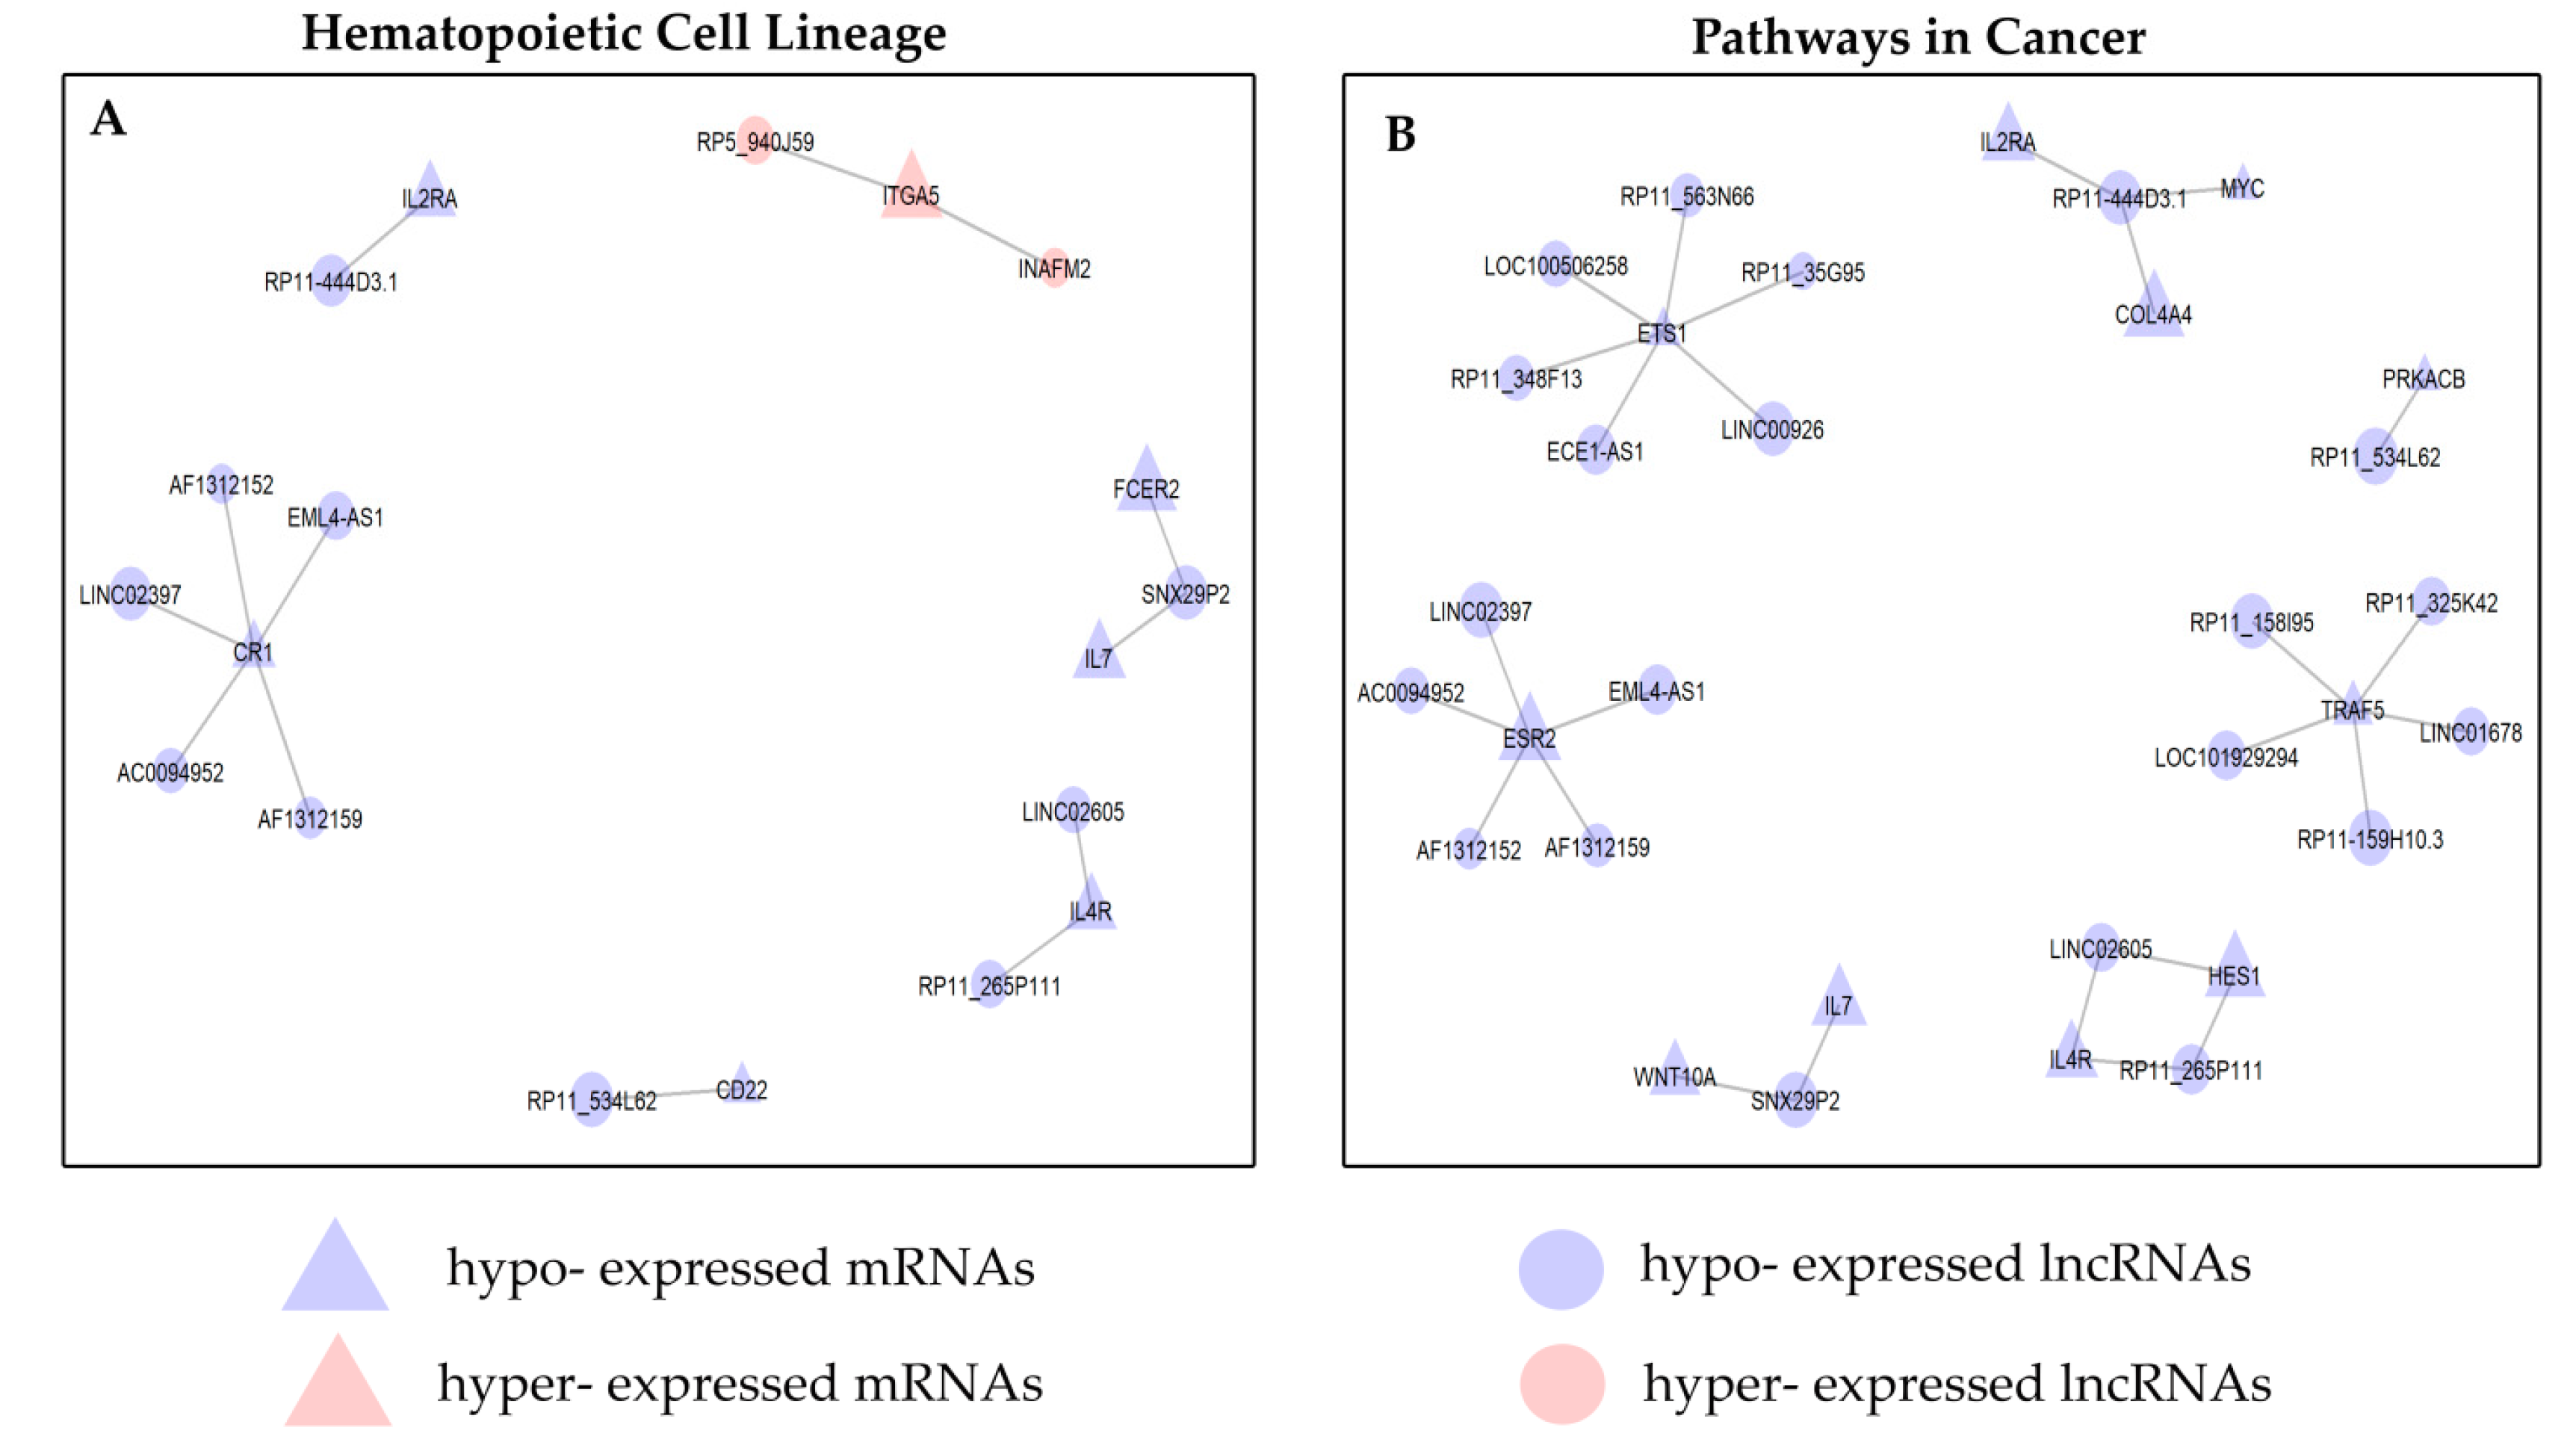
2.4.4. KEGG Analysis of B–ALL Disease Associated Pathways
2.4.5. Prediction of lncRNA Functions
3. Discussion
4. Materials and Methods
4.1. Identification of Differentially Expressed mRNAs and lncRNAs in B–ALL
4.2. Gene Selection Using PCA–Based Unsupervised Feature Extraction (FE) Approach
4.3. In–Silico Validation
4.4. Ex Vivo Validation
4.5. Functional Enrichment Analysis and Guilt–By–Association Approach
4.6. Co–Expression Network Construction
4.7. Statistical Analysis
5. Conclusions
Supplementary Materials
Author Contributions
Funding
Conflicts of Interest
References
- Inaba, H.; Greaves, M.; Mullighan, C.G. Acute lymphoblastic leukaemia. Lancet 2013, 381, 1943–1955. [Google Scholar] [CrossRef] [Green Version]
- Bhojwani, D.; Yang, J.J.; Pui, C.-H. Biology of childhood acute lymphoblastic leukaemia. Paediatr. Clin. 2015, 62, 47–60. [Google Scholar]
- Bhojwani, D.; Pui, C.H. Relapsed childhood acute lymphoblastic leukaemia. Lancet Oncol. 2013, 14, e205–e217. [Google Scholar] [CrossRef]
- Hulsen, T.; Jamuar, S.S.; Moody, A.R.; Karnes, J.H.; Varga, O.; Hedensted, S.; Spreafico, R.; Hafler, D.A.; McKinney, E.F. From big data to precision medicine. Front. Med. 2019, 6. [Google Scholar] [CrossRef] [Green Version]
- Vrooman, L.M.; Silverman, L.B. Treatment of childhood acute lymphoblastic leukaemia: Prognostic factors and clinical advances. Curr. Hematol. Malig. Rep. 2016, 11, 385–394. [Google Scholar] [CrossRef] [PubMed]
- Inaba, H.; Azzato, E.M.; Mullighan, C.G. Integration of next-generation sequencing to treat acute lymphoblastic leukaemia with targetable lesions: The St. Jude children’s research hospital approach. Front. Paediatr. 2017, 5, 258. [Google Scholar] [CrossRef]
- Fernandes, J.C.R.; Acuña, S.M.; Aoki, J.I.; Floeter-Winter, L.M.; Muxel, S.M. Long non-coding RNAs in the regulation of gene expression: Physiology and disease. Noncoding RNA 2019, 5, 17. [Google Scholar] [CrossRef] [PubMed] [Green Version]
- Gioia, R.; Drouin, S.; Ouimet, M.; Caron, M.; St-Onge, P.; Richer, C.; Sinnett, D. LncRNAs downregulated in childhood acute lymphoblastic leukemia modulate apoptosis, cell migration, and DNA damage response. Oncotarget 2017, 8, 80645–80650. [Google Scholar] [CrossRef] [Green Version]
- Acha-Sagredo, A.; Uko, B.; Pantazi, P.; Bediaga, N.G.; Moschandrea, C.; Rainbow, L.; Marcus, M.W.; Davies, M.P.; Field, J.K.; Liloglou, T. Long non-coding RNA dysregulation is a frequent event in non-small cell lung carcinoma pathogenesis. Br. J. Cancer 2020, 122, 1050–1058. [Google Scholar] [CrossRef]
- Zhang, X.; Xu, Y.; Sun, N.; Liu, J.-H.; Chen, F.-F.; Guan, X.-L.; Li, A.; Wang, F.; Zhao, Q.-F.; Wang, H.-Y.; et al. Long noncoding RNA expression profile in fibroblast-like synoviocytes from patients with rheumatoid arthritis. Arthritis Res. Ther. 2016, 18, 227. [Google Scholar] [CrossRef] [Green Version]
- Gong, J.; Jin, S.; Pan, X.; Wang, G.; Ye, L.; Tao, H.; Wen, H.; Liu, Y.; Xie, Q. Identification of long non-coding RNAs for predicting prognosis among patients with thymoma. Clin. Lab. 2018, 64, 1193–1198. [Google Scholar] [CrossRef] [PubMed]
- Hu, Y.; Chen, H.-Y.; Yu, C.-Y.; Xu, J.; Wang, J.-L.; Qian, J.; Zhang, X.; Fang, J.-Y. A long non-coding RNA signature to improve prognosis prediction of colorectal cancer. Oncotarget 2014, 5, 2230. [Google Scholar] [CrossRef] [PubMed] [Green Version]
- Zhou, M.; Guo, M.; He, D.; Wang, X.; Cui, Y.; Yang, H.; Hao, D.; Sun, J. A potential signature of eight long non-coding RNAs predicts survival in patients with non-small cell lung cancer. J. Transl. Med. 2015, 13, 231. [Google Scholar] [CrossRef] [PubMed] [Green Version]
- Zhou, M.; Xu, W.; Yue, X.; Zhao, H.; Wang, Z.; Shi, H.; Cheng, L.; Sun, J. Relapse-related long non-coding RNA signature to improve prognosis prediction of lung adenocarcinoma. Oncotarget 2016, 7, 29720. [Google Scholar] [CrossRef] [PubMed]
- Ouimet, M.; Drouin, S.; Lajoie, M.; Caron, M.; St-Onge, P.; Gioia, R.; Richer, C.; Sinnett, D. A childhood acute lymphoblastic leukaemia-specific lncRNA implicated in prednisolone resistance, cell proliferation, and migration. Oncotarget 2017, 8, 7477. [Google Scholar] [CrossRef] [PubMed] [Green Version]
- Dahl, M.; Kristensen, L.S.; Grønbæk, K. Long non-coding RNAs guide the fine-tuning of gene regulation in B-cell development and malignancy. Int. J. Mol. Sci. 2018, 19, 2475. [Google Scholar] [CrossRef] [PubMed] [Green Version]
- Petri, A.; Dybkær, K.; Bøgsted, M.; Thrue, C.A.; Hagedorn, P.H.; Schmitz, A.; Bødker, J.S.; Johnsen, H.E.; Kauppinen, S. Long noncoding RNA expression during human B-cell development. PLoS ONE 2015, 10, e0138236. [Google Scholar] [CrossRef] [PubMed] [Green Version]
- Fernando, T.R.; Rodriguez-Malave, N.I.; Waters, E.V.; Yan, W.; Casero, D.; Basso, G.; Pigazzi, M.; Rao, D.S. LncRNA expression discriminates karyotype and predicts survival in B-lymphoblastic leukaemia. Mol. Cancer Res. 2015, 13, 839–851. [Google Scholar] [CrossRef] [Green Version]
- Fernando, T.R.; Contreras, J.R.; Zampini, M.; Rodriguez-Malave, N.I.; Alberti, M.O.; Anguiano, J.; Tran, T.M.; Palanichamy, J.K.; Gajeton, J.; Ung, N.M. The lncRNA CASC15 regulates SOX4 expression in RUNX1-rearranged acute leukaemia. Mol. Cancer 2017, 16, 126. [Google Scholar] [CrossRef]
- Lajoie, M.; Drouin, S.; Caron, M.; St-Onge, P.; Ouimet, M.; Gioia, R.; Lafond, M.-H.; Vidal, R.; Richer, C.; Oualkacha, K. Specific expression of novel long non-coding RNAs in high-hyperdiploid childhood acute lymphoblastic leukaemia. PLoS ONE 2017, 12, e0174124. [Google Scholar] [CrossRef] [Green Version]
- Cao, F.; Wang, Z.; Feng, Y.; Zhu, H.; Yang, M.; Zhang, S.; Wang, X. lncRNA TPTEP1 competitively sponges miR-328-5p to inhibit the proliferation of non-small cell lung cancer cells. Oncol. Rep. 2020, 43, 1606–1618. [Google Scholar] [CrossRef] [PubMed]
- Zhang, Y.-Y.; Huang, S.-H.; Zhou, H.-R.; Chen, C.J.; Tian, L.-H.; Shen, J.-Z. Role of HOTAIR in the diagnosis and prognosis of acute leukaemia. Oncol. Rep. 2016, 36, 3113–3122. [Google Scholar] [CrossRef] [Green Version]
- Stark, R.; Grzelak, M.; Hadfield, J. RNA sequencing: The teenage years. Nat. Rev. Genet. 2019, 20, 631–656. [Google Scholar] [CrossRef]
- Jolliffe, I.T. Principal components in regression analysis. In Principal Component Analysis; Springer: New York, NY, USA, 1986; pp. 129–155. [Google Scholar] [CrossRef]
- Everitt, B.S.; Dunn, G. Applied Multivariate Data Analysis, 2nd ed.; Wiley & Sons: New York, NY, USA, 2001; 342p. [Google Scholar]
- Bro, R.; Smilde, A.K. Principal component analysis. Anal. Methods 2014, 6, 2812–2831. [Google Scholar] [CrossRef] [Green Version]
- Einasto, M.; Liivamägi, L.; Saar, E.; Einasto, J.; Tempel, E.; Tago, E.; Martínez, V. SDSS DR7 superclusters-Principal component analysis. Astron. Astrophys. 2011, 535, A36. [Google Scholar] [CrossRef] [Green Version]
- Liao, Q.; Liu, C.; Yuan, X.; Kang, S.; Miao, R.; Xiao, H.; Zhao, G.; Luo, H.; Bu, D.; Zhao, H. Large-scale prediction of long non-coding RNA functions in a coding–non-coding gene co-expression network. Nucleic Acids Res. 2011, 39, 3864–3878. [Google Scholar] [CrossRef] [PubMed]
- Guo, X.; Gao, L.; Liao, Q.; Xiao, H.; Ma, X.; Yang, X.; Luo, H.; Zhao, G.; Bu, D.; Jiao, F. Long non-coding RNAs function annotation: A global prediction method based on bi-colored networks. Nucleic Acids Res. 2013, 41, e35. [Google Scholar] [CrossRef] [PubMed]
- Pu, S.; Vlasblom, J.; Emili, A.; Greenblatt, J.; Wodak, S.J. Identifying functional modules in the physical interactome of Saccharomyces cerevisiae. Proteomics 2007, 7, 944–960. [Google Scholar] [CrossRef] [PubMed]
- Giulietti, M.; Righetti, A.; Principato, G.; Piva, F. LncRNA co-expression network analysis reveals novel biomarkers for pancreatic cancer. Carcinogenesis 2018, 39, 1016–1025. [Google Scholar] [CrossRef] [Green Version]
- Yang, W.; Li, Y.; Song, X.; Xu, J.; Xie, J. Genome-wide analysis of long noncoding RNA and mRNA co-expression profile in intrahepatic cholangiocarcinoma tissue by RNA sequencing. Oncotarget 2017, 8, 26591. [Google Scholar] [CrossRef] [Green Version]
- Smaldone, G.; Beneduce, G.; Incoronato, M.; Pane, K.; Franzese, M.; Coppola, L.; Cordella, A.; Parasole, R.; Ripaldi, M.; Nassa, G.; et al. KCTD15 is overexpressed in human childhood B-cell acute lymphoid leukaemia. Sci. Rep. 2019, 9, 20108. [Google Scholar] [CrossRef] [PubMed] [Green Version]
- Sun, L.; Guan, Z.; Wei, S.; Tan, R.; Li, P.; Yan, L. Identification of long non-coding and messenger RNAs differentially expressed between primary and metastatic melanoma. Front. Genet. 2019, 10, 10. [Google Scholar] [CrossRef] [PubMed] [Green Version]
- Liu, G.-M.; Zeng, H.-D.; Zhang, C.-Y.; Xu, J.-W. Key genes associated with diabetes mellitus and hepatocellular carcinoma. Pathol. Res. Pract. 2019, 215, 152510. [Google Scholar] [CrossRef] [PubMed]
- Footz, T.K.; Brinkman-Mills, P.; Banting, G.S.; Maier, S.A.; Riazi, M.A.; Bridgland, L.; Hu, S.; Birren, B.; Minoshima, S.; Shimizu, N. Analysis of the cat eye syndrome critical region in humans and the region of conserved synteny in mice: A search for candidate genes at or near the human chromosome 22 pericentromere. Genome Res. 2001, 11, 1053–1070. [Google Scholar] [CrossRef] [PubMed] [Green Version]
- Zhang, J.; Fan, D.; Jian, Z.; Chen, G.G.; Lai, P.B. Cancer specific long noncoding RNAs show differential expression patterns and competing endogenous RNA potential in hepatocellular carcinoma. PLoS ONE 2015, 10, e0141042. [Google Scholar] [CrossRef]
- Liu, X.; Lu, Y.; Zhu, J.; Liu, M.; Xie, M.; Ye, M.; Li, M.; Wang, S.; Ming, Z.; Tong, Q. A long noncoding RNA, Antisense IL-7, promotes inflammatory gene transcription through facilitating histone acetylation and switch/sucrose nonfermentable chromatin remodeling. J. Immunol. 2019, 203, 1548–1559. [Google Scholar] [CrossRef]
- Chi, H.; Yang, R.; Zheng, X.; Zhang, L.; Jiang, R.; Chen, J. LncRNA RP11-79H23. 3 functions as a competing endogenous RNA to regulate PTEN expression through sponging hsa-miR-107 in the development of bladder cancer. Int. J. Mol. Sci. 2018, 19, 2531. [Google Scholar] [CrossRef] [Green Version]
- Zhou, Y.; Huan, L.; Wu, Y.; Bao, C.; Chen, B.; Wang, L.; Huang, S.; Liang, L.; He, X. LncRNA ID2-AS1 suppresses tumor metastasis by activating the HDAC8/ID2 pathway in hepatocellular carcinoma. Cancer Lett. 2020, 469, 399–409. [Google Scholar] [CrossRef]
- Lauc, G.; Huffman, J.E.; Pučić, M.; Zgaga, L.; Adamczyk, B.; Mužinić, A.; Novokmet, M.; Polašek, O.; Gornik, O.; Krištić, J. Loci associated with N-glycosylation of human immunoglobulin G show pleiotropy with autoimmune diseases and haematological cancers. PLoS Genet. 2013, 9, e1003225. [Google Scholar] [CrossRef]
- Yang, M.; Huang, W.; Sun, Y.; Liang, H.; Chen, M.; Wu, X.; Wang, X.; Zhang, L.; Cheng, X.; Fan, Y. Prognosis and modulation mechanisms of COMMD6 in human tumours based on expression profiling and comprehensive bioinformatics analysis. Br. J. Cancer 2019, 121, 699–709. [Google Scholar] [CrossRef] [Green Version]
- Helgadottir, A.; Thorleifsson, G.; Gretarsdottir, S.; Stefansson, O.A.; Tragante, V.; Thorolfsdottir, R.B.; Jonsdottir, I.; Bjornsson, T.; Steinthorsdottir, V.; Verweij, N. Genome-wide analysis yields new loci associating with aortic valve stenosis. Nat. Commun. 2018, 9, 1–10. [Google Scholar] [CrossRef] [PubMed] [Green Version]
- Cui, W.; Qian, Y.; Zhou, X.; Lin, Y.; Jiang, J.; Chen, J.; Zhao, Z.; Shen, B. Discovery and characterization of long intergenic non-coding RNAs (lincRNA) module biomarkers in prostate cancer: An integrative analysis of RNA-Seq data. BMC Genom. 2015, 16, S3. [Google Scholar] [CrossRef] [PubMed] [Green Version]
- Ding, H.; Zhang, X.; Su, Y.; Jia, C.; Dai, C. GNAS promotes inflammation-related hepatocellular carcinoma progression by promoting STAT3 activation. Cell. Mol. Biol. Lett. 2020, 25, 1–17. [Google Scholar] [CrossRef]
- Jiang, C.; Ding, N.; Li, J.; Jin, X.; Li, L.; Pan, T.; Huo, C.; Li, Y.; Xu, J.; Li, X. Landscape of the long non-coding RNA transcriptome in human heart. Brief. Bioinform. 2019, 20, 1812–1825. [Google Scholar] [CrossRef] [PubMed]
- Sun, Y.; Liu, R.; Xia, X.; Xing, L.; Yang, C.; Jiang, J.; Bian, W.; Zhang, W.; Wang, C.; Zhang, C. Large-scale profiling of lncrnas in human non-nucleated cells: Implications in cell function and disease. SSRN Electron. J. 2018. [Google Scholar] [CrossRef]
- Jia, Y.; Shi, L.; Yun, F.; Liu, X.; Chen, Y.; Wang, M.; Chen, C.; Ren, Y.; Bao, Y.; Wang, L. Transcriptome sequencing profiles reveal lncRNAs may involve in breast cancer (ER/PR positive type) by interaction with RAS associated genes. Pathol. Res. Pract. 2019, 215, 152405. [Google Scholar] [CrossRef]
- Chen, Y.; Yu, X.; Xu, Y.; Shen, H. Identification of dysregulated lncRNAs profiling and metastasis-associated lncRNAs in colorectal cancer by genome-wide analysis. Cancer Med. 2017, 6, 2321–2330. [Google Scholar] [CrossRef]
- Black, K.L.; Naqvi, A.S.; Asnani, M.; Hayer, K.E.; Yang, S.Y.; Gillespie, E.; Bagashev, A.; Pillai, V.; Tasian, S.K.; Gazzara, M.R.; et al. Aberrant splicing in B-cell acute lymphoblastic leukemia. Nucleic Acids Res. 2018, 46, 11357–11369. [Google Scholar] [CrossRef] [Green Version]
- Huarte, M. The emerging role of lncRNAs in cancer. Nat. Med. 2015, 21, 1253. [Google Scholar] [CrossRef]
- Wang, B.; Tang, D.; Zhang, Z.; Wang, Z. Identification of aberrantly expressed lncRNA and the associated TF-mRNA network in hepatocellular carcinoma. J. Cell. Biochem. 2020, 121, 1491–1503. [Google Scholar] [CrossRef]
- Ma, L.; Kuai, W.X.; Sun, X.Z.; Lu, X.C.; Yuan, Y.F. Long noncoding RNA LINC00265 predicts the prognosis of acute myeloid leukemia patients and functions as a promoter by activating PI3K-AKT pathway. Eur. Rev. Med. Pharmacol. Sci. 2018, 22, 7867–7876. [Google Scholar] [CrossRef] [PubMed]
- Sarfi, M.; Abbastabar, M.; Khalili, E. Long noncoding RNAs biomarker-based cancer assessment. J. Cell. Physiol. 2019, 234, 16971–16986. [Google Scholar] [CrossRef] [PubMed]
- Schwarzer, A.; Emmrich, S.; Schmidt, F.; Beck, D.; Ng, M.; Reimer, C.; Adams, F.F.; Grasedieck, S.; Witte, D.; Käbler, S. The non-coding RNA landscape of human hematopoiesis and leukemia. Nat. Commun. 2017, 8, 1–17. [Google Scholar] [CrossRef] [PubMed]
- Arriaga-Canon, C.; De La Rosa-Velázquez, I.A.; González-Barrios, R.; Montiel-Manríquez, R.; Oliva-Rico, D.; Jiménez-Trejo, F.; Cortés-González, C.; Herrera, L.A. The use of long non-coding RNAs as prognostic biomarkers and therapeutic targets in prostate cancer. Oncotarget 2018, 9, 20872–20890. [Google Scholar] [CrossRef] [PubMed] [Green Version]
- Roy, S.; Trautwein, C.; Luedde, T.; Roderburg, C. A general overview on non-coding RNA-based diagnostic and therapeutic approaches for liver diseases. Front. Pharmacol. 2018, 9, 805. [Google Scholar] [CrossRef] [PubMed] [Green Version]
- Sun, J.; Cheng, L.; Shi, H.; Zhang, Z.; Zhao, H.; Wang, Z.; Zhou, M. A potential panel of six-long non-coding RNA signature to improve survival prediction of diffuse large-B-cell lymphoma. Sci. Rep. 2016, 6, 27842. [Google Scholar] [CrossRef] [Green Version]
- Zhou, M.; Sun, Y.; Xu, W.; Zhang, Z.; Zhao, H.; Zhong, Z.; Sun, J. Comprehensive analysis of lncRNA expression profiles reveals a novel lncRNA signature to discriminate nonequivalent outcomes in patients with ovarian cancer. Oncotarget 2016, 7, 32433–32448. [Google Scholar] [CrossRef]
- Sun, J.; Chen, X.; Wang, Z.; Guo, M.; Shi, H.; Wang, X.; Cheng, L.; Zhou, M. A potential prognostic long non-coding RNA signature to predict metastasis-free survival of breast cancer patients. Sci. Rep. 2015, 5, 16553. [Google Scholar] [CrossRef]
- Li, J.; Chen, Z.; Tian, L.; Zhou, C.; He, M.Y.; Gao, Y.; Wang, S.; Zhou, F.; Shi, S.; Feng, X.; et al. LncRNA profile study reveals a three-lncRNA signature associated with the survival of patients with oesophageal squamous cell carcinoma. Gut 2014, 63, 1700–1710. [Google Scholar] [CrossRef] [Green Version]
- Luo, M.; Zhang, Q.; Xia, M.; Hu, F.; Ma, Z.; Chen, Z.; Guo, A.-Y. Differential co-expression and regulatory network analysis uncover the relapse factor and mechanism of T cell acute leukemia. Mol. Ther. Nucleic Acids 2018, 12, 184–194. [Google Scholar] [CrossRef] [Green Version]
- Pan, J.Q.; Zhang, Y.Q.; Wang, J.H.; Xu, P.; Wang, W. lncRNA co-expression network model for the prognostic analysis of acute myeloid leukemia. Int. J. Mol. Med. 2017, 39, 663–671. [Google Scholar] [CrossRef] [PubMed] [Green Version]
- Chen, C.-T.; Wang, P.-P.; Mo, W.-J.; Zhang, Y.-P.; Zhou, W.; Deng, T.-F.; Zhou, M.; Chen, X.-W.; Wang, S.-Q.; Wang, C.-X. Expression profile analysis of prognostic long non-coding RNA in adult acute myeloid leukemia by weighted gene co-expression network analysis (WGCNA). J. Cancer 2019, 10, 4707–4718. [Google Scholar] [CrossRef] [PubMed]
- Zhang, J.; Xiang, Y.; Ding, L.; Keen-Circle, K.; Borlawsky, T.B.; Ozer, H.G.; Jin, R.; Payne, P.; Huang, K. Using gene co-expression network analysis to predict biomarkers for chronic lymphocytic leukemia. BMC Bioinform. 2010, 11 (Suppl. 9), S5. [Google Scholar] [CrossRef] [PubMed] [Green Version]
- Ceredig, R.; Rolink, A.G. The key role of IL-7 in lymphopoiesis. Semin. Immunol. 2012, 24, 159–164. [Google Scholar] [CrossRef] [PubMed]
- Acharya, M.; Borland, G.; Edkins, A.L.; Maclellan, L.M.; Matheson, J.; Ozanne, B.W.; Cushley, W. CD23/FcεRII: Molecular multi-tasking. Clin. Exp. Immunol. 2010, 162, 12–23. [Google Scholar] [CrossRef]
- Wendorff, A.A.; Koch, U.; Wunderlich, F.T.; Wirth, S.; Dubey, C.; Brüning, J.C.; MacDonald, H.R.; Radtke, F. Hes1 is a critical but context-dependent mediator of canonical Notch signaling in lymphocyte development and transformation. Immunity 2010, 33, 671–684. [Google Scholar] [CrossRef] [Green Version]
- Janovská, P.; Bryja, V. Wnt signalling pathways in chronic lymphocytic leukaemia and B-cell lymphomas. Br. J. Pharmacol. 2017, 174, 4701–4715. [Google Scholar] [CrossRef] [Green Version]
- Allen, A.; Gill, K.; Hoehn, D.; Sulis, M.; Bhagat, G.; Alobeid, B. C-myc protein expression in B-cell acute lymphoblastic leukemia, prognostic significance? Leuk. Res. 2014, 38, 1061–1066. [Google Scholar] [CrossRef]
- Sadras, T.; Heatley, S.L.; Kok, C.H.; Dang, P.; Galbraith, K.M.; McClure, B.J.; Muskovic, W.; Venn, N.C.; Moore, S.; Osborn, M.; et al. Differential expression of MUC4, GPR110 and IL2RA defines two groups of CRLF2-rearranged acute lymphoblastic leukemia patients with distinct secondary lesions. Cancer Lett. 2017, 408, 92–101. [Google Scholar] [CrossRef]
- Cuadros, M.; Andrades, A.; Coira, I.F.; Baliñas, C.; Rodríguez, M.I.; Álvarez-Pérez, J.C.; Peinado, P.; Arenas, A.M.; García, D.J.; Jiménez, P.; et al. Expression of the long non-coding RNA TCL6 is associated with clinical outcome in pediatric B-cell acute lymphoblastic leukemia. Blood Cancer J. 2019, 9, 93. [Google Scholar] [CrossRef] [Green Version]
- Djordjevic, D.; Yang, A.; Zadoorian, A.; Rungrugeecharoen, K.; Ho, J.W. How difficult is inference of mammalian causal gene regulatory networks? PLoS ONE 2014, 9, e111661. [Google Scholar] [CrossRef] [PubMed] [Green Version]
- Krämer, A.; Green, J.; Pollard, J., Jr.; Tugendreich, S. Causal analysis approaches in Ingenuity Pathway Analysis. Bioinformatics 2014, 30, 523–530. [Google Scholar] [CrossRef]
- Love, M.I.; Huber, W.; Anders, S. Moderated estimation of fold change and dispersion for RNA-seq data with DESeq2. Genome Biol. 2014, 15, 550. [Google Scholar] [CrossRef] [PubMed] [Green Version]
- Zhou, Y.; Zhou, B.; Pache, L.; Chang, M.; Khodabakhshi, A.H.; Tanaseichuk, O.; Benner, C.; Chanda, S.K. Metascape provides a biologist-oriented resource for the analysis of systems-level datasets. Nat. Commun. 2019, 10, 1–10. [Google Scholar] [CrossRef] [PubMed]
- Reimand, J.; Arak, T.; Adler, P.; Kolberg, L.; Reisberg, S.; Peterson, H.; Vilo, J. g: Profiler—A web server for functional interpretation of gene lists (2016 update). Nucleic Acids Res. 2016, 44, W83–W89. [Google Scholar] [CrossRef] [PubMed]
- Goepferich, M.; Herrmann, C. LINC: Co-Expression of lincRNAs and Protein-Coding Genes. R Package Version 1.15.0. 2019. Available online: https://www.bioconductor.org/packages/release/bioc/html/LINC.html (accessed on 31 March 2020).
- Butts, C.T. Network: A package for managing relational data in R. J. Stat. Softw. 2008, 24, 1–36. [Google Scholar] [CrossRef] [Green Version]
- R Core Team. R: A Language and Environment for Statistical Computing. R Foundation for Statistical Computing, Vienna, Austria. Available online: https://www.R-project.org/ (accessed on 31 March 2020).

| Ensembl ID | LncRNA Symbol GhR37 p.13/GhR38 p.13 | Log2FC a | p Adjusted | Average Expression Healthy Subjects | Average Expression Tumour Samples | Expression Trend | References |
|---|---|---|---|---|---|---|---|
| ENSG00000236800 | RP11–534L6.2/AC068898.1 | −4.368 | 3.05 × 10⁻³ | 15.21 | 0.15 | Down–regulated | none |
| ENSG00000198106 | SNX29P2/AC025279.1 | −4.203 | 8.97 × 10⁻⁸ | 149.57 | 6.56 | Down–regulated | none |
| ENSG00000246528 | RP11–159H10.3/AC079089.1 | −4.182 | 2.01 × 10⁻³ | 18.54 | 0.32 | Down–regulated | none |
| ENSG00000205056 | RP11–693J15.5/LINC02397 | −4.149 | 4.69 × 10⁻⁶ | 624.81 | 25.57 | Down–regulated | [34] |
| ENSG00000245869 | RP11–158I9.5/AP004609.3 | −4.053 | 3.60 × 10⁻⁵ | 78.48 | 3.03 | Down–regulated | none |
| ENSG00000251538 | RP11–166A12.1/LINC02201 | −3.989 | 9.89 × 10⁻³ | 11.20 | 0.14 | Down–regulated | [35] |
| ENSG00000255864 | RP11–444D3.1/not annotated | −3.961 | 7.50 × 10⁻³ | 108.99 | 11.97 | Down–regulated | none |
| ENSG00000247982 | LINC00926/LINC00926 | −3.918 | 2.21 × 10⁻⁷ | 4566.18 | 244.07 | Down–regulated | [12] |
| ENSG00000237438 | CECR7/CECR7 | −3.691 | 6.59 × 10⁻⁶ | 105.06 | 6.23 | Down–regulated | [36,37] |
| ENSG00000258810 | RP11–219E7.1/AL133371.2 | −3.399 | 6.77 × 10⁻⁴ | 37.33 | 2.64 | Down–regulated | none |
| ENSG00000224875 | AC083949.1/EML4–AS1 | −3.369 | 1.21 × 10⁻⁵ | 50.18 | 4.33 | Down–regulated | none |
| ENSG00000231105 | RP5–1071N3.1/ECE1–AS1 | −3.309 | 5.67 × 10⁻⁷ | 271.25 | 24.22 | Down–regulated | none |
| ENSG00000224610 | RP11–265P11.1/AC108879.1 | −3.305 | 1.64 × 10⁻³ | 42.31 | 2.89 | Down–regulated | none |
| ENSG00000253535 | RP11–624C23.1/AC120193.1 | −3.213 | 3.00 × 10⁻⁴ | 236.05 | 19.76 | Down–regulated | [8] |
| ENSG00000261618 | RP11–79H23.3/LINC02605 | −3.13 | 2.16 × 10⁻³ | 38.87 | 3.35 | Down–regulated | [38,39] |
| ENSG00000261114 | RP11–325K4.2/AC012181.1 | −3.112 | 1.40 × 10⁻⁸ | 142.67 | 14.54 | Down–regulated | none |
| ENSG00000225331 | AP001055.6/LINC01678 | −3.054 | 5.02 × 10⁻³ | 27.10 | 2.35 | Down–regulated | none |
| ENSG00000235192 | AC009495.2/AC009495.3 | −2.865 | 8.94 × 10⁻³ | 26.86 | 2.88 | Down–regulated | [40] |
| ENSG00000251364 | CTD–2516F10.2/AC107884.1 | −2.827 | 1.94 × 10⁻⁵ | 181.05 | 23.66 | Down–regulated | [41] |
| ENSG00000229151 | RP11–348F1.3/AC233976.1 | −2.755 | 6.32 × 10⁻³ | 34.97 | 4.25 | Down–regulated | none |
| ENSG00000228403 | RP11–563N6.6/AC035139.1 | −2.557 | 2.74 × 10⁻³ | 46.95 | 7.03 | Down–regulated | none |
| ENSG00000269918 | AF131215.9/AF131215.6 | −2.533 | 1.97 × 10⁻³ | 46.61 | 7.17 | Down–regulated | none |
| ENSG00000255310 | AF131215.2/AF131215.5 | −2.236 | 4.47 × 10⁻⁴ | 97.41 | 19.14 | Down–regulated | none |
| ENSG00000267787 | RP11–35G9.5/AC027097.2 | −1.86 | 1.21 × 10⁻³ | 216.93 | 57.25 | Down–regulated | none |
| ENSG00000226674 | TEX41/TEX41 | 5.218 | 4.88 × 10⁻⁷ | 2.44 | 170.21 | Up–regulated | [42,43,44] |
| ENSG00000100181 | TPTEP1/TPTEP1 | 3.527 | 5.58 × 10⁻⁴ | 7.33 | 112.53 | Up–regulated | [45,46] |
| ENSG00000269968 | RP5–940J5.9/AC006064.4 | 3.362 | 1.40 × 10⁻⁴ | 4.25 | 53.74 | Up–regulated | none |
| ENSG00000259330 | LINC00984/INAFM2 | 2.279 | 1.87 × 10⁻⁴ | 26.76 | 131.75 | Up–regulated | [46,47] |
| ENSG00000224597 | PTCHD3P1/SVIL–AS1 | 2.234 | 8.04 × 10⁻⁴ | 10.61 | 51.60 | Up–regulated | [10] |
| ENSG00000255026 | RP11–326C3.2/AC136475.3 | 2.211 | 3.15 × 10⁻⁴ | 31.38 | 147.22 | Up–regulated | [48,49] |
| Gene | Forward Primer | Reverse Primer |
|---|---|---|
| RPS18: | fw 5′-CGATGGGCGGCGGAAAATA-3′; | rev 5′-CTGCTTTCCTCAACACCACA-3′; |
| TEX41: | fw 5′-TCATCTGTGAGGACCGTGAC-3′; | rev 5′-AGCACAGGAGAAGCTGAGTT-3′; |
| RTN4: | fw 5′-TGCGTCAGACTGTTCCACAC-3′; | rev 5′-CAGTCTCCTCTGCTGCACAA-3′; |
| UBASH3B: | fw 5′-GCTGGACGTGCTCCTCTC-3′; | rev 5′-AGTCACATGCTGCCTGAACA-3′; |
| CHST15: | fw 5′-CACACCAGATCCATCAAGGAC-3′; | rev 5′-TCCAGGCATTATTATCCCACA-3′; |
| RP11-534L6.2: | fw 5′-GGTGATGGTGATCAGGTGACT-3′; | rev 5′-TCGCTGCAGGGAGACTTC-3′; |
| MUC16: | fw 5′-CACAGTGGATGTGGGAACCT-3′; | rev 5′-GGTGAAGTTGAGGGTGAACG; |
| EML6: | fw 5′-GGGCAGGCAGAGGATTTC-3′; | rev 5′-TTTGGATCCGAAATTGACAGT-3′. |
© 2020 by the authors. Licensee MDPI, Basel, Switzerland. This article is an open access article distributed under the terms and conditions of the Creative Commons Attribution (CC BY) license (http://creativecommons.org/licenses/by/4.0/).
Share and Cite
Affinito, O.; Pane, K.; Smaldone, G.; Orlandella, F.M.; Mirabelli, P.; Beneduce, G.; Parasole, R.; Ripaldi, M.; Salvatore, M.; Franzese, M. lncRNAs–mRNAs Co–Expression Network Underlying Childhood B–Cell Acute Lymphoblastic Leukaemia: A Pilot Study. Cancers 2020, 12, 2489. https://doi.org/10.3390/cancers12092489
Affinito O, Pane K, Smaldone G, Orlandella FM, Mirabelli P, Beneduce G, Parasole R, Ripaldi M, Salvatore M, Franzese M. lncRNAs–mRNAs Co–Expression Network Underlying Childhood B–Cell Acute Lymphoblastic Leukaemia: A Pilot Study. Cancers. 2020; 12(9):2489. https://doi.org/10.3390/cancers12092489
Chicago/Turabian StyleAffinito, Ornella, Katia Pane, Giovanni Smaldone, Francesca Maria Orlandella, Peppino Mirabelli, Giuliana Beneduce, Rosanna Parasole, Mimmo Ripaldi, Marco Salvatore, and Monica Franzese. 2020. "lncRNAs–mRNAs Co–Expression Network Underlying Childhood B–Cell Acute Lymphoblastic Leukaemia: A Pilot Study" Cancers 12, no. 9: 2489. https://doi.org/10.3390/cancers12092489