Next Article in Journal
Eotaxins and Their Receptor in Colorectal Cancer—A Literature Review
Previous Article in Journal
Hallmarks of Splicing Defects in Cancer: Clinical Applications in the Era of Personalized Medicine
 
 
Comment published on 2 April 2021, see Cancers 2021, 13(7), 1691.
Article

The Combination of Loss of ALDH1L1 Function and Phenformin Treatment Decreases Tumor Growth in KRAS-Driven Lung Cancer

1
Division of Cancer Biology, Research Institute, National Cancer Center, Goyang 10408, Korea
2
Graduate School of Cancer Science and Policy, National Cancer Center, Goyang 10408, Korea
*
Authors to whom correspondence should be addressed.
Cancers 2020, 12(6), 1382; https://doi.org/10.3390/cancers12061382
Submission received: 13 April 2020 / Revised: 20 May 2020 / Accepted: 26 May 2020 / Published: 28 May 2020
(This article belongs to the Section Cancer Therapy)

Abstract

:
Lung adenocarcinoma cells express high levels of ALDH1L1, an enzyme of the one-carbon pathway that catalyzes the conversion of 10-formyltetrahydrofolate into tetrahydrofolate and NAD(P)H. In this study, we evaluated the potential of ALDH1L1 as a therapeutic target by deleting the Aldh1l1 gene in KrasLA2 mice, a model of spontaneous non-small cell lung cancer (NSCLC). Reporter assays revealed KRAS-mediated upregulation of the ALDH1L1 promoter in human NSCLC cells. Aldh1l1−/− mice exhibited a normal phenotype, with a 10% decrease in Kras-driven lung tumorigenesis. By contrast, the inhibition of oxidative phosphorylation inhibition using phenformin in Aldh1l1−/−; KrasLA2 mice dramatically decreased the number of tumor nodules and tumor area by up to 50%. Furthermore, combined treatment with pan-ALDH inhibitor and phenformin showed a decreased number and area of lung tumors by 70% in the KrasLA2 lung cancer model. Consistent with this, previous work showed that the combination of ALDH1L1 knockdown and phenformin treatment decreased ATP production by as much as 70% in NSCLS cell lines. Taken together, these results suggest that the combined inhibition of ALDH activity and oxidative phosphorylation represents a promising therapeutic strategy for NSCLC.

1. Introduction

Although KRAS is the gene most frequently mutated in lung adenocarcinoma, an effective KRAS-targeted therapy has not yet been developed [1,2]. Developing drugs to target KRAS mutations was known as “undruggable”. For years, alternative approaches have developed targeted agents affecting the signaling cascades downstream of RAS, such as MAPK and PI3K pathways. BRAF inhibitors (vemurafenib and dabrafenib) [3] and dual specificity MEK1/MEK2 inhibitors (trametinib and combimetinib) [3] have been approved as single agents. Recent promising advances in targeting KRAS G12C, such as AMG510 [4], have increased hope for approval in clinical trials as a clinical agent.
Oncogenic KRAS promotes cellular survival, proliferation, migration, autophagy, anabolic metabolism, and changes in the microenvironment [5,6]. The metabolic flux into the non-oxidative pentose phosphate pathway increases nucleic acid biosynthesis and activates hexosamine biosynthesis and the glycolytic pathway [7]. Bioinformatics analysis of metabolic enzymes in non-small cell lung cancer (NSCLC) revealed upregulation of aldehyde dehydrogenase (ALDH) isoforms including ALDH1L1 [8,9]. Analysis of ALDH1L1 expression by immunohistochemical staining showed that NSCLC cancer patients showed a higher expression level than normal control showed [10]. In folate metabolism, ALDH1L1 (10-formyltetrahydrofolate dehydrogenase; EC 1.5.1.6), one of the most abundant folate-binding proteins [11], plays a role in converting 10-formyl-tetrahydrofolate (THF) to THF and CO2 with production of NAD(P)H, resulting in reduced purine synthesis in normal cells [12]. However, when mitochondrial folate metabolism is dysregulated, the cytosolic folate pathway in which ALDH1L1 participates can support purine synthesis and proliferation in the opposite manner [12]. Formation of THF through oxidation of 10-formyl-THF, catalyzed by ALDH1L1, contributes to recycling of THF for purine synthesis [13]. Folate metabolism is an important metabolic pathway that produces one-carbon units for nucleic acid synthesis [14]. In addition, ~50% of NAD(P)H production in cancer cells depends on the 10-formyl-THF-pathway [15]. Hence, we investigated whether KRAS induces ALDH1L1 to promote tumor growth. Subsequently, we assessed whether ALDH1L1 could have the potential to be a therapeutic target by analyzing the effect of Aldh1l1 deletion in KrasLA2 mice, a surrogate model of human NSCLC.

2. Results

2.1. Aldh1l1 Expression is Associated with KRAS Mutation in Lung Cancer Cell Lines

We examined the KRAS-mutant NSCLC cell lines A549 (G12S), H460 (Q61H), H23 (G12C), and HOP-62 (G12C), as well as the KRAS wild-type (WT) lines H1299 and H1975. To confirm that KRAS mutation was correlated with ALDH1L1 expression, we treated KRAS-mutant NSCLC cells with KRAS siRNA (Figure 1a). The silencing of KRAS reduced ALDH1L1 levels by 70%, 70%, 60%, and 70% in H23, HOP-62, H490, and A549, respectively. Next, we confirmed that ALDH1L1 expression was increased by the overexpression of mutant KRAS (Figure 1b). When the KRAS WT line H1299 was transfected with WT or mutant (G12D) KRAS, the level of ALDH1L1 increased 2.6-fold and 2.0-fold when mutant and WT KRAS were over-expressed, respectively (Figure 1b left). A similar pattern was observed in H1975 cells (3.2-fold and 2.3-fold, respectively; Figure 1b right). This result suggests that the regulation of ALDH1L1 expression in NSCLC cells depends on mutant or WT KRAS expression level.

2.2. KRAS Response Region in the ALDH1L1 Promoter

To determine whether ALDH1L1 transcription is regulated by KRAS, we constructed a reporter vector for measuring ALDH1L1 promoter activity using the dual-luciferase system (Figure 2a). A549, H23, H460, and HOP-62 cells stably expressing the ALDH1L1 promoter reporter were transfected with KRAS siRNA. ALDH1L1 promoter activity was decreased ~35% by KRAS knock-down (Figure 2b), whereas when KRAS was over-expressed, ALDH1L1 promoter activity increased ~1.15- and 1.21-fold in H1299 and H1975, respectively (Figure 2c). An increase in ALDH1L1 expression as the result of KRAS wild type overexpression is not very relevant because KRAS is not transcription factor that direct affect gene expression. However, KRAS triggers signaling cascades including Raf-MEK-Erk signaling for Myc and Max transcription factor activation or Rho-Rac-JNK for Elk1 transcription factor activation [16]. Therefore, the knockdown of KRAS showed stronger effect of ALDH1L1 expression compared to over expression of KRAS in cancer cells, because all transcription factors, as well as downstream signaling molecules, may be required to increase the transcription activity of ALDH1L1.
Next, we performed an in silico analysis to predict which transcription factors acted downstream of KRAS to induce expression of the ALDH1L1. Previous studies reported that KRAS activates ELK1, ETS1, SP1, SP3, and RREB1 [17]. Based on our analysis, we identified possible SP1 and ELK1 binding sites in the ALDH1L1 promoter region (Figure 2d), suggesting that the regulation of ALDH1L1 by KRAS is mediated by activation of SP1 and ELK1. ALDH1L1 expression was highly increased in tumor nodules of the lung tissue from the KrasLA2 murine mouse model (Figure 2e).

2.3. Generation of Aldh1l1-Deficient Mice

To investigate the role of ALDH1L1 in vivo, we generated Aldh1l1-knockout mice. Mice with a knockout one allele (tm1a) of Aldh1l1 was received from IMPC (International Mouse Phenotyping Consortium). The Aldh1l1 knockout allele was generated by crossing the Aldh1l1tm1a allele with a Cre deleter strain (zp3-Cre, Jackson laboratory strain 003651). After Cre-loxP recombination, exons 3 and 4 of Aldh1l1 were deleted (Figure 3a). The mutant alleles could be transmitted from both male and female Aldh1l1 heterozygous mice, and homozygous mice could be obtained by interbreeding the heterozygotes. Aldh1l1 heterozygous and homozygous progeny were identified by PCR genotyping (Figure 3b). As a result of the deletion of exons 3 and 4, only the first 42 of the 902 amino acids of ALDH1L1 were correctly translated, and normal full-length ALDH1L1 protein could not be detected in knockout mouse tissues (Figure 3c). Homozygotes did not exhibit abnormal phenotypes in most tissues, including muscle, respiratory, immune/hematopoietic, neurological/nervous, and reproductive tissues, consistent with previously reported phenotypic characterization of this mutant (https://www.mousephenotype.org/data/genes/MGI:1340024).

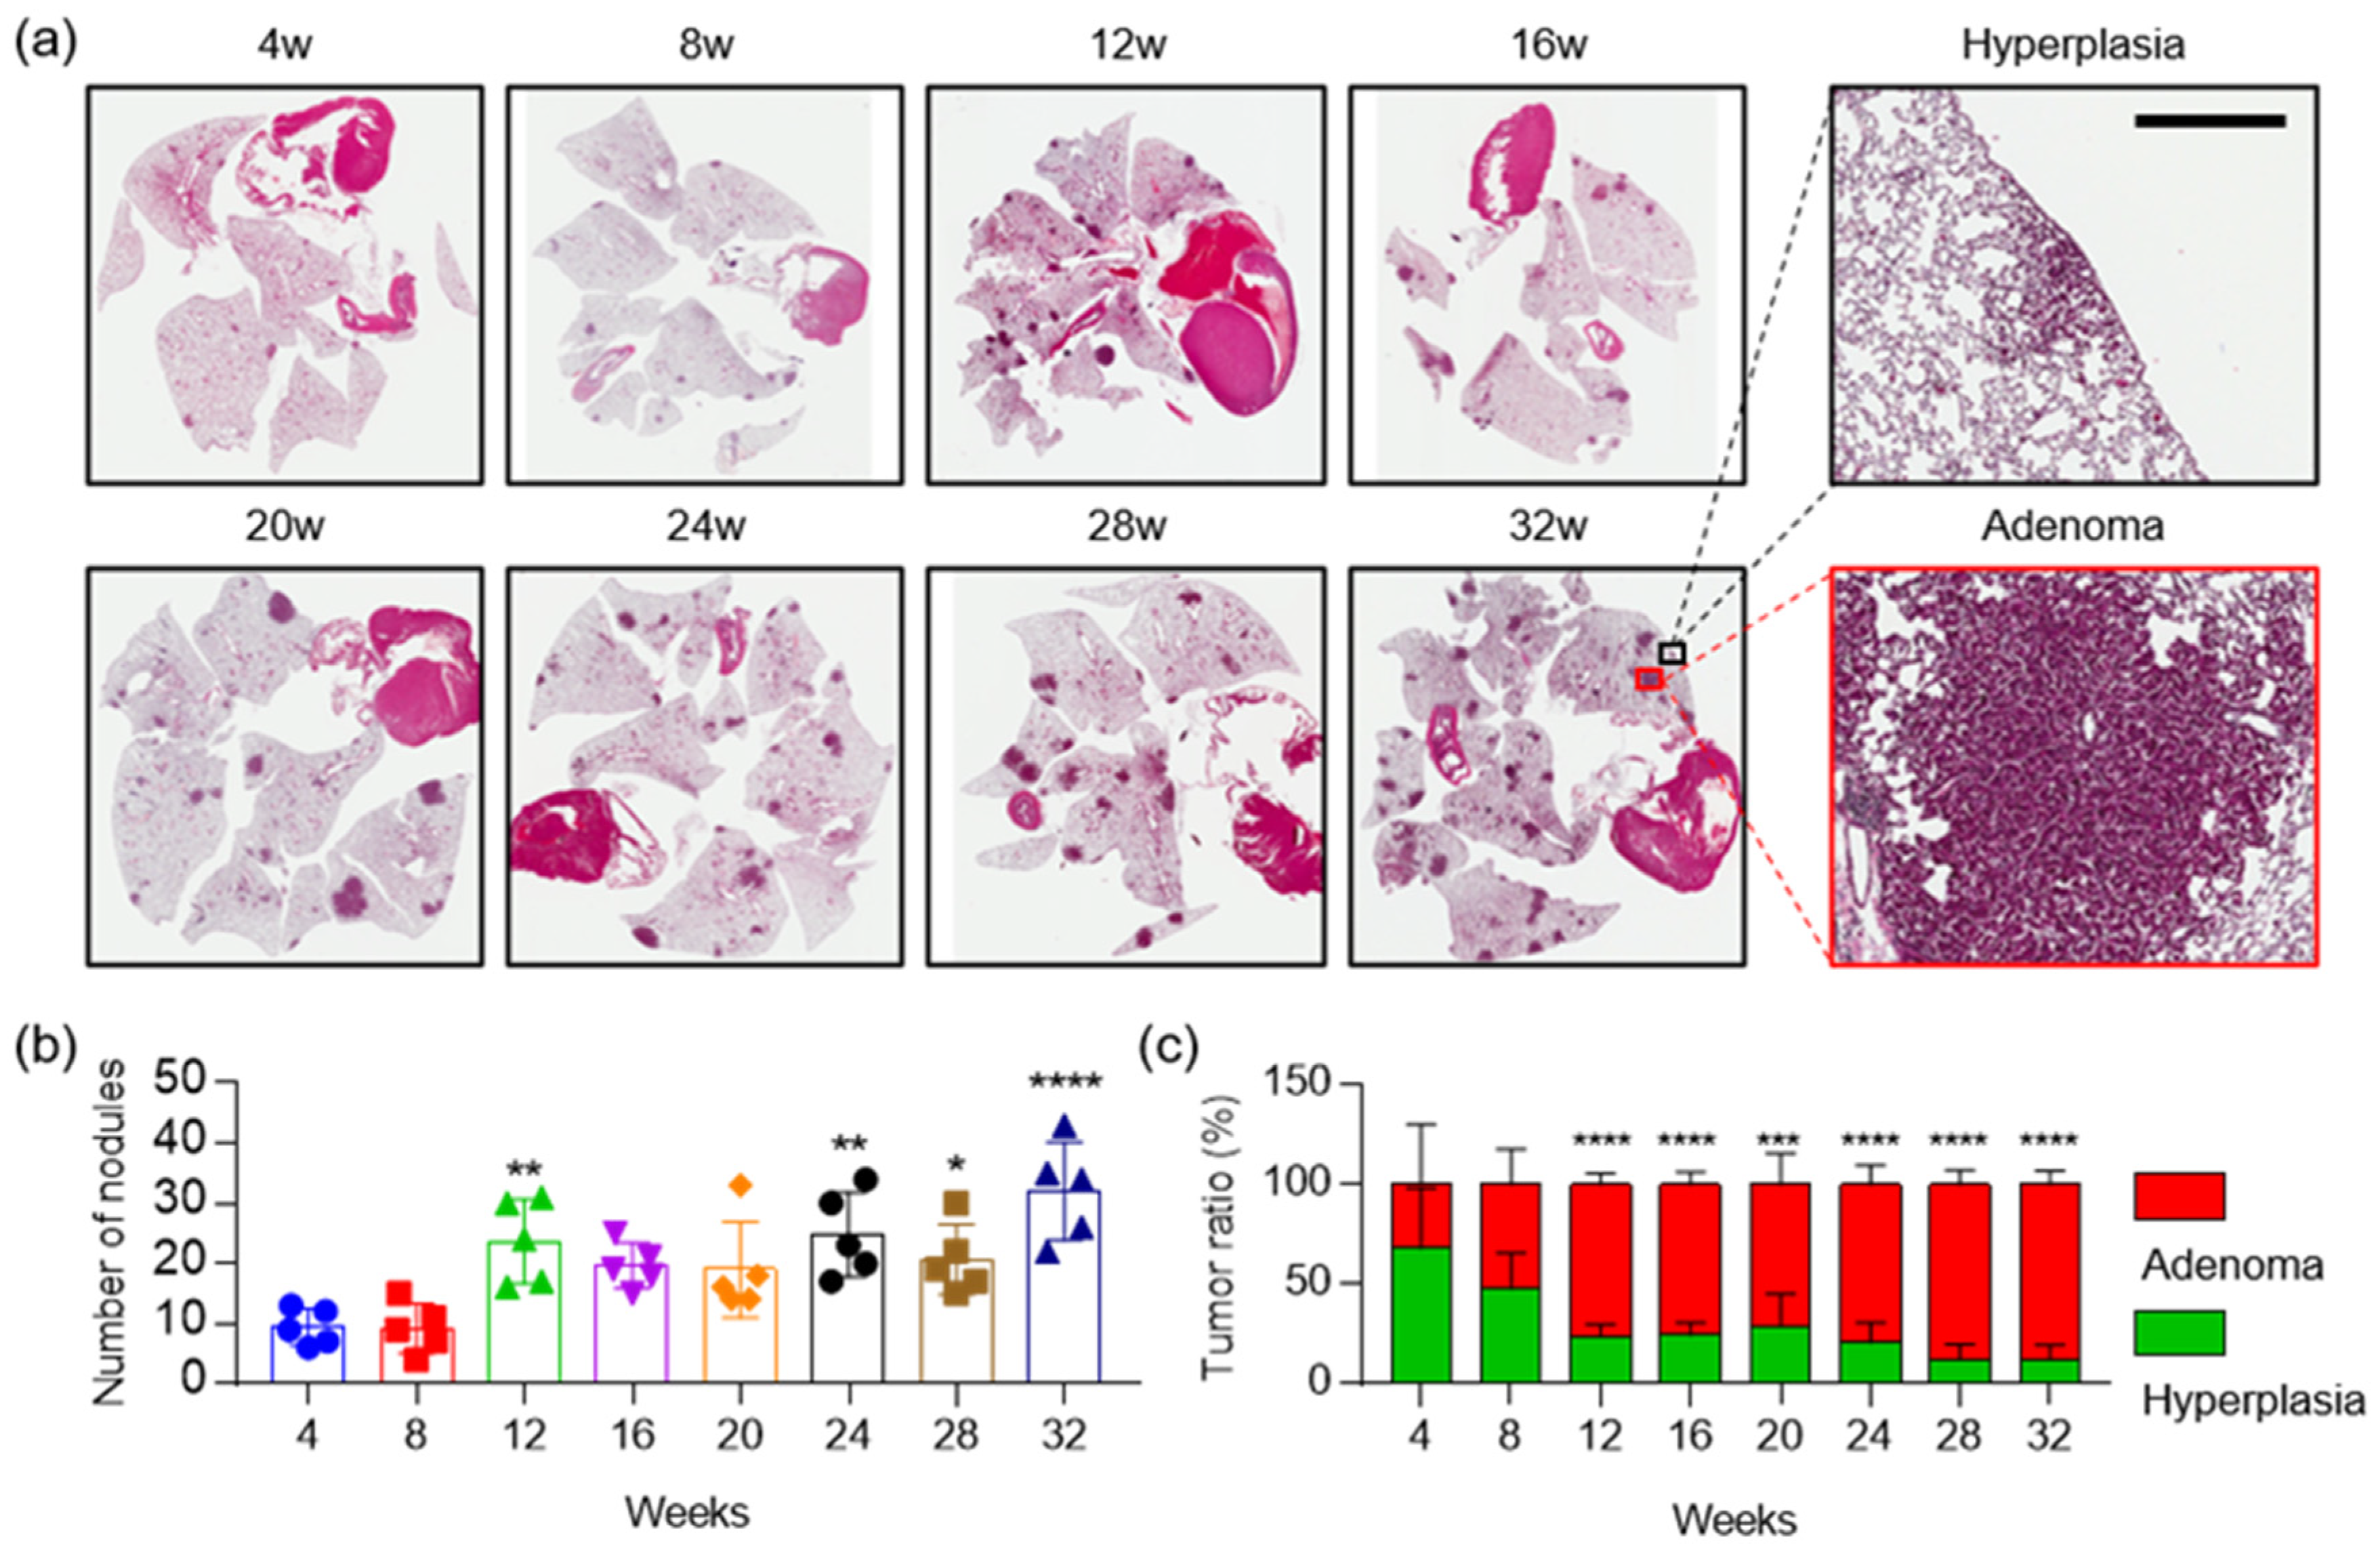
2.4. The Combination of Aldh1l1 Deficiency and Phenformin Treatment Suppresses KRAS-Driven Lung Tumorigenesis

For subsequent experiments, we used the KrasLA2 murine lung cancer model, which harbors a targeted, latent KrasG12D allele that is activated by recombination [18]. The in vivo recombination event generates in an activated allele (KrasG12D) that induces varying grades of tumors, from hyperplasia to carcinomas similar to human NSCLC (Figure 4). With regard to histopathology, KrasLA2 mice developed tumor progression and increased the number of nodules with age. Mice showed, predominantly, hyperplasia and adenoma, up to 32 weeks of age. As the tumor progressed, the hyperplasia ratio in nodules was decreased and the adenoma ratio in nodules was increased (Figure 4).
To explore the role of ALDH1L1 in tumorigenesis, we genetically targeted the Aldh1l1 gene as described above, and then crossed KrasLA2 and Aldh1l1−/− mice to generate KrasLA2; Aldh1l1+/+ and KrasLA2; Aldh1l1−/− mice (Figure 5). The drug was administered once a day, 5 days a week, for 10 weeks from 6 to 16 weeks after birth of KrasLA2; Aldh1l1−/− mice. The phenotype of hyperplasia and adenoma were differentially observed between groups (Figure 5b–d). Cytokeratin 19 (CK-19) was studied as a diagnostic marker of adenocarcinoma, which is known as a marker of endometrioid adenocarcinomas, pancreatic adenocarcinoma and head and neck cancer [19] (Figure 5d). Number of nodule was decreased about 53% in KrasLA2; Aldh1l1−/− mice with phenformin treatment, while that was decreased about 9% in KrasLA2; Aldh1l1−/− mice (Figure 5e). Tumor area was also reduced about 54% in KrasLA2; Aldh1l1−/− mice with phenformin treatment while that was decreased about 14% in KrasLA2; Aldh1l1−/− mice (Figure 5f). During the experiment, we did not observe the weight loss of the mice (Figure 5g).

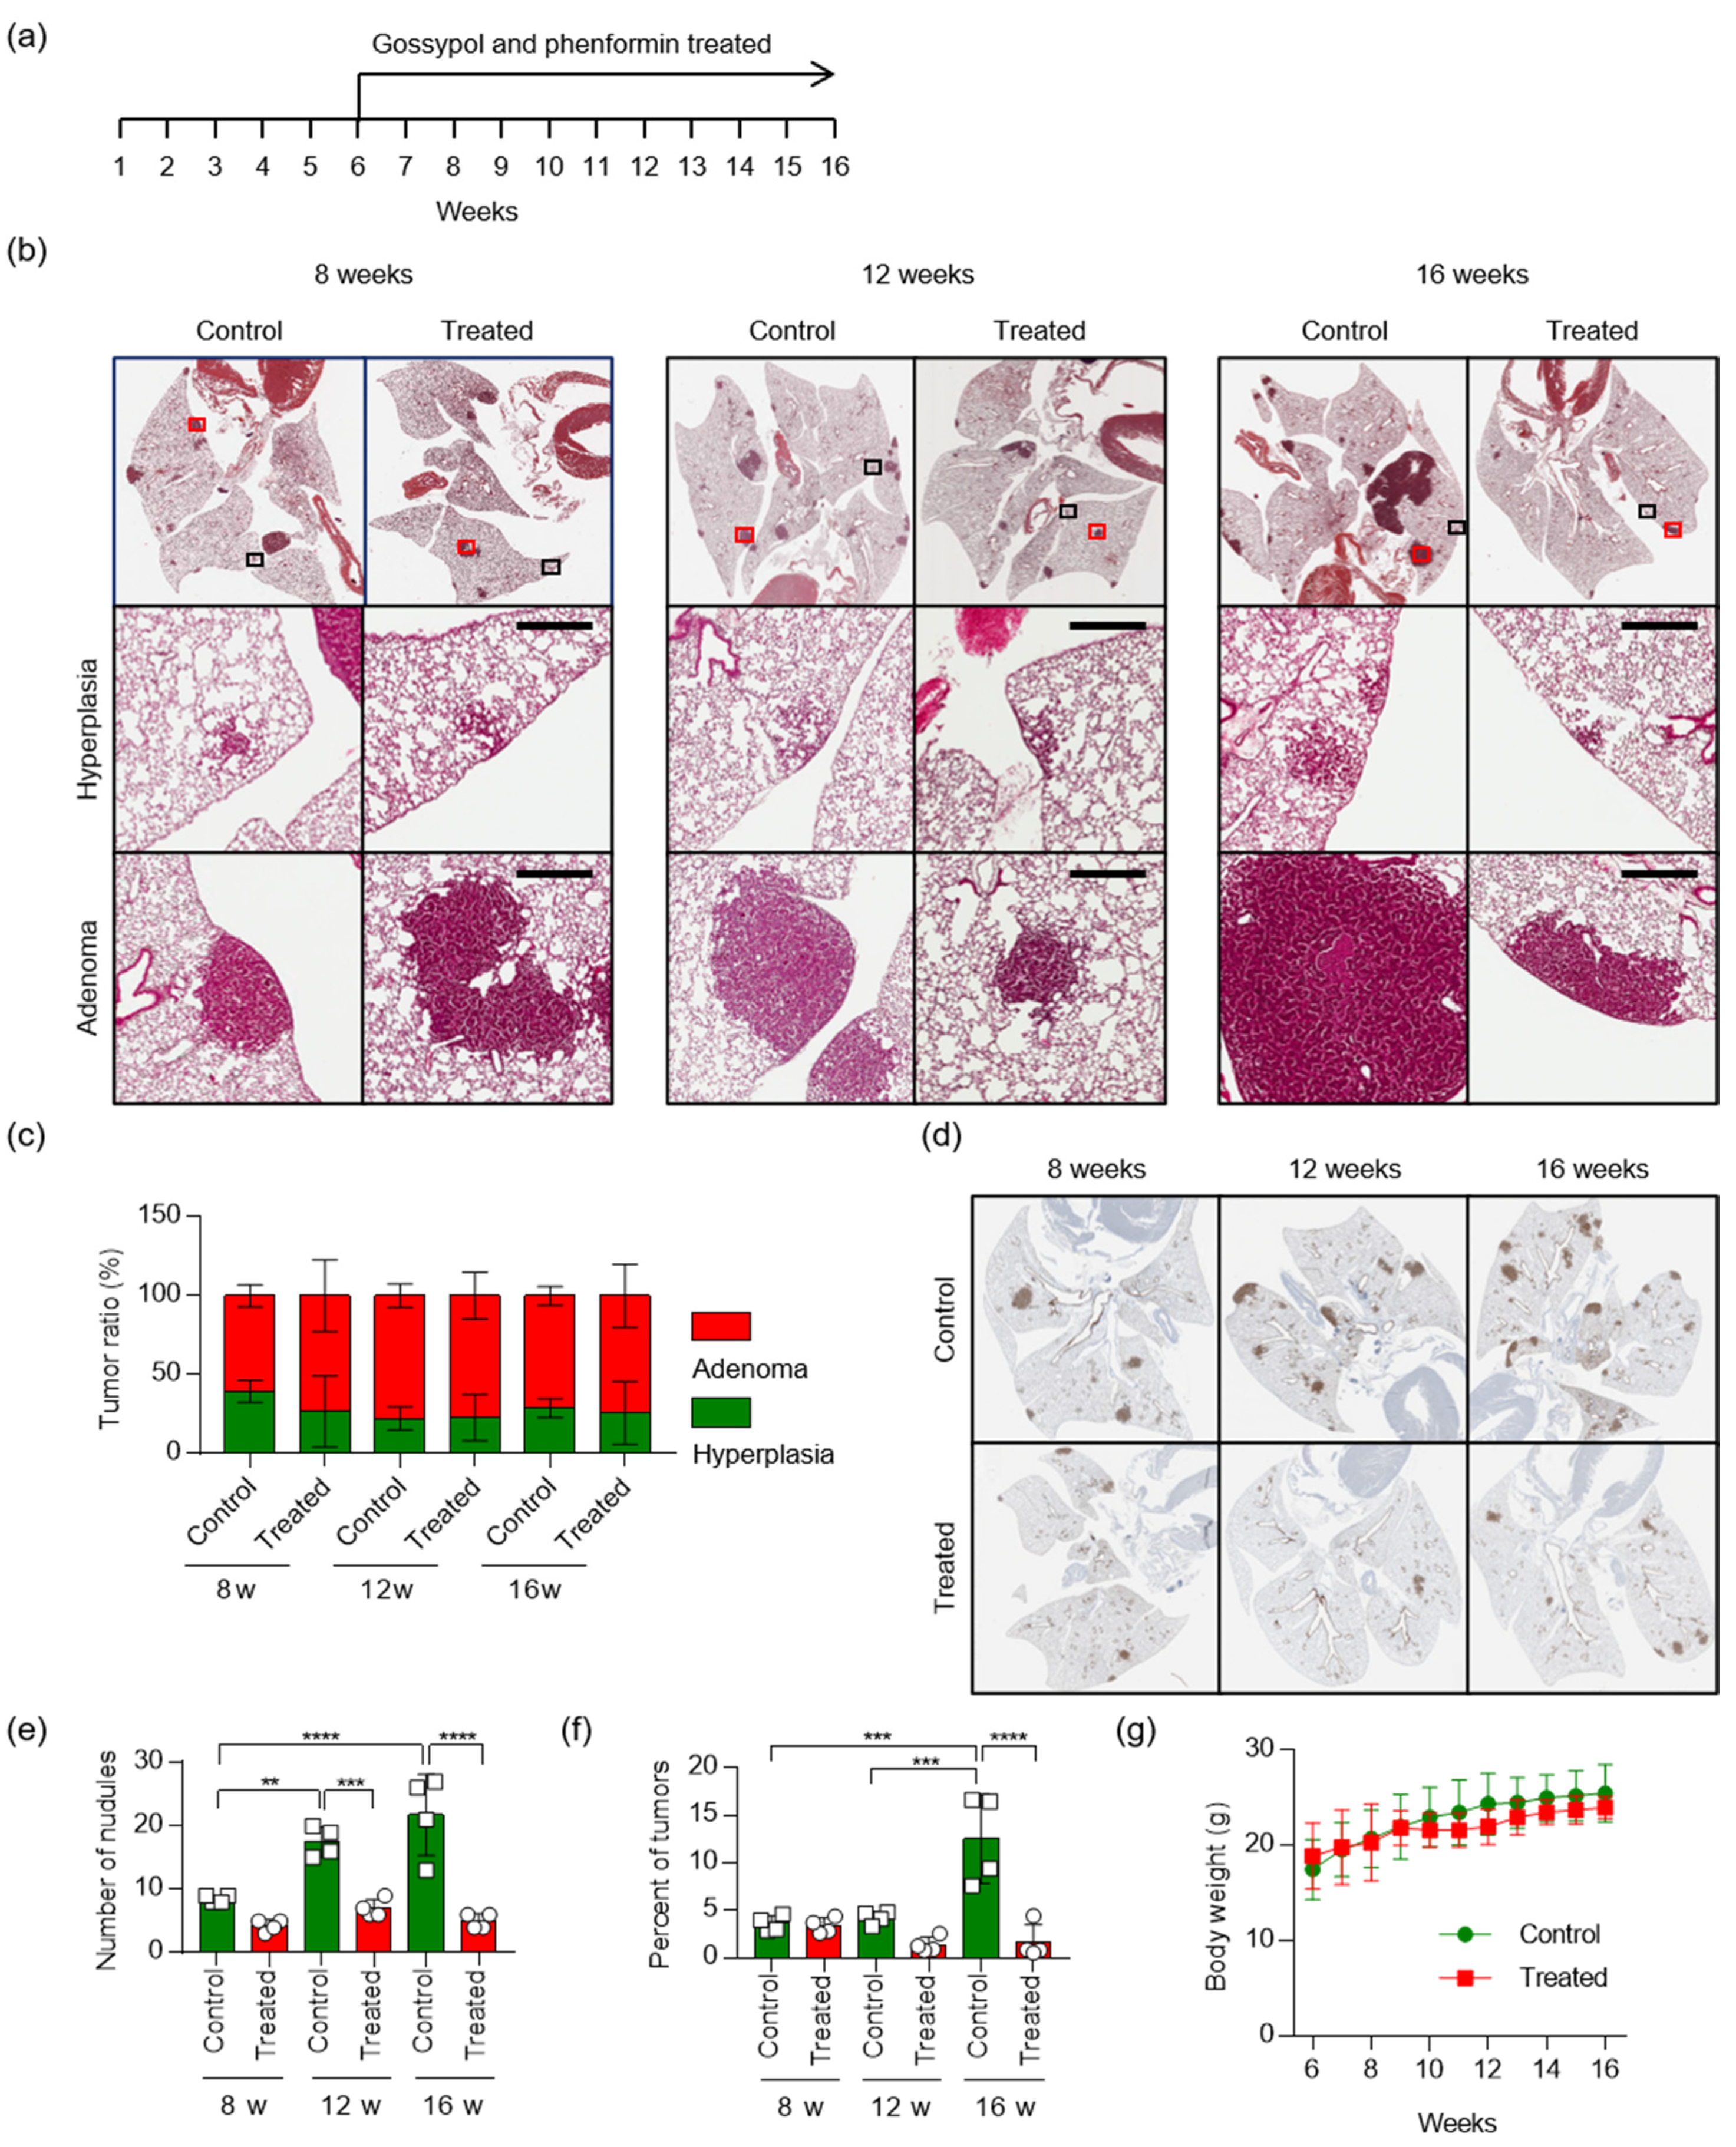
2.5. Treatment with Gossypol and Phenformin Suppresses KRAS-Driven Lung Tumorigenesis

Previously, we have shown that treatment of an NSCLC mouse xenograft model with the alcohol dehydrogenase inhibitor gossypol or mitochondrial complex I inhibitor phenformin led to only modest tumor regression, but combined treatment with both drugs led to marked synergistic tumor regression [10]. To test the therapeutic effects of gossypol and phenformin, we used KrasLA2 mice, which are commonly used as a model of human NSCLC. Oral administration of vehicle or gossypol (40 mg/kg) combined with phenformin (100 mg/kg) five days per week was initiated when KrasLA2 mice were at 6 weeks old and continued until the age of 16 weeks (Figure 6a). After the mice were sacrificed at the indicated times, the area and the number of tumor nodules were lower in the combined treatment group than in the control group. Sixteen-week-old KrasLA2 mice exhibited hyperplasia in both the control and combined treatment groups; adenomas were detected in these animals, but adenocarcinoma lesions were not observed (Figure 6b,c). Immunohistochemical staining of cytokeratin 19 (CK-19) revealed a dramatic increase in tumor nodules, followed by tumor progression, in the KrasLA2 control group (Figure 6d). Compared with KrasLA2 littermates, the combined treatment group developed significantly fewer visible lung tumors from eight weeks after birth. At 16 weeks, the ratio of tumor area to normal area in the combined treatment group decreased to about one third of that the non-treated control group (Figure 6e,f), as did the number of nodules (Figure 6e,f). During the experiment, we did not observe any weight loss in the mice (Figure 6g). Together, these results demonstrate that combined treatment with gossypol and phenformin reduces lung tumor development in vivo.
Oncogenic KRAS plays a key role in controlling tumor metabolism, by changing multiple metabolic pathways to give a favor to cancer cells, including the stimulation of glucose uptake, differential channeling of glucose intermediates, reprogrammed glutamine metabolism, increased autophagy, and micropinocytosis [20]. Cells require one-carbon units for nucleotide synthesis, methylation and reductive metabolism, and these pathways support the high proliferative rate of cancer cells [21]. In this study, KRAS also induces ALDH1L1 in the one-carbon pathway.

3. Discussion

In cancer cells, KRAS mutation induces transcription of genes encoding key enzymes of anabolic glucose metabolism, including glucose transporter 1, hexokinases, phosphofructokinase 1, and lactate dehydrogenase A [7]. KRAS mutation also promotes ribose biosynthesis through the non-oxidative pentose phosphate pathway (PPP), thereby decoupling ribose biogenesis without affecting cellular redox balance (NADP/NADPH ratio) [22]. One glycolytic intermediate, 3-phosphoglycerate, drives carbon into serine synthesis. Serine is required in biosynthesis of other molecules, such as glycine, cysteine, glutathione, and sphingolipids. Serine is also a major donor of one-carbon units to the folate metabolism cycle [12]. Thus, the induction of ALDH1L1 by KRAS promotes the one-carbon pathway in NSCLC (Figure 7).
ALDH1L1 (10-formyltetrahydrofolate dehydrogenase, EC 1.5.1.6) converts 10-formyltetrahydrofolate (10-formyl-THF) to tetrahydrofolate (THF) and CO2 in an NADP+-dependent reaction [24]. The ALDH1L1 protein is the product of a natural fusion of three unrelated genes and consequently consists of three distinct domains: formyl dehydrogenase, 10-formyl-THF hydrolase, and ALDH [24]. Like other ALDH isotypes, ALDH1L1 performs the aldehyde dehydrogenase reaction using NADP+ or NAD+, although the Km for NAD+ is three orders of magnitude higher [25]. However, in the cytosol, the NADP+/NADPH ratio [26] is as much as three orders of magnitude lower than the NAD+/NADH ratio [27], because NADPH is abundantly supplied for anabolism, whereas NADH is rapidly oxidized to NAD+ for catabolism. Exact measurements of NADH or NADPH production by ALDH1L1 have not been performed. NSCLC cells harboring an ALDH1L1 knockdown produce about 10% less NADH than wild-type cells, but no change in the NADPH level was observed [10]. Treatment with the pan-ALDH inhibitor gossypol also decreases the NADH level by about 60% but does not affect the level of NADPH [10]. We observed no reduction of tumor growth in Aldh1l1−/−; KrasLA2 mice, but treatment of these mice with phenformin decreased tumor growth by ~70% (Figure 5), consistent with the 70% reduction in NADH level when ALDH1L1-knockdown NSCLC cells are treated with phenformin [10]. We also confirmed that combined treatment with gossypol and phenformin synergistically decreased the lung tumor area in KrasLA2 mice (Figure 6). As a result of the catalytic reaction by ALDH1L1, NADH is yielded as a by-product from the conversion of 10-formyltetrahydrofolate to carbamate, which turns into ATP through oxidative phosphorylation [28]. We demonstrated that knock down of ALDH1L1 using siRNA or ALDH inhibition using gossypol induced a significant reduction of ATP production in NSCLC [10]. Anti-cancer effect of gossypol alone, however, showed about 20% reduction of tumor growth, while combination treatment of gossypol and phenformin showed about 80% reduction of NSCLC tumor growth [10]. These observations are consistent with a previous report, showing that severe depletion of ATP to levels less than 25% of control triggers cell death [29].
In summary, targeting ALDH1L1 alone did not have an anti-cancer effect in the KrasLA2 lung cancer model, whereas simultaneous inhibition of ALDH1L1 and oxidative phosphorylation significantly decreased tumor formation.

4. Materials and Methods

4.1. Cell Culture

Cell lines were obtained from the National Cancer Institute (NCI; MTA no. 2702-09). Growth medium was complete RPMI-1640, supplemented with 10% fetal bovine serum. Cells were maintained at 37 °C in a humidified incubator with 5% CO2.

4.2. Antibodies and Reagents

Anti-ALDH1L1 (Cat. Ab56777 and Ab175198, 1:1000) and cytokerain 19 (Cat. Ab52625) were purchased from Abcam (Cambridge, UK). Anti-β-actin (Cat. Sc-47778, 1:1000) was purchased from Santa Cruz Biotechnology (Dallas, TX, USA). Anti-KRAS (Cat. H00003845-M01, 1:1000) was purchased from Abnova (Taipei, Taiwan). Control siRNA (sc-37007) and KRAS siRNA (Cat. Sc-35731) were purchased from Santa Cruz Biotechnology. Hs.KRAS4B (Cat. 83129) and Hs.KRAS4B G12D (Cat. 83131) were purchased from Addgene (Watertown, MA, USA). Transfection was performed with jetPEI and INTERFERin (Polyplus, New York, NY, USA). Gossypol acetic acid (Cat. G4382) and phenformin hydrochloride (Cat. P7045) were purchased from Sigma-Aldrich (St. Louis, MO, USA).

4.3. Immunoblotting

Whole cell lysates were prepared using RIPA buffer (Cat. R0278, Sigma-Aldrich), with protease inhibitor cocktail (P8340, Sigma-Aldrich). Protein concentrations were determined using the Bradford protein assay (Cat. 23227, Thermo Fisher Scientific, Waltham, MA, USA). Proteins were resolved by SDS-PAGE and transferred to PVDF membranes. Membranes were blocked in 5% BSA for 1 h at room temperature (RT), and then incubated overnight at 4 °C with the indicated antibodies. Membranes were washed for 1 h at RT in TBS-T, followed by incubation with a horseradish peroxidase-conjugated secondary antibody for 1 h at RT. Finally, membranes were washed for 1 h at RT in TBS-T. Protein band images were visualized using ECL reagent (Ab frontier, Seoul, Korea) on a FUSION solo (VILBER, Collégien, France).

4.4. ALDH1L1 Promoter Assay

The ALDH1L1 promoter reporter construct was generated by inserting the human ALDH1L1 promoter (including 1 kb upstream) into pLenti6-MINp-FLuc-Rluc-TKp. The pLenti6-MINp-FLuc-Rluc-TKp vector was constructed by inserting the herpes simplex virus (HSV)-thymidine kinase (TK) promoter (TKp) and Renilla luciferase (Rluc) in the opposite directions in the pLenti6-MINp-FLuc vector. The pLenti6-MINp-FLuc vector was constructed by inserting a minimal promoter (MINp) and firefly luciferase (Fluc) into pLenti6-GFP (Addgene Plasmid #35637) in place of the CMV enhancer, CMV promoter, and GFP.
Firefly and Renilla luciferase activities were measured using the Dual-Glo Luciferase Assay system E2940 (Promega, Madison, WI, USA). Briefly, after treatment with KRAS siRNA for 24 h, 75 μL Dual-Glo luciferase reagent was added to each well, and the plates were incubated for 10 min at room temperature. After measurement of firefly luminescence, Dual-Glo Stop & Glo reagent was added to the plate. After incubation at room temperature for 10 min, Renilla luminescence was measured, and the ratio of firefly to Renilla luminescence was calculated.
In silico transcription factor binding suite predictions were performed with ConSite (http://consite.genereg.net).

4.5. Spontaneous Lung Cancer Model

To assess the therapeutic effects of gossypol and phenformin, we employed the KrasLA2 murine lung cancer model, which contains a targeted, latent KrasG12D allele that is activated by recombination [18]. Mice were obtained from the NCI mouse repository (strain number: 01BM3, common strain name: KrasLA2, strain nomenclature: B6.129S-Krastm3Tyj/Nci). KrasLA2 mice were backcrossed to C57BL/6 for at least six generations. After the weaning period (6 weeks after birth) the KrasLA2 mice (four per group) were treated with a combination of gossypol (40 mg/kg) and phenformin (100 mg/kg) for 5 days a week, until they were sacrificed at 8, 12, and 16 weeks of age. For determination of tumor incidence and grade, whole lungs were manually inflated with 10% neutral-buffered formalin, placed in fixative for 1 day, embedded in paraffin, and sectioned. H&E staining was performed by standard procedures. Lung tumor areas were determined using ImageJ. Tumor burden was expressed as the total tumor area divided by normal lung area. This study was reviewed and approved by the Institutional Animal Care and Use Committee (IACUC) of National Cancer Center Research Institute. NCCRI is an AAALAC International accredited facility and abides by the Institute of Laboratory Animal Resources (ILAR) guide. The ethical code is NCC-15-277 (19 September 2016), NCC-17-277B (30 June 2018) and NCC-18-277B (31 August 2019).

4.6. Automated Immunohistochemistry

Immunohistochemistry assays were performed on a VENTANA Discovery XT automated staining instrument (Ventana Medical Systems, Tucson, AZ, USA). Slides were de-paraffinized using EZ Prep solution (Ventana Medical Systems) for 30 min at 75 °C. Epitope retrieval with CC1 solution (Ventana Medical Systems) was performed for 64 min at 95 °C. Antibodies were first titered over a range of concentrations to provide the optimum ratio of specific staining to background staining. Once titers were set, antibodies were transferred with diluent to user-fillable dispensers for use on the automated stainer. Anti-ALDH1L1 (ab175198, 1:50) and cytokeratin 19 (ab52625, 1:1000) antibodies were acquired from Cell Signaling Technology (Danvers, MA, USA). Slides were developed using the OptiView DAB detection kit (Ventana Medical Systems). Briefly, samples were incubated with inhibitor for 8 min, linker for 8 min, multimer for 12 min, DAB/peroxide for 8 min, and copper for 4 min. The slides were then counterstained for 8 min with hematoxylin II (Ventana Medical Systems). Antibody titers were determined for each antibody using positive and negative control tissues, according to the manufacturer’s instructions.

5. Conclusions

KRAS upregulates the expression of ALDH1L1 in NSCLC cells, which exhibited an increase of ALDH1L1 in Kras-driven lung cancer model. Although targeting ALDH1L1 alone did not have an anti-cancer effect in the KrasLA2 lung cancer model, simultaneous inhibition with gossypol and phenformin significantly decreased tumor formation. These results suggest that combined inhibition of ALDH activity and oxidative phosphorylation represents a promising therapeutic strategy for NSCLC.

Supplementary Materials

The following are available online at https://www.mdpi.com/2072-6694/12/6/1382/s1, Figure S1: Detailed information about western blot in Figure 1, Figure S2: Detailed information about western blot in Figure 3.

Author Contributions

Conceptualization, S.-Y.K.; methodology, S.-H.L. and Y.J.; validation S.-H.L., J.H.K. and H.J.; formal analysis, S.-H.L., Y.J., and J.H.K.; investigation and resources, S.-H.L. and Y.J.; data curation, S.-H.L., Y.J., J.H.K. and H.J.; writing—original draft preparation, S.-Y.K. and H.L.; writing—review and editing, S.-Y.K.; visualization, S.-H.L. and Y.J.; supervision, H.J., H.L. and S.-Y.K.; project administration, S.-Y.K.; funding acquisition, H.L. and S.-Y.K. All authors have read and agreed to the published version of the manuscript.

Funding

This research was supported by the National Research Foundation of Korea (NRF), funded by the Ministry of Science and ICT to S.-Y.K. (2017R1A2B2003428), a research grant from the National Cancer Center of Korea to S.-Y.K., H.J. (1910291) and an NRF Multi-Omics Program to H.L. (2012M3A9B9036679).

Acknowledgments

We thank Mi Ae Kim of the Microscopy Core and Tae Sik Kim of the Flow Cytometry Core (National Cancer Center), for their expert assistance and helpful suggestions.

Conflicts of Interest

The authors declare no conflict of interest.

References

  1. Roman, M.; Baraibar, I.; Lopez, I.; Nadal, E.; Rolfo, C.; Vicent, S.; Gil-Bazo, I. KRAS oncogene in non-small cell lung cancer: Clinical perspectives on the treatment of an old target. Mol. Cancer 2018, 17, 33. [Google Scholar] [CrossRef] [PubMed] [Green Version]
  2. Friedlaender, A.; Drilon, A.; Weiss, G.J.; Banna, G.L.; Addeo, A. KRAS as a druggable target in NSCLC: Rising like a phoenix after decades of development failures. Cancer Treat. Rev. 2020, 85, 101978. [Google Scholar] [CrossRef] [PubMed]
  3. Rissmann, R.; Hessel, M.H.; Cohen, A.F. Vemurafenib/dabrafenib and trametinib. Br. J. Clin. Pharmacol. 2015, 80, 765–767. [Google Scholar] [CrossRef] [PubMed] [Green Version]
  4. Canon, J.; Rex, K.; Saiki, A.Y.; Mohr, C.; Cooke, K.; Bagal, D.; Gaida, K.; Holt, T.; Knutson, C.G.; Koppada, N.; et al. The clinical KRAS(G12C) inhibitor AMG 510 drives anti-tumour immunity. Nature 2019, 575, 217–223. [Google Scholar] [CrossRef]
  5. Pupo, E.; Avanzato, D.; Middonti, E.; Bussolino, F.; Lanzetti, L. KRAS-driven metabolic rewiring reveals novel actionable targets in cancer. Front. Oncol. 2019, 9, 848. [Google Scholar] [CrossRef] [Green Version]
  6. Dias Carvalho, P.; Guimaraes, C.F.; Cardoso, A.P.; Mendonca, S.; Costa, A.M.; Oliveira, M.J.; Velho, S. KRAS oncogenic signaling extends beyond cancer cells to orchestrate the microenvironment. Cancer Res. 2018, 78, 7–14. [Google Scholar] [CrossRef] [Green Version]
  7. Cox, A.D.; Fesik, S.W.; Kimmelman, A.C.; Luo, J.; Der, C.J. Drugging the undruggable RAS: Mission possible? Nat. Rev. Drug Discov. 2014, 13, 828–851. [Google Scholar] [CrossRef] [Green Version]
  8. Li, X.; Wan, L.; Geng, J.; Wu, C.L.; Bai, X. Aldehyde dehydrogenase 1A1 possesses stem-like properties and predicts lung cancer patient outcome. J. Thorac. Oncol. 2012, 7, 1235–1245. [Google Scholar] [CrossRef] [Green Version]
  9. Jiang, F.; Qiu, Q.; Khanna, A.; Todd, N.W.; Deepak, J.; Xing, L.; Wang, H.; Liu, Z.; Su, Y.; Stass, S.A.; et al. Aldehyde dehydrogenase 1 is a tumor stem cell-associated marker in lung cancer. Mol. Cancer Res. 2009, 7, 330–338. [Google Scholar] [CrossRef] [Green Version]
  10. Kang, J.H.; Lee, S.H.; Lee, J.S.; Nam, B.; Seong, T.W.; Son, J.; Jang, H.; Hong, K.M.; Lee, C.; Kim, S.Y. Aldehyde dehydrogenase inhibition combined with phenformin treatment reversed NSCLC through ATP depletion. Oncotarget 2016, 7, 49397–49410. [Google Scholar] [CrossRef]
  11. Cook, R.J.; Lloyd, R.S.; Wagner, C. Isolation and characterization of cDNA clones for rat liver 10-formyltetrahydrofolate dehydrogenase. J. Biol. Chem. 1991, 266, 4965–4973. [Google Scholar] [PubMed]
  12. Yang, M.; Vousden, K.H. Serine and one-carbon metabolism in cancer. Nat. Rev. Cancer 2016, 16, 650–662. [Google Scholar] [CrossRef] [PubMed]
  13. Anguera, M.C.; Field, M.S.; Perry, C.; Ghandour, H.; Chiang, E.P.; Selhub, J.; Shane, B.; Stover, P.J. Regulation of folate-mediated one-carbon metabolism by 10-formyltetrahydrofolate dehydrogenase. J. Biol. Chem. 2006, 281, 18335–18342. [Google Scholar] [CrossRef] [PubMed] [Green Version]
  14. Ducker, G.S.; Rabinowitz, J.D. One-carbon metabolism in health and disease. Cell Metab. 2017, 25, 27–42. [Google Scholar] [CrossRef] [PubMed] [Green Version]
  15. Fan, J.; Ye, J.; Kamphorst, J.J.; Shlomi, T.; Thompson, C.B.; Rabinowitz, J.D. Quantitative flux analysis reveals folate-dependent NADPH production. Nature 2014, 510, 298–302. [Google Scholar] [CrossRef] [PubMed] [Green Version]
  16. Vasan, N.; Boyer, J.L.; Herbst, R.S. A RAS renaissance: Emerging targeted therapies for KRAS-mutated non-small cell lung cancer. Clin. Cancer Res. 2014, 20, 3921–3930. [Google Scholar] [CrossRef] [PubMed] [Green Version]
  17. Kent, O.A.; Sandi, M.J.; Burston, H.E.; Brown, K.R.; Rottapel, R. An oncogenic KRAS transcription program activates the RHOGEF ARHGEF2 to mediate transformed phenotypes in pancreatic cancer. Oncotarget 2017, 8, 4484–4500. [Google Scholar] [CrossRef] [Green Version]
  18. Johnson, L.; Mercer, K.; Greenbaum, D.; Bronson, R.T.; Crowley, D.; Tuveson, D.A.; Jacks, T. Somatic activation of the K-ras oncogene causes early onset lung cancer in mice. Nature 2001, 410, 1111–1116. [Google Scholar] [CrossRef]
  19. Barillo, J.L.; da Silva, C.T., Jr.; Silva, P.S.; de Souza, J.B.S.; Kanaan, S.; Xavier, A.R.; de Araujo, E.G. Increased cytokeratin 19 fragment levels are positively correlated with adenosine deaminase activity in malignant pleural effusions from adenocarcinomas. Dis. Markers 2018, 2018, 2609767. [Google Scholar] [CrossRef] [Green Version]
  20. Bryant, K.L.; Mancias, J.D.; Kimmelman, A.C.; Der, C.J. KRAS: Feeding pancreatic cancer proliferation. Trends Biochem. Sci. 2014, 39, 91–100. [Google Scholar] [CrossRef] [Green Version]
  21. Newman, A.C.; Maddocks, O.D.K. One-carbon metabolism in cancer. Br. J. Cancer 2017, 116, 1499–1504. [Google Scholar] [CrossRef] [PubMed]
  22. DeBerardinis, R.J.; Chandel, N.S. Fundamentals of cancer metabolism. Sci. Adv. 2016, 2, e1600200. [Google Scholar] [CrossRef] [PubMed] [Green Version]
  23. Ying, H.; Kimmelman, A.C.; Lyssiotis, C.A.; Hua, S.; Chu, G.C.; Fletcher-Sananikone, E.; Locasale, J.W.; Son, J.; Zhang, H.; Coloff, J.L.; et al. Oncogenic Kras maintains pancreatic tumors through regulation of anabolic glucose metabolism. Cell 2012, 149, 656–670. [Google Scholar] [CrossRef] [PubMed] [Green Version]
  24. Krupenko, S.A. FDH: An aldehyde dehydrogenase fusion enzyme in folate metabolism. Chem. Biol. Interact. 2009, 178, 84–93. [Google Scholar] [CrossRef] [PubMed] [Green Version]
  25. Krupenko, S.A.; Wagner, C.; Cook, R.J. Expression, purification, and properties of the aldehyde dehydrogenase homologous carboxyl-terminal domain of rat 10-formyltetrahydrofolate dehydrogenase. J. Biol. Chem. 1997, 272, 10266–10272. [Google Scholar] [CrossRef] [Green Version]
  26. Veech, R.L.; Eggleston, L.V.; Krebs, H.A. The redox state of free nicotinamide-adenine dinucleotide phosphate in the cytoplasm of rat liver. Biochem. J. 1969, 115, 609–619. [Google Scholar] [CrossRef]
  27. Lin, S.J.; Guarente, L. Nicotinamide adenine dinucleotide, a metabolic regulator of transcription, longevity and disease. Curr. Opin. Cell Biol. 2003, 15, 241–246. [Google Scholar] [CrossRef]
  28. Krupenko, S.A.; Krupenko, N.I. ALDH1L1 and ALDH1L2 folate regulatory enzymes in cancer. Adv. Exp. Med. Biol. 2018, 1032, 127–143. [Google Scholar] [PubMed]
  29. Lieberthal, W.; Menza, S.A.; Levine, J.S. Graded ATP depletion can cause necrosis or apoptosis of cultured mouse proximal tubular cells. Am. J. Physiol. 1998, 274, F315–F327. [Google Scholar] [CrossRef] [PubMed]
Figure 1. KRAS regulates ALDH1L1 expression. (a) KRAS-mutant NSCLC cells were treated with control or KRAS siRNA, and then subjected to immunoblotting with the indicated antibodies. (b) KRAS WT NSCLC cells were transfected with control (empty vector), WT KRAS, or mutant (G12D) KRAS and subjected to immunoblotting with the indicated antibodies. Quantifications of protein density were presented as mean ± standard deviation (n = 3, vs. control, ** p < 0.01, *** p < 0.001 and **** p < 0.0001). Detailed information about western blot can be found at Figure S1.
Cancers 12 01382 g001
Figure 2. ALDH1L1 is a target of oncogenic KRAS. (a) Schematic representation of the reporter construct used in the cell-based transduction system. This lentiviral reporter construct expressed firefly luciferase under the control of the ALDH1L1 promoter and Renilla luciferase under the control of the HSV TK promoter. (b) KRAS-mutant NSCLC cells stably expressing the reporter system described in (a) were treated with control or KRAS siRNA. Firefly and Renilla luciferase activities were normalized against the corresponding levels in the sample transfected with control siRNA. Bars show relative luciferase activity (n = 3). (c) KRAS WT NSCLC cells stably expressing the reporter system described in (a) were transfected with control (empty vector), KRAS WT, or KRAS mutant (G12D). Firefly and Renilla luciferase activities were normalized against the corresponding levels in the sample transfected with empty vector. Bars indicate relative luciferase activity (n = 3). (d) In silico prediction of binding sites for transcription factors downstream of KRAS: SP1, transcription factor Sp1; Elk-1, ETS Like-1 transcription factor. (e) Immunohistochemical staining of ALDH1L1 in lungs isolated from KrasLA2 mice at 8, 12, and 16 weeks of age. The scale bar represents 200 mm (** p < 0.01, *** p < 0.001 and **** p < 0.0001).
Cancers 12 01382 g002
Figure 3. Generation of Aldh1l1-knockout mice. (a) Strategy for generating Aldh1l1 knockout mice. (b) Aldh1l1 gene disruption was confirmed by PCR genotyping. Tail genomic DNA was amplified, with specific primers for wild-type (311 bp) and mutant (307 bp) Aldh1l1 alleles. +/+, wild-type; +/−, heterozygous; −/−, homozygous (knockout). (c) Immunoblotting analysis showing the absence of ALDH1L1 in protein extracts of tissues from an Aldh1l1−/− mouse. Detailed information about western blot can be found at Figure S2.
Cancers 12 01382 g003
Figure 4. Characterizations of KrasLA2 mice lungs. (a) Representative photomicrographs of hematoxylin and eosin (H&E) staining in mouse lungs, harvested from 4 to 32 weeks after birth. Black box indicates hyperplastic lesion and red box indicates adenoma in 32 weeks of KrasLA2 mice lung, respectively. The scale bar represents 400 μm. (b) Quantitative analysis of number of tumor nodules in mouse lungs from 4 to 32 weeks after birth (n = 5). (c) KrasLA2 mice lungs were analyzed and all lesions were classified for hyperplasia and adenoma. p-values were obtained by one-way or two-way ANOVA test and are indicated by asterisks (* p < 0.05, ** p < 0.01, *** p < 0.001 and **** p < 0.0001).
Cancers 12 01382 g004
Figure 5. Deletion of Aldh1l1 in combination with phenformin treatment suppresses Kras-driven lung tumorigenesis. (a) Scheme of the experimental protocol. KrasLA2; Aldh1l1+/+ or KrasLA2; Aldh1l1−/− mice were treated with phenformin (100 mg/kg) or vehicle control by oral administration. Drug was administered once a day, 5 days a week, for 10 weeks from 6 to 16 weeks after birth. (b) Representative photomicrographs of hematoxylin and eosin (H&E) staining (Top), hyperplasia lesion (Middle, black box) and adenoma lesion (Bottom, red box) in mouse lungs harvested 16 weeks after birth. Scale bar = 400 μm. (c) Lungs of mice were analyzed, and all lesions were classified for hyperplasia and adenoma. (d) Representative photomicrographs of cytokeratin 19 staining in mouse lungs harvested 16 weeks after birth. Quantitative analysis of (e) number of tumor nodules and (f) tumor area in mouse lungs 16 weeks after birth. Tumor area (expressed as %) was calculated by dividing the total tumor area by the total area of the lung. p-values were obtained by one-way ANOVA test and are indicated by asterisks (* p < 0.05; ** p < 0.01; *** p < 0.001). (g) Body weight was measured once a week (n = 7).
Cancers 12 01382 g005
Figure 6. Combined treatment with gossypol and phenformin suppresses KRAS-driven lung tumorigenesis in mice. (a) Scheme of the experimental protocol. KrasLA2 mice were divided into two groups: one group was the control, and the other was treated with gossypol (40 mg/kg) and phenformin (100 mg/kg) by oral administration once a day, 5 days a week, for 10 weeks, from 6 to 16 weeks after birth. (b) Representative photomicrographs of hematoxylin and eosin (H&E) staining (Top), hyperplasia lesion (Middle, black box) and adenoma lesion (Bottom, red box) in mouse lungs harvested 16 weeks after birth. Scale bar = 400 μm. (c) Lungs of mice were analyzed, and all lesions were classified for hyperplasia and adenoma. (d) Representative photomicrographs of cytokeratin 19 staining in mouse lungs, harvested 16 weeks after birth. (e) Quantitative analysis of the number of tumor nodules and (f) tumor area (expressed as %) in the lung of control (n = 4) or gossypol/phenformin treated (n = 4) KrasLA2 mice at 8, 12, and 16 weeks after birth. Tumor burden (expressed as %) was calculated by dividing the total tumor area by the total area of the lung. p-values were obtained by one-way ANOVA test and are indicated by asterisks (** p < 0.01; *** p < 0.001; **** p < 0.0001). (g) Body weight was measured once a week (n = 4).
Cancers 12 01382 g006
Figure 7. KRAS promotes glycolysis, protein and lipid synthesis and one carbon pathway [23]. Induction of ALDH1L1 by KRAS promotes the one-carbon pathway in NSCLC. Gossypol and phenformin reduces NADH and ATP production, respectively.
Cancers 12 01382 g007

