Human Medulloblastoma Cell Lines: Investigating on Cancer Stem Cell-Like Phenotype

 , , , , , ,
  , ,
, ,  , and
, and 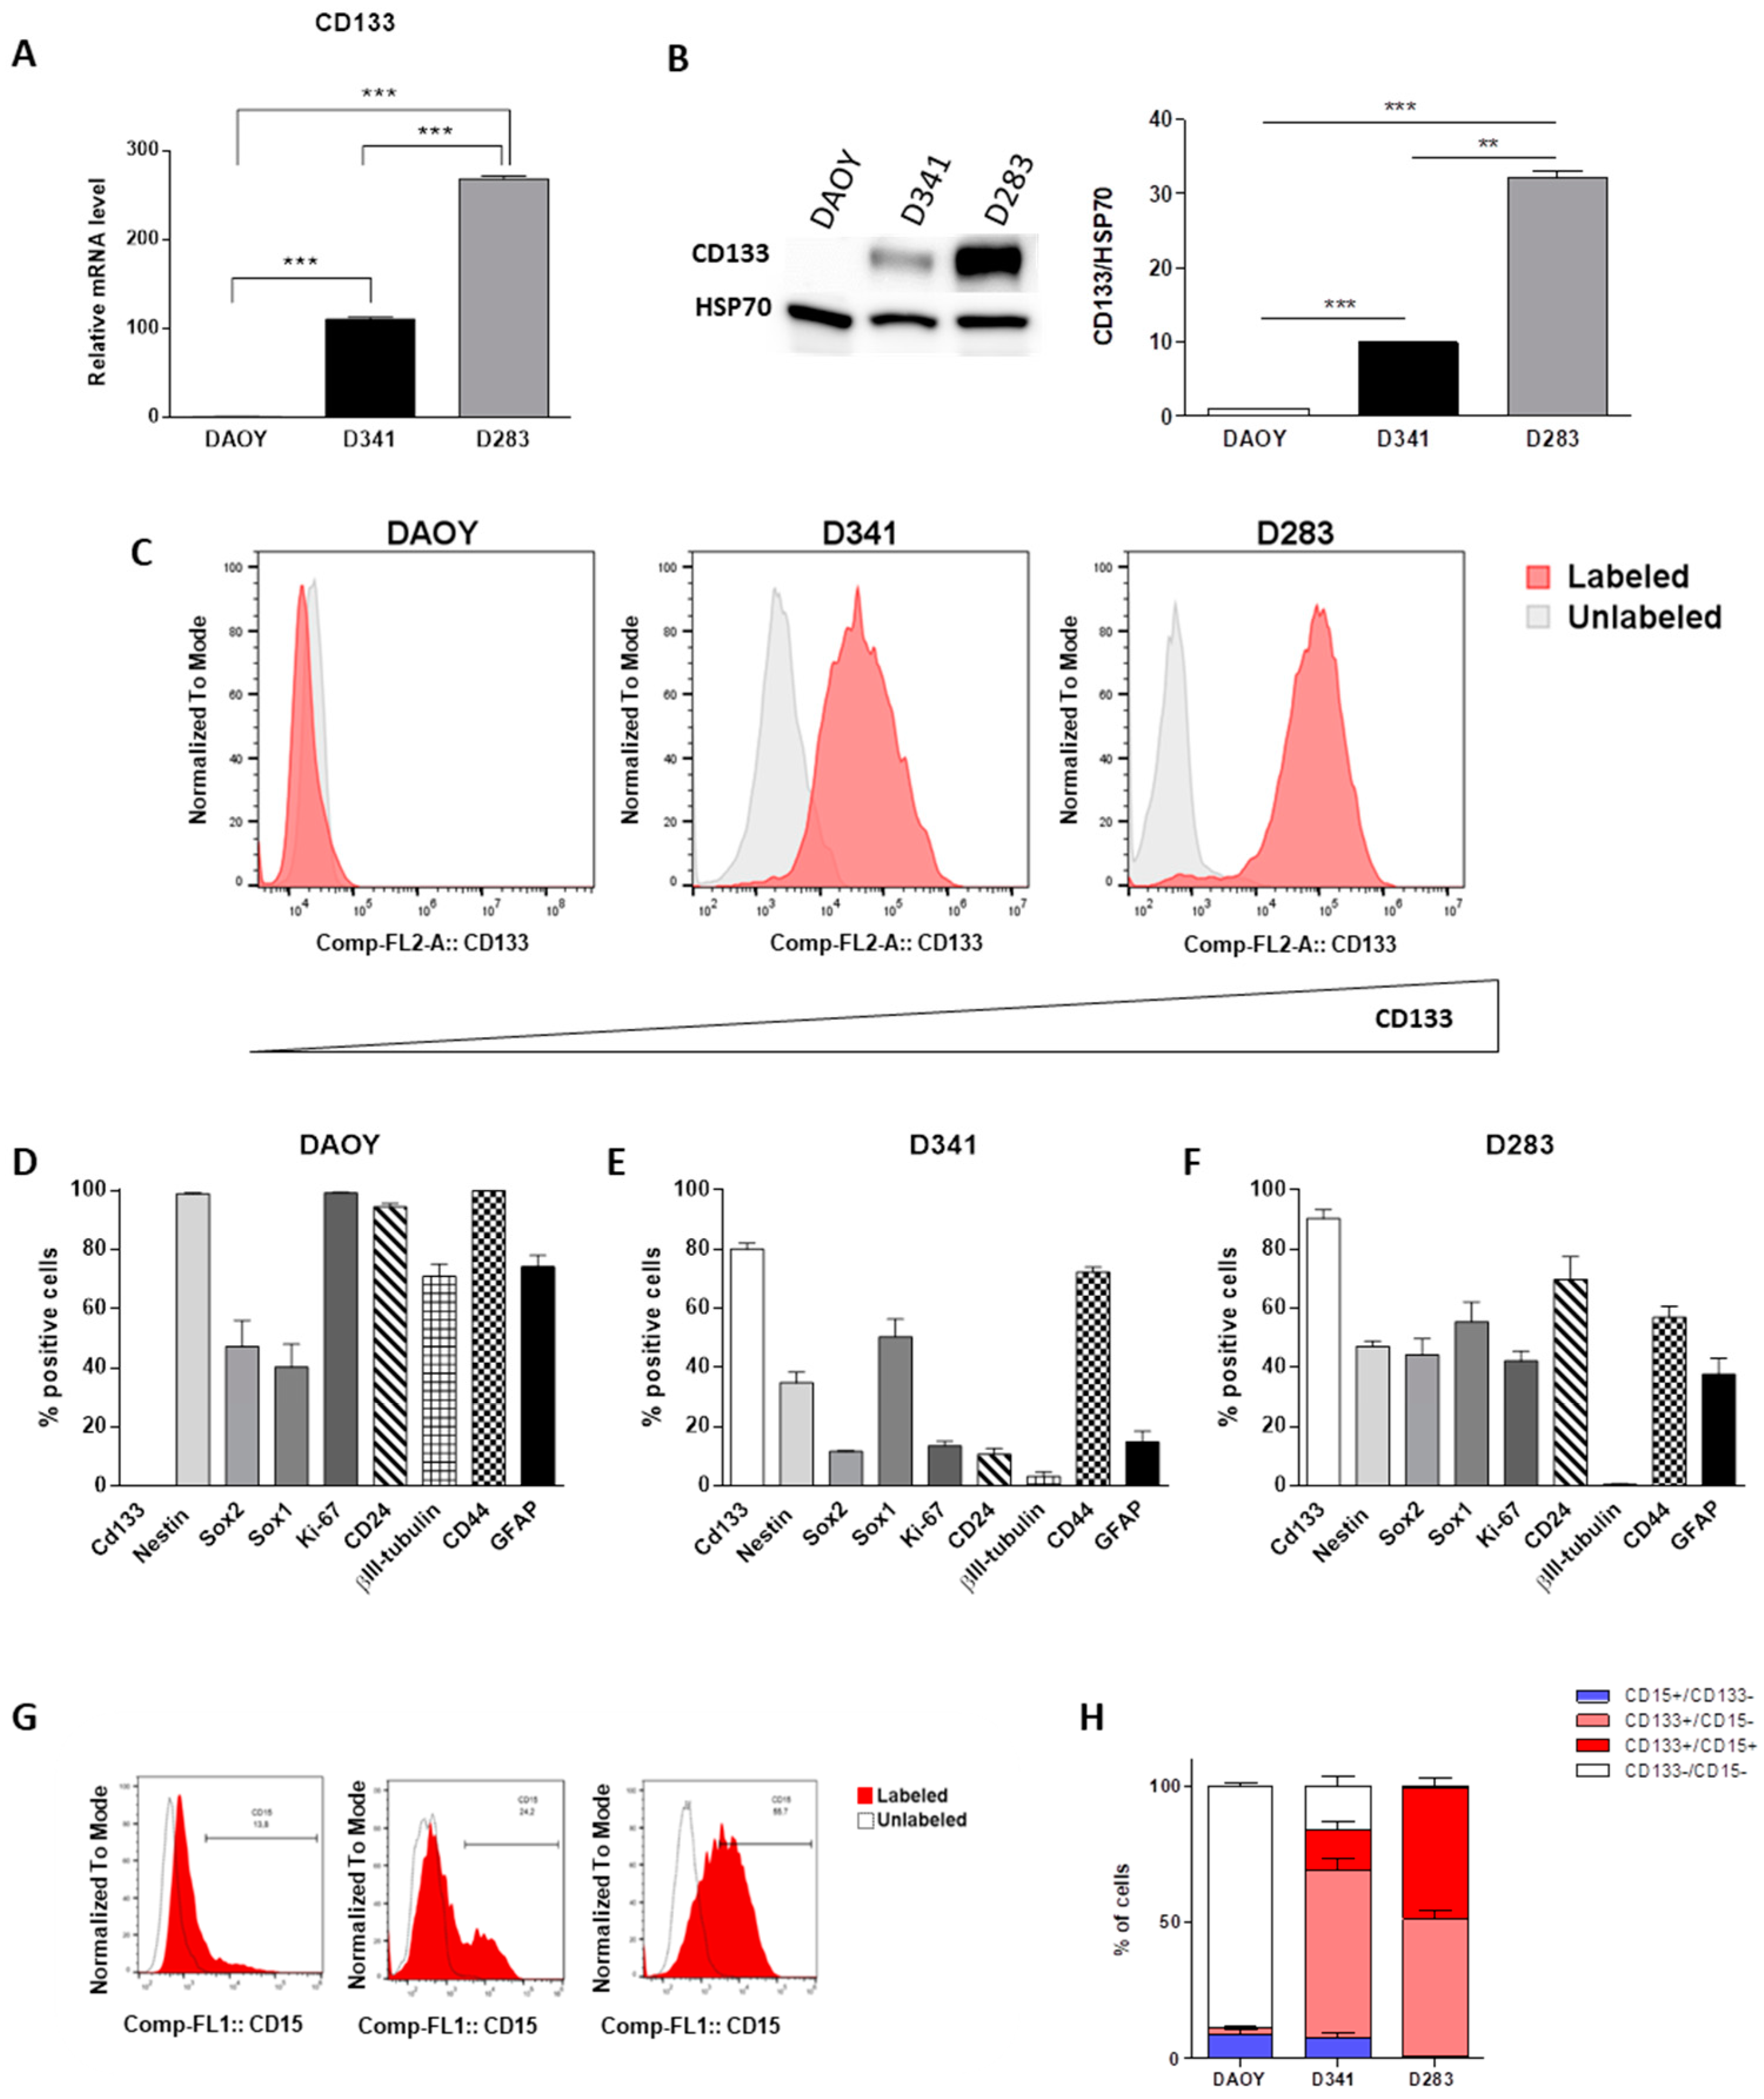
Abstract
:1. Introduction
2. Results
2.1. Evaluation of Multiple Stemness Markers
2.2. Medullospheres Characterization
2.3. HF–DEP Crossover Frequency
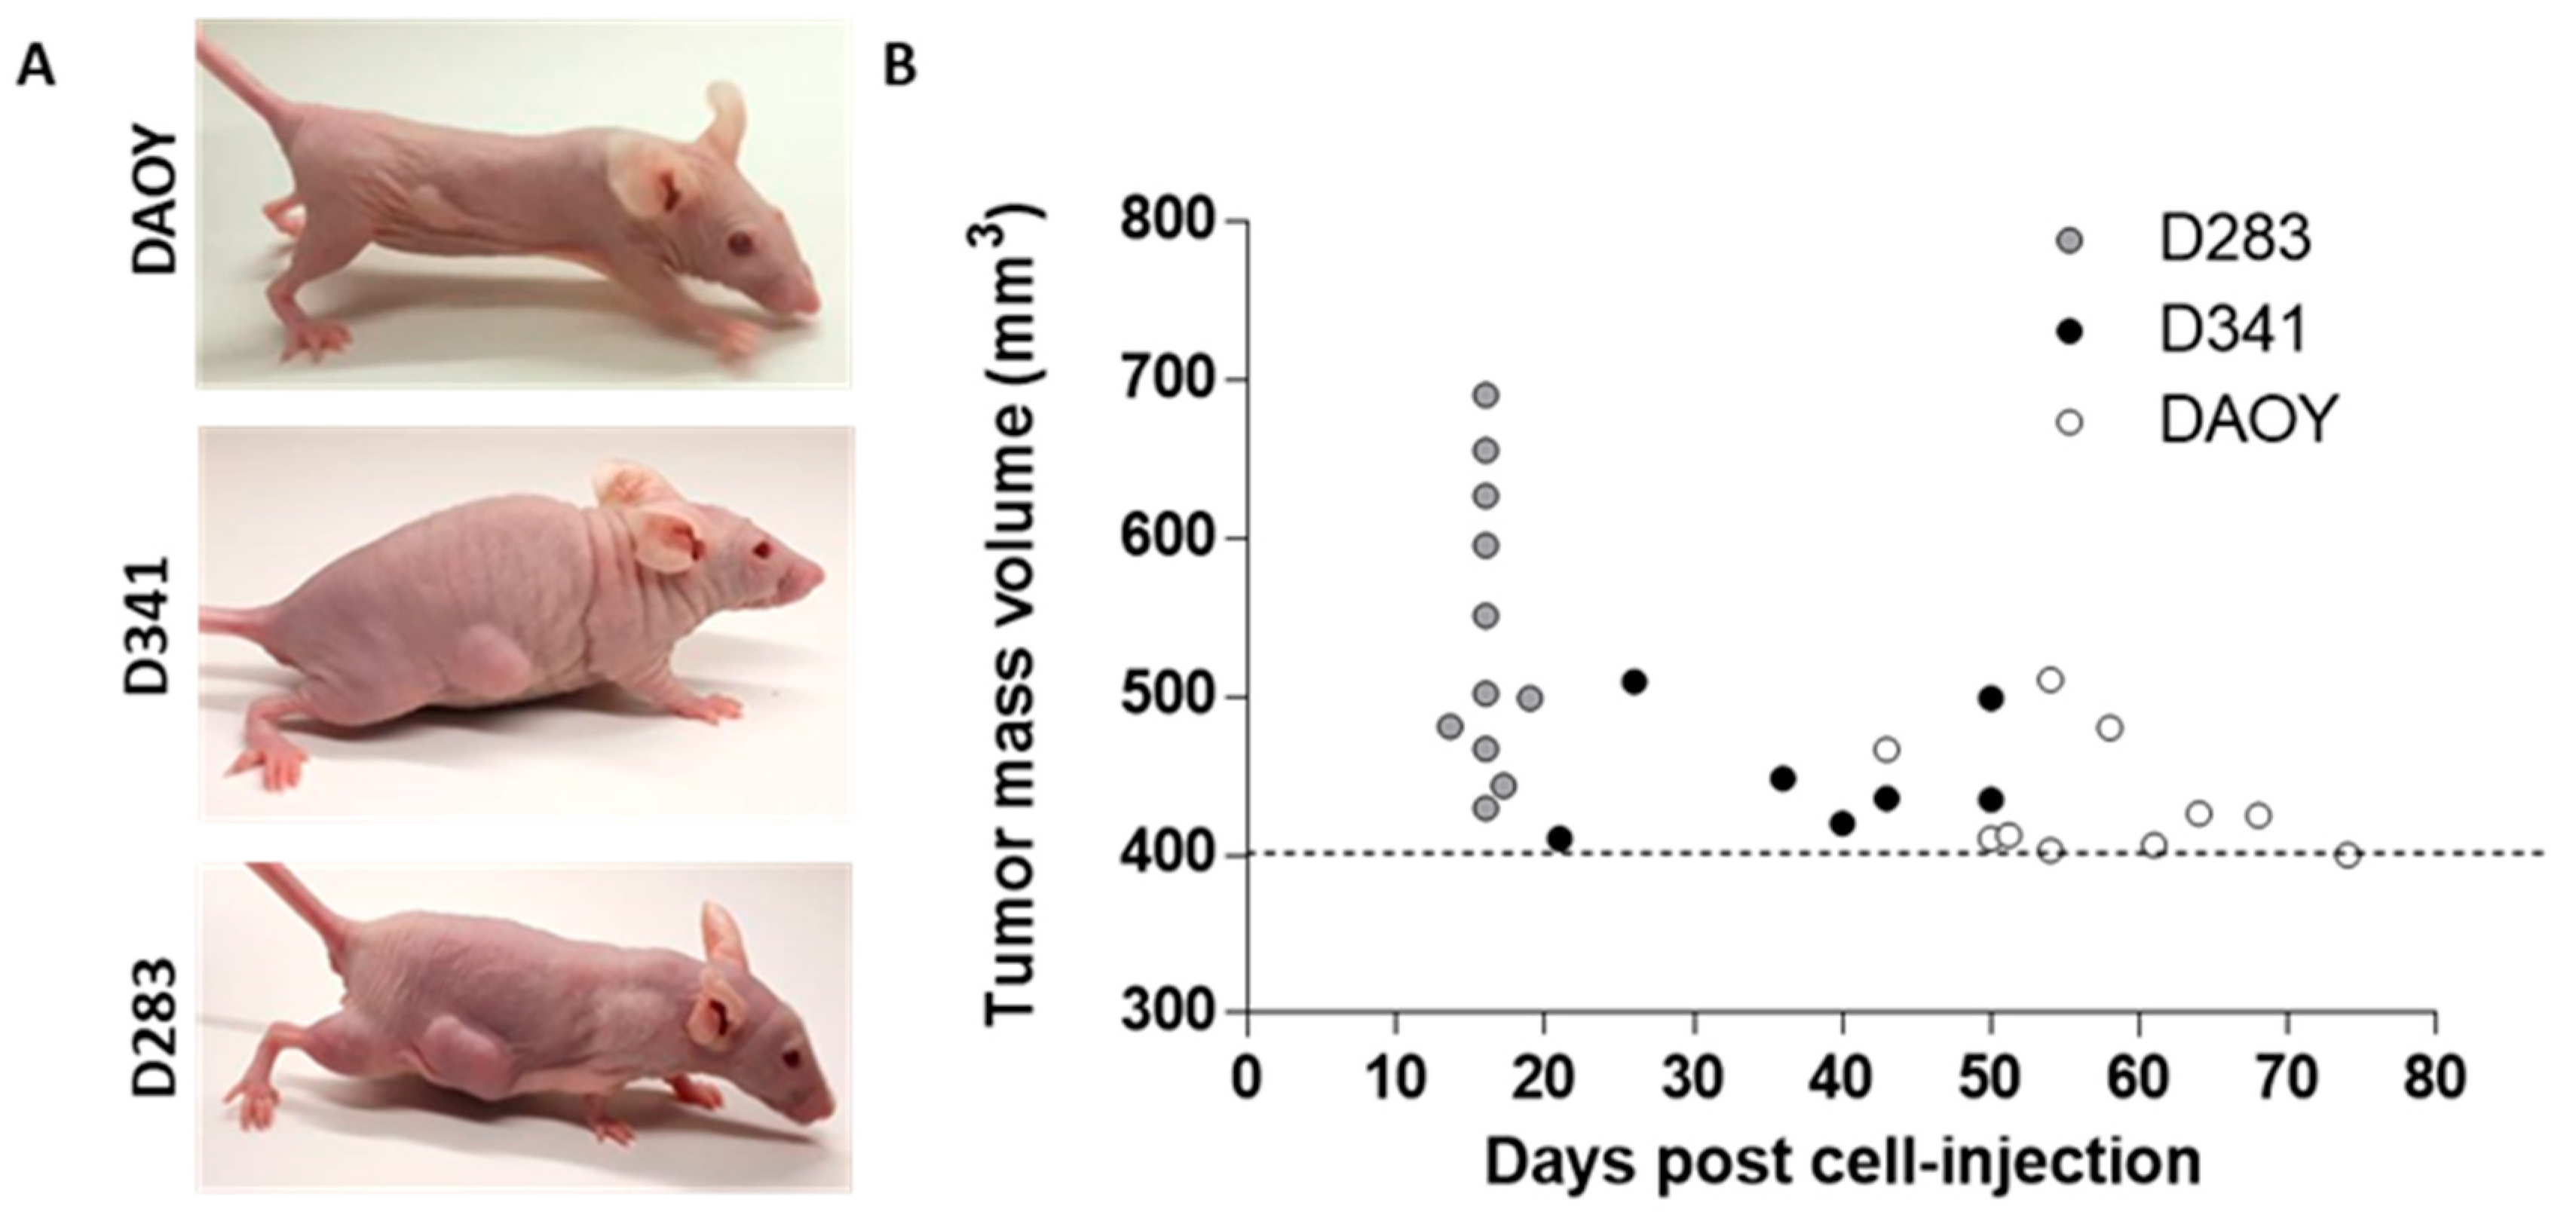
2.4. Tumor-Propagating Capacity
3. Discussion
4. Materials and Methods
4.1. Cell Cultures
4.2. Medullosphere Formation Assay
4.3. Limiting Dilution Assay
4.4. RNA Isolation and Real-Time qPCR (qRTPCR)
4.5. Western Blot
4.6. Flow Cytometry Analysis
4.7. HF–DEP Crossover Frequency
4.8. Principal Component Analysis (PCA)
4.9. Subcutaneous Xenograft Model
4.10. Statistical Analysis
5. Conclusions
Supplementary Materials
Author Contributions
Funding
Conflicts of Interest
References
- Ferlay, J.; Soerjomataram, I.; Dikshit, R.; Eser, S.; Mathers, C.; Rebelo, M.; Parkin, D.M.; Forman, D.; Bray, F. Cancer incidence and mortality worldwide: Sources, methods and major patterns in GLOBOCAN 2012. Int. J. Cancer 2015, 136, E359–E386. [Google Scholar] [CrossRef] [PubMed]
- Ward, E.; DeSantis, C.; Robbins, A.; Kohler, B.; Jemal, A. Childhood and adolescent cancer statistics, 2014. CA Cancer J. Clin. 2014, 64, 83–103. [Google Scholar] [CrossRef] [PubMed]
- Ferlay, J.; Shin, H.R.; Bray, F.; Forman, D.; Mathers, C.; Parkin, D.M. Estimates of worldwide burden of cancer in 2008: GLOBOCAN 2008. Int. J. Cancer 2010, 127, 2893–2917. [Google Scholar] [CrossRef] [PubMed]
- Siegel, R.L.; Miller, K.D.; Jemal, A. Cancer Statistics, 2017. CA Cancer J. Clin. 2017, 67, 7–30. [Google Scholar] [CrossRef] [Green Version]
- Ivanov, D.P.; Coyle, B.; Walker, D.A.; Grabowska, A.M. In Vitro models of medulloblastoma: Choosing the right tool for the job. J. Biotechnol. 2016, 236, 10–25. [Google Scholar] [CrossRef]
- Ostrom, Q.T.; Gittleman, H.; Fulop, J.; Liu, M.; Blanda, R.; Kromer, C.; Wolinsky, Y.; Kruchko, C.; Barnholtz-Sloan, J.S. CBTRUS Statistical Report: Primary Brain and Central Nervous System Tumors Diagnosed in the United States in 2008–2012. Neuro Oncol. 2015, 17 (Suppl. 4), iv1–iv62. [Google Scholar] [CrossRef]
- Taylor, M.D.; Northcott, P.A.; Korshunov, A.; Remke, M.; Cho, Y.J.; Clifford, S.C.; Eberhart, C.G.; Parsons, D.W.; Rutkowski, S.; Gajjar, A.; et al. Molecular subgroups of medulloblastoma: The current consensus. Acta Neuropathol. 2012, 123, 465–472. [Google Scholar] [CrossRef] [Green Version]
- Ramaswamy, V.; Remke, M.; Bouffet, E.; Faria, C.C.; Perreault, S.; Cho, Y.J.; Shih, D.J.; Luu, B.; Dubuc, A.M.; Northcott, P.A.; et al. Recurrence patterns across medulloblastoma subgroups: An integrated clinical and molecular analysis. Lancet Oncol. 2013, 14, 1200–1207. [Google Scholar] [CrossRef] [Green Version]
- Schroeder, K.; Gururangan, S. Molecular variants and mutations in medulloblastoma. Pharmgenom. Personal. Med. 2014, 7, 43–51. [Google Scholar] [CrossRef] [Green Version]
- Goschzik, T.; Zur Mühlen, A.; Kristiansen, G.; Haberler, C.; Stefanits, H.; Friedrich, C.; von Hoff, K.; Rutkowski, S.; Pfister, S.M.; Pietsch, T. Molecular stratification of medulloblastoma: Comparison of histological and genetic methods to detect Wnt activated tumours. Neuropathol. Appl. Neurobiol. 2015, 41, 135–144. [Google Scholar] [CrossRef]
- Pietsch, T.; Schmidt, R.; Remke, M.; Korshunov, A.; Hovestadt, V.; Jones, D.T.; Felsberg, J.; Kaulich, K.; Goschzik, T.; Kool, M.; et al. Prognostic significance of clinical, histopathological, and molecular characteristics of medulloblastomas in the prospective HIT2000 multicenter clinical trial cohort. Acta Neuropathol. 2014, 128, 137–149. [Google Scholar] [CrossRef] [PubMed] [Green Version]
- Shih, D.J.; Northcott, P.A.; Remke, M.; Korshunov, A.; Ramaswamy, V.; Kool, M.; Luu, B.; Yao, Y.; Wang, X.; Dubuc, A.M.; et al. Cytogenetic prognostication within medulloblastoma subgroups. J. Clin. Oncol. 2014, 32, 886–896. [Google Scholar] [CrossRef] [PubMed] [Green Version]
- Ramaswamy, V.; Remke, M.; Bouffet, E.; Bailey, S.; Clifford, S.C.; Doz, F.; Kool, M.; Dufour, C.; Vassal, G.; Milde, T.; et al. Risk stratification of childhood medulloblastoma in the molecular era: The current consensus. Acta Neuropathol. 2016, 131, 821–831. [Google Scholar] [CrossRef] [PubMed] [Green Version]
- Northcott, P.A.; Buchhalter, I.; Morrissy, A.S.; Hovestadt, V.; Weischenfeldt, J.; Ehrenberger, T.; Gröbner, S.; Segura-Wang, M.; Zichner, T.; Rudneva, V.A.; et al. The whole-genome landscape of medulloblastoma subtypes. Nature 2017, 547, 311–317. [Google Scholar] [CrossRef] [PubMed] [Green Version]
- Hovestadt, V.; Smith, K.S.; Bihannic, L.; Filbin, M.G.; Shaw, M.L.; Baumgartner, A.; DeWitt, J.C.; Groves, A.; Mayr, L.; Weisman, H.R.; et al. Resolving medulloblastoma cellular architecture by single-cell genomics. Nature 2019, 572, 74–79. [Google Scholar] [CrossRef] [PubMed]
- Dick, J.E. Looking ahead in cancer stem cell research. Nat. Biotechnol. 2009, 27, 44–46. [Google Scholar] [CrossRef]
- Zhao, F.; Zhang, J.; Li, P.; Zhou, Q.; Zhang, S.; Zhao, C.; Wang, B.; Yang, Z.; Li, C.; Liu, P. Prognostic value of Ki-67 index in adult medulloblastoma after accounting for molecular subgroup: A retrospective clinical and molecular analysis. J. Neurooncol. 2018, 139, 333–340. [Google Scholar] [CrossRef]
- Huang, G.H.; Xu, Q.F.; Cui, Y.H.; Li, N.; Bian, X.W.; Lv, S.Q. Medulloblastoma stem cells: Promising targets in medulloblastoma therapy. Cancer Sci. 2016, 107, 583–589. [Google Scholar] [CrossRef]
- Singh, S.K.; Hawkins, C.; Clarke, I.D.; Squire, J.A.; Bayani, J.; Hide, T.; Henkelman, R.M.; Cusimano, M.D.; Dirks, P.B. Identification of human brain tumour initiating cells. Nature 2004, 18, 396–401. [Google Scholar] [CrossRef] [PubMed]
- Tang, X.; Yao, Y.; Zhu, J.; Jin, K.; Wang, Y.; Mao, Y.; Zhou, L. Differential proliferative index of cancer stem-like cells in primary and recurrent medulloblastoma in human. Childs Nerv. Syst. 2012, 28, 1869–1877. [Google Scholar] [CrossRef]
- Morrison, L.C.; McClelland, R.; Aiken, C.; Bridges, M.; Liang, L.; Wang, X.; Di Curzio, D.; Del Bigio, M.R.; Taylor, M.D.; Werbowetski-Ogilvie, T.E. Deconstruction of medulloblastoma cellular heterogeneity reveals differences between the most highly invasive and self-renewing phenotypes. Neoplasia 2013, 15, 384–398. [Google Scholar] [CrossRef] [PubMed] [Green Version]
- Pistollato, F.; Rampazzo, E.; Persano, L.; Abbadi, S.; Frasson, C.; Denaro, L.; D’Avella, D.; Panchision, D.M.; Della Puppa, A.; Scienza, R.; et al. Interaction of hypoxia-inducible factor-1α and Notch signaling regulates medulloblastoma precursor proliferation and fate. Stem Cells 2010, 28, 1918–1929. [Google Scholar] [CrossRef] [PubMed] [Green Version]
- Ayob, A.Z.; Ramasamy, T.S. Cancer stem cells as key drivers of tumour progression. J. Biomed. Sci. 2018, 25, 20. [Google Scholar] [CrossRef] [PubMed]
- Silva, P.B.; Rodini, C.O.; Kaid, C.; Nakahata, A.M.; Pereira, M.C.; Matushita, H.; Costa, S.S.; Okamoto, O.K. Establishment of a novel human medulloblastoma cell line characterized by highly aggressive stem-like cells. Cytotechnology 2016, 68, 1545–1560. [Google Scholar] [CrossRef] [PubMed] [Green Version]
- Singh, S.K.; Clarke, I.D.; Terasaki, M.; Bonn, V.E.; Hawkins, C.; Squire, J.; Dirks, P.B. Identification of a cancer stem cell in human brain tumors. Cancer Res. 2003, 63, 5821–5828. [Google Scholar]
- Read, T.A.; Fogarty, M.P.; Markant, S.L.; McLendon, R.E.; Wei, Z.; Ellison, D.W.; Febbo, P.G.; Wechsler-Reya, R.J. Identification of CD15 as a marker for tumor-propagating cells in a mouse model of medulloblastoma. Cancer Cell. 2009, 15, 135–147. [Google Scholar] [CrossRef] [Green Version]
- Li, Z. CD133: A stem cell biomarker and beyond. Exp. Hematol. Oncol. 2013, 2, 17. [Google Scholar] [CrossRef] [Green Version]
- Garg, N.; Bakhshinyan, D.; Venugopal, C.; Mahendram, S.; Rosa, D.A.; Vijayakumar, T.; Manoranjan, B.; Hallett, R.; McFarlane, N.; Delaney, K.H.; et al. CD133(+) brain tumor-initiating cells are dependent on STAT3 signaling to drive medulloblastoma recurrence. Oncogene 2017, 36, 606–617. [Google Scholar] [CrossRef] [Green Version]
- Vescovi, A.L.; Galli, R.; Reynolds, B.A. Brain tumour stem cells. Nat. Rev. Cancer 2006, 6, 425–436. [Google Scholar] [CrossRef]
- Gong, C.; Valduga, J.; Chateau, A.; Richard, M.; Pellegrini-Moïse, N.; Barberi-Heyob, M.; Chastagner, P.; Boura, C. Stimulation of medulloblastoma stem cells differentiation by a peptidomimetic targeting neuropilin-1. Oncotarget 2018, 9, 15312–15325. [Google Scholar] [CrossRef] [Green Version]
- Manczak, R.; Saada, S.; Provent, T.; Dalmay, C.; Bessette, B.; Bégaud, G.S.; Battu, S.; Blondy, P.; Jauberteau, M.O.; Kaynak, C.B.; et al. UHF-Dielectrophoresis Crossover Frequency as a New Marker for Discrimination of Glioblastoma Undifferentiated Cells. IEEE J. Electromagn. RF Microw. Med. Biol. 2019, 3, 191–198. [Google Scholar] [CrossRef]
- Dawood, S.; Austin, L.; Cristofanilli, M. Cancer stem cells: Implications for cancer therapy. Oncology 2014, 28, 1101–1107. [Google Scholar] [PubMed]
- Zhao, W.; Li, Y.; Zhang, X. Stemness-Related Markers in Cancer. Cancer Transl. Med. 2017, 3, 87–95. [Google Scholar] [CrossRef] [PubMed] [Green Version]
- Snuderl, M.; Batista, A.; Kirkpatrick, N.D.; Ruiz de Almodovar, C.; Riedemann, L.; Walsh, E.C.; Anolik, R.; Huang, Y.; Martin, J.D.; Kamoun, W.; et al. Targeting placental growth factor/neuropilin 1 pathway inhibits growth and spread of medulloblastoma. Cell 2013, 152, 1065–1076. [Google Scholar] [CrossRef] [PubMed] [Green Version]
- Xu, J.; Margol, A.; Asgharzadeh, S.; Erdreich-Epstein, A. Pediatric brain tumor cell lines. J. Cell. Biochem. 2015, 116, 218–224. [Google Scholar] [CrossRef]
- Ward, R.J.; Lee, L.; Graham, K.; Satkunendran, T.; Yoshikawa, K.; Ling, E.; Harper, L.; Austin, R.; Nieuwenhuis, E.; Clarke, I.D.; et al. Multipotent CD15+ cancer stem cells in patched-1-deficient mouse medulloblastoma. Cancer Res. 2009, 69, 4682–4690. [Google Scholar] [CrossRef] [Green Version]
- Li, P.; Du, F.; Yuelling, L.W.; Lin, T.; Muradimova, R.E.; Tricarico, R.; Wang, J.; Enikolopov, G.; Bellacosa, A.; Wechsler-Reya, R.J.; et al. A population of Nestin-expressing progenitors in the cerebellum exhibits increased tumorigenicity. Nat. Neurosci. 2013, 16, 1737–1744. [Google Scholar] [CrossRef] [Green Version]
- Gal, A.; Pentelenyi, K.; Remenyi, V.; Wappler, E.A.; Safrany, G.; Skopal, J.; Nagy, Z. Bcl-2 or bcl-XL gene therapy increases neural plasticity proteins nestin and c-fos expression in PC12 cells. Neurochem. Int. 2009, 55, 349–353. [Google Scholar] [CrossRef]
- Du, L.; Wang, H.; He, L.; Zhang, J.; Ni, B.; Wang, X.; Jin, H.; Cahuzac, N.; Mehrpour, M.; Lu, Y.; et al. CD44 is of functional importance for colorectal cancer stem cells. Clin. Cancer Res. 2008, 14, 6751–6760. [Google Scholar] [CrossRef] [Green Version]
- Choi, D.; Lee, H.W.; Hur, K.Y.; Kim, J.J.; Park, G.S.; Jang, S.H.; Song, Y.S.; Jang, K.S.; Paik, S.S. Cancer stem cell markers CD133 and CD24 correlate with invasiveness and differentiation in colorectal adenocarcinoma. World J. Gastroenterol. 2009, 15, 2258–2264. [Google Scholar] [CrossRef]
- Lee, J.E.; Nam, S.J. Invited Commentary on: Can CD44+/CD24- Tumor Stem Cells Be Used to Determine the Extent of Breast Cancer Invasion Following Neoadjuvant Chemotherapy? J. Breast Cancer 2011, 14, 251–252. [Google Scholar] [CrossRef] [PubMed]
- Singh, A.; Settleman, J. EMT, cancer stem cells and drug resistance: An emerging axis of evil in the war on cancer. Oncogene 2010, 29, 4741–4751. [Google Scholar] [CrossRef] [PubMed] [Green Version]
- Jaggupilli, A.; Elkord, E. Significance of CD44 and CD24 as cancer stem cell markers: An enduring ambiguity. Clin. Dev. Immunol. 2012, 2012, 708036. [Google Scholar] [CrossRef] [PubMed] [Green Version]
- Santos, R.; Vadodaria, K.C.; Jaeger, B.N.; Mei, A.; Lefcochilos-Fogelquist, S.; Mendes, A.P.D.; Erikson, G.; Shokhirev, M.; Randolph-Moore, L.; Fredlender, C.; et al. Differentiation of Inflammation-Responsive Astrocytes from Glial Progenitors Generated from Human Induced Pluripotent Stem Cells. Stem Cell Rep. 2017, 8, 1757–1769. [Google Scholar] [CrossRef] [Green Version]
- Ricardo, S.; Vieira, A.F.; Gerhard, R.; Leitão, D.; Pinto, R.; Cameselle-Teijeiro, J.F.; Milanezi, F.; Schmitt, F.; Paredes, J. Breast cancer stem cell markers CD44, CD24 and ALDH1: Expression distribution within intrinsic molecular subtype. J. Clin. Pathol. 2011, 64, 937–946. [Google Scholar] [CrossRef]
- Liang, L.; Aiken, C.; McClelland, R.; Morrison, L.C.; Tatari, N.; Remke, M.; Ramaswamy, V.; Issaivanan, M.; Ryken, T.; Del Bigio, M.R.; et al. Characterization of novel biomarkers in selecting for subtype specific medulloblastoma phenotypes. Oncotarget 2015, 6, 38881–38900. [Google Scholar] [CrossRef] [Green Version]
- Wang, X.; Venugopal, C.; Manoranjan, B.; McFarlane, N.; O’Farrell, E.; Nolte, S.; Gunnarsson, T.; Hollenberg, R.; Kwiecien, J.; Northcott, P.; et al. Sonic hedgehog regulates Bmi1 in human medulloblastoma brain tumor-initiating cells. Oncogene 2012, 31, 187–199. [Google Scholar] [CrossRef] [Green Version]
- Gong, S.; Li, Q.; Jeter, C.R.; Fan, Q.; Tang, D.G.; Liu, B. Regulation of NANOG in cancer cells. Mol. Carcinog. 2015, 54, 679–687. [Google Scholar] [CrossRef] [Green Version]
- da Silva, P.B.G.; Teixeira Dos Santos, M.C.; Rodini, C.O.; Kaid, C.; Pereira, M.C.L.; Furukawa, G.; da Cruz, D.S.G.; Goldfeder, M.B.; Rocha, C.R.R.; Rosenberg, C.; et al. High OCT4A levels drive tumorigenicity and metastatic potential of medulloblastoma cells. Oncotarget 2017, 8, 19192–19204. [Google Scholar] [CrossRef] [Green Version]
- Heurtier, V.; Owens, N.; Gonzales, I.; Mueller, F.; Proux, C.; Mornico, D.; Clerc, P.; Dubois, A.; Navarro, P. The molecular logic of Nanog-induced self-renewal. bioRχiv 2018, 22, 1–17. [Google Scholar] [CrossRef]
- Williams, A.P.; Garner, E.F.; Stafman, L.L.; Aye, J.M.; Quinn, C.H.; Marayati, R.; Stewart, J.E.; Atigadda, V.R.; Mroczek-Musulman, E.; Moore, B.P.; et al. UAB30, A Novel Rexinoid Agonist, Decreases Stemness In Group 3 Medulloblastoma Human Cell Line Xenografts. Transl. Oncol. 2019, 12, 1364–1374. [Google Scholar] [CrossRef] [PubMed]
- Glumac, P.M.; LeBeau, A.M. The role of CD133 in cancer: A concise review. Clin. Transl. Med. 2018, 7, 18. [Google Scholar] [CrossRef] [PubMed]
- Ong, C.W.; Kim, L.G.; Kong, H.H.; Low, L.Y.; Iacopetta, B.; Soong, R.; Salto-Tellez, M. CD133 expression predicts for non-response to chemotherapy in colorectal cancer. Mod. Pathol. 2010, 23, 450–457. [Google Scholar] [CrossRef] [PubMed] [Green Version]
- Pistollato, F.; Abbadi, S.; Rampazzo, E.; Persano, L.; Della Puppa, A.; Frasson, C.; Sarto, E.; Scienza, R.; D’avella, D.; Basso, G. Intratumoral hypoxic gradient drives stem cells distribution and MGMT expression in glioblastoma. Stem Cells 2010, 28, 851–862. [Google Scholar] [CrossRef]
- Beier, D.; Hau, P.; Proescholdt, M.; Lohmeier, A.; Wischhusen, J.; Oefner, P.J.; Aigner, L.; Brawanski, A.; Bogdahn, U.; Beier, C.P. CD133(+) and CD133(-) glioblastoma-derived cancer stem cells show differential growth characteristics and molecular profiles. Cancer Res. 2007, 67, 4010–4015. [Google Scholar] [CrossRef] [Green Version]
- Frasson, C.; Rampazzo, E.; Accordi, B.; Beggio, G.; Pistollato, F.; Basso, G.; Persano, L. Inhibition of PI3K Signalling Selectively Affects Medulloblastoma Cancer Stem Cells. Biomed. Res. Int. 2015, 2015, 973912. [Google Scholar] [CrossRef] [Green Version]
- de Antonellis, P.; Medaglia, C.; Cusanelli, E.; Andolfo, I.; Liguori, L.; De Vita, G.; Carotenuto, M.; Bello, A.; Formiggini, F.; Galeone, A.; et al. MiR-34a targeting of Notch ligand delta-like 1 impairs CD15+/CD133+ tumor-propagating cells and supports neural differentiation in medulloblastoma. PLoS ONE 2011, 6, e24584. [Google Scholar] [CrossRef] [Green Version]
- Andolfo, I.; Liguori, L.; De Antonellis, P.; Cusanelli, E.; Marinaro, F.; Pistollato, F.; Garzia, L.; De Vita, G.; Petrosino, G.; Accordi, B.; et al. The micro-RNA 199b-5p regulatory circuit involves Hes1, CD15, and epigenetic modifications in medulloblastoma. Neuro Oncol. 2012, 14, 596–612. [Google Scholar] [CrossRef] [Green Version]
- Pethig, R. Dielectrophoresis: Theory, Methodology and Biological Applications; Wiley: New York, NY, USA, 2017; Print ISBN: 9781118671450|Online ISBN: 9781118671443. [Google Scholar]
- Chung, C.; Pethig, R.; Smith, S.; Waterfall, M. Intracellular potassium under osmotic stress determines the dielectrophoresis cross-over frequency of murine myeloma cells in the MHz range. Electrophoresis 2018, 39, 989–997. [Google Scholar] [CrossRef] [Green Version]
- Gascoyne, P.R.C.; Vykoukal, J.V. Dielectrophoresis-Based Sample Handling in General-Purpose Programmable Diagnostic Instruments. Proc. IEEE Inst. Electr. Electron. Eng. 2004, 92, 22–42. [Google Scholar] [CrossRef] [Green Version]
- Nikolic-Jaric, M.; Cabel, T.; Salimi, E.; Bhide, A.; Braasch, K.; Butler, M.; Bridges, G.E.; Thomson, D.J. Differential electronic detector to monitor apoptosis using dielectrophoresis-induced translation of flowing cells (dielectrophoresis cytometry). Biomicrofluidics 2013, 7, 24101. [Google Scholar] [CrossRef] [PubMed] [Green Version]
- Manczak, R.; Saada, S.; Dalmay, C.; Bessette, B.; Bégaud, G.S.; Battu, S.; Blondy, P.; Jauberteau, M.O.; Lalloue, F.; Inac, M.; et al. Discrimination of Glioblastoma Cancer Stem cells by measuring their UHF-dieloctrophoresis Crossover Frequency. In Proceedings of the 2018 IEEE International Microwave Biomedical Conference (IMBioC), Philadelphia, PA, USA, 14–15 June 2018; pp. 130–132. [Google Scholar] [CrossRef]
- Jang, J.W.; Song, Y.; Kim, S.H.; Kim, J.; Seo, H.R. Potential mechanisms of CD133 in cancer stem cells. Life Sci. 2017, 184, 25–29. [Google Scholar] [CrossRef] [PubMed]
- Tanno, B.; Leonardi, S.; Babini, G.; Giardullo, P.; De Stefano, I.; Pasquali, E.; Saran, A.; Mancuso, M. Nanog-driven cell-reprogramming and self-renewal maintenance in Ptch1(+/-) granule cell precursors after radiation injury. Sci. Rep. 2017, 7, 14238. [Google Scholar] [CrossRef] [PubMed] [Green Version]
- Persano, L.; Pistollato, F.; Rampazzo, E.; Della Puppa, A.; Abbadi, S.; Frasson, C.; Volpin, F.; Indraccolo, S.; Scienza, R.; Basso, G. BMP2 sensitizes glioblastoma stem-like cells to Temozolomide by affecting HIF-1α stability and MGMT expression. Cell Death Dis. 2012, 18, e412. [Google Scholar] [CrossRef] [PubMed]
- Metsalu, T.; Vilo, J. ClustVis: A web tool for visualizing clustering of multivariate data using Principal Component Analysis and heatmap. Nucleic Acids Res. 2015, 43, W566–W570. [Google Scholar] [CrossRef] [PubMed]


© 2020 by the authors. Licensee MDPI, Basel, Switzerland. This article is an open access article distributed under the terms and conditions of the Creative Commons Attribution (CC BY) license (http://creativecommons.org/licenses/by/4.0/).
Share and Cite
Casciati, A.; Tanori, M.; Manczak, R.; Saada, S.; Tanno, B.; Giardullo, P.; Porcù, E.; Rampazzo, E.; Persano, L.; Viola, G.; et al. Human Medulloblastoma Cell Lines: Investigating on Cancer Stem Cell-Like Phenotype. Cancers 2020, 12, 226. https://doi.org/10.3390/cancers12010226
Casciati A, Tanori M, Manczak R, Saada S, Tanno B, Giardullo P, Porcù E, Rampazzo E, Persano L, Viola G, et al. Human Medulloblastoma Cell Lines: Investigating on Cancer Stem Cell-Like Phenotype. Cancers. 2020; 12(1):226. https://doi.org/10.3390/cancers12010226
Chicago/Turabian StyleCasciati, Arianna, Mirella Tanori, Rémi Manczak, Sofiane Saada, Barbara Tanno, Paola Giardullo, Elena Porcù, Elena Rampazzo, Luca Persano, Giampietro Viola, and et al. 2020. "Human Medulloblastoma Cell Lines: Investigating on Cancer Stem Cell-Like Phenotype" Cancers 12, no. 1: 226. https://doi.org/10.3390/cancers12010226