Association between PD-1 and PD-L1 Polymorphisms and the Risk of Cancer: A Meta-Analysis of Case-Control Studies

 , and
, and 
Abstract
1. Introduction
2. Results
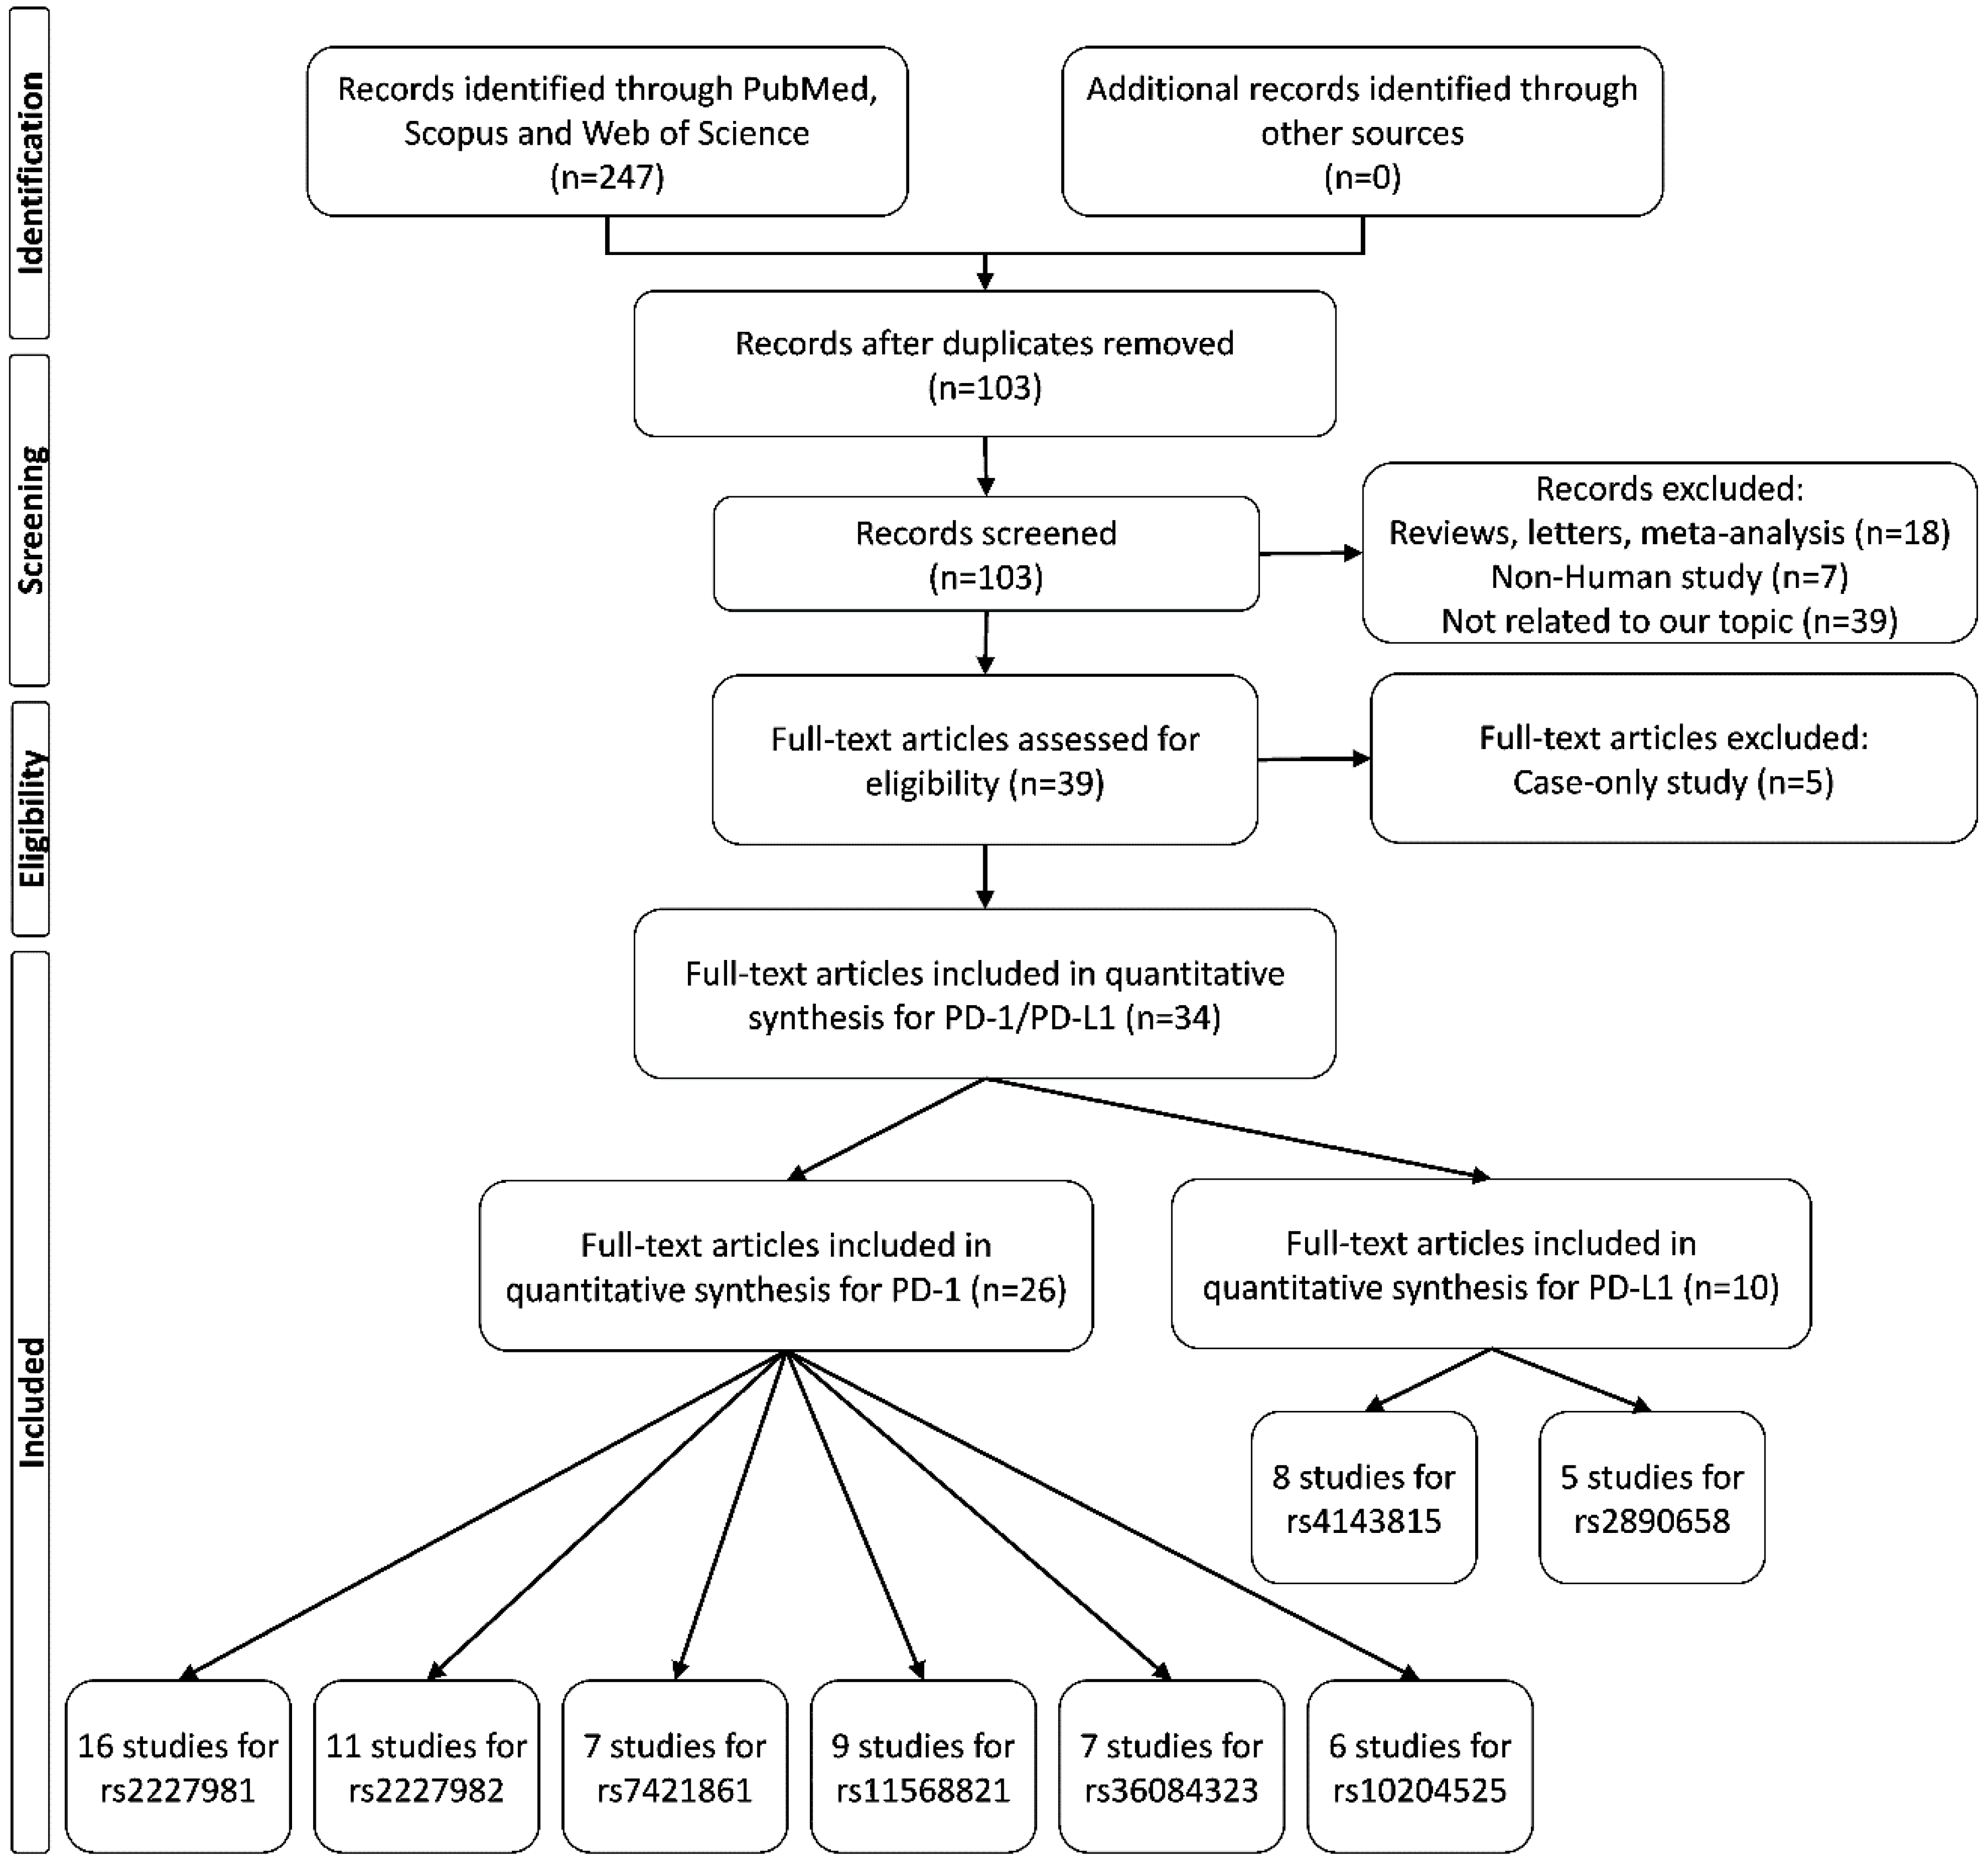
2.1. Study Characteristics
2.2. Main Analysis Results
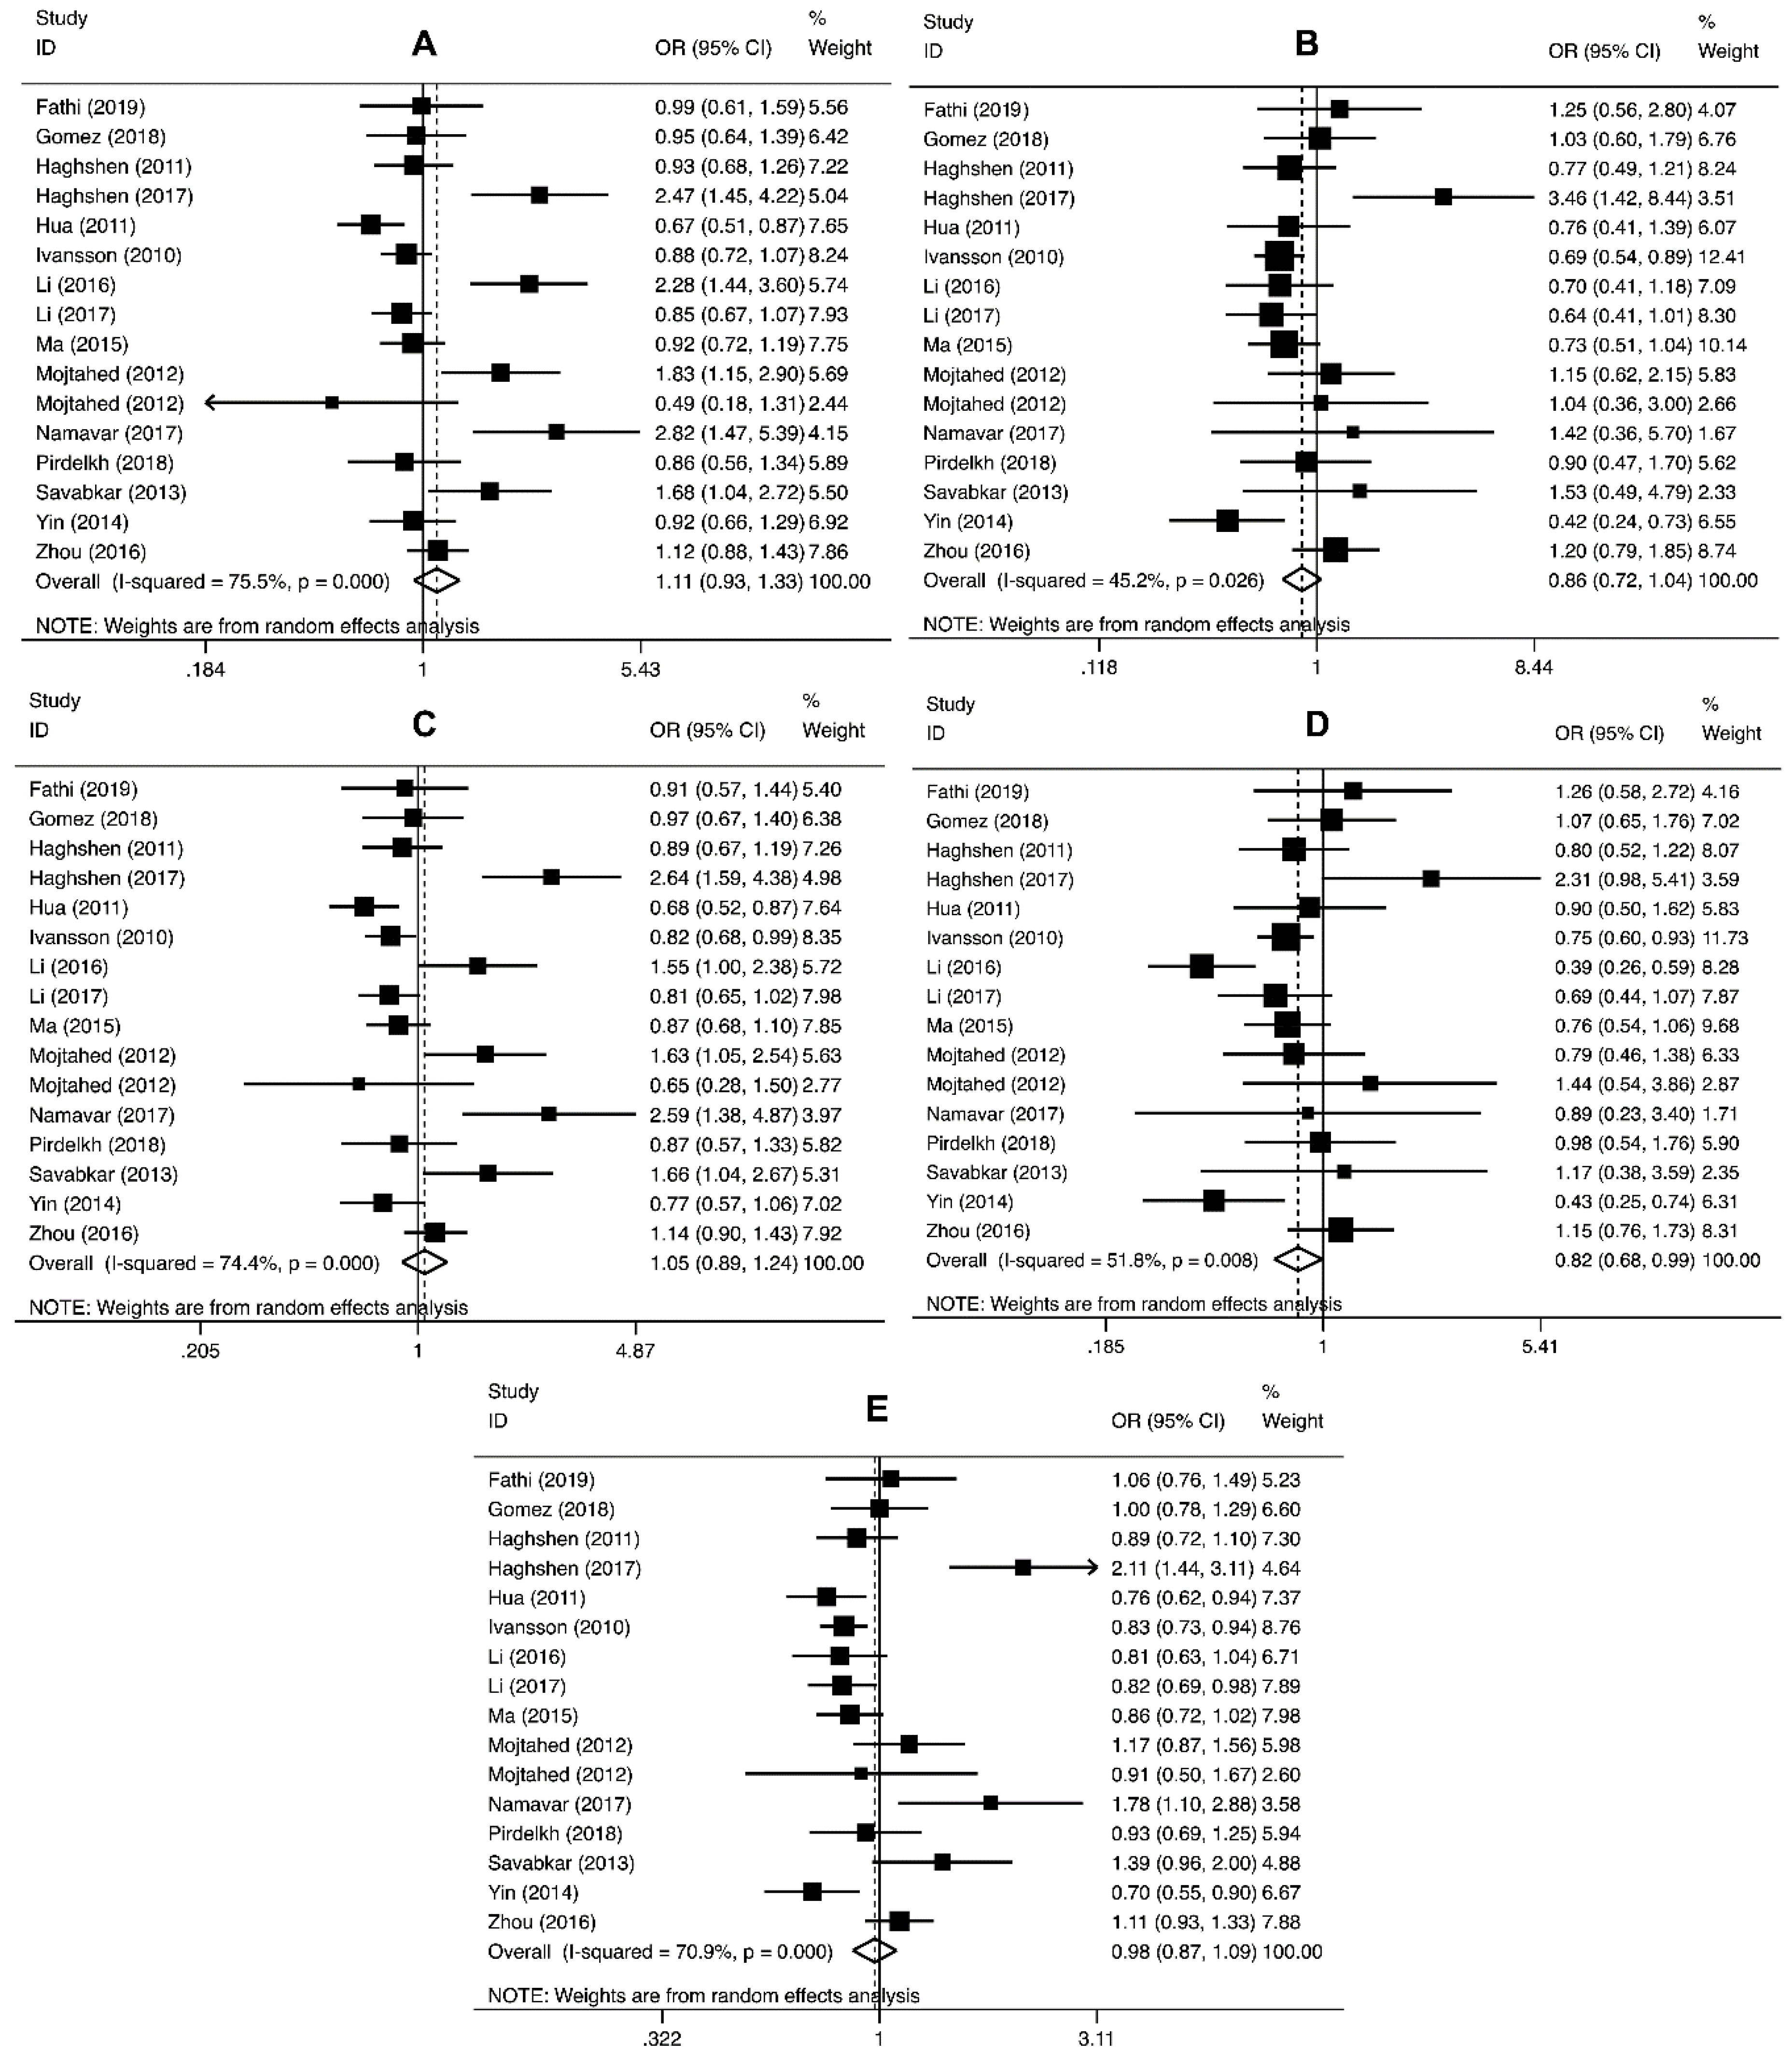
2.2.1. Association of PD-1 Polymorphisms with Cancer Risk
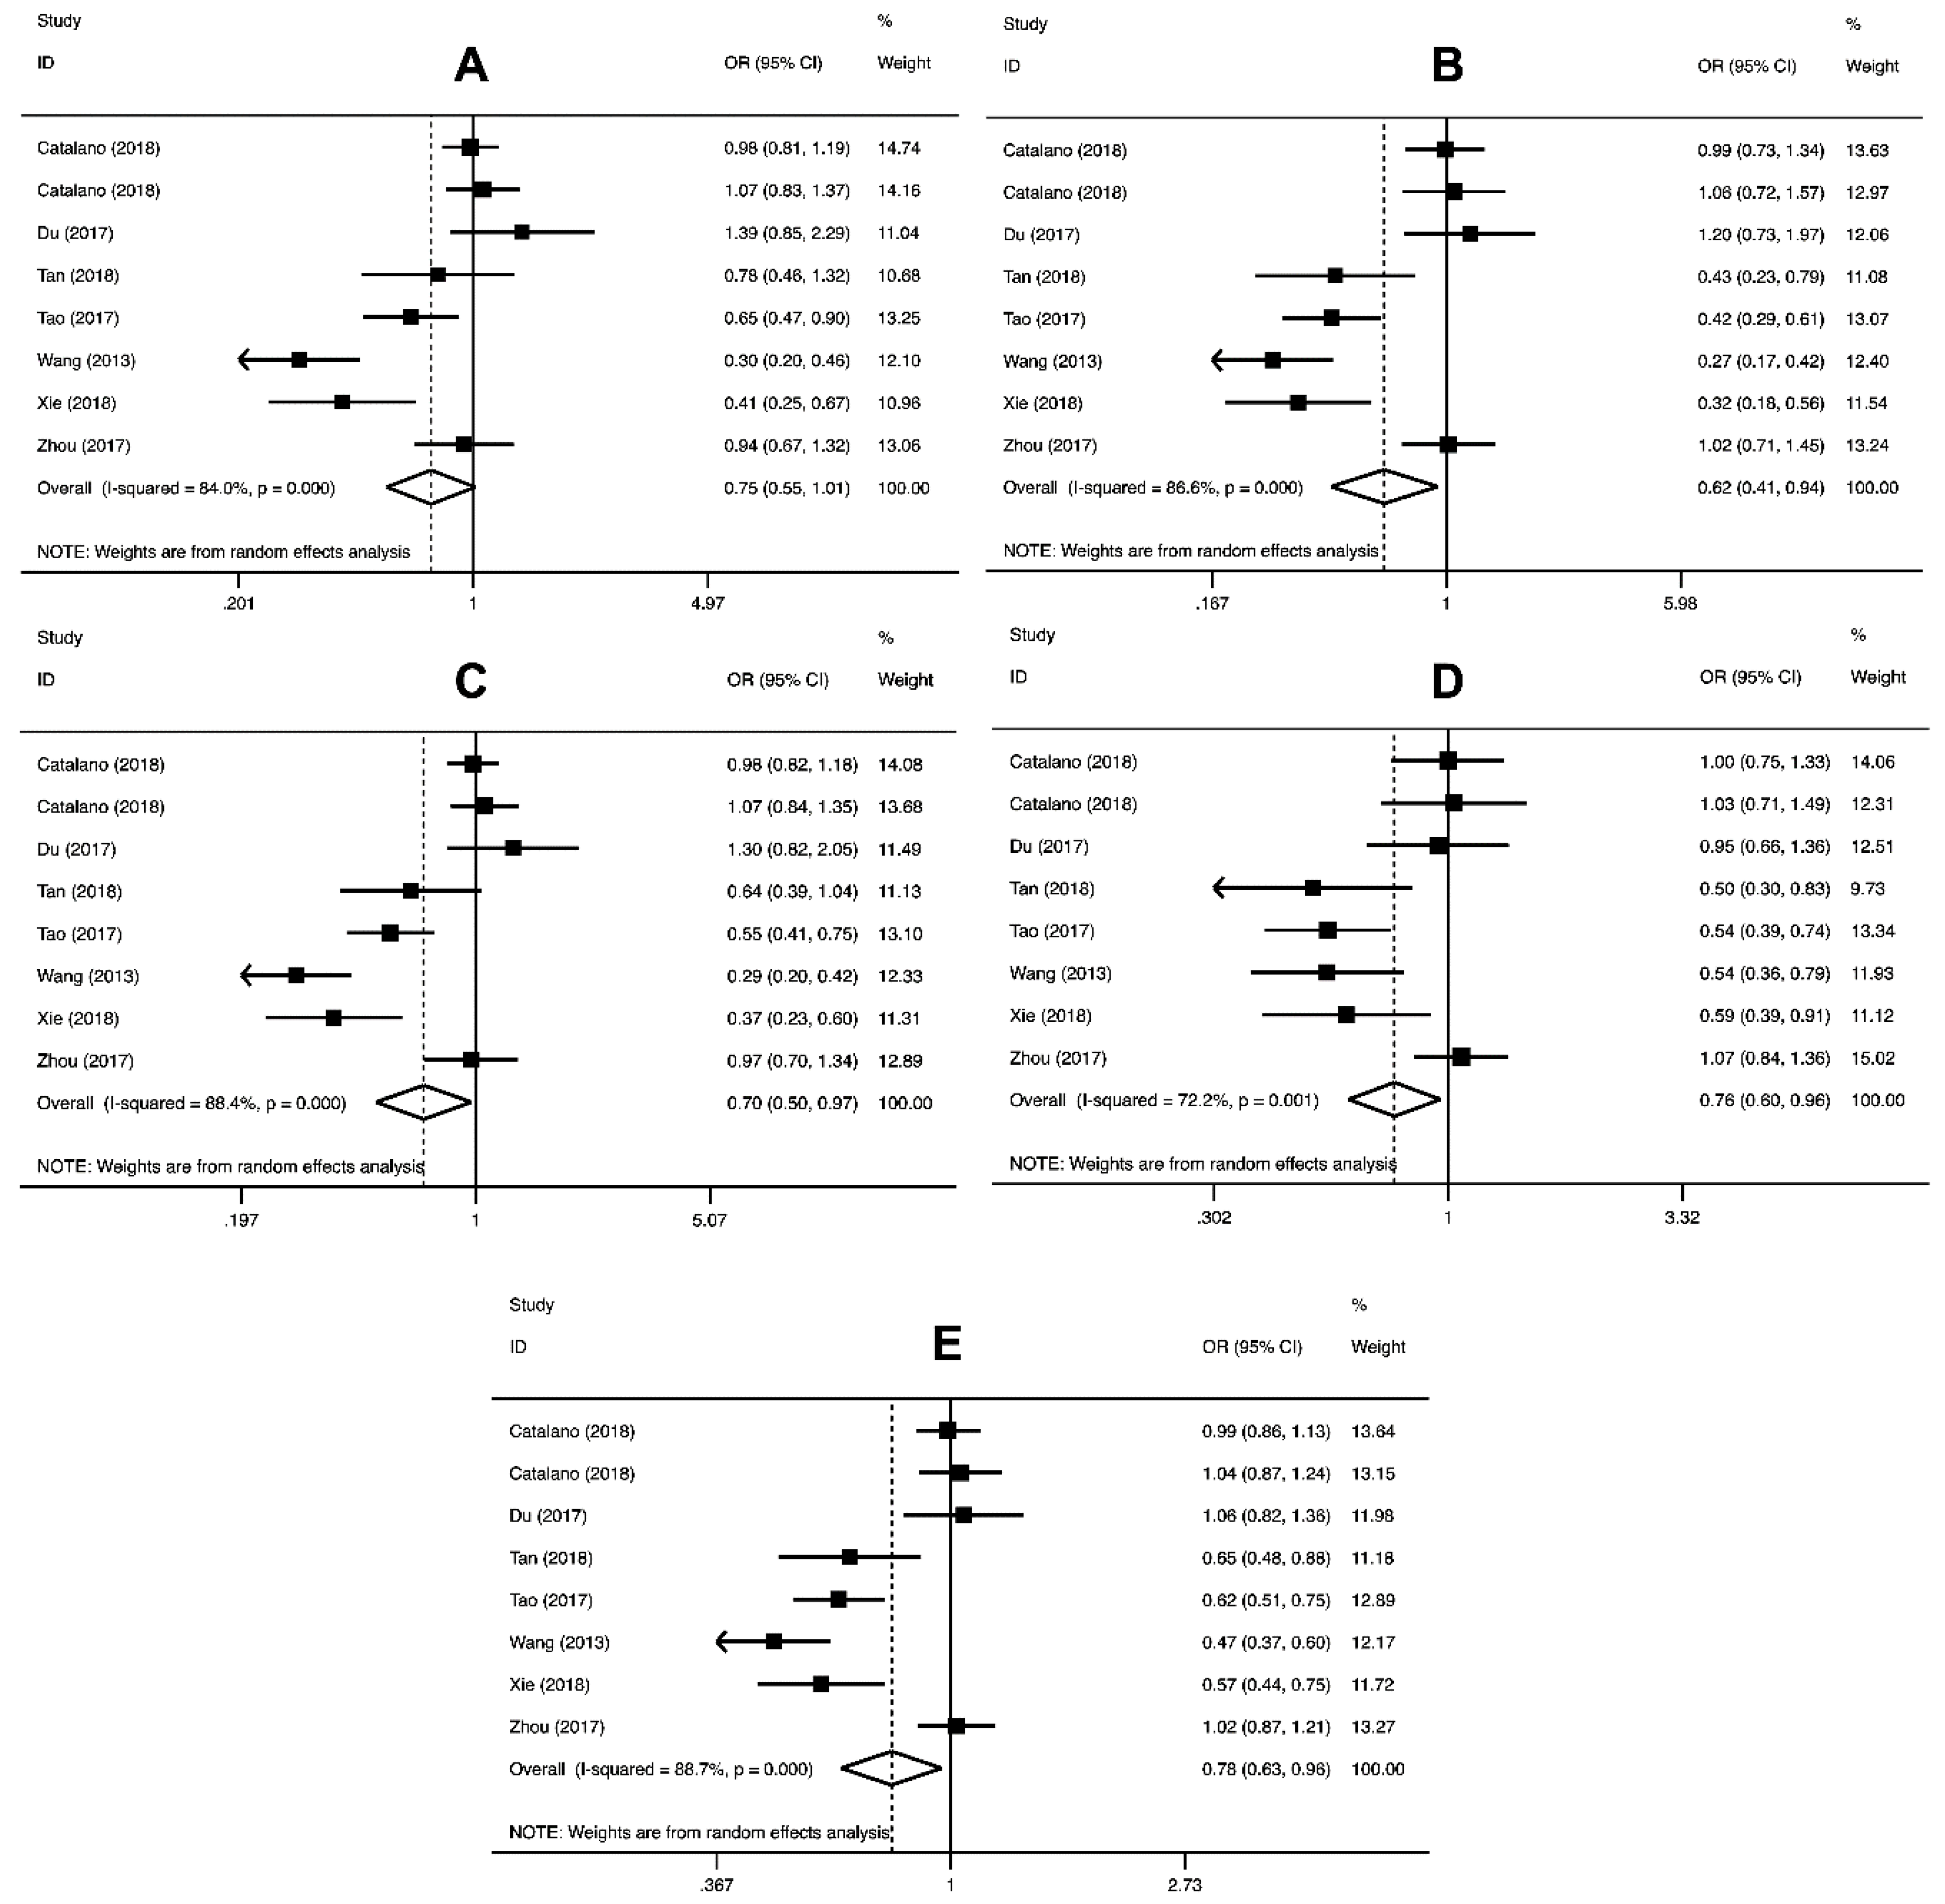
2.2.2. PD-L1 Polymorphisms and Cancer Risk
2.3. Heterogeneity
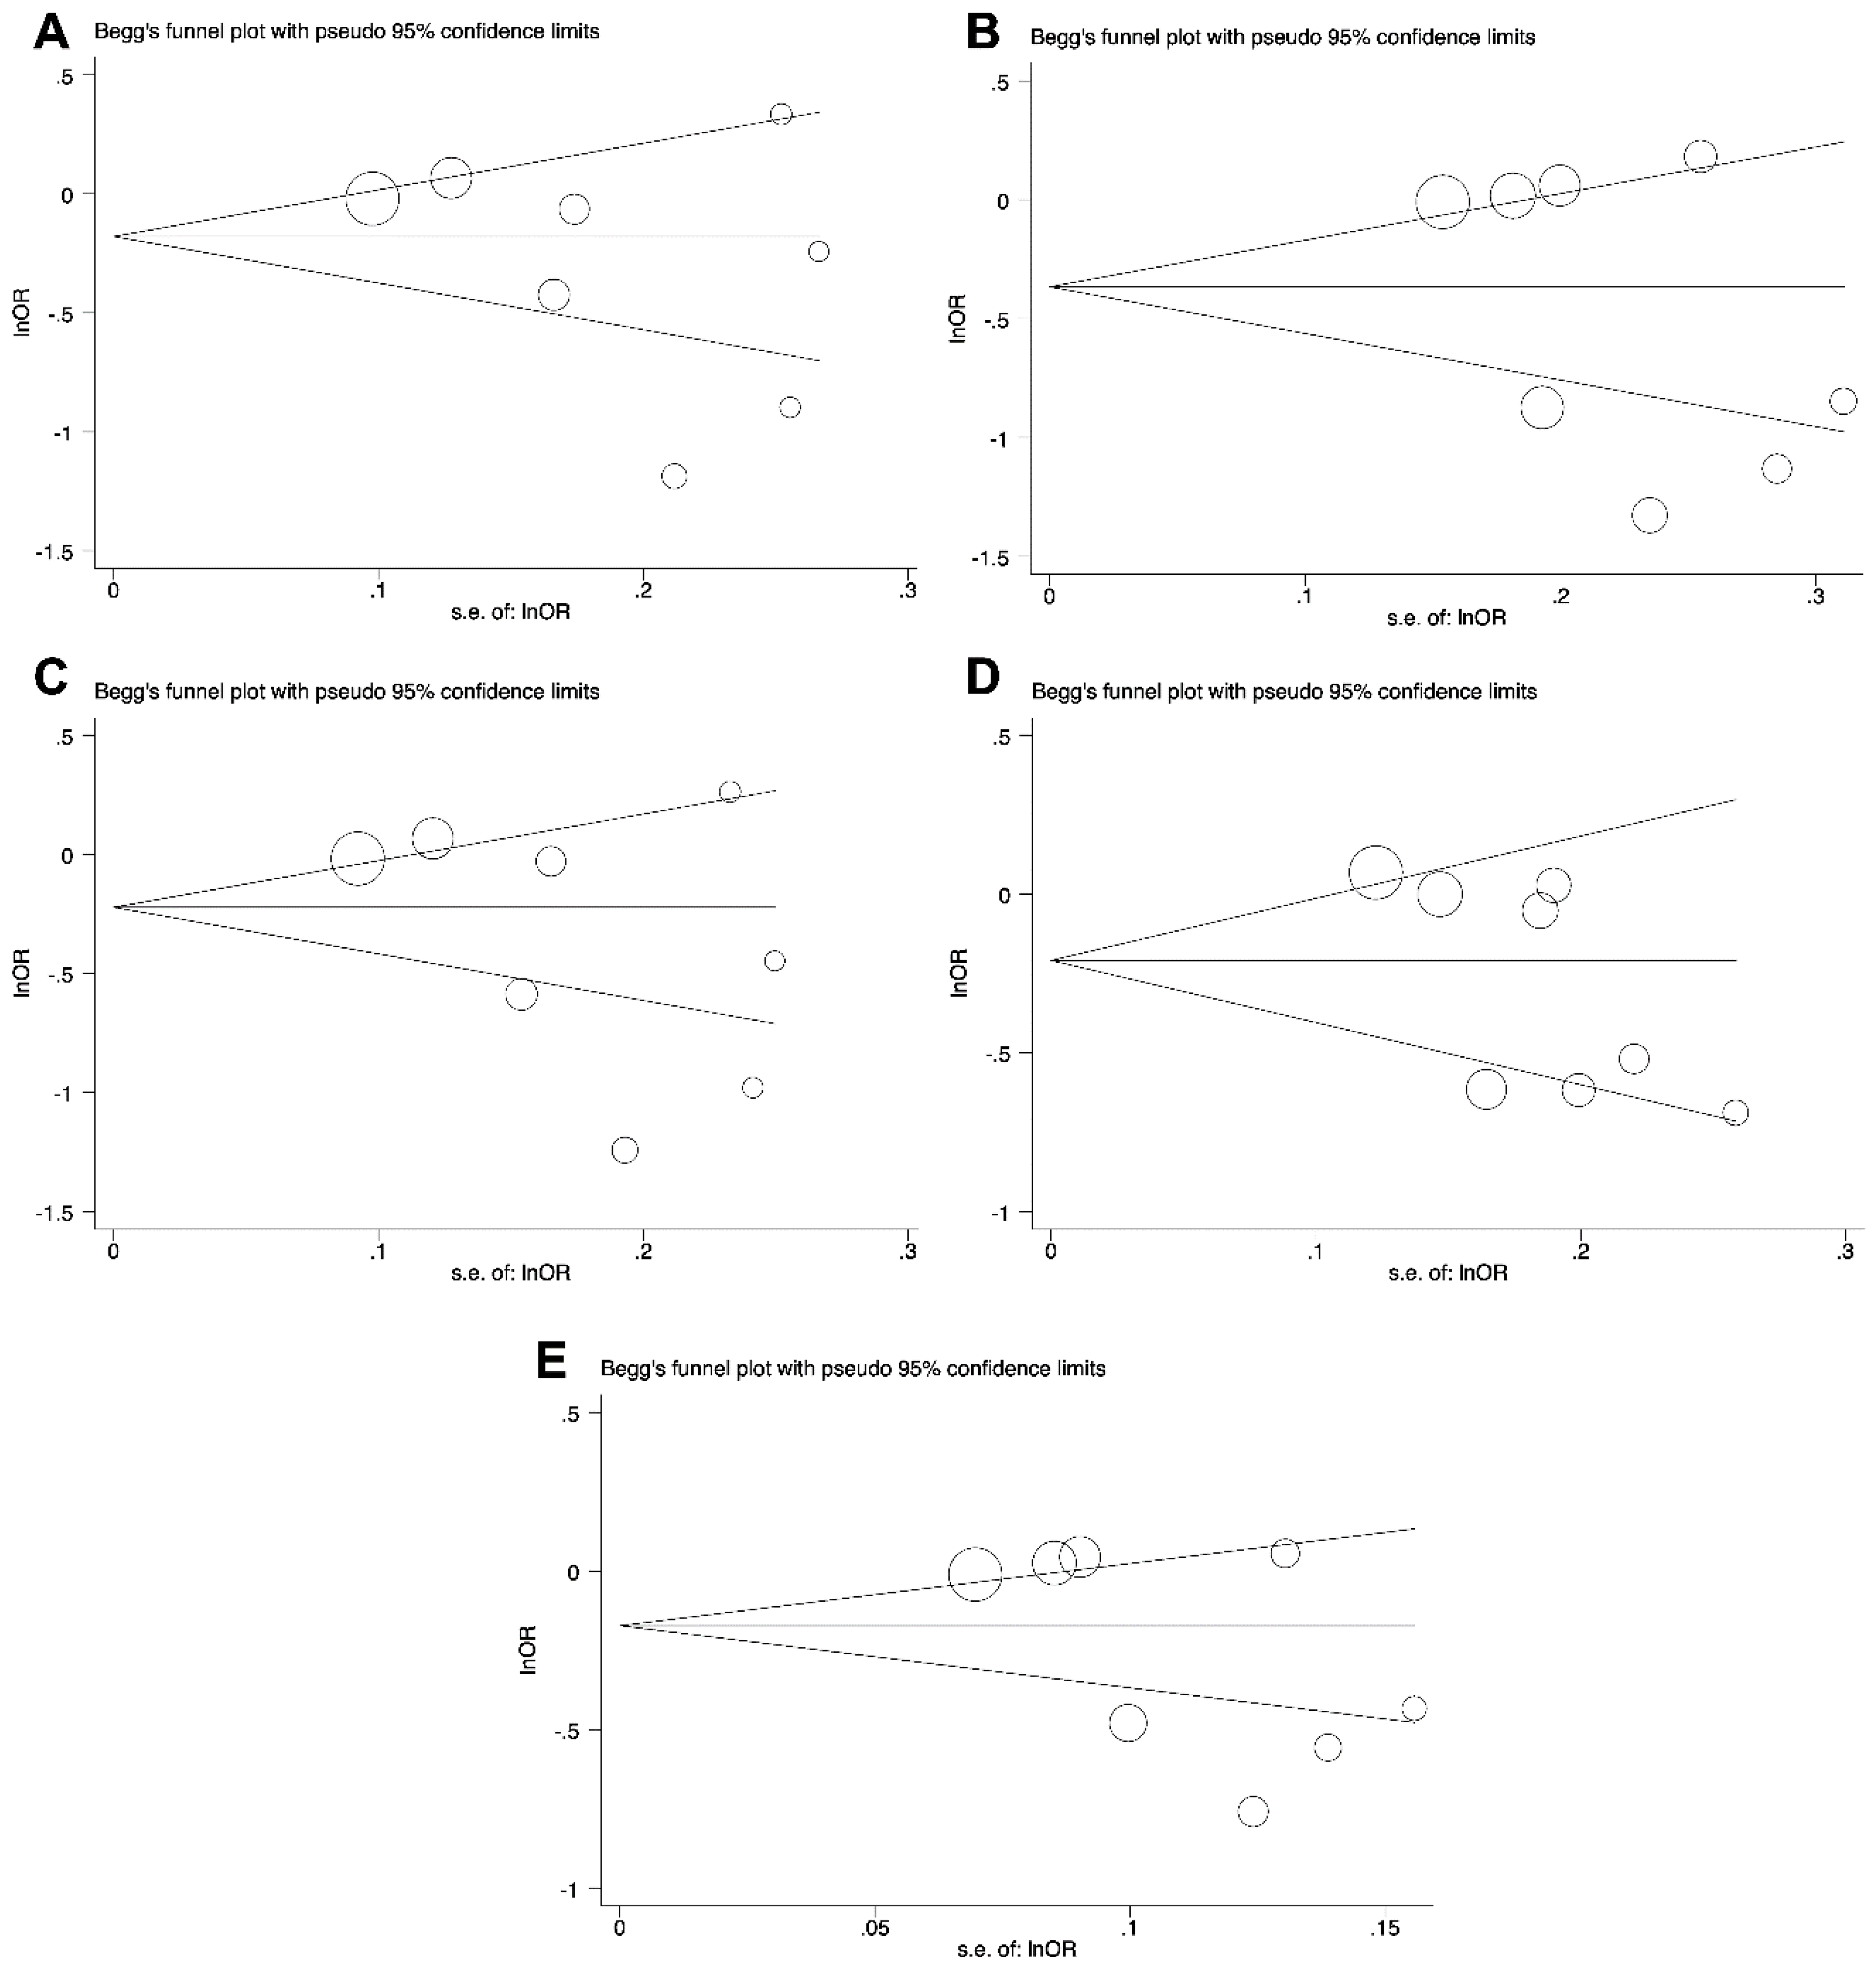
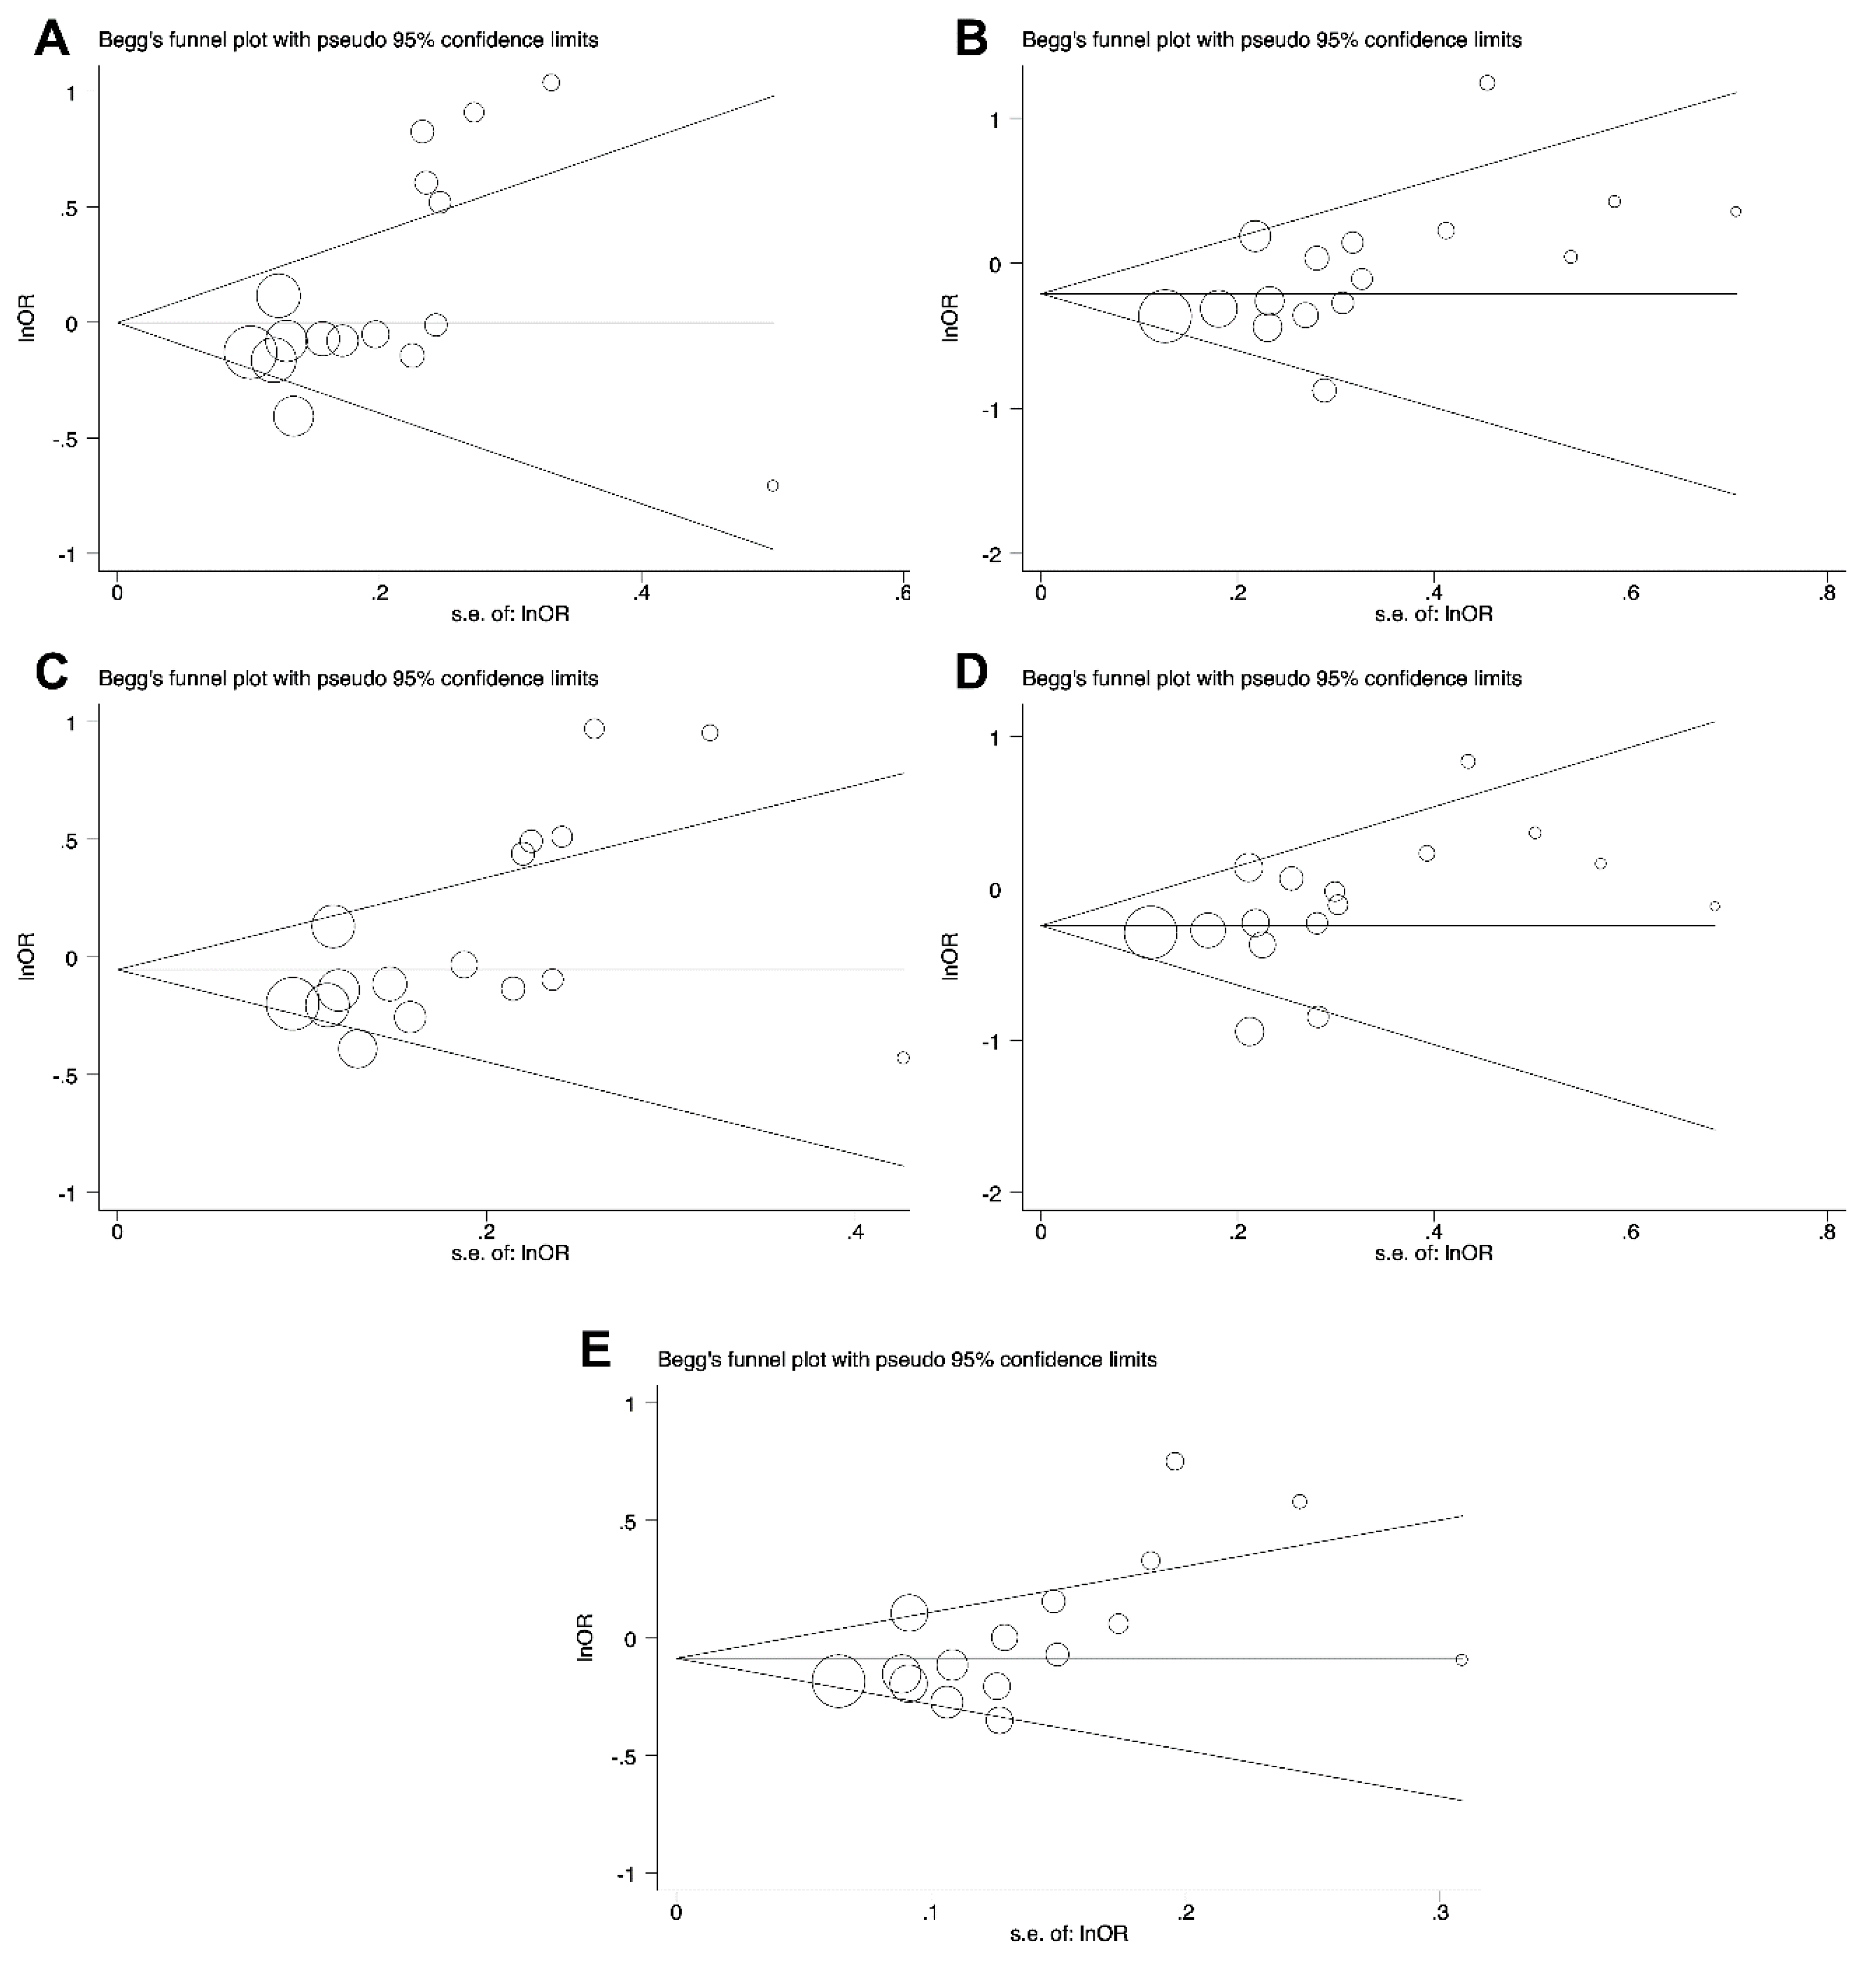
2.4. Publication Bias
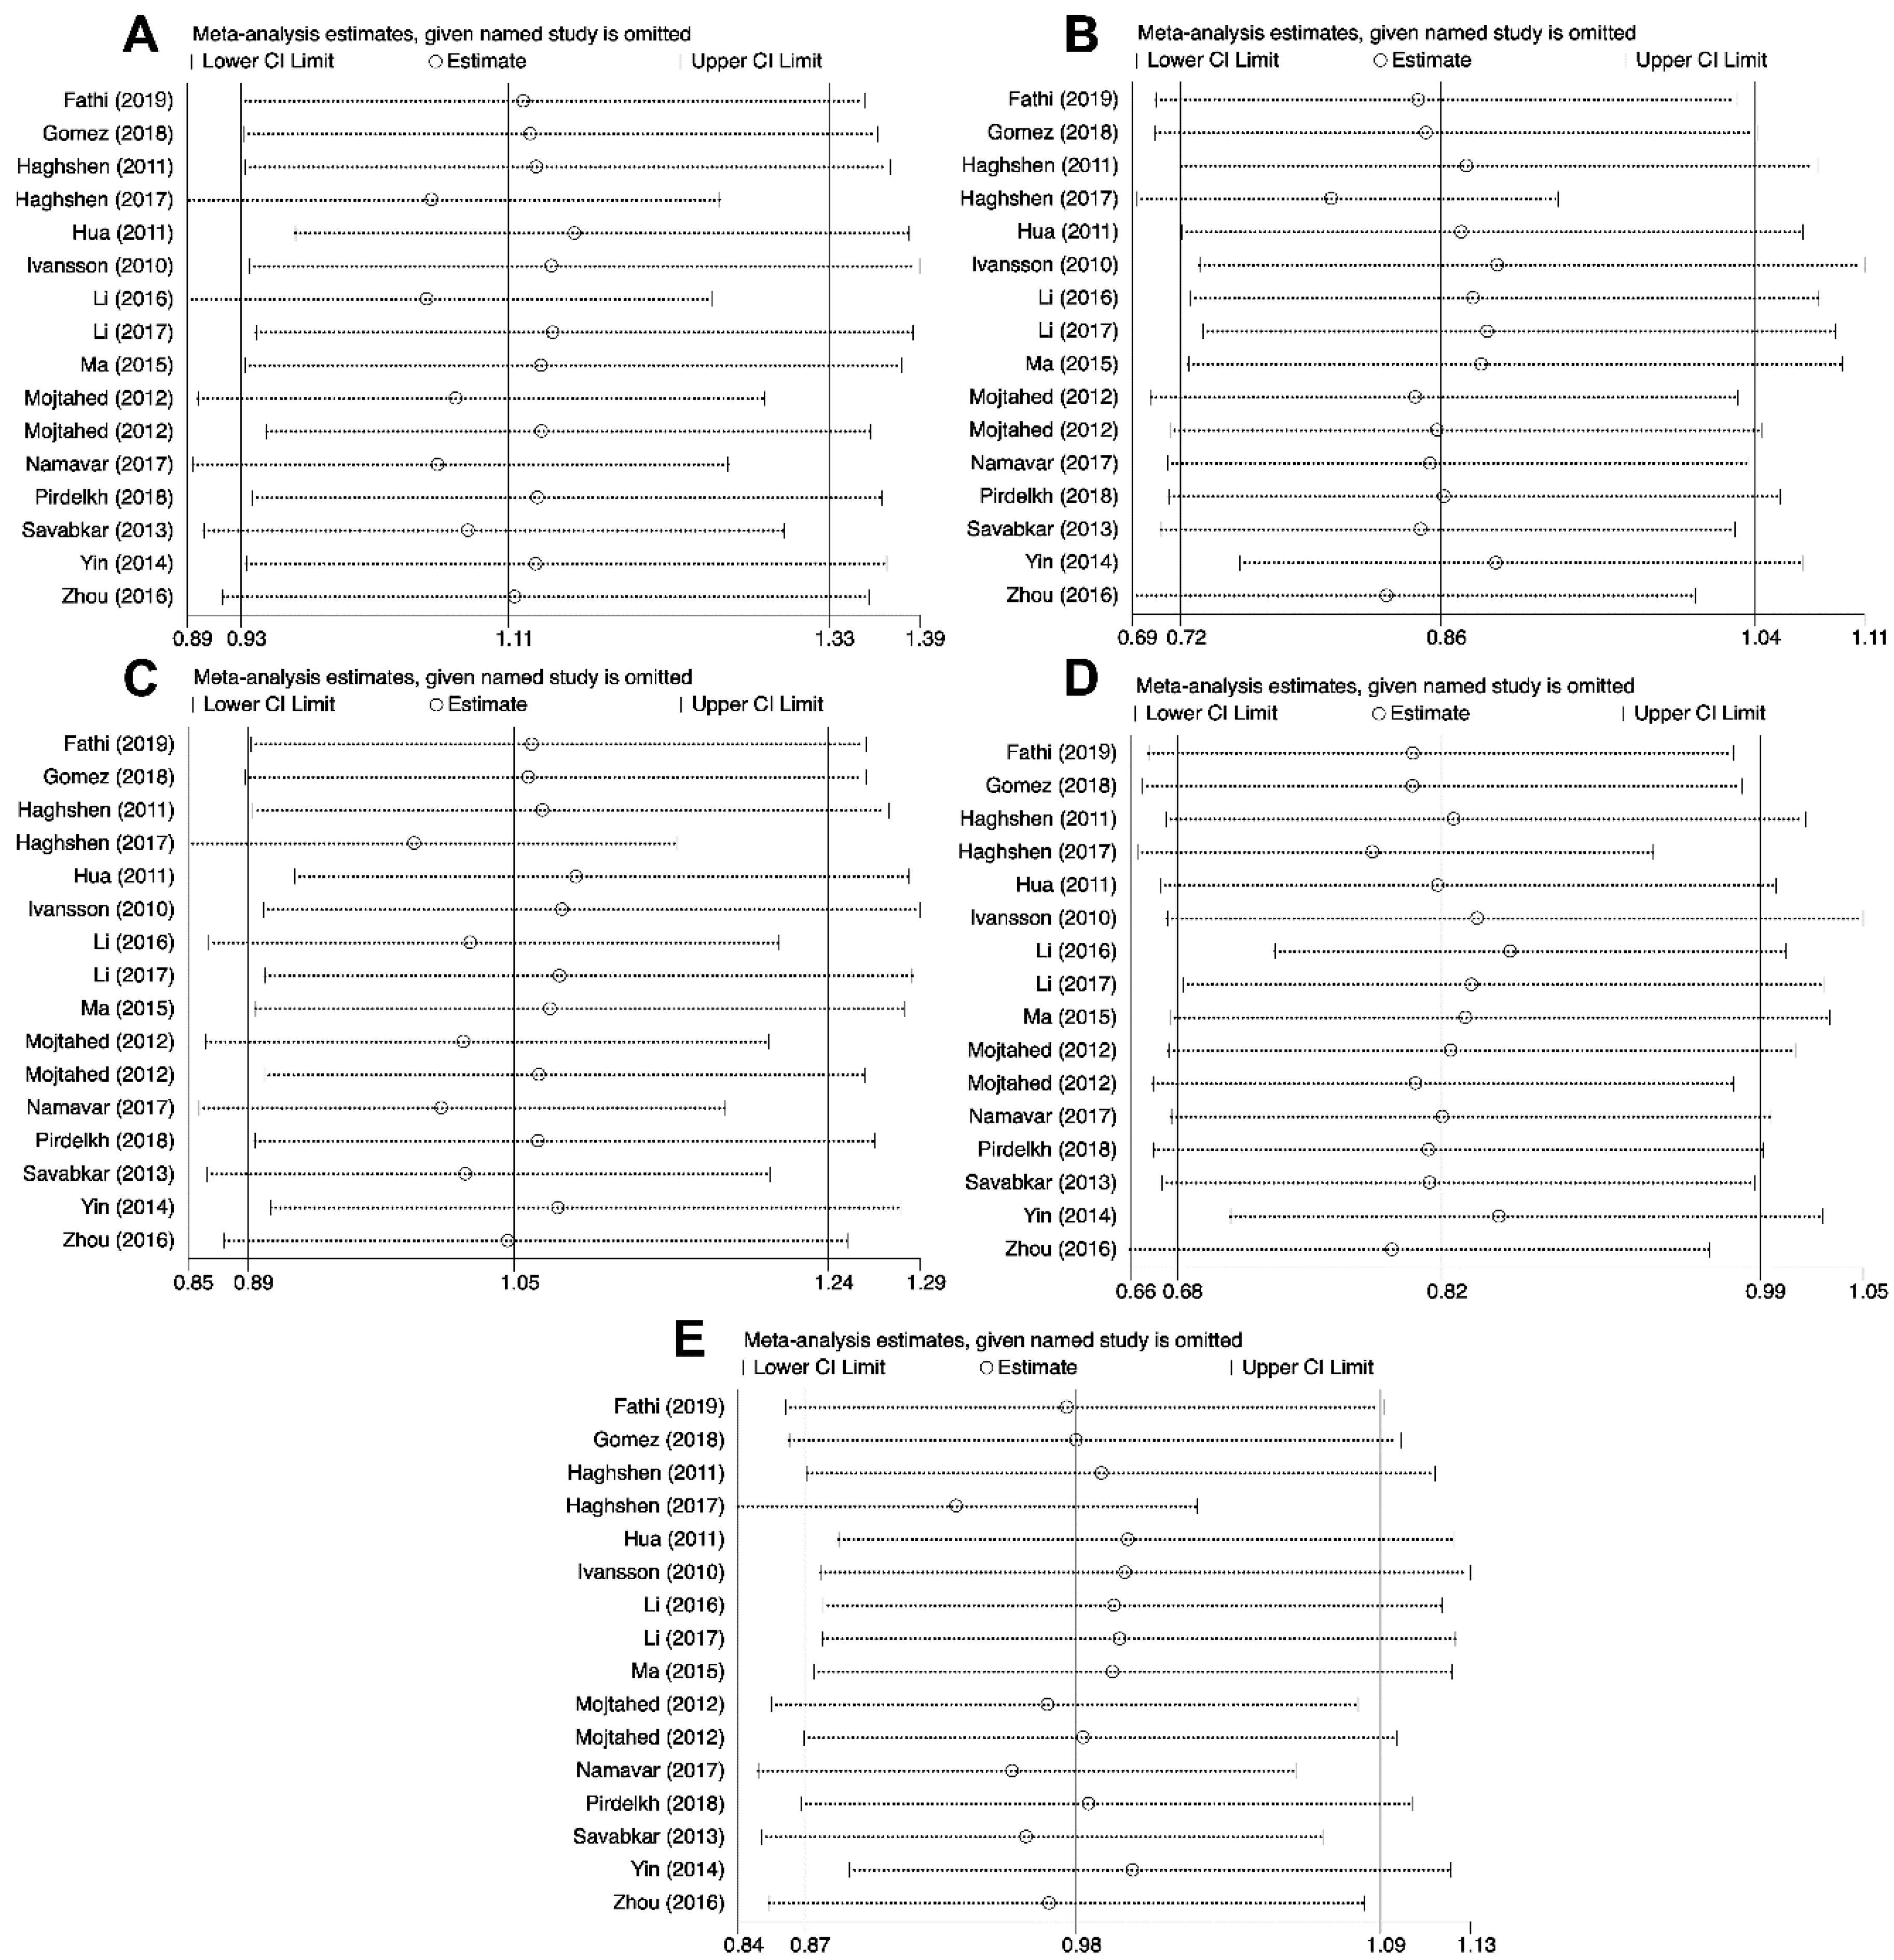
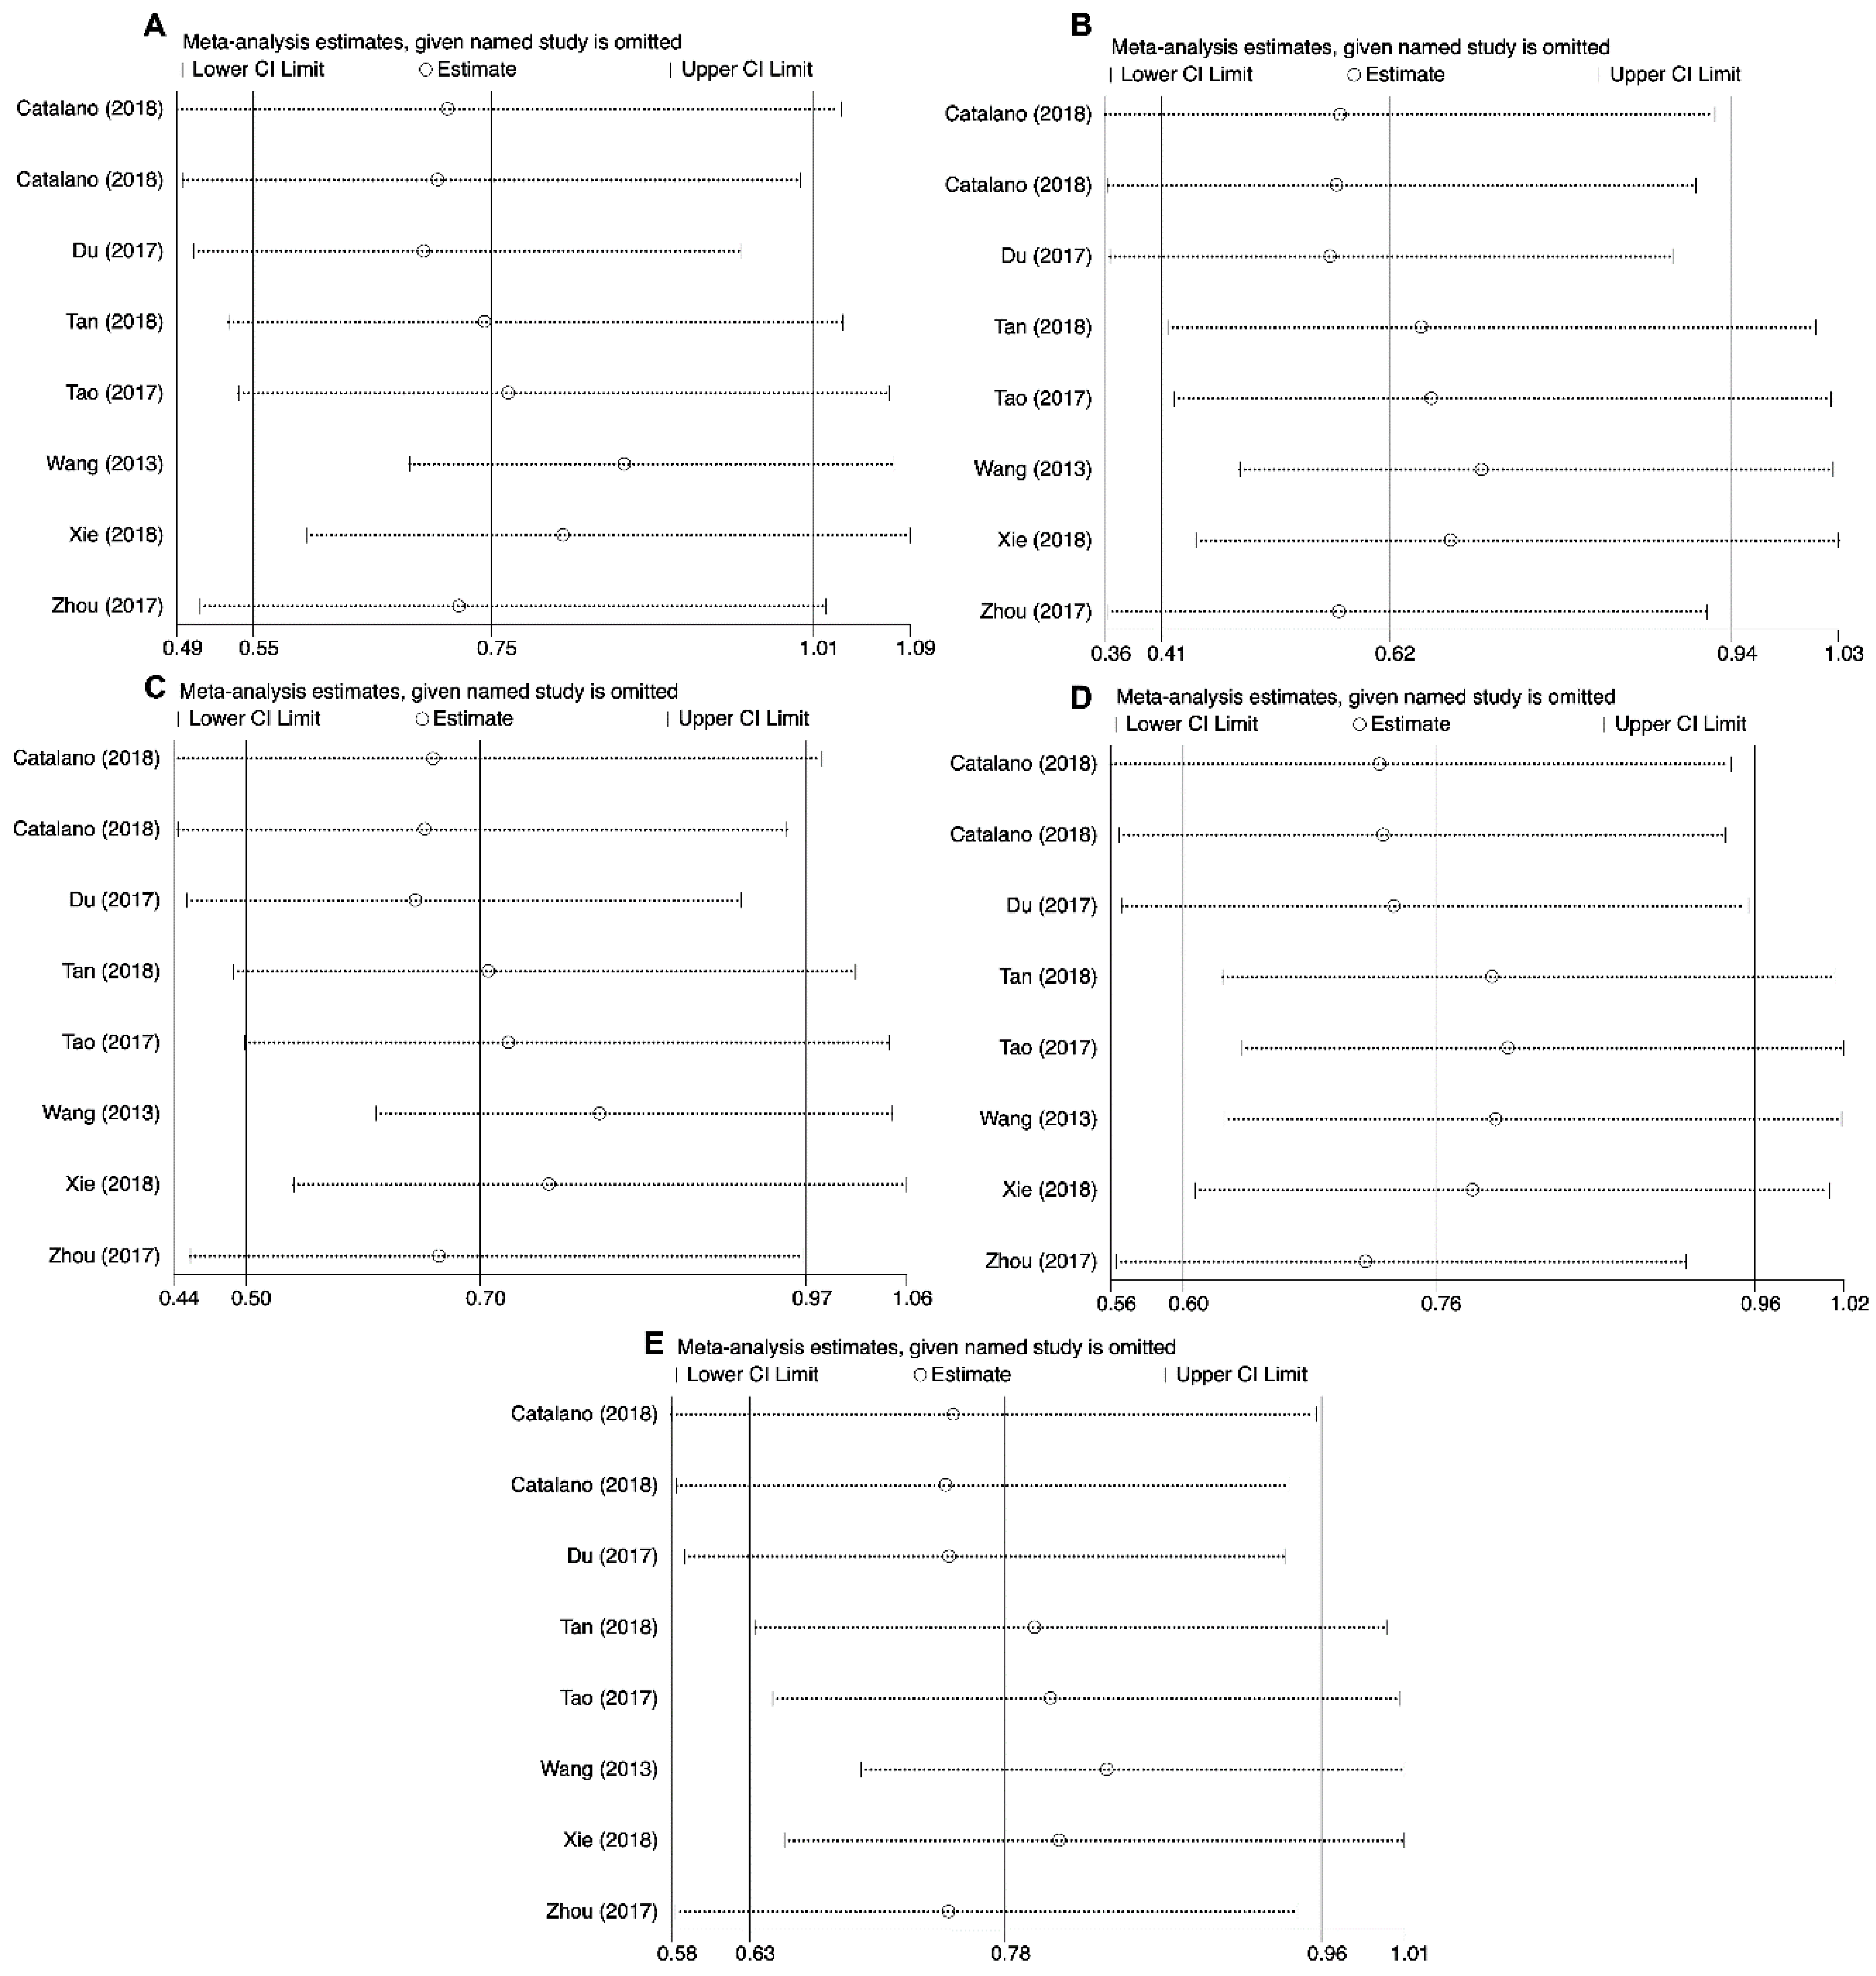
2.5. Sensitivity Analysis
3. Discussion
4. Methods
4.1. Literature Search
4.2. Data Extraction
4.3. Statistical Analysis
5. Conclusions
Author Contributions
Funding
Acknowledgments
Conflicts of Interest
References
- Bray, F.; Ferlay, J.; Soerjomataram, I.; Siegel, R.L.; Torre, L.A.; Jemal, A. Global cancer statistics 2018: GLOBOCAN estimates of incidence and mortality worldwide for 36 cancers in 185 countries. CA Cancer J. Clin. 2018, 68, 394–424. [Google Scholar] [CrossRef] [PubMed]
- Stadler, Z.K.; Thom, P.; Robson, M.E.; Weitzel, J.N.; Kauff, N.D.; Hurley, K.E.; Devlin, V.; Gold, B.; Klein, R.J.; Offit, K. Genome-wide association studies of cancer. J. Clin. Oncol. 2010, 28, 4255–4267. [Google Scholar] [CrossRef] [PubMed]
- Hanahan, D.; Weinberg, R.A. Hallmarks of cancer: The next generation. Cell 2011, 144, 646–674. [Google Scholar] [CrossRef] [PubMed]
- Redd, P.S.; Lu, C.; Klement, J.D.; Ibrahim, M.L.; Zhou, G.; Kumai, T.; Celis, E.; Liu, K. H3K4me3 mediates the NF-kappaB p50 homodimer binding to the pdcd1 promoter to activate PD-1 transcription in T cells. Oncoimmunology 2018, 7, e1483302. [Google Scholar] [CrossRef] [PubMed]
- Hua, Z.; Li, D.; Xiang, G.; Xu, F.; Jie, G.; Fu, Z.; Jie, Z.; Da, P.; Li, D. PD-1 polymorphisms are associated with sporadic breast cancer in Chinese Han population of Northeast China. Breast Cancer Res. Treat. 2011, 129, 195–201. [Google Scholar] [CrossRef]
- Ivansson, E.L.; Juko-Pecirep, I.; Gyllensten, U.B. Interaction of immunological genes on chromosome 2q33 and IFNG in susceptibility to cervical cancer. Gynecol. Oncol. 2010, 116, 544–548. [Google Scholar] [CrossRef]
- Li, Z.; Li, N.; Zhu, Q.; Zhang, G.; Han, Q.; Zhang, P.; Xun, M.; Wang, Y.; Zeng, X.; Yang, C.; et al. Genetic variations of PD1 and TIM3 are differentially and interactively associated with the development of cirrhosis and HCC in patients with chronic HBV infection. Infect. Genet. Evol. 2013, 14, 240–246. [Google Scholar] [CrossRef]
- Keir, M.E.; Butte, M.J.; Freeman, G.J.; Sharpe, A.H. PD-1 and its ligands in tolerance and immunity. Annu. Rev. Immunol. 2008, 26, 677–704. [Google Scholar] [CrossRef]
- Chamoto, K.; Al-Habsi, M.; Honjo, T. Role of PD-1 in Immunity and Diseases. Curr. Top. Microbiol. Immunol. 2017, 410, 75–97. [Google Scholar]
- Thommen, D.S.; Schumacher, T.N. T Cell Dysfunction in Cancer. Cancer Cell 2018, 33, 547–562. [Google Scholar] [CrossRef]
- He, Q.F.; Xu, Y.; Li, J.; Huang, Z.M.; Li, X.H.; Wang, X. CD8+ T-cell exhaustion in cancer: Mechanisms and new area for cancer immunotherapy. Brief. Funct. Genom. 2019, 18, 99–106. [Google Scholar] [CrossRef] [PubMed]
- Memarnejadian, A.; Meilleur, C.E.; Shaler, C.R.; Khazaie, K.; Bennink, J.R.; Schell, T.D.; Haeryfar, S.M.M. PD-1 Blockade Promotes Epitope Spreading in Anticancer CD8(+) T Cell Responses by Preventing Fratricidal Death of Subdominant Clones to Relieve Immunodomination. J. Immunol. 2017, 199, 3348–3359. [Google Scholar] [CrossRef] [PubMed]
- Gato-Canas, M.; Zuazo, M.; Arasanz, H.; Ibanez-Vea, M.; Lorenzo, L.; Fernandez-Hinojal, G.; Vera, R.; Smerdou, C.; Martisova, E.; Arozarena, I.; et al. PDL1 Signals through Conserved Sequence Motifs to Overcome Interferon-Mediated Cytotoxicity. Cell Rep. 2017, 20, 1818–1829. [Google Scholar] [CrossRef] [PubMed]
- Dougan, M. Checkpoint Blockade Toxicity and Immune Homeostasis in the Gastrointestinal Tract. Front. Immunol. 2017, 8, 1547. [Google Scholar] [CrossRef] [PubMed]
- Kuol, N.; Stojanovska, L.; Nurgali, K.; Apostolopoulos, V. PD-1/PD-L1 in disease. Immunotherapy 2018, 10, 149–160. [Google Scholar] [CrossRef] [PubMed]
- Juchem, K.W.; Sacirbegovic, F.; Zhang, C.; Sharpe, A.H.; Russell, K.; McNiff, J.M.; Demetris, A.J.; Shlomchik, M.J.; Shlomchik, W.D. PD-L1 Prevents the Development of Autoimmune Heart Disease in Graft-versus-Host Disease. J. Immunol. 2018, 200, 834–846. [Google Scholar] [CrossRef] [PubMed]
- Zhang, J.; Bu, X.; Wang, H.; Zhu, Y.; Geng, Y.; Nihira, N.T.; Tan, Y.; Ci, Y.; Wu, F.; Dai, X.; et al. Cyclin D-CDK4 kinase destabilizes PD-L1 via cullin 3-SPOP to control cancer immune surveillance. Nature 2018, 553, 91–95. [Google Scholar] [CrossRef]
- Ribas, A. Adaptive Immune Resistance: How Cancer Protects from Immune Attack. Cancer Discov. 2015, 5, 915–919. [Google Scholar] [CrossRef]
- Witt, D.A.; Donson, A.M.; Amani, V.; Moreira, D.C.; Sanford, B.; Hoffman, L.M.; Handler, M.H.; Levy, J.M.M.; Jones, K.L.; Nellan, A.; et al. Specific expression of PD-L1 in RELA-fusion supratentorial ependymoma: Implications for PD-1-targeted therapy. Pediatr. Blood Cancer 2018, 65, e26960. [Google Scholar] [CrossRef]
- Zheng, B.; Ren, T.; Huang, Y.; Sun, K.; Wang, S.; Bao, X.; Liu, K.; Guo, W. PD-1 axis expression in musculoskeletal tumors and antitumor effect of nivolumab in osteosarcoma model of humanized mouse. J. Hematol. Oncol. 2018, 11, 16. [Google Scholar] [CrossRef]
- De Vooght, K.M.; van Wijk, R.; van Solinge, W.W. Management of gene promoter mutations in molecular diagnostics. Clin. Chem. 2009, 55, 698–708. [Google Scholar] [CrossRef] [PubMed]
- Gomez, G.V.B.; Rinck, J.A.; Oliveira, C.; Silva, D.H.L.; Mamoni, R.L.; Lourenco, G.J.; Moraes, A.M.; Lima, C.S.P. PDCD1 gene polymorphisms as regulators of T-lymphocyte activity in cutaneous melanoma risk and prognosis. Pigment Cell Melanoma Res. 2018, 31, 308–317. [Google Scholar] [CrossRef] [PubMed]
- Haghshenas, M.R.; Naeimi, S.; Talei, A.; Ghaderi, A.; Erfani, N. Program death 1 (PD1) haplotyping in patients with breast carcinoma. Mol. Biol. Rep. 2011, 38, 4205–4210. [Google Scholar] [CrossRef] [PubMed]
- Haghshenas, M.R.; Dabbaghmanesh, M.H.; Miri, A.; Ghaderi, A.; Erfani, N. Association of PDCD1 gene markers with susceptibility to thyroid cancer. J. Endocrinol. Investig. 2017, 40, 481–486. [Google Scholar] [CrossRef] [PubMed]
- Li, X.F.; Jiang, X.Q.; Zhang, J.W.; Jia, Y.J. Association of the programmed cell death-1 PD1.5 C>T polymorphism with cervical cancer risk in a Chinese population. Genet. Mol. Res. 2016, 15. [Google Scholar] [CrossRef] [PubMed]
- Li, Y.; Zhang, H.L.; Kang, S.; Zhou, R.M.; Wang, N. The effect of polymorphisms in PD-1 gene on the risk of epithelial ovarian cancer and patients’ outcomes. Gynecol. Oncol. 2017, 144, 140–145. [Google Scholar] [CrossRef] [PubMed]
- Ma, Y.; Liu, X.; Zhu, J.; Li, W.; Guo, L.; Han, X.; Song, B.; Cheng, S.; Jie, L. Polymorphisms of co-inhibitory molecules (CTLA-4/PD-1/PD-L1) and the risk of non-small cell lung cancer in a Chinese population. Int. J. Clin. Exp. Med. 2015, 8, 16585–16591. [Google Scholar]
- Mojtahedi, Z.; Mohmedi, M.; Rahimifar, S.; Erfani, N.; Hosseini, S.V.; Ghaderi, A. Programmed death-1 gene polymorphism (PD-1.5 C/T) is associated with colon cancer. Gene 2012, 508, 229–232. [Google Scholar] [CrossRef]
- Namavar Jahromi, F.; Samadi, M.; Mojtahedi, Z.; Haghshenas, M.R.; Taghipour, M.; Erfani, N. Association of PD-1.5 C/T, but Not PD-1.3 G/A, with Malignant and Benign Brain Tumors in Iranian Patients. Immunol. Investig. 2017, 46, 469–480. [Google Scholar] [CrossRef]
- Pirdelkhosh, Z.; Kazemi, T.; Haghshenas, M.R.; Ghayumi, M.A.; Erfani, N. Investigation of Programmed Cell Death-1 (PD-1) Gene Variations at Positions PD1.3 and PD1.5 in Iranian Patients with Non-small Cell Lung Cancer. Middle East J. Cancer 2018, 9, 13–17. [Google Scholar]
- Savabkar, S.; Azimzadeh, P.; Chaleshi, V.; Nazemalhosseini Mojarad, E.; Aghdaei, H.A. Programmed death-1 gene polymorphism (PD-1.5 C/T) is associated with gastric cancer. Gastroenterol. Hepatol. Bed Bench 2013, 6, 178–182. [Google Scholar] [PubMed]
- Yin, L.; Guo, H.; Zhao, L.; Wang, J. The programmed death-1 gene polymorphism (PD-1.5 C/T) is associated with non-small cell lung cancer risk in a Chinese Han population. Int. J. Clin. Exp. Med. 2014, 7, 5832–5836. [Google Scholar] [PubMed]
- Yousefi, A.R.; Karimi, M.H.; Shamsdin, S.A.; Mehrabani, D.; Hosseini, S.V.; Erfani, N.; Bolandparvaz, S.; Bagheri, K. PD-1 Gene Polymorphisms in Iranian Patients with Colorectal Cancer. Labmedicine 2013, 44, 241–244. [Google Scholar]
- Zhou, R.M.; Li, Y.; Wang, N.; Huang, X.; Cao, S.R.; Shan, B.E. Association of programmed death-1 polymorphisms with the risk and prognosis of esophageal squamous cell carcinoma. Cancer Genet. 2016, 209, 365–375. [Google Scholar] [CrossRef] [PubMed]
- Qiu, H.; Zheng, L.; Tang, W.; Yin, P.; Cheng, F.; Wang, L. Programmed death-1 (PD-1) polymorphisms in Chinese patients with esophageal cancer. Clin. Biochem. 2014, 47, 612–617. [Google Scholar] [CrossRef]
- Ramzi, M.; Arandi, N.; Saadi, M.I.; Yaghobi, R.; Geramizadeh, B. Genetic Variation of Costimulatory Molecules, Including Cytotoxic T-Lymphocyte Antigen 4, Inducible T-Cell Costimulator, Cluster Differentiation 28, and Programmed Cell Death 1 Genes, in Iranian Patients with Leukemia. Exp. Clin. Transpl. 2018. [Google Scholar] [CrossRef]
- Ren, H.T.; Li, Y.M.; Wang, X.J.; Kang, H.F.; Jin, T.B.; Ma, X.B.; Liu, X.H.; Wang, M.; Liu, K.; Xu, P.; et al. PD-1 rs2227982 Polymorphism Is Associated with the Decreased Risk of Breast Cancer in Northwest Chinese Women: A Hospital-Based Observational Study. Medicine 2016, 95, e3760. [Google Scholar] [CrossRef]
- Tan, D.; Sheng, L.; Yi, Q.H. Correlation of PD-1/PD-L1 polymorphisms and expressions with clinicopathologic features and prognosis of ovarian cancer. Cancer Biomark. 2018, 21, 287–297. [Google Scholar] [CrossRef]
- Tang, W.; Chen, S.; Chen, Y.; Lin, J.; Lin, J.; Wang, Y.; Liu, C.; Kang, M. Programmed death-1 polymorphisms is associated with risk of esophagogastric junction adenocarcinoma in the Chinese Han population: A case-control study involving 2740 subjects. Oncotarget 2017, 8, 39198–39208. [Google Scholar]
- Tang, W.; Chen, Y.; Chen, S.; Sun, B.; Gu, H.; Kang, M. Programmed death-1 (PD-1) polymorphism is associated with gastric cardia adenocarcinoma. Int. J. Clin. Exp. Med. 2015, 8, 8086–8093. [Google Scholar]
- Ge, J.; Zhu, L.; Zhou, J.; Li, G.; Li, Y.; Li, S.; Wu, Z.; Rong, J.; Yuan, H.; Liu, Y.; et al. Association between co-inhibitory molecule gene tagging single nucleotide polymorphisms and the risk of colorectal cancer in Chinese. J. Cancer Res. Clin. Oncol. 2015, 141, 1533–1544. [Google Scholar] [CrossRef] [PubMed]
- Bayram, S.; Akkiz, H.; Ulger, Y.; Bekar, A.; Akgollu, E.; Yildirim, S. Lack of an association of programmed cell death-1 PD1.3 polymorphism with risk of hepatocellular carcinoma susceptibility in Turkish population: A case-control study. Gene 2012, 511, 308–313. [Google Scholar] [CrossRef] [PubMed]
- Shamsdin, S.A.; Karimi, M.H.; Hosseini, S.V.; Geramizadeh, B.; Fattahi, M.R.; Mehrabani, D.; Moravej, A. Associations of ICOS and PD.1 Gene Variants with Colon Cancer Risk in The Iranian Population. Asian Pac. J. Cancer Prev. 2018, 19, 693–698. [Google Scholar] [PubMed]
- Catalano, C.; da Silva Filho, M.I.; Frank, C.; Jiraskova, K.; Vymetalkova, V.; Levy, M.; Liska, V.; Vycital, O.; Naccarati, A.; Vodickova, L.; et al. Investigation of single and synergic effects of NLRC5 and PD-L1 variants on the risk of colorectal cancer. PLoS ONE 2018, 13, e0192385. [Google Scholar] [CrossRef] [PubMed]
- Du, W.; Zhu, J.; Chen, Y.; Zeng, Y.; Shen, D.; Zhang, N.; Ning, W.; Liu, Z.; Huang, J.A. Variant SNPs at the microRNA complementary site in the B7-H1 3’-untranslated region increase the risk of non-small cell lung cancer. Mol. Med. Rep. 2017, 16, 2682–2690. [Google Scholar] [CrossRef]
- Tao, L.-H.; Zhou, X.-R.; Li, F.-C.; Chen, Q.; Meng, F.-Y.; Mao, Y.; Li, R.; Hua, D.; Zhang, H.-J.; Wang, W.-P.; et al. A polymorphism in the promoter region of PD-L1 serves as a binding-site for SP1 and is associated with PD-L1 overexpression and increased occurrence of gastric cancer. Cancer Immunol. Immunother. 2016, 66, 309–318. [Google Scholar] [CrossRef] [PubMed]
- Xie, Q.; Chen, Z.; Xia, L.; Zhao, Q.; Yu, H.; Yang, Z. Correlations of PD-L1 gene polymorphisms with susceptibility and prognosis in hepatocellular carcinoma in a Chinese Han population. Gene 2018, 674, 188–194. [Google Scholar] [CrossRef]
- Zhou, R.M.; Li, Y.; Liu, J.H.; Wang, N.; Huang, X.; Cao, S.R.; Shan, B.E. Programmed death-1 ligand-1 gene rs2890658 polymorphism associated with the risk of esophageal squamous cell carcinoma in smokers. Cancer Biomark. 2017, 21, 65–71. [Google Scholar] [CrossRef]
- Chen, Y.B.; Mu, C.Y.; Chen, C.; Huang, J.A. Association between single nucleotide polymorphism of PD-L1 gene and non-small cell lung cancer susceptibility in a Chinese population. Asia Pac. J. Clin. Oncol. 2014, 10, e1–e6. [Google Scholar] [CrossRef]
- Cheng, S.; Zheng, J.; Zhu, J.; Xie, C.; Zhang, X.; Han, X.; Song, B.; Ma, Y.; Liu, J. PD-L1 gene polymorphism and high level of plasma soluble PD-L1 protein may be associated with non-small cell lung cancer. Int. J. Biol. Markers 2015, 30, e364–e368. [Google Scholar] [CrossRef]
- Wang, W.; Li, F.; Mao, Y.; Zhou, H.; Sun, J.; Li, R.; Liu, C.; Chen, W.; Hua, D.; Zhang, X. A miR-570 binding site polymorphism in the B7-H1 gene is associated with the risk of gastric adenocarcinoma. Hum. Genet. 2013, 132, 641–648. [Google Scholar] [CrossRef] [PubMed]
- Fathi, F.; Faghih, Z.; Khademi, B.; Kayedi, T.; Erfani, N.; Gahderi, A. PD-1 Haplotype Combinations and Susceptibility of Patients to Squamous Cell Carcinomas of Head and Neck. Immunol. Investig. 2019, 48, 1–10. [Google Scholar] [CrossRef] [PubMed]
- Hashemi, M.; Bahari, G.; Tabasi, F.; Markowski, J.; Malecki, A.; Ghavami, S.; Los, M.J. LAPTM4B gene polymorphism augments the risk of cancer: Evidence from an updated meta-analysis. J. Cell Mol. Med. 2018, 22, 6396–6400. [Google Scholar] [CrossRef] [PubMed]
- Hashemi, M.; Moazeni-Roodi, A.; Ghavami, S. Association between CASP3 polymorphisms and overall cancer risk: A meta-analysis of case-control studies. J. Cell Biochem. 2019, 120, 7199–7210. [Google Scholar] [CrossRef] [PubMed]
- Hashemi, M.; Moazeni-Roodi, A.; Bahari, G.; Taheri, M.; Ghavami, S. Association between miR-34b/c rs4938723 polymorphism and risk of cancer: An updated meta-analysis of 27 case-control studies. J. Cell Biochem. 2019, 120, 3306–3314. [Google Scholar] [CrossRef] [PubMed]
- Zou, J.; Wu, D.; Li, T.; Wang, X.; Liu, Y.; Tan, S. Association of PD-L1 gene rs4143815 C>G polymorphism and human cancer susceptibility: A systematic review and meta-analysis. Pathol. Res. Pract. 2019, 215, 229–234. [Google Scholar] [CrossRef] [PubMed]
- Da, L.S.; Zhang, Y.; Zhang, C.J.; Bu, L.J.; Zhu, Y.Z.; Ma, T.; Gu, K.S. The PD-1 rs36084323 A > G polymorphism decrease cancer risk in Asian: A meta-analysis. Pathol. Res. Pract. 2018, 214, 1758–1764. [Google Scholar] [CrossRef] [PubMed]
- Zhang, J.; Zhao, T.; Xu, C.; Huang, J.; Yu, H. The association between polymorphisms in the PDCD1 gene and the risk of cancer: A PRISMA-compliant meta-analysis. Medicine 2016, 95, e4423. [Google Scholar] [CrossRef] [PubMed]
- Dong, W.; Gong, M.; Shi, Z.; Xiao, J.; Zhang, J.; Peng, J. Programmed Cell Death-1 Polymorphisms Decrease the Cancer Risk: A Meta-Analysis Involving Twelve Case-Control Studies. PLoS ONE 2016, 11, e0152448. [Google Scholar] [CrossRef]
- Mamat, U.; Arkinjan, M. Association of programmed death-1 gene polymorphism rs2227981 with tumor: Evidence from a meta analysis. Int. J. Clin. Exp. Med. 2015, 8, 13282–13288. [Google Scholar]
- Lim, Y.W.; Chen-Harris, H.; Mayba, O.; Lianoglou, S.; Wuster, A.; Bhangale, T.; Khan, Z.; Mariathasan, S.; Daemen, A.; Reeder, J.; et al. Germline genetic polymorphisms influence tumor gene expression and immune cell infiltration. Proc. Natl. Acad. Sci. USA 2018, 115, E11701–E11710. [Google Scholar] [CrossRef] [PubMed]
- Wu, Y.; Zhao, T.; Jia, Z.; Cao, D.; Cao, X.; Pan, Y.; Zhao, D.; Zhang, B.; Jiang, J. Polymorphism of the programmed death-ligand 1 gene is associated with its protein expression and prognosis in gastric cancer. J. Gastroenterol. Hepatol. 2018, 34, 1201–1207. [Google Scholar] [CrossRef] [PubMed]
- Salmaninejad, A.; Khoramshahi, V.; Azani, A.; Soltaninejad, E.; Aslani, S.; Zamani, M.R.; Zal, M.; Nesaei, A.; Hosseini, S.M. PD-1 and cancer: Molecular mechanisms and polymorphisms. Immunogenetics 2018, 70, 73–86. [Google Scholar] [CrossRef] [PubMed]
- Erdogdu, I.H. MHC Class 1 and PDL-1 Status of Primary Tumor and Lymph Node Metastatic Tumor Tissue in Gastric Cancers. Gastroenterol. Res. Pract. 2019, 2019, 4785098. [Google Scholar] [CrossRef] [PubMed]
- Yeo, M.K.; Choi, S.Y.; Seong, I.O.; Suh, K.S.; Kim, J.M.; Kim, K.H. Association of PD-L1 expression and PD-L1 gene polymorphism with poor prognosis in lung adenocarcinoma and squamous cell carcinoma. Hum. Pathol. 2017, 68, 103–111. [Google Scholar] [CrossRef] [PubMed]
- Yarchoan, M.; Albacker, L.A.; Hopkins, A.C.; Montesion, M.; Murugesan, K.; Vithayathil, T.T.; Zaidi, N.; Azad, N.S.; Laheru, D.A.; Frampton, G.M.; et al. PD-L1 expression and tumor mutational burden are independent biomarkers in most cancers. JCI Insight 2019, 4, 126908. [Google Scholar] [CrossRef] [PubMed]
- Yu, D.; Cheng, J.; Xue, K.; Zhao, X.; Wen, L.; Xu, C. Expression of Programmed Death-Ligand 1 in Laryngeal Carcinoma and its Effects on Immune Cell Subgroup Infiltration. Pathol. Oncol. Res. 2018, 2018, 1–7. [Google Scholar] [CrossRef]
- Salhab, M.; Migdady, Y.; Donahue, M.; Xiong, Y.; Dresser, K.; Walsh, W.; Chen, B.J.; Liebmann, J. Immunohistochemical expression and prognostic value of PD-L1 in Extrapulmonary small cell carcinoma: A single institution experience. J. Immunother. Cancer 2018, 6, 42. [Google Scholar] [CrossRef]
- Botti, G.; Collina, F.; Scognamiglio, G.; Rao, F.; Peluso, V.; De Cecio, R.; Piezzo, M.; Landi, G.; De Laurentiis, M.; Cantile, M.; et al. Programmed Death Ligand 1 (PD-L1) Tumor Expression Is Associated with a Better Prognosis and Diabetic Disease in Triple Negative Breast Cancer Patients. Int. J. Mol. Sci. 2017, 18, 459. [Google Scholar] [CrossRef]
- Patsoukis, N.; Brown, J.; Petkova, V.; Liu, F.; Li, L.; Boussiotis, V.A. Selective effects of PD-1 on Akt and Ras pathways regulate molecular components of the cell cycle and inhibit T cell proliferation. Sci. Signal 2012, 5, ra46. [Google Scholar] [CrossRef]
- LaFleur, M.W.; Muroyama, Y.; Drake, C.G.; Sharpe, A.H. Inhibitors of the PD-1 Pathway in Tumor Therapy. J. Immunol. 2018, 200, 375–383. [Google Scholar] [CrossRef] [PubMed]
- Berntsson, J.; Eberhard, J.; Nodin, B.; Leandersson, K.; Larsson, A.H.; Jirstrom, K. Expression of programmed cell death protein 1 (PD-1) and its ligand PD-L1 in colorectal cancer: Relationship with sidedness and prognosis. Oncoimmunology 2018, 7, e1465165. [Google Scholar] [CrossRef] [PubMed]
- Shi, B.; Li, Q.; Ma, X.; Gao, Q.; Li, L.; Chu, J. High expression of programmed cell death protein 1 on peripheral blood T-cell subsets is associated with poor prognosis in metastatic gastric cancer. Oncol. Lett. 2018, 16, 4448–4454. [Google Scholar] [CrossRef] [PubMed]
- Fang, J.; Shao, Y.; Su, J.; Wan, Y.; Bao, L.; Wang, W.; Kong, F. Diagnostic value of PD-1 mRNA expression combined with breast ultrasound in breast cancer patients. Ther. Clin. Risk Manag. 2018, 14, 1527–1535. [Google Scholar] [CrossRef] [PubMed]
- Ueda, K.; Suekane, S.; Kurose, H.; Chikui, K.; Nakiri, M.; Nishihara, K.; Matsuo, M.; Kawahara, A.; Yano, H.; Igawa, T. Prognostic value of PD-1 and PD-L1 expression in patients with metastatic clear cell renal cell carcinoma. Urol. Oncol. 2018, 36, 499. [Google Scholar] [CrossRef]


| Gene Name | db SNP rs # ID a | Chromosome Position | Location | Base Change | Amino Acid Change |
|---|---|---|---|---|---|
| PD-1 | rs2227981 | chr2:241851121 | Upstream | C/T | - |
| rs2227982 | chr2:241851281 | Exon | C/T | Ala215Val | |
| rs7421861 | chr2:241853198 | Intron | T/C | - | |
| rs11568821 | chr2:241851760 | Intron | G/A | - | |
| rs36084323 | chr2:241859444 | Upstream | G/A | - | |
| rs10204525 | chr2:241850169 | 3′UTR | A/G | - | |
| PD-L1 | rs4143815 | chr9:5468257 | 3′UTR | G/C | - |
| rs2890658 | chr9:5465130 | Intron | A/C | - |
| First Author | Year | Country | Ethnicity | Cancer Type | Source of Control | Genotyping Method | Case/Control | Cases | Controls | HWE | ||||||||
|---|---|---|---|---|---|---|---|---|---|---|---|---|---|---|---|---|---|---|
| PD-1 rs2227981 | CC | CT | TT | C | T | CC | CT | TT | C | T | ||||||||
| Fathi | 2019 | Iran | Asian | Squamous Cell Carcinomas of Head and Neck | HB | PCR-RFLP | 150/150 | 65 | 69 | 16 | 199 | 101 | 66 | 71 | 13 | 203 | 97 | 0.317 |
| Gomez | 2018 | Brazil | South American | Cutaneous Melanoma | PB | RT-PCR | 250/250 | 87 | 126 | 37 | 300 | 200 | 85 | 130 | 35 | 300 | 200 | 0.188 |
| Haghshenas | 2011 | Iran | Asian | Breast cancer | PB | PCR-RFLP | 435/328 | 194 | 191 | 50 | 579 | 291 | 137 | 145 | 46 | 419 | 237 | 0.446 |
| Haghshenas | 2017 | Iran | Asian | Thyroid cancer | PB | PCR-RFLP | 105/160 | 40 | 51 | 14 | 131 | 79 | 99 | 51 | 10 | 249 | 71 | 0.331 |
| Hua | 2011 | China | Asian | breast cancer | PB | PCR-RFLP | 486/478 | 295 | 169 | 22 | 759 | 213 | 244 | 210 | 24 | 698 | 258 | 0.012 |
| Ivansson | 2010 | Sweden | Caucasian | Cervical cancer | PB | TaqMan | 1300/810 | 471 | 603 | 226 | 1545 | 1055 | 257 | 375 | 178 | 889 | 731 | 0.064 |
| Li | 2016 | China | Asian | Cervical cancer | PB | PCR-RFLP | 256/250 | 45 | 167 | 44 | 257 | 255 | 62 | 101 | 87 | 225 | 275 | 0.004 |
| Li | 2017 | China | Asian | Ovarian cancer | HB | PCR-LDR | 620/620 | 351 | 233 | 36 | 935 | 305 | 319 | 250 | 51 | 888 | 352 | 0.837 |
| Ma | 2015 | China | Asian | lung cancer | PB | PCR-RFLP | 528/600 | 244 | 216 | 68 | 704 | 352 | 256 | 246 | 98 | 758 | 442 | 0.004 |
| Mojtahedi | 2012 | Iran | Asian | Colon cancer | PB | PCR-RFLP | 175/200 | 47 | 102 | 26 | 196 | 154 | 75 | 89 | 36 | 239 | 161 | 0.290 |
| Mojtahedi | 2012 | Iran | Asian | Rectal cancer | PB | PCR-RFLP | 25/200 | 12 | 7 | 6 | 31 | 19 | 75 | 89 | 36 | 239 | 161 | 0.290 |
| Namavar Jahromi | 2017 | Iran | Asian | Malignant Brain tumor | PB | PCR-RFLP | 56/150 | 22 | 31 | 3 | 75 | 37 | 94 | 47 | 9 | 235 | 65 | 0.346 |
| Pirdelkhosh | 2018 | Iran | Asian | NSCLC | PB | PCR-RFLP | 206/173 | 78 | 100 | 28 | 256 | 156 | 60 | 89 | 24 | 209 | 137 | 0.321 |
| Savabkar | 2013 | Iran | Asian | Gastric cancer | HB | PCR-RFLP | 122/166 | 50 | 66 | 6 | 166 | 78 | 89 | 70 | 7 | 248 | 84 | 0.136 |
| Yin | 2014 | China | Asian | Lung cancer | PB | PCR | 324/330 | 198 | 106 | 20 | 502 | 146 | 181 | 105 | 44 | 467 | 193 | 0.001 |
| Zhou | 2016 | China | Asian | ESCC | PB | PCR-LDR | 584/585 | 291 | 241 | 52 | 823 | 345 | 310 | 229 | 46 | 849 | 321 | 0.683 |
| PD-1 rs2227982 | CC | CT | TT | C | T | CC | CT | TT | C | T | ||||||||
| Fathi | 2019 | Iran | Asian | Squamous Cell Carcinomas of Head and Neck | HB | PCR-RFLP | 150/150 | 146 | 4 | 0 | 296 | 4 | 146 | 4 | 0 | 296 | 4 | 0.868 |
| Gomez | 2018 | Brazil | South American | Cutaneous Melanoma | PB | RT-PCR | 250/250 | 227 | 21 | 2 | 475 | 25 | 225 | 25 | 0 | 475 | 25 | 0.405 |
| Hua | 2011 | China | Asian | breast cancer | PB | PCR-RFLP | 487/506 | 111 | 249 | 127 | 471 | 503 | 95 | 268 | 143 | 458 | 554 | 0.121 |
| Ma | 2015 | China | Asian | lung cancer | PB | PCR-RFLP | 528/600 | 343 | 148 | 37 | 834 | 222 | 404 | 168 | 28 | 976 | 224 | 0.056 |
| Qiu | 2014 | China | Asian | esophageal cancer | HB | PCR-LDR | 616/681 | 159 | 303 | 154 | 621 | 611 | 189 | 325 | 167 | 703 | 659 | 0.245 |
| Ramzi | 2018 | Iran | Asian | Leukemia | PB | PCR-RFLP | 59/38 | 38 | 18 | 3 | 94 | 24 | 17 | 19 | 2 | 53 | 23 | 0.255 |
| Ren | 2016 | China | Asian | Breast Cancer | PB | MassARRAY | 557/582 | 172 | 257 | 128 | 601 | 513 | 137 | 299 | 146 | 573 | 591 | 0.503 |
| Tan | 2018 | China | Asian | Ovarian cancer | PB | PCR-RFLP | 164/170 | 87 | 60 | 17 | 234 | 94 | 111 | 48 | 11 | 270 | 70 | 0.075 |
| Tang | 2015 | China | Asian | Gastric cardia adenocarcinoma | HB | PCR-LDR | 330/603 | 75 | 168 | 87 | 318 | 342 | 163 | 292 | 148 | 618 | 588 | 0.448 |
| Tang | 2017 | China | Asian | Esophagogastric junction adenocarcinoma | HB | SNPscan | 1041/1674 | 220 | 549 | 272 | 989 | 1093 | 416 | 816 | 442 | 1648 | 1700 | 0.309 |
| Zhou | 2016 | China | Asian | ESCC | PB | PCR-LDR | 584/585 | 149 | 305 | 130 | 603 | 565 | 150 | 297 | 138 | 597 | 573 | 0.702 |
| PD-1 rs7421861 | TT | TC | CC | T | C | TT | TC | CC | T | C | ||||||||
| Ge | 2015 | China | Asian | Colon cancer | HB | PCR-RFLP | 199/620 | 133 | 60 | 6 | 326 | 72 | 440 | 163 | 17 | 1043 | 197 | 0.685 |
| Ge | 2015 | China | Asian | Rectal cancer | HB | PCR-RFLP | 362/620 | 241 | 114 | 7 | 596 | 128 | 440 | 163 | 17 | 1043 | 197 | 0.685 |
| Hua | 2011 | China | Asian | Breast cancer | PB | PCR-RFLP | 490/512 | 333 | 146 | 11 | 812 | 168 | 370 | 130 | 12 | 870 | 154 | 0.885 |
| Qiu | 2014 | China | Asian | esophageal cancer | HB | PCR-LDR | 600/673 | 411 | 168 | 21 | 990 | 210 | 460 | 188 | 25 | 1108 | 238 | 0.295 |
| Ren | 2016 | China | Asian | Breast Cancer | PB | MassARRAY | 560/580 | 341 | 196 | 23 | 878 | 242 | 347 | 205 | 28 | 899 | 261 | 0.746 |
| Tang | 2015 | China | Asian | Gastric cardia adenocarcinoma | HB | PCR-LDR | 324/598 | 226 | 91 | 7 | 543 | 105 | 408 | 168 | 22 | 984 | 212 | 0.368 |
| Tang | 2017 | China | Asian | esophagogastric junction adenocarcinoma | HB | SNPscan | 1041/1674 | 642 | 358 | 41 | 1642 | 440 | 1166 | 454 | 54 | 2786 | 562 | 0.232 |
| PD-1 rs11568821 | GG | AG | AA | G | A | GG | AG | AA | G | A | ||||||||
| Bayram | 2012 | Turkey | Asian | liver cancer | HB | PCR-RFLP | 236/236 | 191 | 45 | 0 | 427 | 45 | 180 | 56 | 0 | 416 | 56 | 0.039 |
| Fathi | 2019 | Iran | Asian | Squamous Cell Carcinomas of Head and Neck | HB | PCR-RFLP | 150/150 | 119 | 27 | 4 | 265 | 35 | 113 | 32 | 5 | 258 | 42 | 0.162 |
| Haghshenas | 2011 | Iran | Asian | Breast cancer | PB | PCR-RFLP | 436/290 | 365 | 63 | 8 | 793 | 79 | 231 | 55 | 4 | 517 | 63 | 0.726 |
| Haghshenas | 2017 | Iran | Asian | Thyroid cancer | PB | PCR-RFLP | 95/160 | 82 | 13 | 0 | 177 | 13 | 127 | 30 | 3 | 284 | 36 | 0.440 |
| Ma | 2015 | China | Asian | lung cancer | PB | PCR-RFLP | 528/600 | 426 | 102 | 0 | 954 | 102 | 456 | 142 | 2 | 1054 | 146 | 0.009 |
| Namavar Jahromi | 2017 | Iran | Asian | Malignant Brain tumor | PB | PCR-RFLP | 56/150 | 47 | 8 | 1 | 102 | 10 | 116 | 30 | 4 | 262 | 38 | 0.240 |
| Pirdelkhosh | 2018 | Iran | Asian | NSCLC | PB | PCR-RFLP | 206/173 | 171 | 31 | 4 | 373 | 39 | 144 | 26 | 3 | 314 | 32 | 0.168 |
| Ramzi | 2018 | Iran | Asian | Leukemia | PB | PCR-RFLP | 59/38 | 38 | 18 | 3 | 94 | 24 | 21 | 13 | 4 | 55 | 21 | 0.373 |
| Yousefi | 2013 | Asian | colon cancer | PB | 80/110 | 18 | 27 | 35 | 63 | 97 | 43 | 45 | 22 | 131 | 89 | 0.114 | ||
| PD-1 rs36084323 | GG | AG | AA | G | A | GG | AG | AA | G | A | ||||||||
| Gomez | 2018 | Brazil | South American | Cutaneous Melanoma | PB | RT-PCR | 250/250 | 226 | 18 | 6 | 470 | 30 | 225 | 25 | 0 | 475 | 25 | 0.405 |
| Hua | 2011 | China | Asian | Breast cancer | PB | PCR-RFLP | 490/512 | 103 | 271 | 116 | 477 | 503 | 140 | 260 | 112 | 540 | 484 | 0.673 |
| Li | 2017 | China | Asian | Ovarian cancer | HB | PCR-LDR | 620/620 | 150 | 301 | 169 | 601 | 639 | 168 | 323 | 129 | 659 | 581 | 0.251 |
| Ma | 2015 | China | Asian | lung cancer | PB | PCR-RFLP | 528/600 | 144 | 246 | 138 | 534 | 522 | 156 | 296 | 148 | 608 | 592 | 0.747 |
| Shamsdin | 2018 | Iran | Asian | Colon cancer | PB | PCR-RFLP | 76/73 | 60 | 15 | 1 | 135 | 17 | 18 | 28 | 27 | 64 | 82 | 0.059 |
| Tang | 2017 | China | Asian | esophagogastric junction adenocarcinoma | HB | SNPscan | 1041/1674 | 238 | 521 | 282 | 997 | 1085 | 430 | 800 | 444 | 1660 | 1688 | 0.071 |
| Zhou | 2016 | China | Asian | ESCC | PB | PCR-LDR | 584/585 | 147 | 303 | 134 | 597 | 571 | 145 | 298 | 142 | 588 | 582 | 0.649 |
| PD-1 rs10204525 | AA | AG | GG | A | G | AA | AG | GG | A | G | ||||||||
| Li | 2013 | China | Asian | HCC | PB | TIANamp | 271/318 | 180 | 83 | 8 | 443 | 99 | 160 | 130 | 28 | 450 | 186 | 0.828 |
| Qiu | 2014 | China | Asian | esophageal cancer | HB | PCR-LDR | 600/651 | 317 | 240 | 43 | 874 | 326 | 345 | 243 | 63 | 933 | 369 | 0.039 |
| Ren | 2016 | China | Asian | Breast Cancer | PB | MassARRAY | 559/582 | 257 | 248 | 54 | 762 | 356 | 291 | 240 | 51 | 822 | 342 | 0.880 |
| Tang | 2015 | China | Asian | Gastric cardia adenocarcinoma | HB | PCR-LDR | 313/581 | 169 | 123 | 21 | 461 | 165 | 309 | 219 | 53 | 837 | 325 | 0.120 |
| Tang | 2017 | China | Asian | esophagogastric junction adenocarcinoma | HB | SNPscan | 1039/1674 | 544 | 397 | 98 | 1485 | 593 | 870 | 672 | 132 | 2412 | 936 | 0.888 |
| Zhou | 2016 | China | Asian | ESCC | PB | PCR-LDR | 584/585 | 325 | 226 | 33 | 876 | 292 | 296 | 238 | 51 | 830 | 340 | 0.749 |
| PD-L1 rs4143815 | GG | CG | CC | G | C | GG | CG | CC | G | C | ||||||||
| Catalano | 2018 | Czech | Caucasian | Colon cancer | HB | TaqMan | 824/1103 | 388 | 345 | 91 | 1121 | 527 | 514 | 467 | 122 | 1495 | 711 | 0.306 |
| Catalano | 2018 | Czech | Caucasian | Rectal cancer | HB | TaqMan | 371/1103 | 167 | 162 | 42 | 496 | 246 | 514 | 467 | 122 | 1495 | 711 | 0.306 |
| Du | 2017 | China | Asian | NSCLC | HB | sequencing | 320/199 | 52 | 145 | 123 | 249 | 391 | 40 | 80 | 79 | 160 | 238 | 0.021 |
| Tan | 2018 | China | Asian | Ovarian cancer | PB | PCR-RFLP | 164/170 | 51 | 82 | 31 | 184 | 144 | 38 | 78 | 54 | 154 | 186 | 0.334 |
| Tao | 2017 | China | Asian | Gastric cancer | HB | Sequencing | 346/500 | 123 | 153 | 70 | 399 | 293 | 117 | 223 | 160 | 457 | 543 | 0.023 |
| Wang | 2013 | China | Asian | Gastric cancer | HB | sequencing | 205/393 | 88 | 72 | 45 | 248 | 162 | 70 | 188 | 135 | 328 | 458 | 0.746 |
| Xie | 2018 | China | Asian | HCC | HB | sequencing | 225/200 | 74 | 101 | 50 | 249 | 201 | 31 | 104 | 65 | 166 | 234 | 0.316 |
| Zhou | 2017 | China | Asian | ESCC | PB | PCR-LDR | 575/577 | 87 | 277 | 211 | 451 | 699 | 85 | 289 | 203 | 459 | 695 | 0.275 |
| PD-L1 rs2890658 | AA | AC | CC | A | C | AA | AC | CC | A | C | ||||||||
| Chen | 2014 | China | Asian | NSCLC | HB | PCR-RFLP | 293/293 | 242 | 48 | 3 | 532 | 54 | 266 | 26 | 1 | 558 | 28 | 0.671 |
| Cheng | 2015 | China | Asian | NSCLC | HB | PCR-RFLP | 288/300 | 233 | 51 | 4 | 517 | 59 | 269 | 30 | 1 | 568 | 32 | 0.867 |
| Ma | 2015 | China | Asian | lung cancer | PB | PCR-RFLP | 528/600 | 416 | 106 | 6 | 938 | 118 | 512 | 84 | 4 | 1108 | 92 | 0.785 |
| Xie | 2018 | China | Asian | HCC | HB | sequencing | 225/200 | 170 | 49 | 6 | 389 | 61 | 139 | 55 | 6 | 333 | 67 | 0.844 |
| Zhou | 2017 | China | Asian | ESCC | PB | PCR-LDR | 575/577 | 18 | 161 | 396 | 197 | 953 | 15 | 144 | 418 | 174 | 980 | 0.541 |
| Polymorphism | n | Genetic Model | Association Test | Heterogeneity Test | Publication Bias Test | |||||
|---|---|---|---|---|---|---|---|---|---|---|
| OR (95% CI) | Z | p | χ2 | I2 (%) | p | Egger’s Test p | Begg’s Test p | |||
| PD-1 rs2227981 | 16 | CT vs. CC | 1.11 (0.93–1.33) | 1.16 | 0.25 | 61.22 | 75 | <0.00001 | 0.032 | 0.031 |
| TT vs. CC | 0.86 (0.72–1.04) | 1.51 | 0.13 | 27.39 | 45 | 0.03 | 0.034 | 0.024 | ||
| CT+TT vs. CC | 1.05 (0.89–1.24) | 0.64 | 0.52 | 58.58 | 74 | <0.00001 | 0.019 | 0.005 | ||
| TT vs. CT+CC | 0.82 (0.68–0.99) | 2.04 | 0.04 | 31.12 | 52 | 0.008 | 0.155 | 0.150 | ||
| T vs. C | 0.98 (0.87–1.09) | 0.43 | 0.66 | 51.48 | 71 | <0.00001 | 0.020 | 0.012 | ||
| PD-1 rs2227982 | 11 | CT vs. CC | 1.01 (0.85–1.19) | 0.09 | 0.930 | 24.53 | 59 | 0.006 | 0.359 | 0.186 |
| TT vs. CC | 1.05 (0.87–1.26) | 0.51 | 0.611 | 17.10 | 47 | 0.050 | 0.288 | 0.180 | ||
| CT+TT vs. CC | 1.02 (0.86–1.20) | 0.22 | 0.829 | 26.49 | 62 | 0.003 | 0.469 | 0.484 | ||
| TT vs. CT+CC | 1.00 (0.90–1.10) | 0.04 | 0.97 | 7.52 | 0 | 0.581 | 0.184 | 0.211 | ||
| T vs. C | 1.02 (0.92–1.12) | 0.38 | 0.707 | 20.50 | 51 | 0.025 | 0.927 | 0.715 | ||
| PD-1 rs11568821 | 9 | AG vs. GG | 0.79 (0.67–0.94) | 2.73 | 0.006 | 3.89 | 0 | 0.87 | 0.499 | 0.409 |
| AA vs. GG | 1.01 (0.47–2.14) | 0.01 | 0.99 | 13.19 | 47 | 0.07 | 0.015 | 0.091 | ||
| AG+AA vs. GG | 0.82 (0.70–0.96) | 2.42 | 0.020 | 11.30 | 29 | 0.19 | 0.613 | 0.835 | ||
| AA vs. AG+GG | 1.07 (0.54–2.13) | 0.19 | 0.846 | 11.79 | 41 | 0.11 | 0.010 | 0.095 | ||
| A vs. G | 0.88 (0.68–1.15) | 0.92 | 0.36 | 24.39 | 67 | 0.002 | 0.822 | 0.835 | ||
| PD-1 rs7421861 | 7 | CT vs. TT | 1.16 (1.02–1.33) | 2.20 | 0.03 | 0.01 | 46 | 0.09 | 0.215 | 0.881 |
| CC vs. TT | 1.00 (0.79–1.28) | 0.03 | 0.98 | 4.76 | 0 | 0.57 | 0.116 | 0.881 | ||
| CT+CC vs. TT | 1.14 (0.99–1.31) | 1.81 | 0.07 | 12.93 | 54 | 0.04 | 0.196 | 0.453 | ||
| CC vs. CT+TT | 0.96 (0.75–1.22) | 0.37 | 0.71 | 3.49 | 0 | 0.75 | 0.101 | 0.652 | ||
| C vs. T | 1.09 (0.97–1.23) | 1.42 | 0.16 | 13.02 | 54 | 0.04 | 0.200 | 0.652 | ||
| PD-1 rs36084323 | 7 | AG vs. GG | 0.92 (0.71–1.20) | 0.60 | 0.55 | 27.83 | 78 | 0.0001 | 0.042 | 0.051 |
| AA vs. GG | 1.08 (0.77–1.52) | 0.45 | 0.66 | 28.21 | 79 | 0.0001 | 0.079 | 0.188 | ||
| AG+AA vs. GG | 0.88 (0.64–1.21) | 0.79 | 0.43 | 47.46 | 87 | <0.00001 | 0.081 | 0.293 | ||
| AA vs. AG+GG | 1.06 (0.83–1.36) | 0.46 | 0.64 | 22.86 | 74 | 0.0008 | 0.137 | 0.348 | ||
| A vs. G | 0.89 (0.70–1.14) | 0.92 | 0.36 | 66.01 | 91 | <0.00001 | 0.160 | 0.453 | ||
| PD-1 rs10204525 | 6 | AG vs. AA | 0.94 (0.80–1.10) | 0.76 | 0.45 | 13.13 | 62 | 0.02 | 0.640 | 0.851 |
| GG vs. AA | 0.76 (0.53–1.09) | 1.48 | 0.14 | 19.40 | 74 | 0.002 | 0.031 | 0.091 | ||
| AG+GG vs. AA | 0.90 (0.75–1.08) | 1.10 | 0.27 | 18.41 | 73 | 0.002 | 0.399 | 0.188 | ||
| GG vs. AG+AA | 0.78 (0.57–1.09) | 1.46 | 0.14 | 16.64 | 70 | 0.005 | 0.020 | 0.039 | ||
| G vs. A | 0.89 (0.76–1.05) | 1.38 | 0.17 | 23.71 | 79 | 0.0002 | 0.172 | 0.091 | ||
| PD-L1 rs4143815 | 8 | CG vs. GG | 0.75 (0.55–1.01) | 1.89 | 0.06 | 43.76 | 84 | <0.0001 | 0.230 | 0.322 |
| CC vs. GG | 0.62 (0.41–0.94) | 2.28 | 0.02 | 52.19 | 87 | <0.00001 | 0.188 | 0.138 | ||
| CG+CC vs. GG | 0.70 (0.50–0.97) | 2.15 | 0.03 | 43.20 | 84 | <0.00001 | 0.184 | 0.138 | ||
| CC vs. CG+GG | 0.76 (0.60–0.96) | 2.30 | 0.02 | 25.19 | 72 | 0.0007 | 0.070 | 0.138 | ||
| C vs. G | 0.78 (0.63–0.96) | 2.33 | 0.02 | 61.68 | 89 | <0.00001 | 0.100 | 0.138 | ||
| PD-L1 rs2890658 | 5 | AC vs. AA | 1.36 (0.92–2.01) | 1.53 | 0.13 | 13.83 | 71 | 0.008 | 0.757 | 0.624 |
| CC vs. AA | 1.12 (0.68–1.84) | 0.45 | 0.65 | 4.31 | 7 | 0.37 | 0.032 | 0.050 | ||
| AC+CC vs. AA | 1.35 (0.89–2.04) | 1.43 | 0.15 | 16.24 | 75 | 0.003 | 0.736 | 1.000 | ||
| CC vs. AC+AA | 0.90 (0.71–1.15) | 0.83 | 0.41 | 4.25 | 6 | 0.37 | 0.041 | 0.050 | ||
| C vs. A | 1.30 (0.88–1.91) | 1.32 | 0.19 | 25.96 | 85 | <0.0001 | 0.248 | 0.142 | ||
| Variable | No. | CT vs. CC | TT vs. CC | CT+TT vs. CC | TT vs. CT+CC | T vs. C | |||||
|---|---|---|---|---|---|---|---|---|---|---|---|
| PD-1 rs2227981 | OR (95% CI) | p | OR (95% CI) | p | OR (95% CI) | p | OR (95% CI) | p | OR (95% CI) | p | |
| Asian | 14 | 1.16 (0.94–1.43) | 0.173 | 0.89 (0.71–1.12) | 0.312 | 1.09 (0.90–1.32) | 0.393 | 0.83 (0.66–1.04) | 0.106 | 1.00 (0.87–1.14) | 0.953 |
| Population-based | 13 | 1.12 (0.91–1.39) | 0.276 | 0.88 (0.70–1.07) | 0.175 | 1.06 (0.87–1.28) | 0.571 | 0.81 (0.66–1.01) | 0.060 | 0.97 (0.85–1.10) | 0.611 |
| Hospital-based | 3 | 1.06 (0.72–1.61) | 0.714 | 0.91 (0.53–1.59) | 0.749 | 1.04 (0.68–1.57) | 0.873 | 0.85 (0.57–1.26) | 0.421 | 1.03 (0.76–1.41) | 0.839 |
| Gastrointestinal cancer | 3 | 1.13 (0.73–1.76) | 0.588 | 0.68 (0.56–0.84) | 0.000 | 0.95 (0.71–1.27) | 0.713 | 0.60 (0.40–0.89) | 0.011 | 0.83 (0.75–0.91) | 0.000 |
| Lung cancer | 3 | 0.91 (0.76–1.10) | 0.324 | 0.65 (0.44–0.97) | 0.030 | 0.84 (0.71–0.99) | 0.043 | 0.69 (0.45–1.04) | 0.079 | 0.83 (0.72–0.95) | 0.009 |
| Breast cancer | 2 | 0.78 (0.56–1.08) | 0.136 | 0.76 (0.53–1.10) | 0.147 | 0.80 (0.59–1.01) | 0.058 | 0.83 (0.59–1.17) | 0.291 | 0.82 (0.70–0.96) | 0.012 |
| PD-1 rs2227982 | CT vs. CC | TT vs. CC | CT+TT vs. CC | TT vs. CT+CC | T vs. C | ||||||
| Asian | 10 | 1.02 (0.85–1.21) | 0.845 | 1.04 (0.87–1.26) | 0.655 | 1.02 (0.86–1.22) | 0.790 | 1.00 (0.90–1.10) | 0.921 | 1.02 (0.92–1.12) | 0.708 |
| Population-based | 8 | 0.91 (0.73–1.12) | 0.363 | 0.99 (0.73–1.33) | 0.934 | 0.93 (0.741.16) | 0.507 | 0.99 (0.83–1.17) | 0.734 | 0.98 (0.85–1.14) | 0.818 |
| Hospital-based | 3 | 1.22 (1.06–1.40) | 0.006 | 1.16 (0.99–1.37) | 0.067 | 1.20 (1.05–1.37) | 0.008 | 1.02 (0.89–1.16) | 0.806 | 1.08 (0.99–1.17) | 0.077 |
| Gastrointestinal cancer | 4 | 1.18 (1.04–1.34) | 0.011 | 1.12 (0.97–1.29) | 0.133 | 1.16 (1.03–1.30) | 0.017 | 1.00 (0.89–1.12) | 0.989 | 1.06 (0.98–1.34) | 0.146 |
| Breast cancer | 2 | 0.73 (0.59–0.90) | 0.004 | 0.73 (0.57–0.93) | 0.010 | 0.73 (0.60–0.89) | 0.002 | 0.89 (0.74–1.09) | 0.257 | 0.85 (0.76–0.96) | 0.010 |
| PD-1 rs7421861 | CT vs. TT | CC vs. TT | CT+CC vs. TT | CC vs. CT+TT | C vs. T | ||||||
| Hospital-based | 5 | 1.89 (1.01–1.40) | 0.042 | 1.05 (0.79–1.39) | 0.745 | 1.16 (0.98–1.38) | 0.096 | 0.99 (0.74–1.31) | 0.916 | 1.11 (0.95–1.29) | 0.192 |
| Population-based | 2 | 1.09 (0.86–1.39) | 0.478 | 0.89 (0.56–1.43) | 0.630 | 1.07 (0.84–1.37) | 0.565 | 0.88 (0.55–1.40) | 0.586 | 1.04 (0.85–1.28) | 0.692 |
| Gastrointestinal cancer | 5 | 1.19 (1.01–1.40) | 0.042 | 1.05 (0.79–1.39) | 0.745 | 1.16 (0.97–1.38) | 0.096 | 1.00 (0.75–1.32) | 0.979 | 1.11 (0.95–1.29) | 0.192 |
| Breast cancer | 2 | 1.09 (0.86–1.39) | 0.478 | 0.89 (0.56–1.43) | 0.630 | 1.07 (0.84–1.37) | 0.565 | 0.88 (0.55–1.40) | 0.586 | 1.04 (0.85 (1.28) | 0.692 |
| PD-1 rs11568821 | AG vs. GG | AA vs. GG | AG+AA vs. GG | AA vs. AG+GG | A vs. G | ||||||
| Population-based | 7 | 0.80 (0.66–0.97) | 0.020 | 1.02 (0.43–2.42) | 0.968 | 0.86 (0.65–1.14) | 0.288 | 1.09 (0.50–2.38) | 0.833 | 0.92 (0.78–1.08) | 0.294 |
| Hospital-based | 2 | 0.77 (0.55–1.10) | 0.150 | 0.76 (0.20–2.90) | 0.688 | 0.77 (0.55–1.09) | 0.140 | 0.76 (0.21–3.02) | 0.736 | 0.80 (0.58–1.09) | 0.152 |
| PD-1 rs36084323 | AG vs. GG | AA vs. GG | AG+AA vs. GG | AA vs. AG+GG | A vs. G | ||||||
| Asian | 6 | 0.95 (0.71–1.25) | 0.691 | 1.05 (0.75–1.47) | 0.769 | 0.86 (0.61–1.23) | 0.412 | 1.05 (0.82–1.33) | 0.715 | 0.86 (0.67–1.12) | 0.259 |
| Population-based | 5 | 0.78 (0.50–1.21) | 0.268 | 0.88 (0.47–1.63) | 0.674 | 0.71 (0.42–1.22) | 0.219 | 0.94 (0.61–1.45) | 0.767 | 0.74 (0.49–1.12) | 0.152 |
| Hospital–based | 2 | 1.13 (0.97–1.32) | 0.127 | 1.26 (1.00–1.59) | 0.052 | 1.17 (1.01–1.35) | 0.042 | 1.93 (0.87–1.64) | 0.277 | 1.12 (1.00–1.26) | 0.05 |
| PD-1 rs10204525 | AG vs. AA | GG vs. AA | AG+GG vs. AA | GG vs. AG+AA | G vs. A | ||||||
| Gastrointestinal cancer | 5 | 0.90 (0.76–1.07) | 0.227 | 0.63 (0.45–1.04) | 0.078 | 0.86 (0.70–1.04) | 0.121 | 0.72 (0.48–1.06) | 0.096 | 0.85 (0.71–1.02) | 0.077 |
| Population-based | 3 | 0.85 (0.58–1.23) | 0.382 | 0.60 (0.28–1.32) | 0.203 | 0.80 (0.52–1.32) | 0.312 | 0.65 (0.35–1.23) | 0.186 | 0.80 (0.55–1.17) | 0.246 |
| Hospital-based | 3 | 0.99 (0.88–1.22) | 0.908 | 0.90 (0.63–1.29) | 0.568 | 0.99 (0.88–1.11) | 0.831 | 0.89 (0.60–1.32) | 0.560 | 0.99 (0.90–1.08) | 0.767 |
| PD-L1 rs4143815 | CG vs. GG | CC vs. GG | CG+CC vs. GG | CC vs. CG+GG | C vs. G | ||||||
| Gastrointestinal cancer | 6 | 0.68 (0.48–0.97) | 0.032 | 0.59 (0.37–0.96) | 0.033 | 0.64 (0.43–0.95) | 0.028 | 0.77 (0.58–1.02) | 0.064 | 0.76 (0.59–0.98) | 0.034 |
| Hospital-based | 6 | 0.71 (0.48–1.05) | 0.087 | 0.60 (0.36–1.00) | 0.051 | 0.67 (0.44–1.02) | 0.059 | 0.75 (0.58–0.97) | 0.030 | 0.76 (0.58–0.99) | 0.043 |
| Population-based | 2 | 0.89 (0.68–1.18) | 0.414 | 0.68 (0.29–1.59) | 0.378 | 0.82 (0.55–1.23) | 0.332 | 0.76 (0.36–1.59) | 0.460 | 0.83 (0.53–1.30) | 0.413 |
| PD-L1 rs2890658 | AC vs. AA | CC vs. AA | AC+CC vs. AA | CC vs. AC+AA | C vs. A | ||||||
| Lung cancer | 3 | 1.74 (1.37–2.19) | 0.000 | 2.48 (0.92–6.69) | 0.072 | 1.77 (1.41–2.23) | 0.000 | 2.29 (0.85–6.16) | 0.101 | 1.72 (1.39–2.13) | 0.000 |
| Gastrointestinal cancer | 2 | 4.34 (0.13–148.07) | 0.415 | 4.43 (0.17–112.70) | 0.368 | 0.76 (0.53–1.10) | 0.141 | 0.84 (0.66–1.08) | 0.179 | 0.84 (0.69–1.01) | 0.070 |
| Hospital-based | 3 | 1.42 (0.72–2.96) | 0.317 | 1.61 (0.52–4.98) | 0.409 | 1.45 (0.72–2.92) | 0.296 | 1.45 (0.57–3.73) | 0.439 | 1.46 (0.75–2.82) | 0.266 |
| Population-based | 2 | 6.30 (0.39–103.18) | 0.197 | 6.85 (0.60–78.36) | 0.122 | 1.23 (0.67–2.26) | 0.503 | 0.90 (0.56–1.37) | 0.636 | 1.13 (0.65–1.97) | 0.661 |
© 2019 by the authors. Licensee MDPI, Basel, Switzerland. This article is an open access article distributed under the terms and conditions of the Creative Commons Attribution (CC BY) license (http://creativecommons.org/licenses/by/4.0/).
Share and Cite
Hashemi, M.; Karami, S.; Sarabandi, S.; Moazeni-Roodi, A.; Małecki, A.; Ghavami, S.; Wiechec, E. Association between PD-1 and PD-L1 Polymorphisms and the Risk of Cancer: A Meta-Analysis of Case-Control Studies. Cancers 2019, 11, 1150. https://doi.org/10.3390/cancers11081150
Hashemi M, Karami S, Sarabandi S, Moazeni-Roodi A, Małecki A, Ghavami S, Wiechec E. Association between PD-1 and PD-L1 Polymorphisms and the Risk of Cancer: A Meta-Analysis of Case-Control Studies. Cancers. 2019; 11(8):1150. https://doi.org/10.3390/cancers11081150
Chicago/Turabian StyleHashemi, Mohammad, Shima Karami, Sahel Sarabandi, Abdolkarim Moazeni-Roodi, Andrzej Małecki, Saeid Ghavami, and Emilia Wiechec. 2019. "Association between PD-1 and PD-L1 Polymorphisms and the Risk of Cancer: A Meta-Analysis of Case-Control Studies" Cancers 11, no. 8: 1150. https://doi.org/10.3390/cancers11081150
APA StyleHashemi, M., Karami, S., Sarabandi, S., Moazeni-Roodi, A., Małecki, A., Ghavami, S., & Wiechec, E. (2019). Association between PD-1 and PD-L1 Polymorphisms and the Risk of Cancer: A Meta-Analysis of Case-Control Studies. Cancers, 11(8), 1150. https://doi.org/10.3390/cancers11081150