CD56 Homodimerization and Participation in Anti-Tumor Immune Effector Cell Functioning: A Role for Interleukin-15

 , , , and
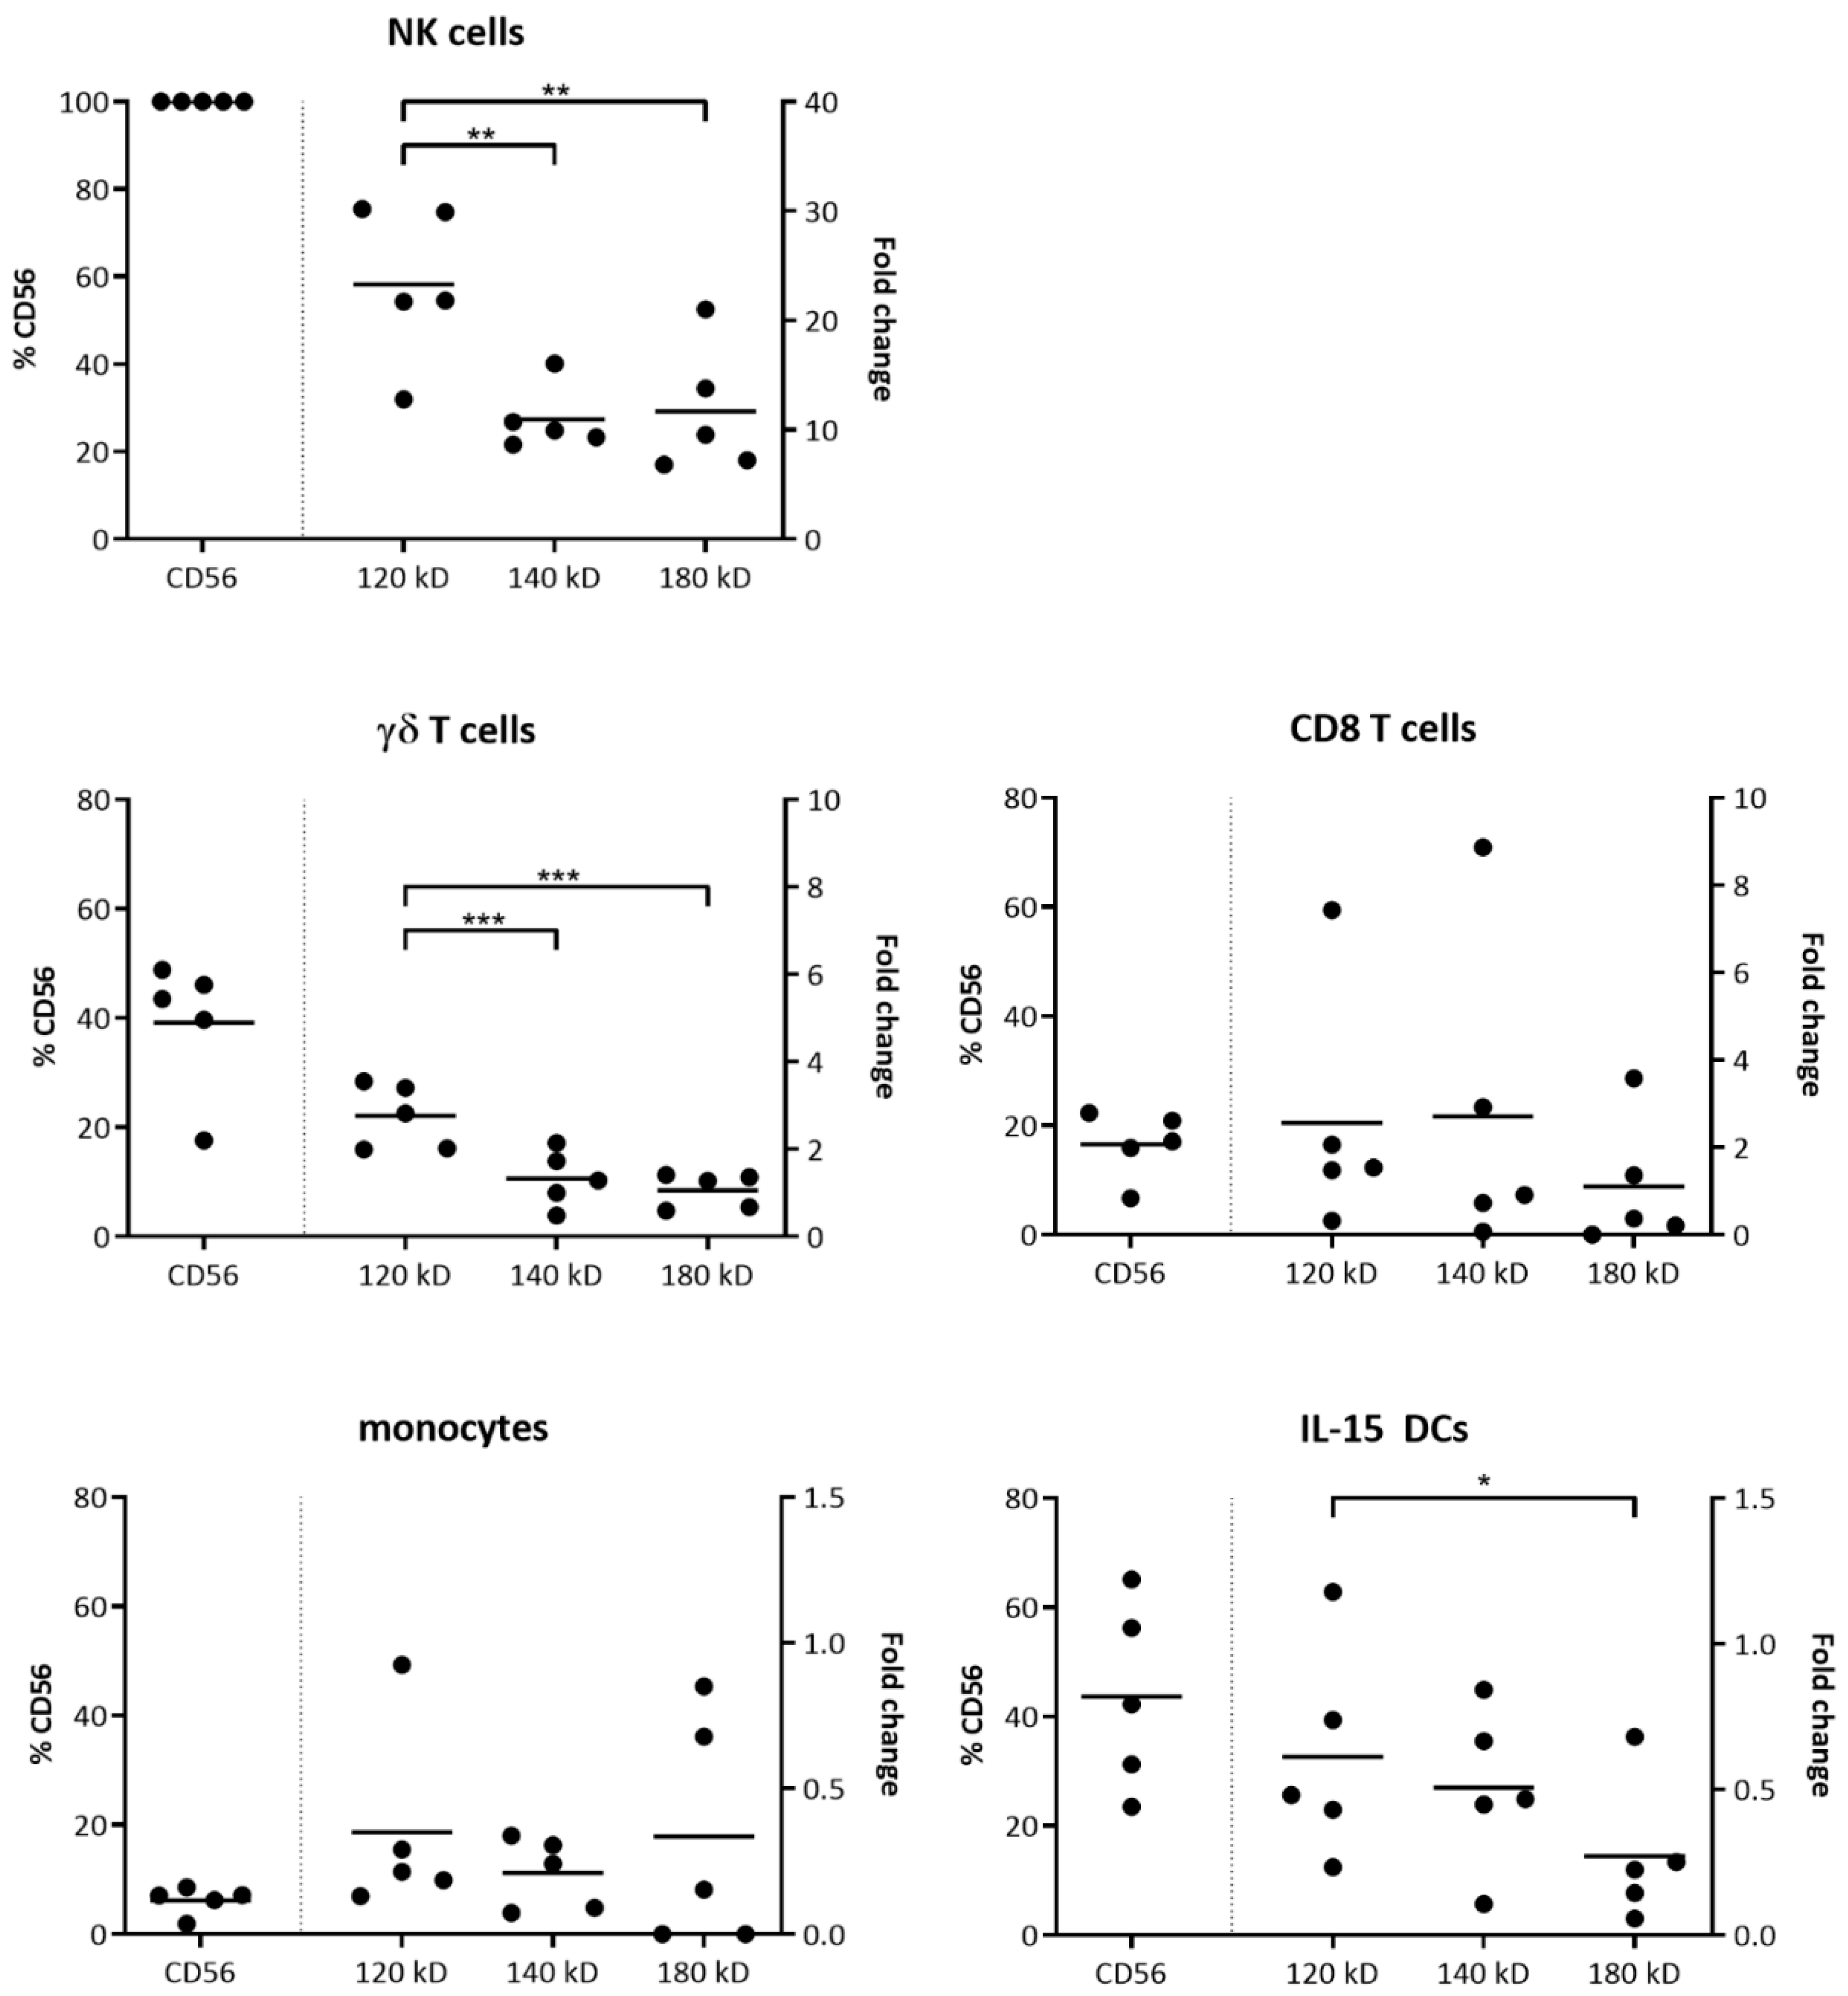
Abstract
:1. Introduction
2. Results
2.1. CD56 Isoform Expression in Immune Cells
2.2. Involvement of CD56 in Immune Effector Cell Activation and CD56+ Tumor Cell Killing
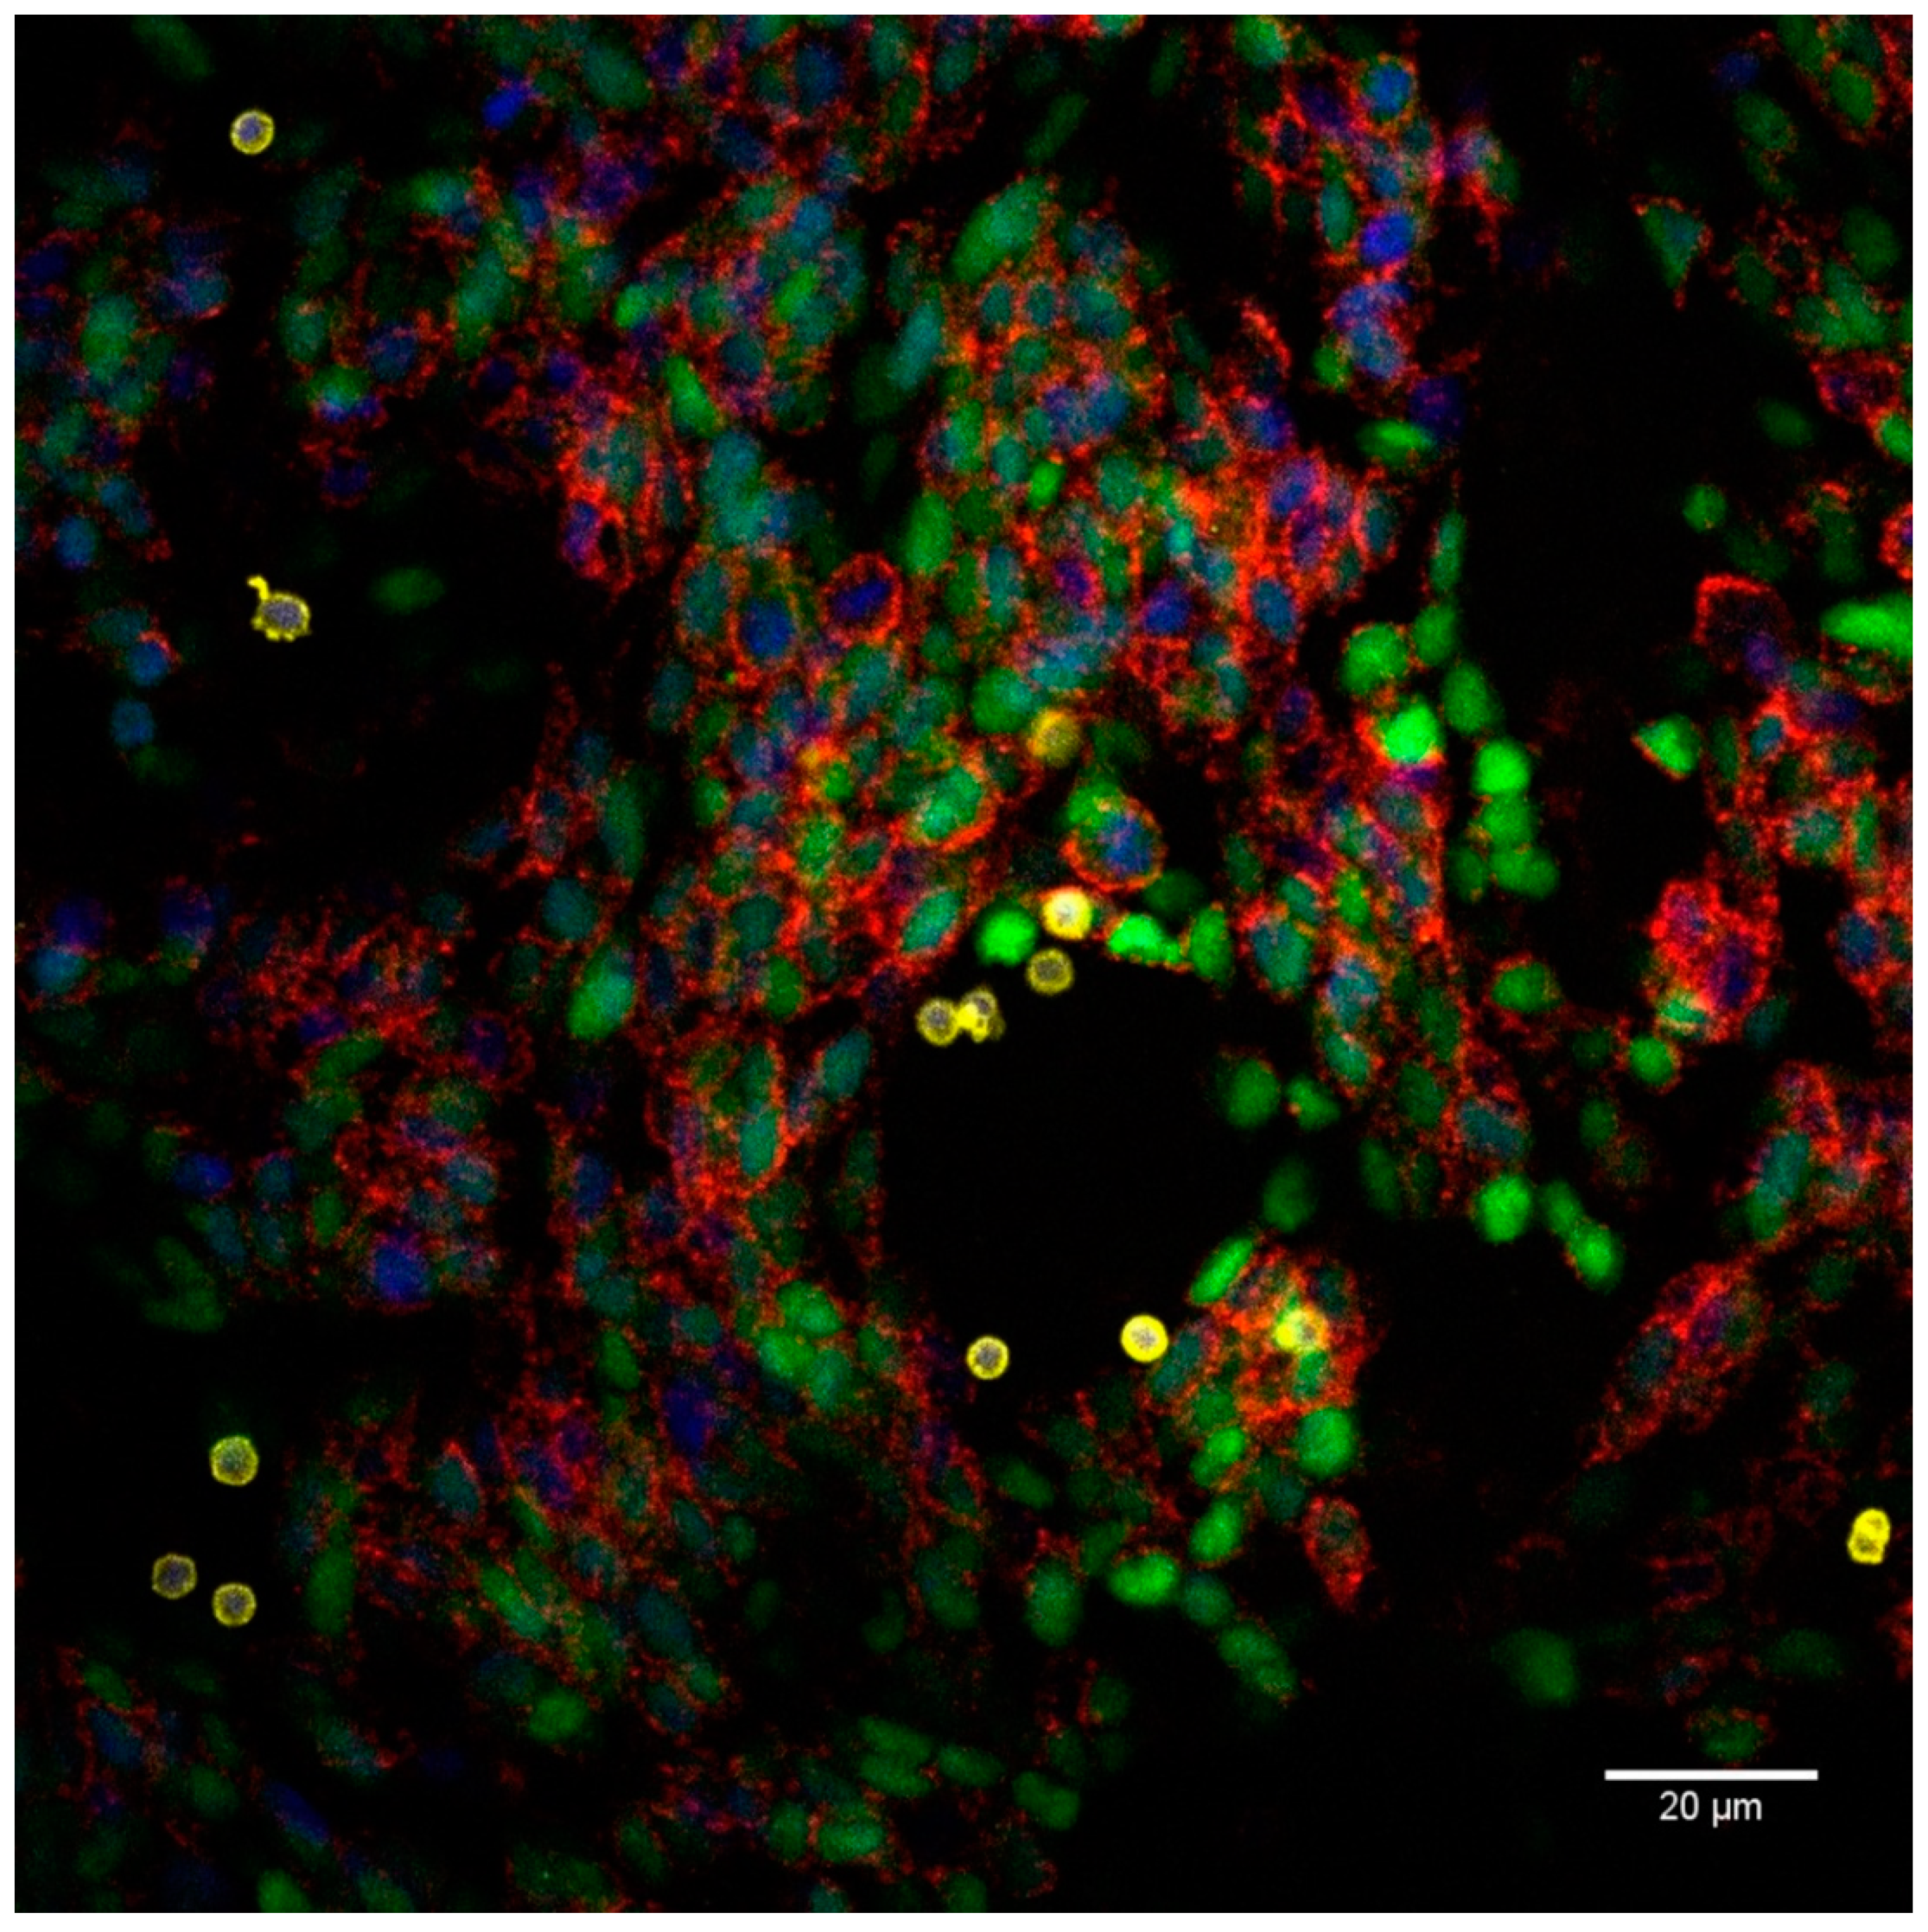
2.3. Proximity Ligation Assay Reveals Homophilic CD56 Binding between CD56-Expressing Immune and Tumor Cells
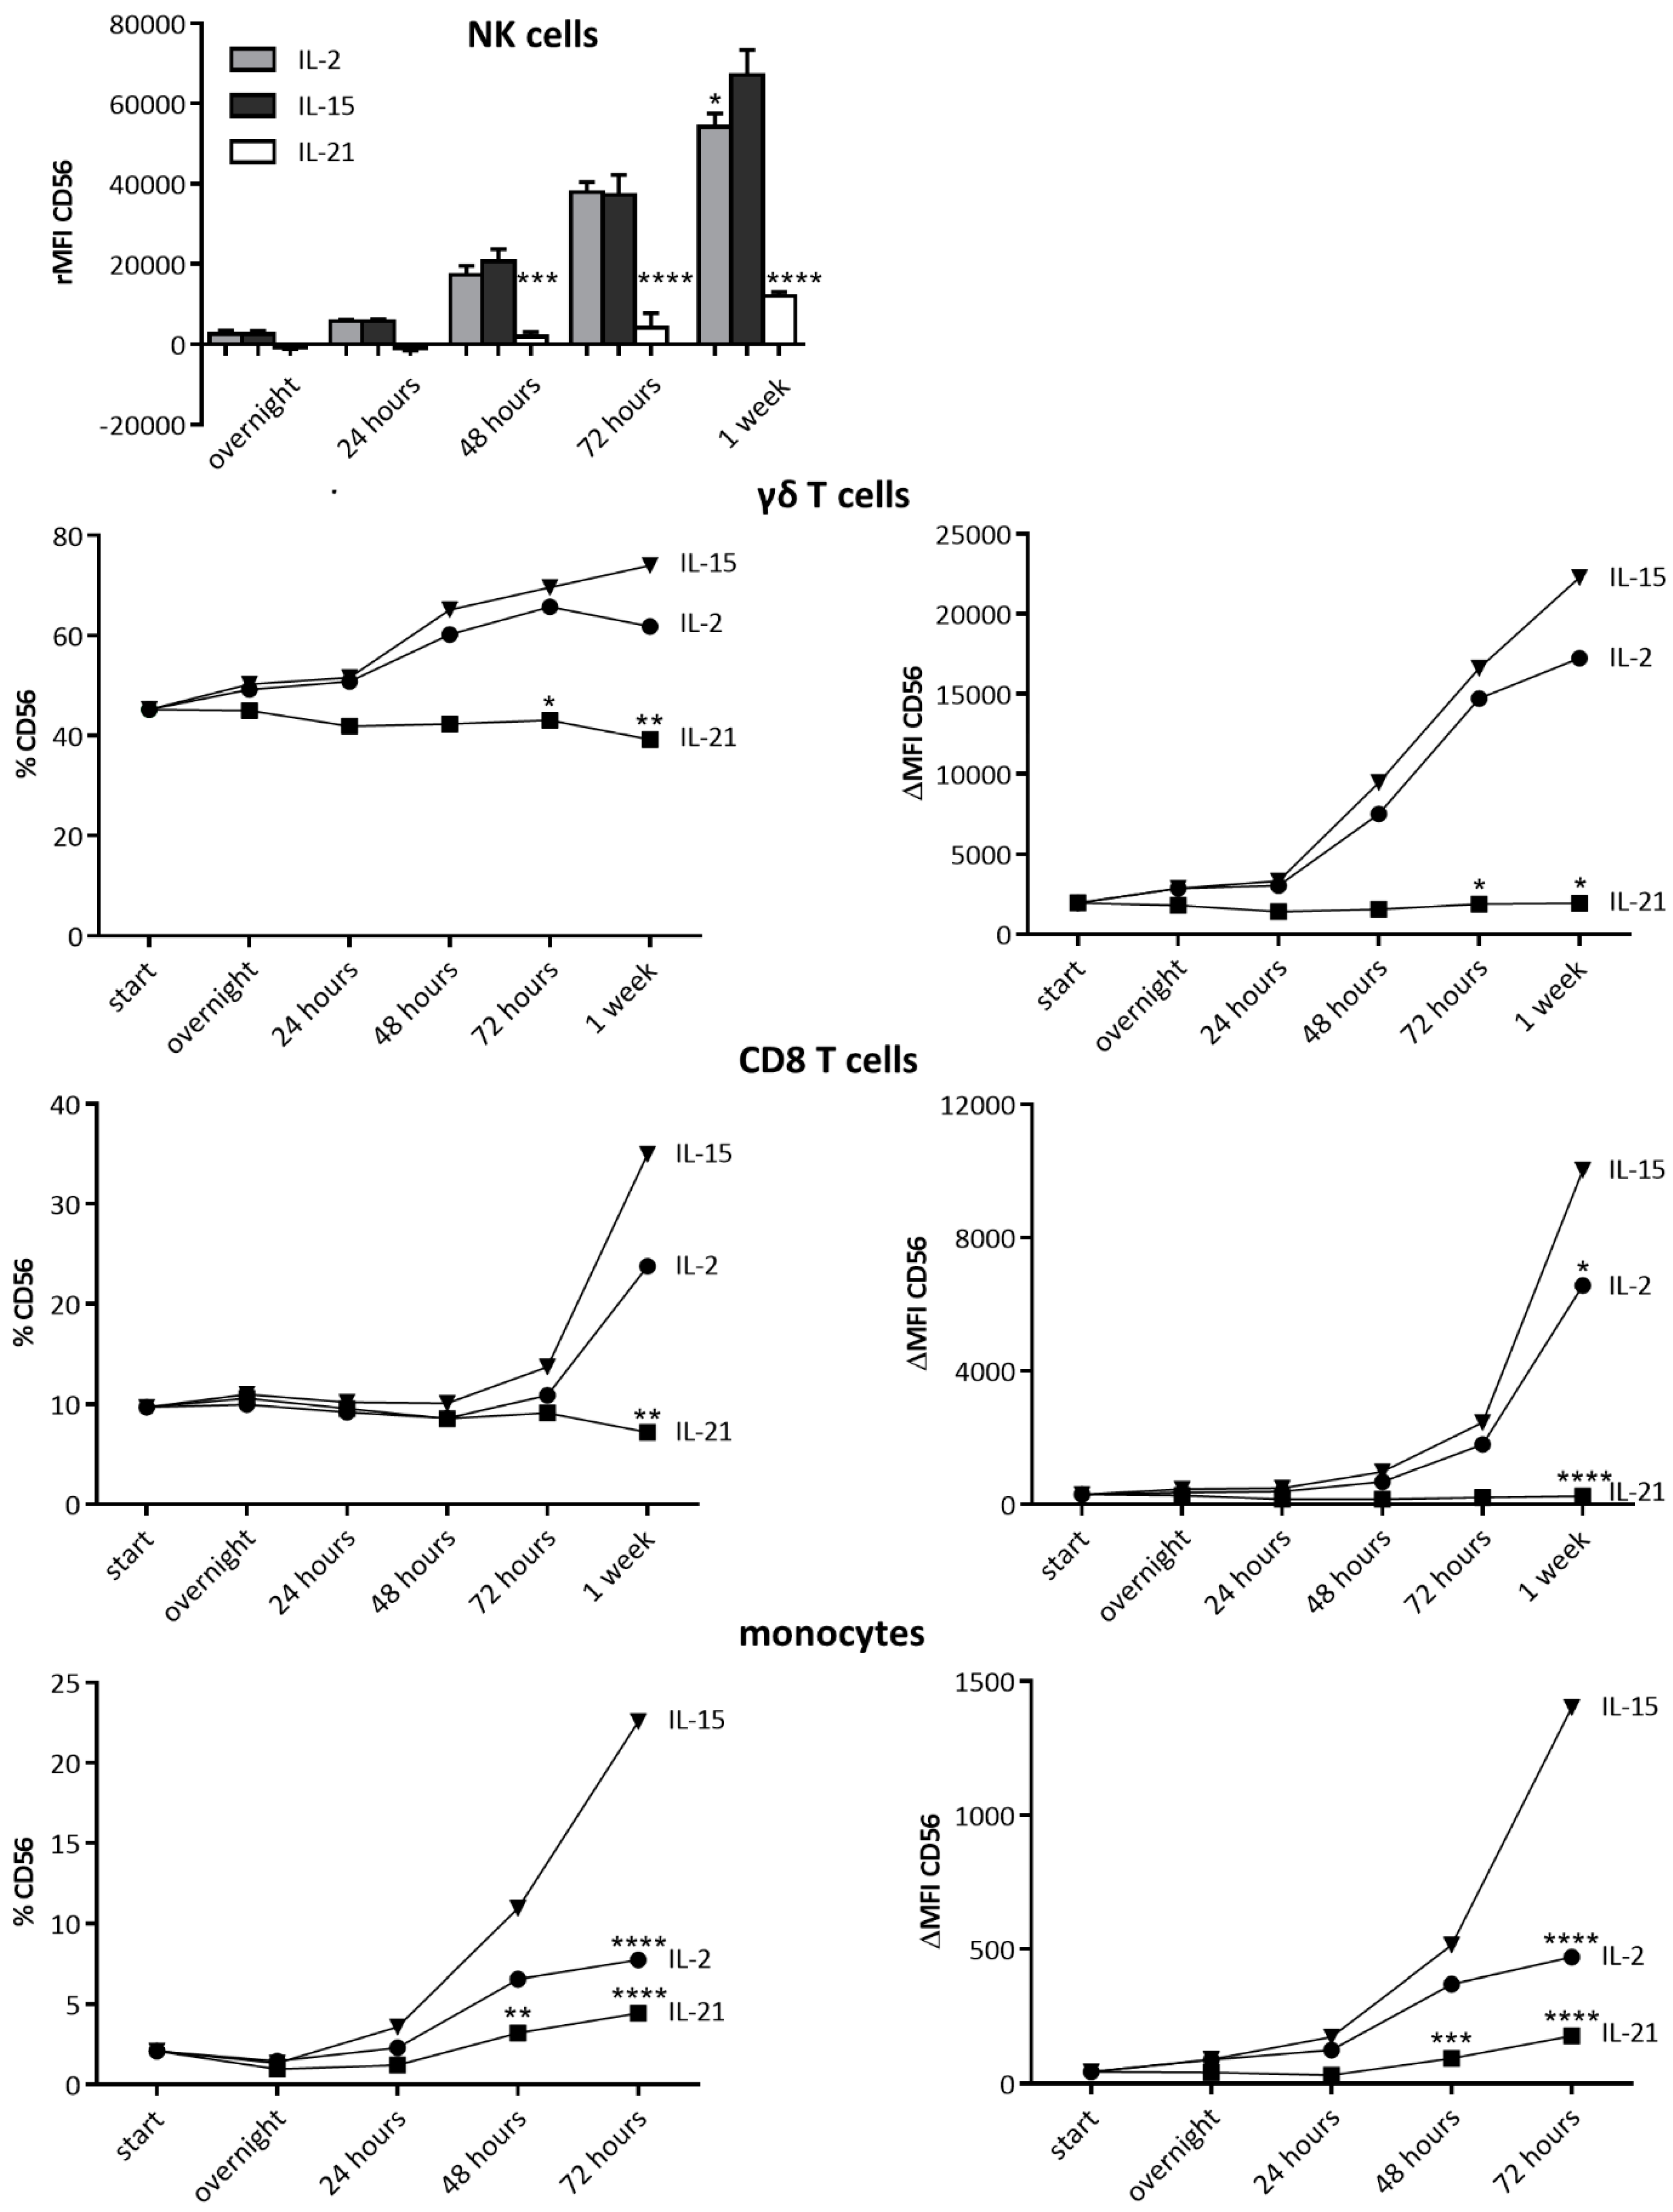
2.4. IL-15 Stimulation Directly Leads to CD56 Expression
2.5. Blocking of the Different IL-15 Signaling Pathways
2.6. IL-15 Shares Its CD56-Boosting Effect with IL-2
3. Discussion
4. Materials and Methods
4.1. Cell Lines and Primary Cells
4.2. IL-15 DC Culture
4.3. γδ T Cell Expansion Protocol
4.4. RNA Extraction and Real-Time Polymerase Chain Reaction
4.5. Cytotoxicity Assay
4.6. Blocking of the Distinct IL-15 Signaling Pathways
4.7. Proximity Ligation Assay
4.8. Statistical Analysis
Supplementary Materials
Author Contributions
Funding
Acknowledgments
Conflicts of Interest
References
- Cunningham, B.A.; Hemperly, J.J.; Murray, B.A.; Prediger, E.A.; Brackenbury, R.; Edelman, G.M. Neural cell adhesion molecule: Structure, immunoglobulin-like domains, cell surface modulation, and alternative RNA splicing. Science 1987, 236, 799–806. [Google Scholar] [CrossRef] [PubMed]
- Ditlevsen, D.K.; Povlsen, G.K.; Berezin, V.; Bock, E. NCAM-induced intracellular signaling revisited. J. Neurosci. Res. 2008, 86, 727–743. [Google Scholar] [CrossRef] [PubMed]
- Van Acker, H.H.; Capsomidis, A.; Smits, E.L.; Van Tendeloo, V.F. CD56 in the immune system: More than a marker for cytotoxicity? Front. Immunol. 2017, 8, 892. [Google Scholar] [CrossRef] [PubMed]
- Chou, C.; Li, M.O. Tissue-resident lymphocytes across innate and adaptive lineages. Front. Immunol. 2018, 9, 2104. [Google Scholar] [CrossRef] [PubMed]
- Sangiolo, D.; Martinuzzi, E.; Todorovic, M.; Vitaggio, K.; Vallario, A.; Jordaney, N.; Carnevale-Schianca, F.; Capaldi, A.; Geuna, M.; Casorzo, L.; et al. Alloreactivity and anti-tumor activity segregate within two distinct subsets of cytokine-induced killer (CIK) cells: Implications for their infusion across major HLA barriers. Int. Immunol. 2008, 20, 841–848. [Google Scholar] [CrossRef] [PubMed]
- Junge, A.; Bacher, U.; Mueller, B.U.; Keller, P.; Solenthaler, M.; Pabst, T. Adverse outcome of AML with aberrant CD16 and CD56 NK cell marker expression. Hematol. Oncol. 2018. [Google Scholar] [CrossRef] [PubMed]
- Garcia-Cuesta, E.M.; Esteso, G.; Ashiru, O.; Lopez-Cobo, S.; Alvarez-Maestro, M.; Linares, A.; Ho, M.M.; Martinez-Pineiro, L.; Hugh, T.R.; Vales-Gomez, M. Characterization of a human anti-tumoral NK cell population expanded after BCG treatment of leukocytes. Oncoimmunology 2017, 6, e1293212. [Google Scholar] [CrossRef] [PubMed] [Green Version]
- Pan, Y.; Wang, H.; Tao, Q.; Zhang, C.; Yang, D.; Qin, H.; Xiong, S.; Tao, L.; Wu, F.; Zhang, J.; et al. Absence of both CD56 and CD117 expression on malignant plasma cells is related with a poor prognosis in patients with newly diagnosed multiple myeloma. Leuk. Res. 2016, 40, 77–82. [Google Scholar] [CrossRef] [PubMed]
- He, H.; Luthringer, D.J.; Hui, P.; Lau, S.K.; Weiss, L.M.; Chu, P.G. Expression of CD56 and WT1 in ovarian stroma and ovarian stromal tumors. Am. J. Surg. Pathol. 2008, 32, 884–890. [Google Scholar] [CrossRef]
- Schurch, C.M. Therapeutic Antibodies for Myeloid Neoplasms-Current Developments and Future Directions. Front. Oncol. 2018, 8, 152. [Google Scholar] [CrossRef]
- Messlinger, H.; Sebald, H.; Heger, L.; Dudziak, D.; Bogdan, C.; Schleicher, U. Monocyte-derived signals activate human natural killer cells in response to leishmania parasites. Front. Immunol. 2018, 9, 24. [Google Scholar] [CrossRef] [PubMed]
- Van Acker, H.H.; Campillo-Davo, D.; Roex, G.; Versteven, M.; Smits, E.L.; Van Tendeloo, V.F. The role of the common gamma-chain family cytokines in gammadelta T cell-based anti-cancer immunotherapy. Cytokine Growth Factor Rev. 2018. [Google Scholar] [CrossRef] [PubMed]
- Weng, J.; Moriarty, K.E.; Baio, F.E.; Chu, F.; Kim, S.D.; He, J.; Jie, Z.; Xie, X.; Ma, W.; Qian, J.; et al. IL-15 enhances the antitumor effect of human antigen-specific CD8(+) T cells by cellular senescence delay. Oncoimmunology 2016, 5, e1237327. [Google Scholar] [CrossRef] [PubMed]
- Van Acker, H.H.; Anguille, S.; Van Tendeloo, V.F.; Lion, E. Empowering gamma delta T cells with antitumor immunity by dendritic cell-based immunotherapy. Oncoimmunology 2015, 4, e1021538. [Google Scholar] [CrossRef] [PubMed] [Green Version]
- Conlon, K.C.; Lugli, E.; Welles, H.C.; Rosenberg, S.A.; Fojo, A.T.; Morris, J.C.; Fleisher, T.A.; Dubois, S.P.; Perera, L.P.; Stewart, D.M.; et al. Redistribution, hyperproliferation, activation of natural killer cells and CD8 T cells, and cytokine production during first-in-human clinical trial of recombinant human interleukin-15 in patients with cancer. J. Clin. Oncol. 2015, 33, 74–82. [Google Scholar] [CrossRef] [PubMed]
- Romee, R.; Cooley, S.; Berrien-Elliott, M.M.; Westervelt, P.; Verneris, M.R.; Wagner, J.E.; Weisdorf, D.J.; Blazar, B.R.; Ustun, C.; DeFor, T.E.; et al. First-in-human phase 1 clinical study of the IL-15 superagonist complex ALT-803 to treat relapse after transplantation. Blood 2018, 131, 2515–2527. [Google Scholar] [CrossRef] [PubMed]
- Anguille, S.; Lion, E.; Tel, J.; de Vries, I.J.; Coudere, K.; Fromm, P.D.; Van Tendeloo, V.F.; Smits, E.L.; Berneman, Z.N. Interleukin-15-induced CD56(+) myeloid dendritic cells combine potent tumor antigen presentation with direct tumoricidal potential. PLoS ONE 2012, 7, e51851. [Google Scholar] [CrossRef] [PubMed]
- Van Acker, H.H.; Anguille, S.; De Reu, H.; Berneman, Z.N.; Smits, E.L.; Van Tendeloo, V.F. Interleukin-15-cultured dendritic cells enhance anti-tumor gamma delta t cell functions through il-15 secretion. Front. Immunol. 2018, 9, 658. [Google Scholar] [CrossRef] [PubMed]
- Anguille, S.; Van Acker, H.H.; Van den Bergh, J.; Willemen, Y.; Goossens, H.; Van Tendeloo, V.F.; Smits, E.L.; Berneman, Z.N.; Lion, E. Interleukin-15 dendritic cells harness NK cell cytotoxic effector function in a contact- and IL-15-dependent manner. PLoS ONE 2015, 10, e0123340. [Google Scholar] [CrossRef] [PubMed]
- Van Acker, H.H.; Anguille, S.; Willemen, Y.; Van den Bergh, J.M.; Berneman, Z.N.; Lion, E.; Smits, E.L.; Van Tendeloo, V.F. Interleukin-15 enhances the proliferation, stimulatory phenotype, and antitumor effector functions of human gamma delta T cells. J. Hematol. Oncol. 2016, 9, 101. [Google Scholar] [CrossRef]
- Poonia, B.; Pauza, C.D. Levels of CD56+TIM-3- effector CD8 T cells distinguish HIV natural virus suppressors from patients receiving antiretroviral therapy. PLoS ONE 2014, 9, e88884. [Google Scholar] [CrossRef] [PubMed]
- Tao, Q.; Chen, T.; Tao, L.; Wang, H.; Pan, Y.; Xiong, S.; Zhai, Z. IL-15 improves the cytotoxicity of cytokine-induced killer cells against leukemia cells by upregulating CD3+CD56+ cells and downregulating regulatory T cells as well as IL-35. J. Immunother. 2013, 36, 462–467. [Google Scholar] [CrossRef] [PubMed]
- Gruenbacher, G.; Nussbaumer, O.; Gander, H.; Steiner, B.; Leonhartsberger, N.; Thurnher, M. Stress-related and homeostatic cytokines regulate Vgamma9Vdelta2 T-cell surveillance of mevalonate metabolism. Oncoimmunology 2014, 3, e953410. [Google Scholar] [CrossRef] [PubMed]
- Correia, M.P.; Costa, A.V.; Uhrberg, M.; Cardoso, E.M.; Arosa, F.A. IL-15 induces CD8+ T cells to acquire functional NK receptors capable of modulating cytotoxicity and cytokine secretion. Immunobiology 2011, 216, 604–612. [Google Scholar] [CrossRef] [PubMed]
- Mishra, A.; Sullivan, L.; Caligiuri, M.A. Molecular pathways: Interleukin-15 signaling in health and in cancer. Clin. Cancer Res. Off. J. Am. Assoc. Cancer Res. 2014, 20, 2044–2050. [Google Scholar] [CrossRef] [PubMed]
- Lanier, L.L.; Chang, C.; Azuma, M.; Ruitenberg, J.J.; Hemperly, J.J.; Phillips, J.H. Molecular and functional analysis of human natural killer cell-associated neural cell adhesion molecule (N-CAM/CD56). J. Immunol. 1991, 146, 4421–4426. [Google Scholar] [PubMed]
- Lanier, L.L.; Testi, R.; Bindl, J.; Phillips, J.H. Identity of Leu-19 (CD56) leukocyte differentiation antigen and neural cell adhesion molecule. J. Exp. Med. 1989, 169, 2233–2238. [Google Scholar] [CrossRef] [PubMed]
- Valgardsdottir, R.; Capitanio, C.; Texido, G.; Pende, D.; Cantoni, C.; Pesenti, E.; Rambaldi, A.; Golay, J.; Introna, M. Direct involvement of CD56 in cytokine-induced killer-mediated lysis of CD56+ hematopoietic target cells. Exp. Hematol. 2014, 42. [Google Scholar] [CrossRef] [PubMed]
- Gattenlohner, S.; Stuhmer, T.; Leich, E.; Reinhard, M.; Etschmann, B.; Volker, H.U.; Rosenwald, A.; Serfling, E.; Bargou, R.C.; Ertl, G.; et al. Specific detection of CD56 (NCAM) isoforms for the identification of aggressive malignant neoplasms with progressive development. Am. J. Pathol. 2009, 174, 1160–1171. [Google Scholar] [CrossRef]
- Cavallaro, U.; Christofori, G. Cell adhesion and signalling by cadherins and Ig-CAMs in cancer. Nat. Rev. Cancer 2004, 4, 118–132. [Google Scholar] [CrossRef]
- Tur, M.K.; Etschmann, B.; Benz, A.; Leich, E.; Waller, C.; Schuh, K.; Rosenwald, A.; Ertl, G.; Kienitz, A.; Haaf, A.T.; et al. The 140-kD isoform of CD56 (NCAM1) directs the molecular pathogenesis of ischemic cardiomyopathy. Am. J. Pathol. 2013, 182, 1205–1218. [Google Scholar] [CrossRef] [PubMed]
- Schor, I.E.; Fiszbein, A.; Petrillo, E.; Kornblihtt, A.R. Intragenic epigenetic changes modulate NCAM alternative splicing in neuronal differentiation. EMBO J. 2013, 32, 2264–2274. [Google Scholar] [CrossRef] [PubMed] [Green Version]
- Paulick, M.G.; Bertozzi, C.R. The glycosylphosphatidylinositol anchor: A complex membrane-anchoring structure for proteins. Biochemistry 2008, 47, 6991–7000. [Google Scholar] [CrossRef] [PubMed]
- Low, M.G.; Saltiel, A.R. Structural and functional roles of glycosyl-phosphatidylinositol in membranes. Science 1988, 239, 268–275. [Google Scholar] [CrossRef] [PubMed]
- Jarahian, M.; Watzl, C.; Issa, Y.; Altevogt, P.; Momburg, F. Blockade of natural killer cell-mediated lysis by NCAM140 expressed on tumor cells. Int. J. Cancer 2007, 120, 2625–2634. [Google Scholar] [CrossRef]
- Takasaki, S.; Hayashida, K.; Morita, C.; Ishibashi, H.; Niho, Y. CD56 directly interacts in the process of NCAM-positive target cell-killing by NK cells. Cell Biol. Int. 2000, 24, 101–108. [Google Scholar] [CrossRef]
- Mace, E.M.; Gunesch, J.T.; Dixon, A.; Orange, J.S. Human NK cell development requires CD56-mediated motility and formation of the developmental synapse. Nat. Commun. 2016, 7, 12171. [Google Scholar] [CrossRef] [PubMed] [Green Version]
- Ziegler, S.; Weiss, E.; Schmitt, A.L.; Schlegel, J.; Burgert, A.; Terpitz, U.; Sauer, M.; Moretta, L.; Sivori, S.; Leonhardt, I.; et al. CD56 Is a pathogen recognition receptor on human natural killer Cells. Sci. Rep. 2017, 7, 6138. [Google Scholar] [CrossRef]
- Anguille, S.; Smits, E.L.; Cools, N.; Goossens, H.; Berneman, Z.N.; Van Tendeloo, V.F. Short-term cultured, interleukin-15 differentiated dendritic cells have potent immunostimulatory properties. J. Transl. Med. 2009, 7, 109. [Google Scholar] [CrossRef]
- Berg, R.E.; Forman, J. The role of CD8 T cells in innate immunity and in antigen non-specific protection. Curr. Opin. Immunol. 2006, 18, 338–343. [Google Scholar] [CrossRef]
- White, J.T.; Cross, E.W.; Kedl, R.M. Antigen-inexperienced memory CD8(+) T cells: Where they come from and why we need them. Nat. Rev. Immunol. 2017, 17, 391–400. [Google Scholar] [CrossRef] [PubMed]
- Ruiz, A.L.; Soudja, S.M.; Deceneux, C.; Lauvau, G.; Marie, J.C. NK1.1+ CD8+ T cells escape TGF-beta control and contribute to early microbial pathogen response. Nat. Commun. 2014, 5, 5150. [Google Scholar] [CrossRef] [PubMed]
- Crosby, E.J.; Goldschmidt, M.H.; Wherry, E.J.; Scott, P. Engagement of NKG2D on bystander memory CD8 T cells promotes increased immunopathology following Leishmania major infection. PLoS Pathog. 2014, 10, e1003970. [Google Scholar] [CrossRef] [PubMed]
- Sosinowski, T.; White, J.T.; Cross, E.W.; Haluszczak, C.; Marrack, P.; Gapin, L.; Kedl, R.M. CD8alpha+ dendritic cell trans presentation of IL-15 to naive CD8+ T cells produces antigen-inexperienced T cells in the periphery with memory phenotype and function. J. Immunol. 2013, 190, 1936–1947. [Google Scholar] [CrossRef] [PubMed]
- Goplen, N.P.; Saxena, V.; Knudson, K.M.; Schrum, A.G.; Gil, D.; Daniels, M.A.; Zamoyska, R.; Teixeiro, E. IL-12 Signals through the TCR To Support CD8 Innate Immune Responses. J. Immunol. 2016, 197, 2434–2443. [Google Scholar] [CrossRef] [PubMed] [Green Version]
- Bosmuller, H.C.; Wagner, P.; Pham, D.L.; Fischer, A.K.; Greif, K.; Beschorner, C.; Sipos, B.; Fend, F.; Staebler, A. CD56 (Neural Cell Adhesion Molecule) expression in ovarian carcinomas: Association with high-grade and advanced stage but not with neuroendocrine differentiation. Int. J. Gynecol. Cancer 2017, 27, 239–245. [Google Scholar] [CrossRef] [PubMed]
- Cirovic, S.; Vjestica, J.; Mueller, C.A.; Tatic, S.; Vasiljevic, J.; Milenkovic, S.; Mueller, G.A.; Markovic-Lipkovski, J. NCAM and FGFR1 coexpression and colocalization in renal tumors. Int. J. Clin. Exp. Pathol. 2014, 7, 1402–1414. [Google Scholar]
- Whiteman, K.R.; Johnson, H.A.; Mayo, M.F.; Audette, C.A.; Carrigan, C.N.; LaBelle, A.; Zukerberg, L.; Lambert, J.M.; Lutz, R.J. Lorvotuzumab mertansine, a CD56-targeting antibody-drug conjugate with potent antitumor activity against small cell lung cancer in human xenograft models. MAbs 2014, 6, 556–566. [Google Scholar] [CrossRef] [Green Version]
- Weledji, E.P.; Assob, J.C. The ubiquitous neural cell adhesion molecule (N-CAM). Ann. Med. Surg. 2014, 3, 77–81. [Google Scholar] [CrossRef]
- Zaidi, S.Z.; Motabi, I.H.; Al-Shanqeeti, A. CD56 and RUNX1 isoforms in AML prognosis and their therapeutic potential. Hematol. Oncol. Stem Cell Ther. 2016, 9, 129–130. [Google Scholar] [CrossRef] [Green Version]
- Yang, A.H.; Chen, J.Y.; Lee, C.H.; Chen, J.Y. Expression of NCAM and OCIAD1 in well-differentiated thyroid carcinoma: Correlation with the risk of distant metastasis. J. Clin. Pathol. 2012, 65, 206–212. [Google Scholar] [CrossRef] [PubMed]
- Kurokawa, M.; Nabeshima, K.; Akiyama, Y.; Maeda, S.; Nishida, T.; Nakayama, F.; Amano, M.; Ogata, K.; Setoyama, M. CD56: A useful marker for diagnosing Merkel cell carcinoma. J. Dermatol. Sci. 2003, 31, 219–224. [Google Scholar] [CrossRef]
- Wang, L.; Wang, Z.; Xia, Z.J.; Lu, Y.; Huang, H.Q.; Zhang, Y.J. CD56-negative extranodal NK/T cell lymphoma should be regarded as a distinct subtype with poor prognosis. Tumour Biol. 2015, 36, 7717–7723. [Google Scholar] [CrossRef] [PubMed]
- Kulahin, N.; Grunnet, L.G.; Lundh, M.; Christensen, D.P.; Jorgensen, R.; Heding, A.; Billestrup, N.; Berezin, V.; Bock, E.; Mandrup-Poulsen, T. Direct demonstration of NCAM cis-dimerization and inhibitory effect of palmitoylation using the BRET2 technique. FEBS Lett. 2011, 585, 58–64. [Google Scholar] [CrossRef] [PubMed]
- Soroka, V.; Kasper, C.; Poulsen, F.M. Structural biology of NCAM. Adv. Exp. Med. Biol. 2010, 663, 3–22. [Google Scholar] [CrossRef]
- Boyiadzis, M.; Memon, S.; Carson, J.; Allen, K.; Szczepanski, M.J.; Vance, B.A.; Dean, R.; Bishop, M.R.; Gress, R.E.; Hakim, F.T. Up-regulation of NK cell activating receptors following allogeneic hematopoietic stem cell transplantation under a lymphodepleting reduced intensity regimen is associated with elevated IL-15 levels. Biol. Blood Marrow Transplant. 2008, 14, 290–300. [Google Scholar] [CrossRef] [PubMed]
- Wagner, J.A.; Rosario, M.; Romee, R.; Berrien-Elliott, M.M.; Schneider, S.E.; Leong, J.W.; Sullivan, R.P.; Jewell, B.A.; Becker-Hapak, M.; Schappe, T.; et al. CD56bright NK cells exhibit potent antitumor responses following IL-15 priming. J. Clin. Invest. 2017, 127, 4042–4058. [Google Scholar] [CrossRef] [Green Version]
- Tang, Q.; Grzywacz, B.; Wang, H.; Kataria, N.; Cao, Q.; Wagner, J.E.; Blazar, B.R.; Miller, J.S.; Verneris, M.R. Umbilical cord blood T cells express multiple natural cytotoxicity receptors after IL-15 stimulation, but only NKp30 is functional. J. Immunol. 2008, 181, 4507–4515. [Google Scholar] [CrossRef]
- Roothans, D.; Smits, E.; Lion, E.; Tel, J.; Anguille, S. CD56 marks human dendritic cell subsets with cytotoxic potential. Oncoimmunology 2013, 2, e23037. [Google Scholar] [CrossRef] [Green Version]
- Kelly-Rogers, J.; Madrigal-Estebas, L.; O’Connor, T.; Doherty, D.G. Activation-induced expression of CD56 by T cells is associated with a reprogramming of cytolytic activity and cytokine secretion profile in vitro. Hum. Immunol. 2006, 67, 863–873. [Google Scholar] [CrossRef]
- Van Acker, Z.P.; Van Raemdonck, G.A.; Logie, E.; Baggerman, G.; Vanden Berghe, W.; Ponsaerts, P.; Dewilde, S. Connecting the dots in the neuroglobin-protein interaction network of an unstressed and ferroptotic cell death neuroblastoma model. Cells 2019. under review. [Google Scholar]
- Van Acker, H.H.; Beretta, O.; Anguille, S.; Caluwe, L.; Papagna, A.; Van den Bergh, J.M.; Willemen, Y.; Goossens, H.; Berneman, Z.N.; Van Tendeloo, V.F.; et al. Desirable cytolytic immune effector cell recruitment by interleukin-15 dendritic cells. Oncotarget 2017, 8, 13652. [Google Scholar] [CrossRef] [PubMed]


© 2019 by the authors. Licensee MDPI, Basel, Switzerland. This article is an open access article distributed under the terms and conditions of the Creative Commons Attribution (CC BY) license (http://creativecommons.org/licenses/by/4.0/).
Share and Cite
Van Acker, H.H.; Van Acker, Z.P.; Versteven, M.; Ponsaerts, P.; Pende, D.; Berneman, Z.N.; Anguille, S.; Van Tendeloo, V.F.; Smits, E.L. CD56 Homodimerization and Participation in Anti-Tumor Immune Effector Cell Functioning: A Role for Interleukin-15. Cancers 2019, 11, 1029. https://doi.org/10.3390/cancers11071029
Van Acker HH, Van Acker ZP, Versteven M, Ponsaerts P, Pende D, Berneman ZN, Anguille S, Van Tendeloo VF, Smits EL. CD56 Homodimerization and Participation in Anti-Tumor Immune Effector Cell Functioning: A Role for Interleukin-15. Cancers. 2019; 11(7):1029. https://doi.org/10.3390/cancers11071029
Chicago/Turabian StyleVan Acker, Heleen H., Zoë P. Van Acker, Maarten Versteven, Peter Ponsaerts, Daniela Pende, Zwi N. Berneman, Sébastien Anguille, Viggo F. Van Tendeloo, and Evelien L. Smits. 2019. "CD56 Homodimerization and Participation in Anti-Tumor Immune Effector Cell Functioning: A Role for Interleukin-15" Cancers 11, no. 7: 1029. https://doi.org/10.3390/cancers11071029