Acute Tumor Transition Angle on Computed Tomography Predicts Chromosomal Instability Status of Primary Gastric Cancer: Radiogenomics Analysis from TCGA and Independent Validation

 , ,
, ,  and
and
Abstract
:1. Introduction
2. Results
2.1. Training Cohort and Imaging Predictors
2.2. Validation Cohort
2.3. Diagnostic Accuracy of Imaging Predictors
3. Discussion
4. Materials and Methods
4.1. Study Patients and Data Collection
4.2. Training Cohort
4.3. Imaging Traits Evaluation
4.4. Validation Cohort
4.5. Imaging Analysis
4.6. Histopathologic and Genomic Analysis
4.7. Statistical Analysis
5. Conclusions
Author Contributions
Funding
Conflicts of Interest
Abbreviations
| AUC | Areas under the receiver operating characteristics curve |
| CI | Confidence interval |
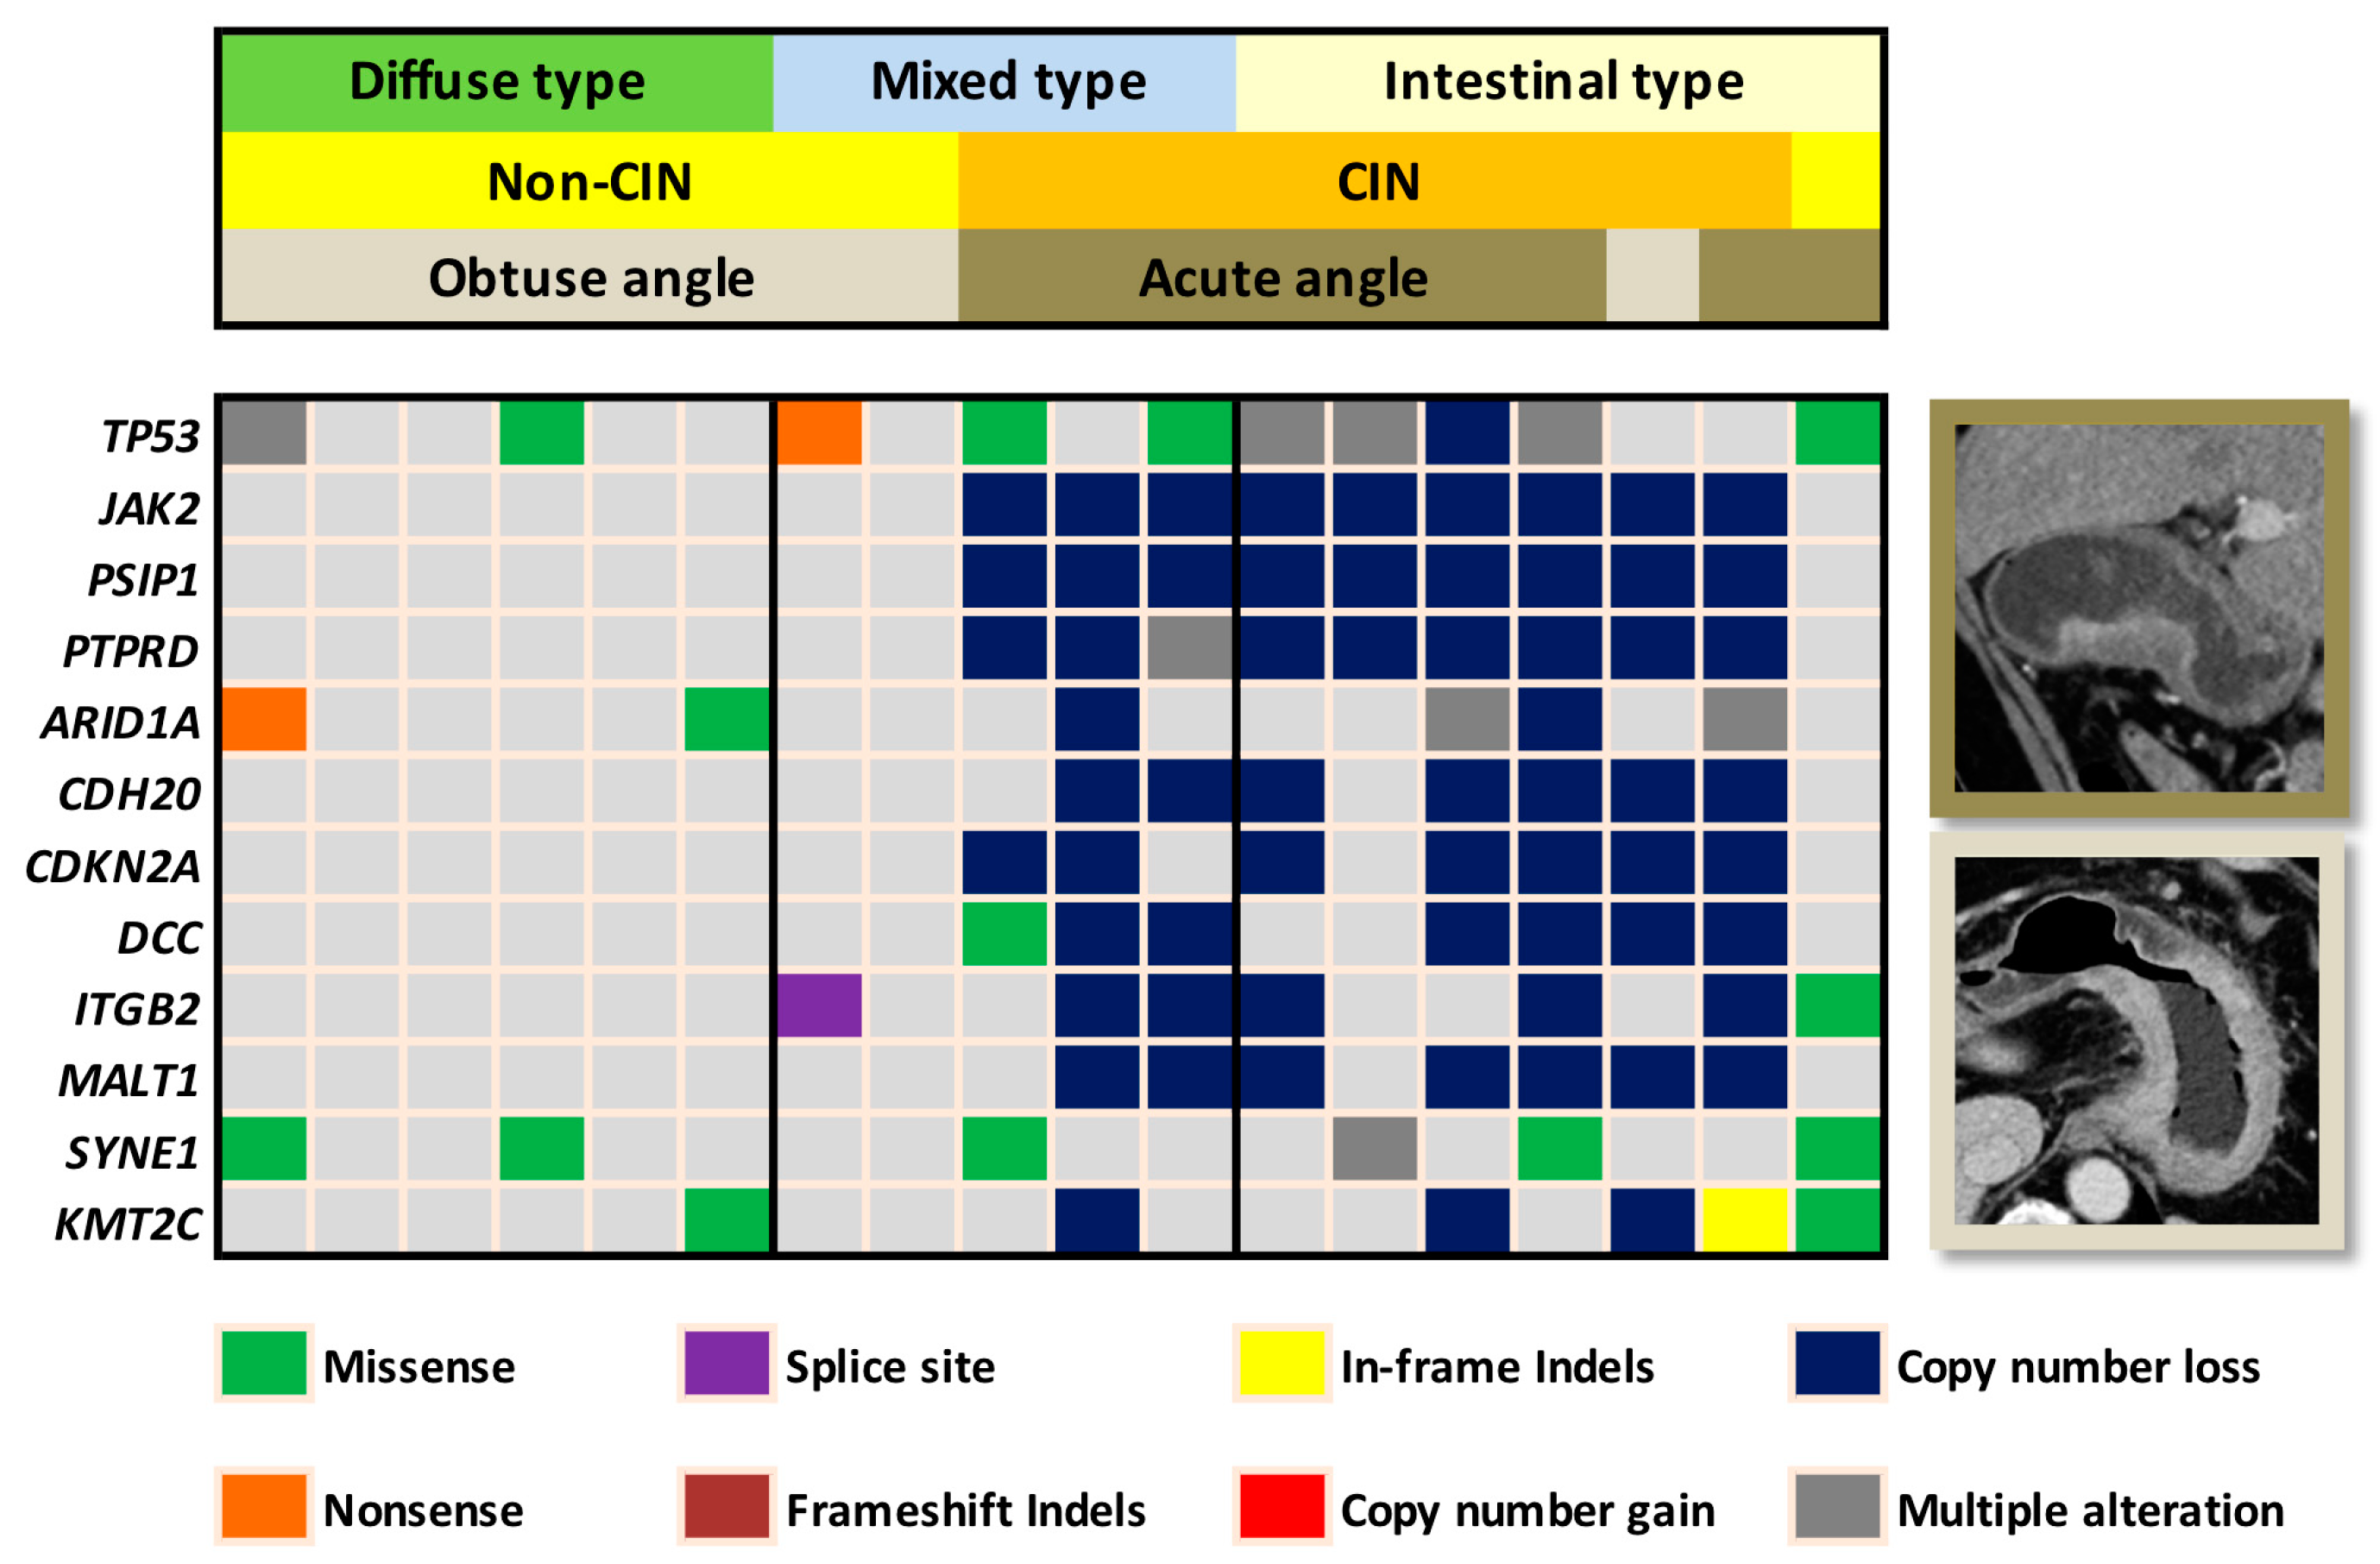
| CIN | Chromosomal instability |
| CT | Computed tomography |
| EBV | Epstein–Barr virus |
| OR | Odds ratio |
| ROC | Receiver operating characteristic curve |
| TCGA | The Cancer Genome Atlas |
Appendix A

| Gene Names | ||||||||||
|---|---|---|---|---|---|---|---|---|---|---|
| ABL1 | BIRC2 | COL1A1 | ERCC4 | GDNF | JUN | MDM4 | NOTCH4 | PMS1 | SDHD | TLR4 |
| ABL2 | BIRC3 | CRBN | ERCC5 | GNA11 | KAT6A | MEN1 | NPM1 | PMS2 | 9-Sep | TLX1 |
| ACVR2A | BIRC5 | CREB1 | ERG | GNAQ | KAT6B | MET | NRAS | POT1 | SETD2 | TNFAIP3 |
| ADAMTS20 | BLM | CREBBP | ESR1 | GNAS | KDM5C | MITF | NSD1 | POU5F1 | SF3B1 | TNFRSF14 |
| AFF1 | BLNK | CRKL | ETS1 | GPR124 | KDM6A | MLH1 | NTRK1 | PPARG | SGK1 | TNK2 |
| AFF3 | BMPR1A | CRTC1 | ETV1 | GRM8 | KDR | MLLT10 | NTRK3 | PPP2R1A | SH2D1A | TOP1 |
| AKAP9 | BRAF | CSF1R | ETV4 | GUCY1A2 | KEAP1 | MMP2 | NUMA1 | PRDM1 | SMAD2 | TP53 |
| AKT1 | BRD3 | CSMD3 | EXT1 | HCAR1 | KIT | MN1 | NUP214 | PRKAR1A | SMAD4 | TPR |
| AKT2 | BRIP1 | CTNNA1 | EXT2 | HIF1A | KLF6 | MPL | NUP98 | PRKDC | SMARCA4 | TRIM24 |
| AKT3 | BTK | CTNNB1 | EZH2 | HLF | KMT2A | MRE11A | PAK3 | PSIP1 | SMARCB1 | TRIM33 |
| ALK | BUB1B | CYLD | FANCA | HNF1A | KMT2C | MSH2 | PALB2 | PTCH1 | SMO | TRIP11 |
| AMER1 | CARD11 | CYP2C19 | FANCC | HOOK3 | KMT2D | MSH6 | PARP1 | PTEN | SMUG1 | TRRAP |
| APC | CASC5 | CYP2D6 | FANCD2 | HRAS | KRAS | MTOR | PAX3 | PTGS2 | SOCS1 | TSC1 |
| AR | CBL | DAXX | FANCF | HSP90AA1 | LAMP1 | MTR | PAX5 | PTPN11 | SOX11 | TSC2 |
| ARID1A | CCND1 | DCC | FANCG | HSP90AB1 | LCK | MTRR | PAX7 | PTPRD | SOX2 | TSHR |
| ARID2 | CCND2 | DDB2 | FAS | ICK | LIFR | MUC1 | PAX8 | PTPRT | SRC | UBR5 |
| ARNT | CCNE1 | DDIT3 | FBXW7 | IDH1 | LPHN3 | MUTYH | PBRM1 | RAD50 | SSX1 | UGT1A1 |
| ASXL1 | CD79A | DDR2 | FGFR1 | IDH2 | LPP | MYB | PBX1 | RAF1 | STK11 | USP9X |
| ATF1 | CD79B | DEK | FGFR2 | IGF1R | LRP1B | MYC | PDE4DIP | RALGDS | STK36 | VHL |
| ATM | CDC73 | DICER1 | FGFR3 | IGF2 | LTF | MYCL | PDGFB | RARA | SUFU | WAS |
| ATR | CDH1 | DNMT3A | FGFR4 | IGF2R | LTK | MYCN | PDGFRA | RB1 | SYK | WHSC1 |
| ATRX | CDH11 | DPYD | FH | IKBKB | MAF | MYD88 | PDGFRB | RECQL4 | SYNE1 | WRN |
| AURKA | CDH2 | DST | FLCN | IKBKE | MAFB | MYH11 | PER1 | REL | TAF1 | WT1 |
| AURKB | CDH20 | EGFR | FLI1 | IKZF1 | MAGEA1 | MYH9 | PGAP3 | RET | TAF1L | XPA |
| AURKC | CDH5 | EML4 | FLT1 | IL2 | MAGI1 | NBN | PHOX2B | RHOH | TAL1 | XPC |
| AXL | CDK12 | EP300 | FLT3 | IL21R | MALT1 | NCOA1 | PIK3C2B | RNASEL | TBX22 | XPO1 |
| BAI3 | CDK4 | EP400 | FLT4 | IL6ST | MAML2 | NCOA2 | PIK3CA | RNF2 | TCF12 | XRCC2 |
| BAP1 | CDK6 | EPHA3 | FN1 | IL7R | MAP2K1 | NCOA4 | PIK3CB | RNF213 | TCF3 | ZNF384 |
| BCL10 | CDK8 | EPHA7 | FOXL2 | ING4 | MAP2K2 | NF1 | PIK3CD | ROS1 | TCF7L1 | ZNF521 |
| BCL11A | CDKN2A | EPHB1 | FOXO1 | IRF4 | MAP2K4 | NF2 | PIK3CG | RPS6KA2 | TCF7L2 | |
| BCL11B | CDKN2B | EPHB4 | FOXO3 | IRS2 | MAP3K7 | NFE2L2 | PIK3R1 | RRM1 | TCL1A | |
| BCL2 | CDKN2C | EPHB6 | FOXP1 | ITGA10 | MAPK1 | NFKB1 | PIK3R2 | RUNX1 | TET1 | |
| BCL2L1 | CEBPA | ERBB2 | FOXP4 | ITGA9 | MAPK8 | NFKB2 | PIM1 | RUNX1T1 | TET2 | |
| BCL2L2 | CHEK1 | ERBB3 | FZR1 | ITGB2 | MARK1 | NIN | PKHD1 | SAMD9 | TFE3 | |
| BCL3 | CHEK2 | ERBB4 | G6PD | ITGB3 | MARK4 | NKX2-1 | PLAG1 | SBDS | TGFBR2 | |
| BCL6 | CIC | ERCC1 | GATA1 | JAK1 | MBD1 | NLRP1 | PLCG1 | SDHA | TGM7 | |
| BCL9 | CKS1B | ERCC2 | GATA2 | JAK2 | MCL1 | NOTCH1 | PLEKHG5 | SDHB | THBS1 | |
| BCR | CMPK1 | ERCC3 | GATA3 | JAK3 | MDM2 | NOTCH2 | PML | SDHC | TIMP3 | |
References
- Bray, F.; Ferlay, J.; Soerjomataram, I.; Siegel, R.L.; Torre, L.A.; Jemal, A. Global cancer statistics 2018: GLOBOCAN estimates of incidence and mortality worldwide for 36 cancers in 185 countries. CA Cancer J. Clin. 2018, 68, 394–424. [Google Scholar] [CrossRef] [PubMed]
- Nagini, S. Carcinoma of the stomach: A review of epidemiology, pathogenesis, molecular genetics and chemoprevention. World J. Gastrointest. Oncol. 2012, 4, 156–169. [Google Scholar] [CrossRef]
- Cunningham, D.; Allum, W.H.; Stenning, S.P.; Thompson, J.N.; van de Velde, C.J.; Nicolson, M.; Scarffe, J.H.; Lofts, F.J.; Falk, S.J.; Iveson, T.J.; et al. Perioperative chemotherapy versus surgery alone for resectable gastroesophageal cancer. N. Engl. J. Med. 2006, 355, 11–20. [Google Scholar] [CrossRef]
- Macdonald, J.S.; Smalley, S.R.; Benedetti, J.; Hundahl, S.A.; Estes, N.C.; Stemmermann, G.N.; Haller, D.G.; Ajani, J.A.; Gunderson, L.L.; Jessup, J.M.; et al. Chemoradiotherapy after surgery compared with surgery alone for adenocarcinoma of the stomach or gastroesophageal junction. N. Engl. J. Med. 2001, 345, 725–730. [Google Scholar] [CrossRef] [PubMed]
- An, F.Q.; Matsuda, M.; Fujii, H.; Tang, R.F.; Amemiya, H.; Dai, Y.M.; Matsumoto, Y. Tumor heterogeneity in small hepatocellular carcinoma: Analysis of tumor cell proliferation, expression and mutation of p53 AND beta-catenin. Int. J. Cancer 2001, 93, 468–474. [Google Scholar] [CrossRef]
- Cortez, E.; Gladh, H.; Braun, S.; Bocci, M.; Cordero, E.; Bjorkstrom, N.K.; Miyazaki, H.; Michael, I.P.; Eriksson, U.; Folestad, E.; et al. Functional malignant cell heterogeneity in pancreatic neuroendocrine tumors revealed by targeting of PDGF-DD. Proc. Natl. Acad. Sci. USA 2016, 113, E864–E873. [Google Scholar] [CrossRef] [Green Version]
- Lauren, P. The Two Histological Main Types of Gastric Carcinoma: Diffuse and So-Called Intestinal-Type Carcinoma. An Attempt at a Histo-Clinical Classification. Acta Pathol. Microbiol. Scand. 1965, 64, 31–49. [Google Scholar] [CrossRef] [PubMed]
- Bosman, F.T.; Carneiro, F.; Hruban, R.H.; Theise, N.D. WHO Classification of Tumours of the Digestive System, 4th ed.; International Agency for Research on Cancer: Lyon, France, 2010; pp. 48–58. [Google Scholar]
- The Cancer Genome Atlas Research Network. Comprehensive molecular characterization of gastric adenocarcinoma. Nature 2014, 513, 202–209. [Google Scholar] [CrossRef] [Green Version]
- Nowak, M.A.; Komarova, N.L.; Sengupta, A.; Jallepalli, P.V.; Shih Ie, M.; Vogelstein, B.; Lengauer, C. The role of chromosomal instability in tumor initiation. Proc. Natl. Acad. Sci. USA 2002, 99, 16226–16231. [Google Scholar] [CrossRef] [PubMed] [Green Version]
- Geigl, J.B.; Obenauf, A.C.; Schwarzbraun, T.; Speicher, M.R. Defining ‘chromosomal instability’. Trends Genet. 2008, 24, 64–69. [Google Scholar] [CrossRef]
- Maleki, S.S.; Rocken, C. Chromosomal Instability in Gastric Cancer Biology. Neoplasia 2017, 19, 412–420. [Google Scholar] [CrossRef] [PubMed]
- Mazurowski, M.A. Radiogenomics: What it is and why it is important. J. Am. Coll. Radiol. 2015, 12, 862–866. [Google Scholar] [CrossRef]
- Rutman, A.M.; Kuo, M.D. Radiogenomics: Creating a link between molecular diagnostics and diagnostic imaging. Eur. J. Radiol. 2009, 70, 232–241. [Google Scholar] [CrossRef] [PubMed]
- Yang, D.M.; Kim, H.C.; Jin, W.; Ryu, C.W.; Kang, J.H.; Park, C.H.; Kim, H.S.; Jung, D.H. 64 multidetector-row computed tomography for preoperative evaluation of gastric cancer: Histological correlation. J. Comput. Assist. Tomogr. 2007, 31, 98–103. [Google Scholar] [CrossRef] [PubMed]
- Amin, M.B.; Byrd, D.R.; Edge, S.B.; Greene, F.L. AJCC Cancer Staging Manual, 8th ed.; Springer International Publishing AG: Cham, Switzerland, 2016; pp. 203–220. [Google Scholar]
- Saragoni, L. Upgrading the definition of early gastric cancer: better staging means more appropriate treatment. Cancer Biol. Med. 2015, 12, 355–361. [Google Scholar] [CrossRef] [PubMed]
- Sohn, B.H.; Hwang, J.E.; Jang, H.J.; Lee, H.S.; Oh, S.C.; Shim, J.J.; Lee, K.W.; Kim, E.H.; Yim, S.Y.; Lee, S.H.; et al. Clinical Significance of Four Molecular Subtypes of Gastric Cancer Identified by The Cancer Genome Atlas Project. Clin. Cancer Res. 2017, 23, 4441–4449. [Google Scholar] [CrossRef] [PubMed]
- Li, C.; Oh, S.J.; Kim, S.; Hyung, W.J.; Yan, M.; Zhu, Z.G.; Noh, S.H. Macroscopic Borrmann type as a simple prognostic indicator in patients with advanced gastric cancer. Oncology 2009, 77, 197–204. [Google Scholar] [CrossRef] [PubMed]
- Kajitani, T. The general rules for the gastric cancer study in surgery and pathology. Part I. Clinical classification. Jpn. J. Surg. 1981, 11, 127–139. [Google Scholar] [CrossRef]
- Chen, Y.C.; Fang, W.L.; Wang, R.F.; Liu, C.A.; Yang, M.H.; Lo, S.S.; Wu, C.W.; Li, A.F.; Shyr, Y.M.; Huang, K.H. Clinicopathological Variation of Lauren Classification in Gastric Cancer. Pathol. Oncol. Res. 2016, 22, 197–202. [Google Scholar] [CrossRef]
- Zhou, Y.N.; Xu, C.P.; Han, B.; Li, M.; Qiao, L.; Fang, D.C.; Yang, J.M. Expression of E-cadherin and beta-catenin in gastric carcinoma and its correlation with the clinicopathological features and patient survival. World J. Gastroenterol. 2002, 8, 987–993. [Google Scholar] [CrossRef]
- Murphy, G.; Pfeiffer, R.; Camargo, M.C.; Rabkin, C.S. Meta-analysis shows that prevalence of Epstein-Barr virus-positive gastric cancer differs based on sex and anatomic location. Gastroenterology 2009, 137, 824–833. [Google Scholar] [CrossRef] [Green Version]
- Maeda, E.; Akahane, M.; Uozaki, H.; Kato, N.; Hayashi, N.; Fukayama, M.; Ohtomo, K. CT appearance of Epstein-Barr virus-associated gastric carcinoma. Abdom. Imaging 2009, 34, 618–625. [Google Scholar] [CrossRef] [PubMed]
- Tsurumaru, D.; Miyasaka, M.; Muraki, T.; Asayama, Y.; Nishie, A.; Oki, E.; Hirahashi, M.; Hida, T.; Honda, H. Diffuse-type gastric cancer: Specific enhancement pattern on multiphasic contrast-enhanced computed tomography. Jpn. J. Radiol. 2017, 35, 289–295. [Google Scholar] [CrossRef]
- Tsurumaru, D.; Miyasaka, M.; Muraki, T.; Nishie, A.; Asayama, Y.; Oki, E.; Oda, Y.; Honda, H. Histopathologic diversity of gastric cancers: Relationship between enhancement pattern on dynamic contrast-enhanced CT and histological type. Eur. J. Radiol. 2017, 97, 90–95. [Google Scholar] [CrossRef]
- Collins, F.S.; Varmus, H. A new initiative on precision medicine. N. Engl. J. Med. 2015, 372, 793–795. [Google Scholar] [CrossRef]
- Gerlinger, M.; Rowan, A.J.; Horswell, S.; Math, M.; Larkin, J.; Endesfelder, D.; Gronroos, E.; Martinez, P.; Matthews, N.; Stewart, A.; et al. Intratumor heterogeneity and branched evolution revealed by multiregion sequencing. N. Engl. J. Med. 2012, 366, 883–892. [Google Scholar] [CrossRef]
- Jaffe, C.C. Imaging and genomics: Is there a synergy? Radiology 2012, 264, 329–331. [Google Scholar] [CrossRef] [PubMed]
- Mazurowski, M.A.; Zhang, J.; Grimm, L.J.; Yoon, S.C.; Silber, J.I. Radiogenomic analysis of breast cancer: Luminal B molecular subtype is associated with enhancement dynamics at MR imaging. Radiology 2014, 273, 365–372. [Google Scholar] [CrossRef] [PubMed]
- Karlo, C.A.; Di Paolo, P.L.; Chaim, J.; Hakimi, A.A.; Ostrovnaya, I.; Russo, P.; Hricak, H.; Motzer, R.; Hsieh, J.J.; Akin, O. Radiogenomics of clear cell renal cell carcinoma: Associations between CT imaging features and mutations. Radiology 2014, 270, 464–471. [Google Scholar] [CrossRef]
- Vanderstichele, A.; Busschaert, P.; Smeets, D.; Landolfo, C.; Van Nieuwenhuysen, E.; Leunen, K.; Neven, P.; Amant, F.; Mahner, S.; Braicu, E.I.; et al. Chromosomal Instability in Cell-Free DNA as a Highly Specific Biomarker for Detection of Ovarian Cancer in Women with Adnexal Masses. Clin. Cancer Res. 2017, 23, 2223–2231. [Google Scholar] [CrossRef]
- Schutz, E.; Akbari, M.R.; Beck, J.; Urnovitz, H.; Zhang, W.W.; Bornemann-Kolatzki, K.; Mitchell, W.M.; Nam, R.K.; Narod, S.A. Chromosomal instability in cell-free DNA is a serum biomarker for prostate cancer. Clin. Chem. 2015, 61, 239–248. [Google Scholar] [CrossRef] [PubMed]
- Sai, S.; Ichikawa, D.; Tomita, H.; Ikoma, D.; Tani, N.; Ikoma, H.; Kikuchi, S.; Fujiwara, H.; Ueda, Y.; Otsuji, E. Quantification of plasma cell-free DNA in patients with gastric cancer. Anticancer Res. 2007, 27, 2747–2751. [Google Scholar] [CrossRef] [PubMed]
- Gonzalez, R.S.; Messing, S.; Tu, X.; McMahon, L.A.; Whitney-Miller, C.L. Immunohistochemistry as a surrogate for molecular subtyping of gastric adenocarcinoma. Hum. Pathol. 2016, 56, 16–21. [Google Scholar] [CrossRef] [PubMed]
- Carter, S.L.; Eklund, A.C.; Kohane, I.S.; Harris, L.N.; Szallasi, Z. A signature of chromosomal instability inferred from gene expression profiles predicts clinical outcome in multiple human cancers. Nat. Genet. 2006, 38, 1043–1048. [Google Scholar] [CrossRef] [PubMed]
- Birkbak, N.J.; Eklund, A.C.; Li, Q.; McClelland, S.E.; Endesfelder, D.; Tan, P.; Tan, I.B.; Richardson, A.L.; Szallasi, Z.; Swanton, C. Paradoxical relationship between chromosomal instability and survival outcome in cancer. Cancer Res. 2011, 71, 3447–3452. [Google Scholar] [CrossRef] [PubMed] [Green Version]
- Liu, S.; Shi, H.; Ji, C.; Guan, W.; Chen, L.; Sun, Y.; Tang, L.; Guan, Y.; Li, W.; Ge, Y.; et al. CT textural analysis of gastric cancer: Correlations with immunohistochemical biomarkers. Sci. Rep. 2018, 8, 11844. [Google Scholar] [CrossRef]

| Variable | Training Cohort (n = 40) | Validation Cohort (n = 18) | p Value |
|---|---|---|---|
| Age (years), median (range) | 68 (36–79) | 68 (47–87) | 0.69 |
| Male gender | 35/40 | 11/18 | 0.02 |
| Diameter (cm), median (range) | 5.4 (2.8–12.5) | 3.7 (1.7–11.6) | 0.01 |
| T stage | |||
| 1 | 0 | 1 | 0.37 |
| 2 | 1 | 1 | |
| 3 | 22 | 5 | |
| 4 | 17 | 11 | |
| N stage | |||
| 0 | 7 | 2 | 0.08 |
| 1 | 8 | 2 | |
| 2 | 12 | 3 | |
| 3 | 13 | 11 | |
| M stage | |||
| 0 | 38 | 16 | 0.40 |
| 1 | 2 | 2 |
| Variables | Univariate | Multivariate | ||||
|---|---|---|---|---|---|---|
| OR | 95% CI | p Value | OR | 95% CI | p Value | |
| Tumor diameter (cm) | 0.69 | 0.48–1.00 | 0.051 | 0.54 | 0.32–0.90 | 0.017 |
| Tumor thickness (cm) | 3.18 | 0.92–10.94 | 0.066 | |||
| Location: region | ||||||
| Cardia, fundus | 8.00 | 0.81–78.83 | 0.075 | |||
| Body | 0.50 | 0.09–2.89 | 0.438 | |||
| Antrum, pylorus | Ref | |||||
| Location: curvature | ||||||
| Lesser curvature | 2.11 | 0.43–10.42 | 0.359 | |||
| Greater curvature | 0.44 | 0.05–4.37 | 0.487 | |||
| Both curvatures | Ref | |||||
| Location: wall | ||||||
| Anterior wall | Ref | |||||
| Posterior wall | 1.20 | 0.17–8.66 | 0.857 | |||
| Both walls | 1.40 | 0.28–6.98 | 0.681 | |||
| Tumor margin | ||||||
| Well-defined | 2.33 | 0.54–10.10 | 0.257 | |||
| Ill-defined | Ref | |||||
| Tumor transition angle | ||||||
| Obtuse angle | Ref | Ref | ||||
| Acute angle | 7.50 | 1.53–36.71 | 0.013 | 7.41 | 1.04–52.65 | 0.045 |
| Tumor shape | ||||||
| Infiltrative | Ref | |||||
| Ulcerated | 0.38 | 0.02–7.00 | 0.511 | |||
| Fungating | 1.69 | 0.28–10.17 | 0.568 | |||
| Polypoid | 1.50 | 0.14–16.27 | 0.739 | |||
| Circumscription | ||||||
| 0–90° | >999.99 | <0.01 to >999.99 | 0.999 | |||
| 91–180° | 0.21 | 0.04–1.18 | 0.076 | |||
| 181–270° | 2.25 | 0.20–25.37 | 0.512 | |||
| 271–360° | Ref | |||||
| Luminal obstruction | ||||||
| Presence | 1.56 | 0.35–6.88 | 0.560 | |||
| Absence | Ref | |||||
| Serosal invasion | ||||||
| Presence | Ref | |||||
| Absence | 2.00 | 0.47–8.56 | 0.350 | |||
| Enhancement heterogeneity | ||||||
| Mild | 1.00 | 0.14–7.10 | 1.000 | |||
| Moderate | 1.00 | 0.20–4.96 | 1.000 | |||
| Severe | Ref | |||||
| Double-layered enhancement | ||||||
| Presence | Ref | |||||
| Absence | 1.35 | 0.29–6.32 | 0.702 | |||
| Tumor necrosis | ||||||
| 0%–25% | 3.00 | 0.17–54.57 | 0.458 | |||
| 26%–50% | 4.00 | 0.17–95.76 | 0.392 | |||
| 51%–75% | Ref | |||||
| Enlarged lymph node | ||||||
| Presence | Ref | |||||
| Absence | 1.71 | 0.30–9.72 | 0.543 | |||
| Distant metastasis | ||||||
| Presence | >999.99 | <0.01 to >999.99 | 1.000 | |||
| Absence | Ref | |||||
| Sensitivity | Specificity | PPV | NPV | Accuracy | AUC | |
|---|---|---|---|---|---|---|
| Training cohort (n = 40) | ||||||
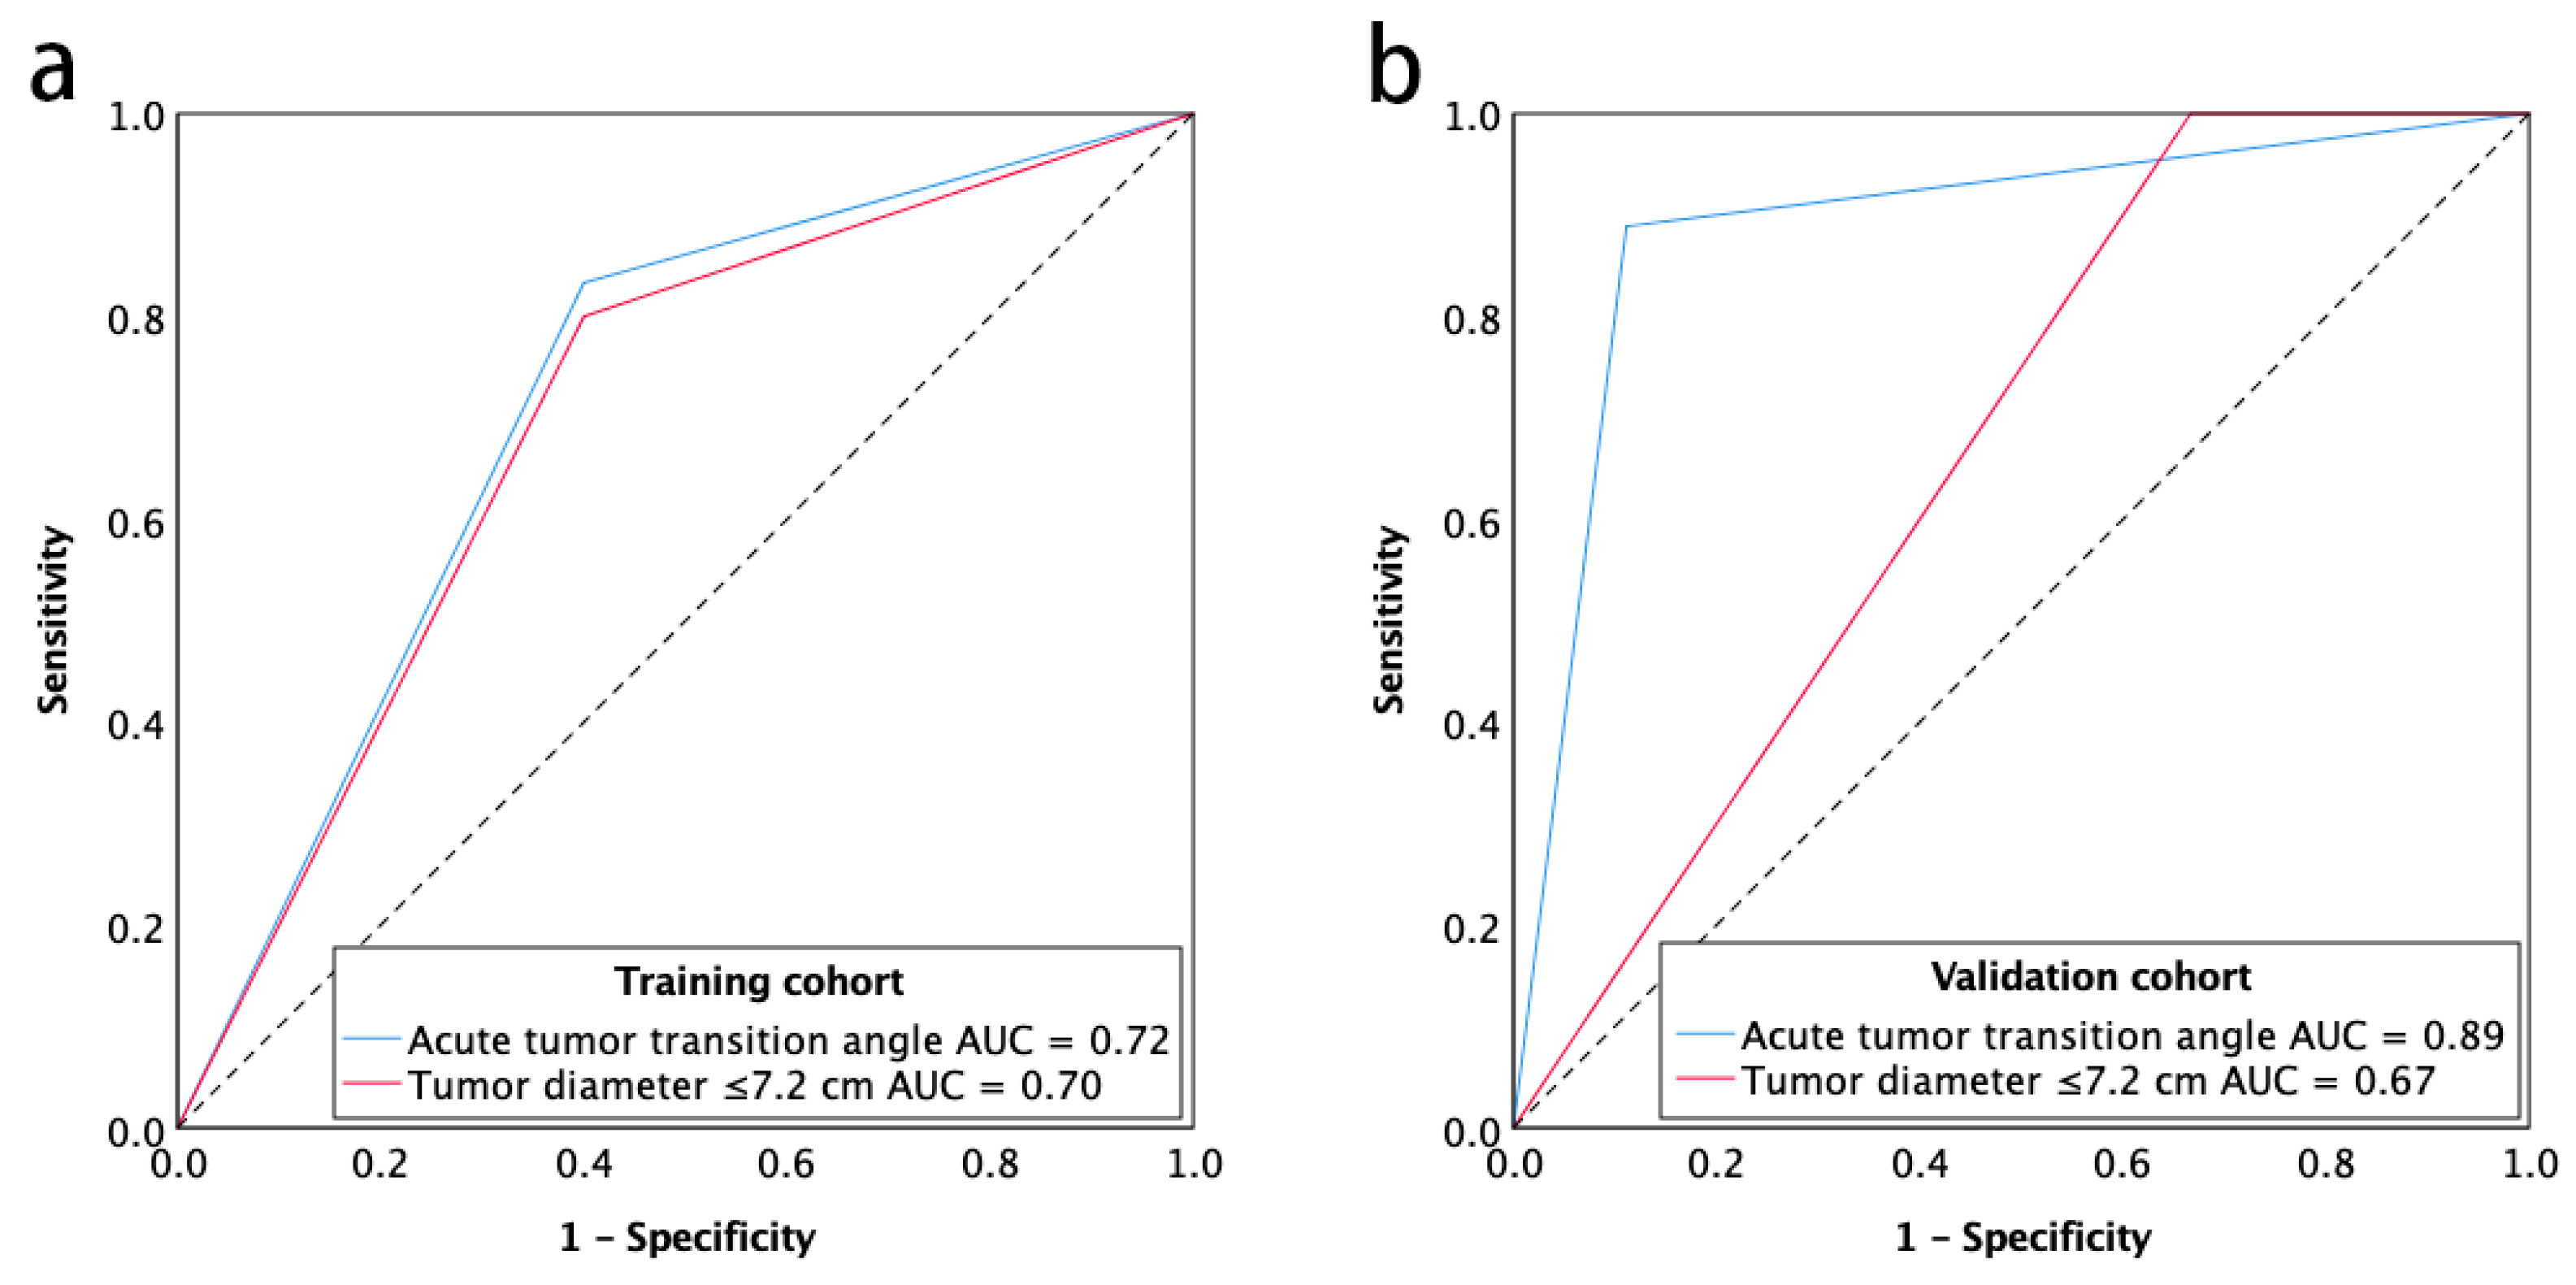
| Acute tumor transition angle | 83.3 (65.3–94.4) | 60.0 (26.2–87.8) | 86.2 (68.3–96.1) | 54.5 (23.4–83.3) | 77.5 (61.5–89.2) | 0.72 (0.52–0.92) |
| Tumor diameter ≤7.2 cm | 80.0 (61.4–92.3) | 60.0 (26.2–87.8) | 85.7 (67.3–96.0) | 50.0 (21.1–78.9) | 75.0 (58.8–87.3) | 0.70 (0.50–0.90) |
| Validation cohort (n = 18) | ||||||
| Acute tumor transition angle | 88.9 (51.8–99.7) | 88.9 (51.8–99.7) | 88.9 (65.3–98.6) | 88.9 (51.8–99.7) | 88.9 (51.8–99.7) | 0.89 (0.72–1.00) |
| Tumor diameter ≤7.2 cm | 100 (66.4–100) | 33.3 (7.5–70.1) | 60.0 (32.3–83.7) | 100 (29.2–100) | 66.7 (41.0–86.7) | 0.67 (0.41–0.93) |
| Category | Trait Name | Trait Description | Value |
|---|---|---|---|
| Size | Tumor diameter | The largest diameter of the tumor measured on MPR images (cm) | Quantitative |
| Tumor thickness | The maximal thickness of the tumor measured on MPR images (cm) | Quantitative | |
| Location | Region | Tumor involvement of the cardia, fundus, body, antrum or pylorus | Ordinal |
| Curvature | Tumor involvement of the greater curvature, lesser curvature, or both | Ordinal | |
| Wall | Tumor involvement of the anterior wall, posterior wall, or both | Ordinal | |
| Morphology | Tumor margin | Tumor margin as well- or ill-defined | Binary |
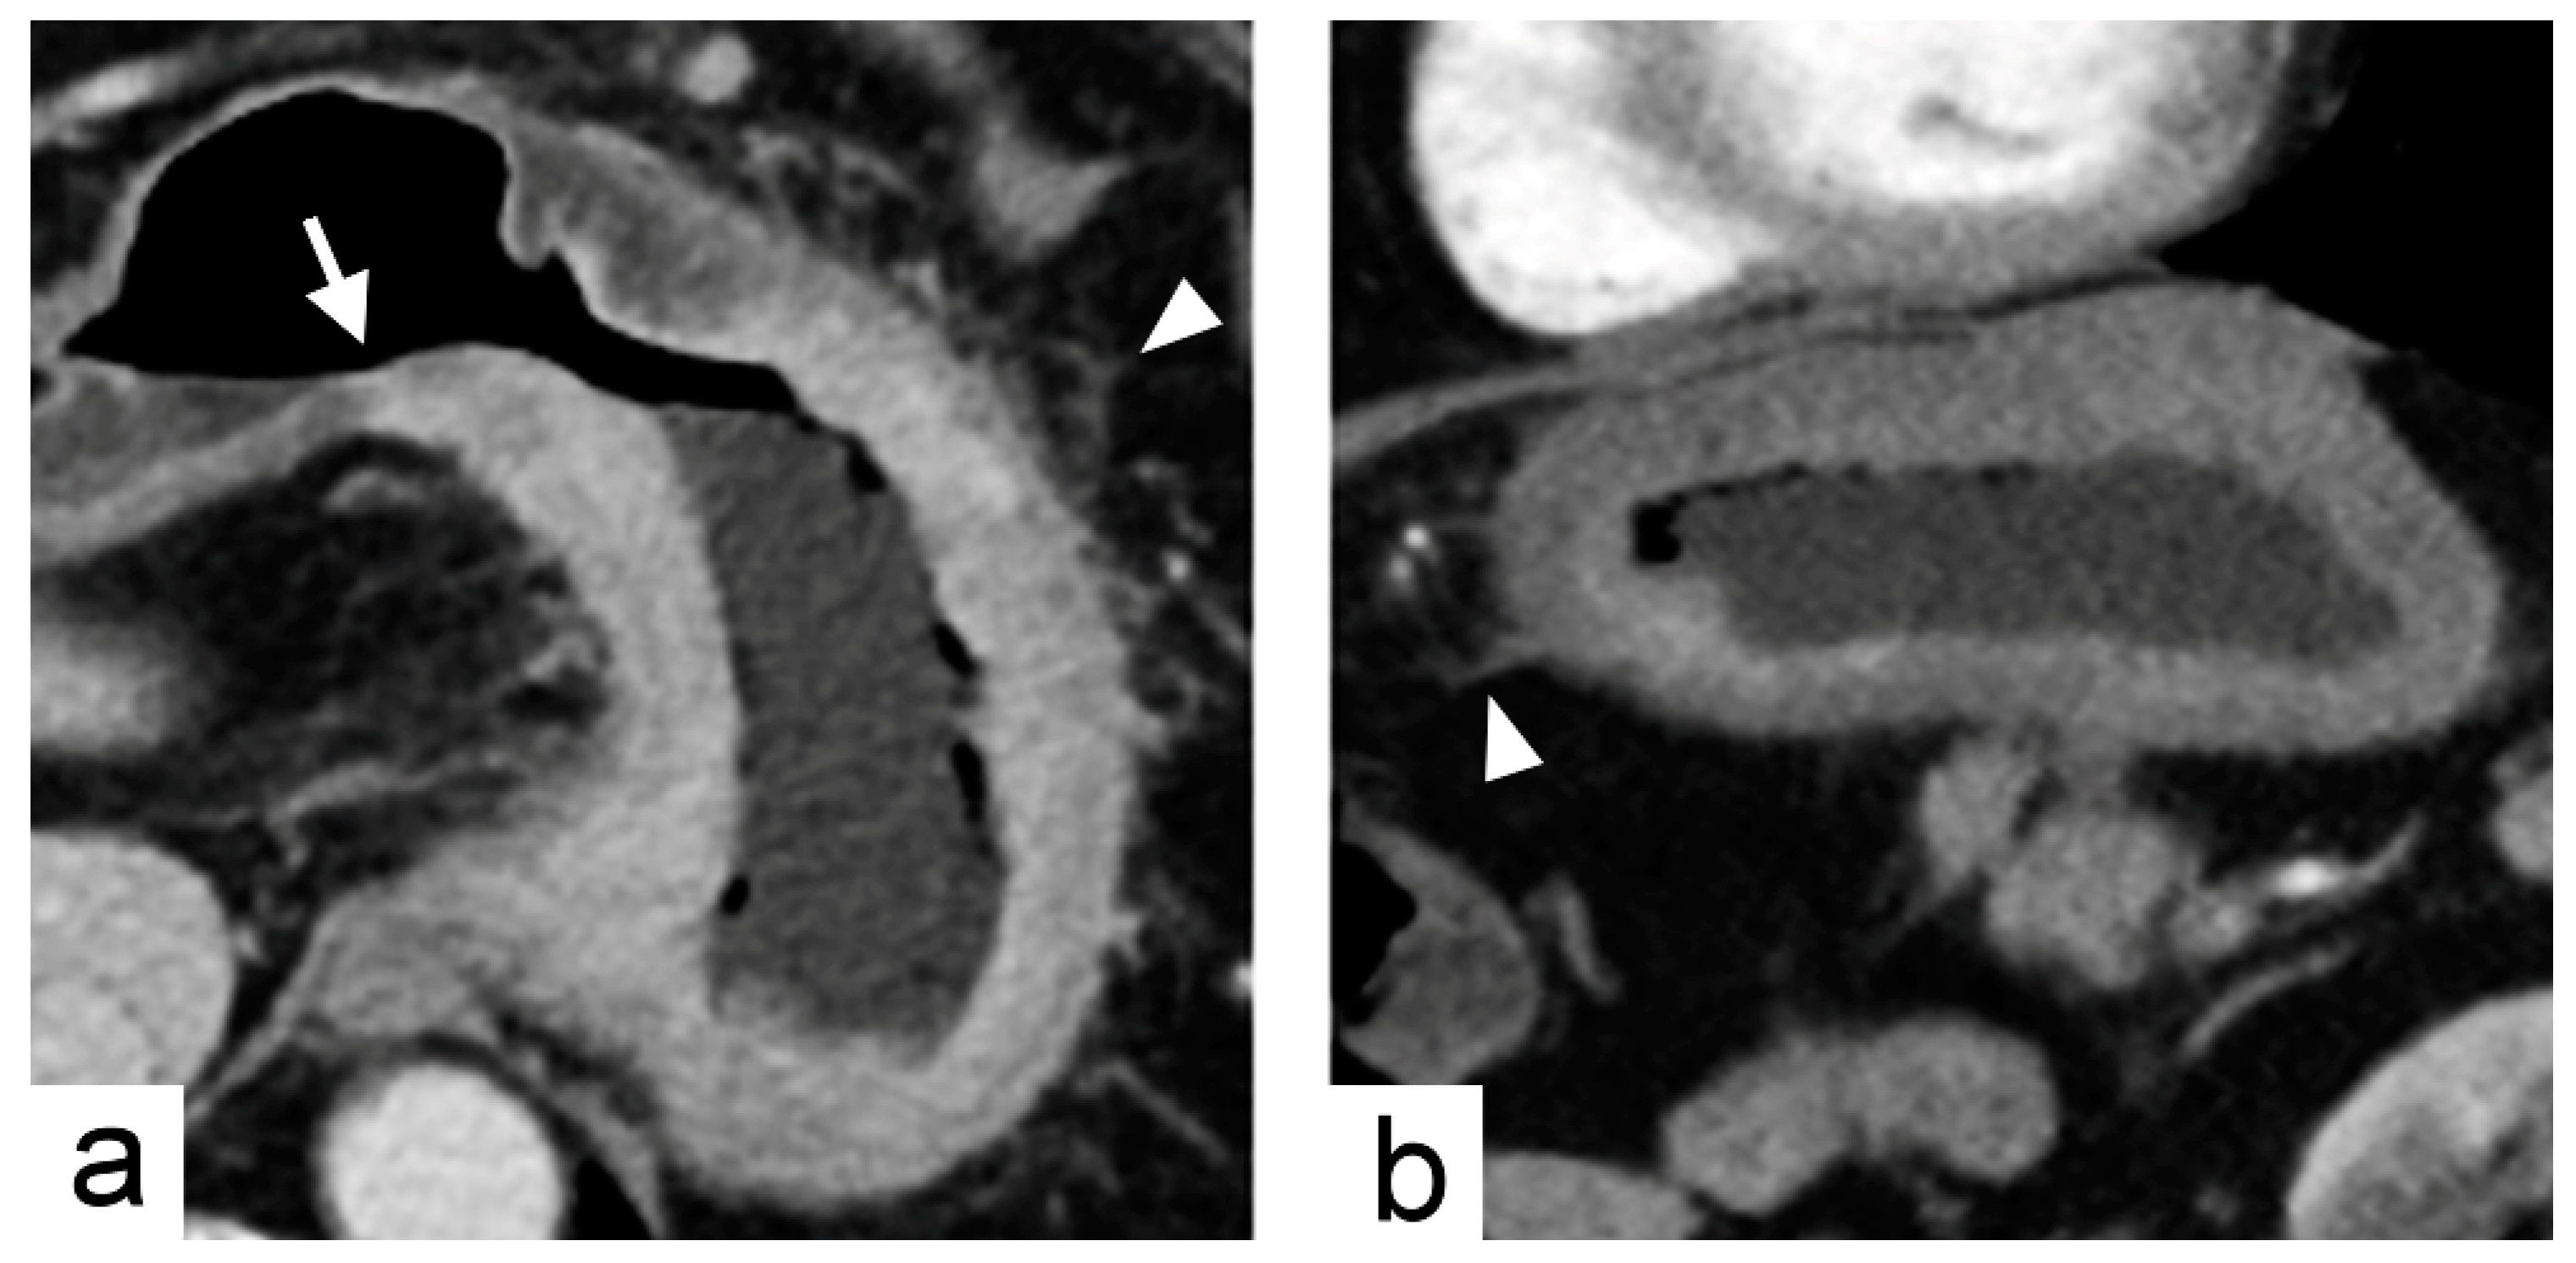
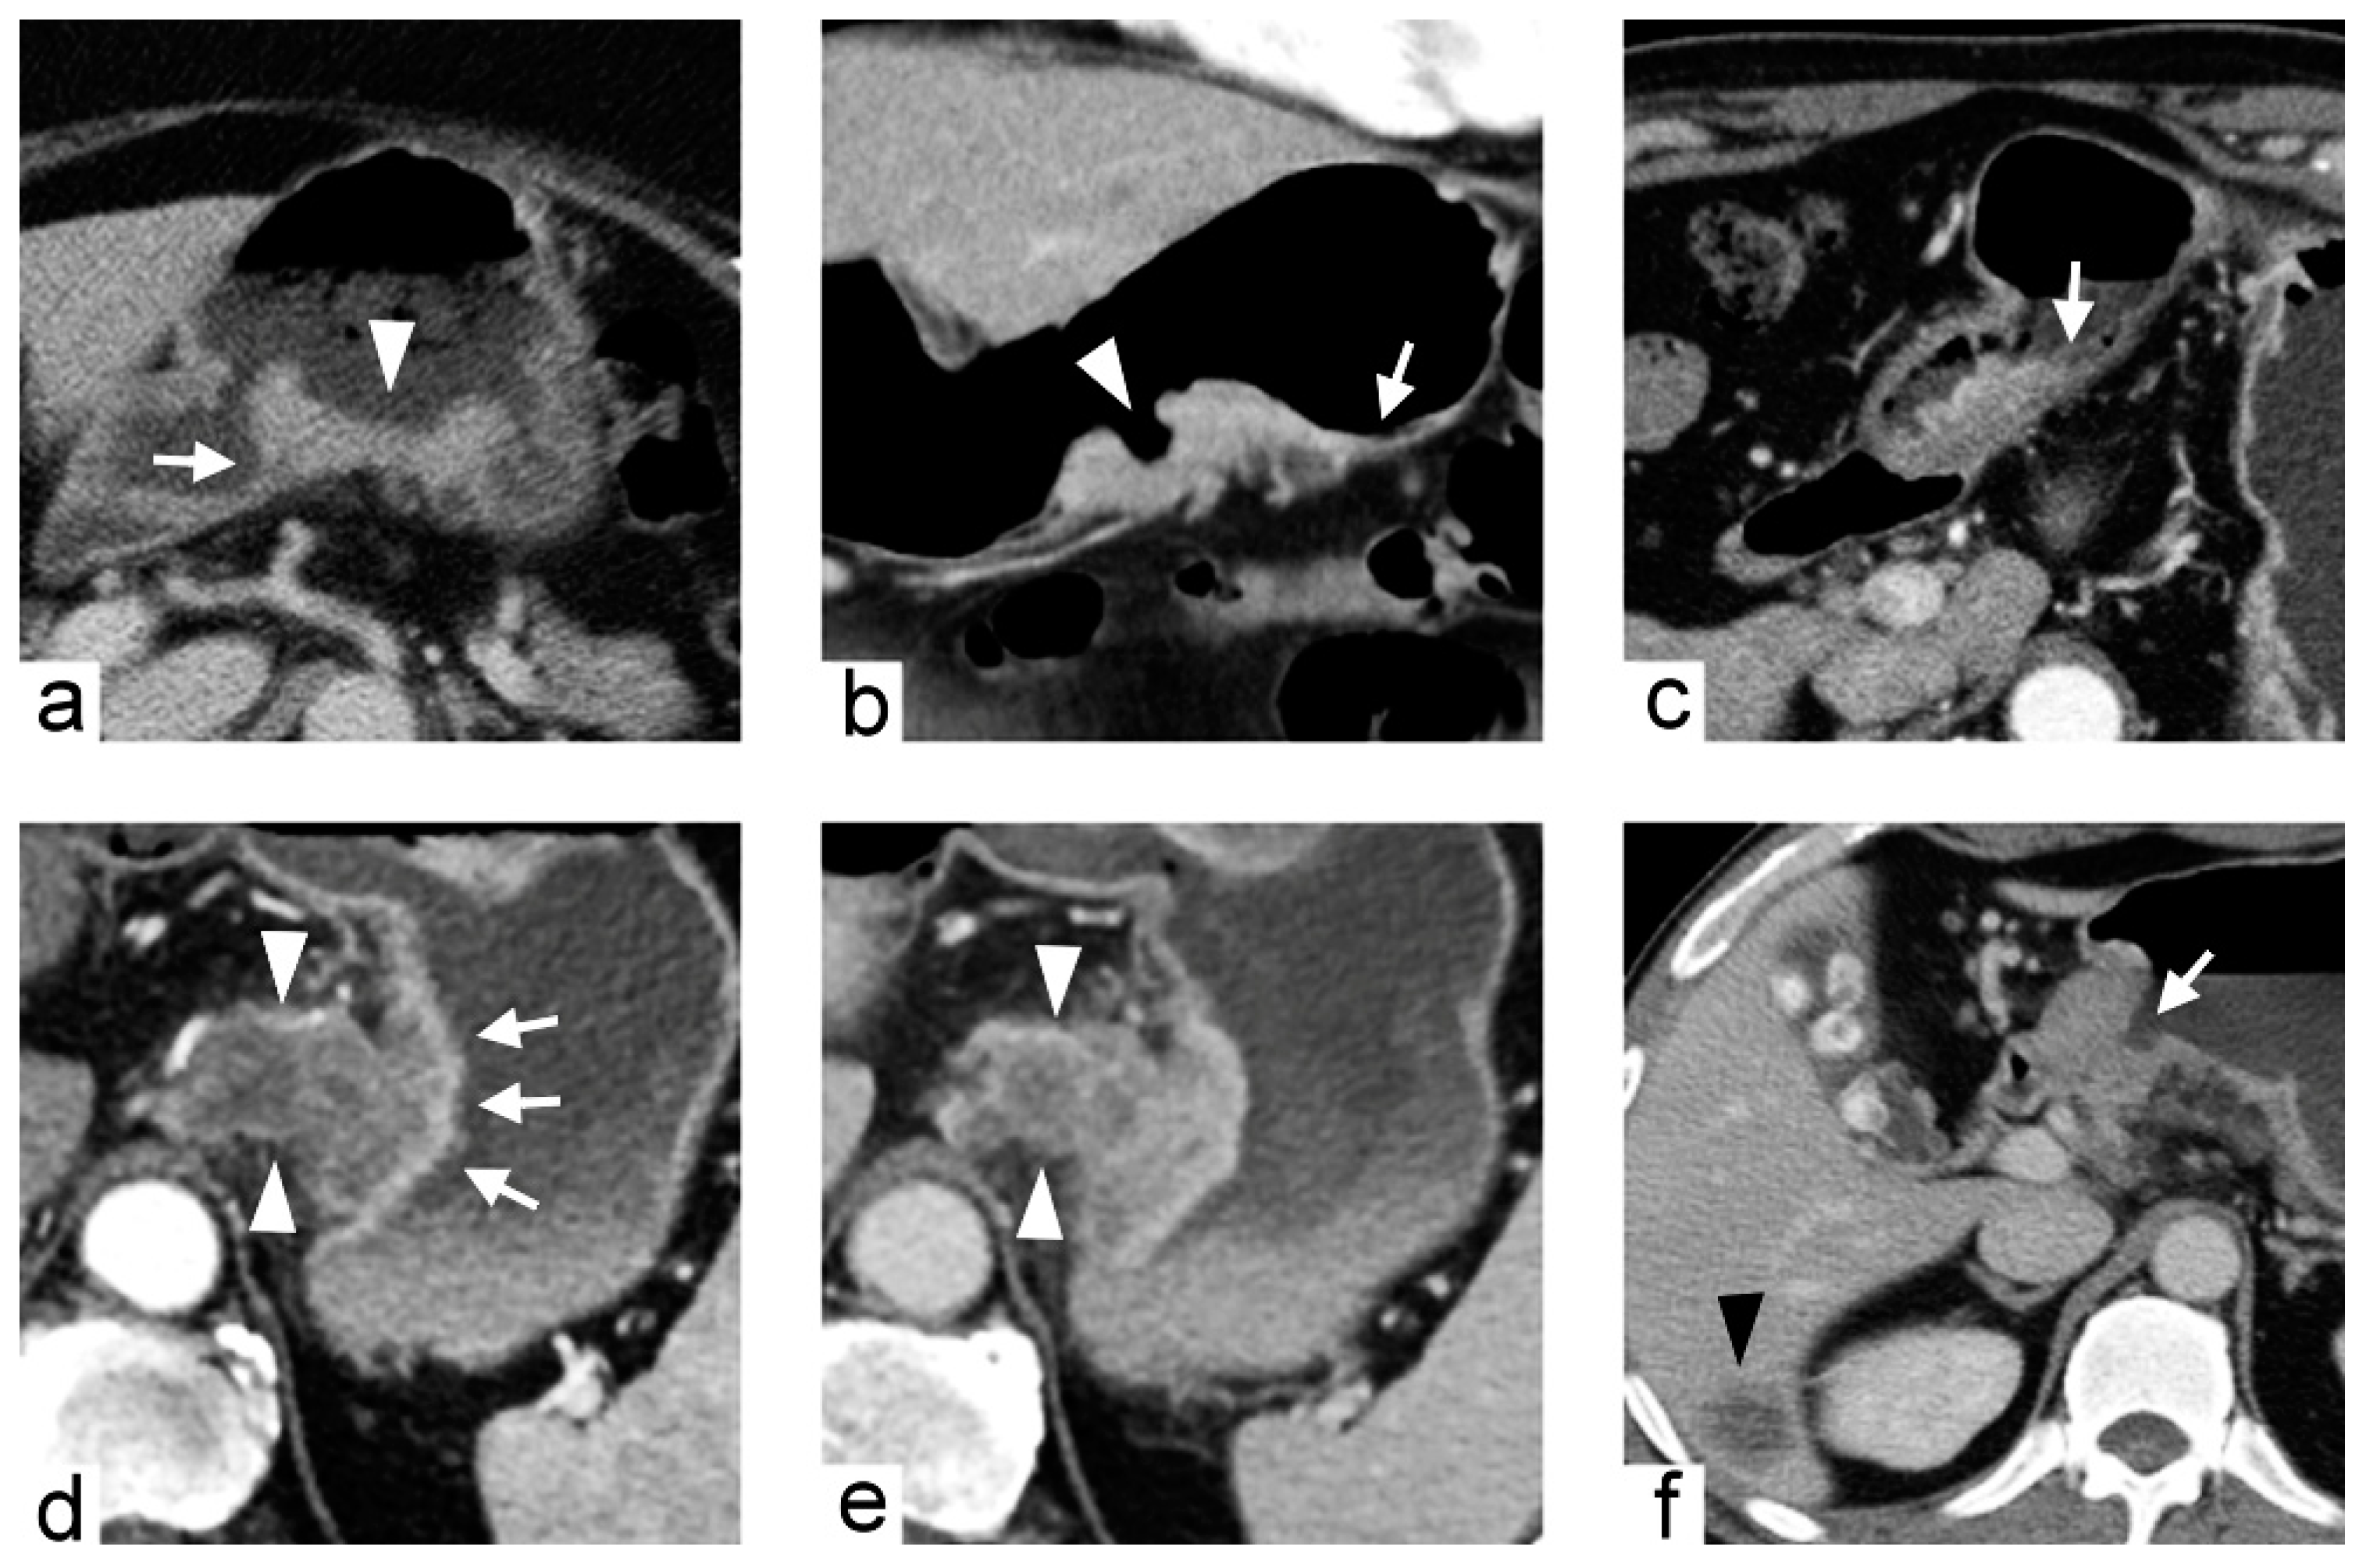
| Tumor transition angle | Transition angle between the tumor and the adjacent normal gastric wall defined as acute or obtuse angle | Binary | |
| Tumor shape | Tumor shape as infiltrative, ulcerated, fungating, or polypoid | Ordinal | |
| Tumor extent | Circumscription | Circumferential involvement of the tumor as 0–90°, 91–180°, 181–270°, or 271–360° | Ordinal |
| Luminal obstruction | Presence or absence of luminal obstruction | Binary | |
| Serosal invasion | Presence or absence of serosal invasion | Binary | |
| Contrast enhancement | Enhancement heterogeneity | Heterogeneity of contrast enhancement defined as mild, moderate, or severe on portal venous phase images | Ordinal |
| Double-layered enhancement | Presence or absence of double-layered contrast enhancement on arterial or portal venous phase images | Binary | |
| Tumor necrosis | Extent of tumor necrosis defined as 0%–25%, 26%–50%, 51%–75%, or 76%–100% | Ordinal | |
| Metastasis | Enlarged lymph node | Presence or absence of enlarged regional lymph nodes (>1 cm in short axis diameter) | Binary |
| Distant metastasis | Presence or absence of distant metastasis | Binary |
© 2019 by the authors. Licensee MDPI, Basel, Switzerland. This article is an open access article distributed under the terms and conditions of the Creative Commons Attribution (CC BY) license (http://creativecommons.org/licenses/by/4.0/).
Share and Cite
Lai, Y.-C.; Yeh, T.-S.; Wu, R.-C.; Tsai, C.-K.; Yang, L.-Y.; Lin, G.; Kuo, M.D. Acute Tumor Transition Angle on Computed Tomography Predicts Chromosomal Instability Status of Primary Gastric Cancer: Radiogenomics Analysis from TCGA and Independent Validation. Cancers 2019, 11, 641. https://doi.org/10.3390/cancers11050641
Lai Y-C, Yeh T-S, Wu R-C, Tsai C-K, Yang L-Y, Lin G, Kuo MD. Acute Tumor Transition Angle on Computed Tomography Predicts Chromosomal Instability Status of Primary Gastric Cancer: Radiogenomics Analysis from TCGA and Independent Validation. Cancers. 2019; 11(5):641. https://doi.org/10.3390/cancers11050641
Chicago/Turabian StyleLai, Ying-Chieh, Ta-Sen Yeh, Ren-Chin Wu, Cheng-Kun Tsai, Lan-Yan Yang, Gigin Lin, and Michael D. Kuo. 2019. "Acute Tumor Transition Angle on Computed Tomography Predicts Chromosomal Instability Status of Primary Gastric Cancer: Radiogenomics Analysis from TCGA and Independent Validation" Cancers 11, no. 5: 641. https://doi.org/10.3390/cancers11050641