Article

Gene Regulation by Antitumor miR-204-5p in Pancreatic Ductal Adenocarcinoma: The Clinical Significance of Direct RACGAP1 Regulation

1
Department of Digestive Surgery, Breast and Thyroid Surgery, Graduate School of Medical Sciences, Kagoshima University, Kagoshima 890-8580, Japan
2
Department of Functional Genomics, Chiba University Graduate School of Medicine, Chiba 260-8670, Japan
*
Author to whom correspondence should be addressed.
These authors contributed equally to this work.
Cancers 2019, 11(3), 327; https://doi.org/10.3390/cancers11030327
Submission received: 15 January 2019 / Revised: 3 March 2019 / Accepted: 4 March 2019 / Published: 7 March 2019
(This article belongs to the Special Issue MicroRNA-Associated Cancer Metastasis)

Abstract

:
Previously, we established a microRNA (miRNA) expression signature in pancreatic ductal adenocarcinoma (PDAC) tissues using RNA sequencing and found significantly reduced expression of miR-204-5p. Here, we aimed to investigate the functional significance of miR-204-5p and to identify miR-204-5p target genes involved in PDAC pathogenesis. Cancer cell migration and invasion were significantly inhibited by ectopic expression of miR-204-5p in PDAC cells. Comprehensive gene expression analyses and in silico database searches revealed 25 putative targets regulated by miR-204-5p in PDAC cells. Among these target genes, high expression levels of RACGAP1, DHRS9, AP1S3, FOXC1, PRP11, RHBDL2 and MUC4 were significant predictors of a poor prognosis of patients with PDAC. In this study, we focused on RACGAP1 (Rac guanosine triphosphatase-activating protein 1) because its expression was most significantly predictive of PDAC pathogenesis (overall survival rate: p = 0.0000548; disease-free survival rate: p = 0.0014). Overexpression of RACGAP1 was detected in PDAC clinical specimens, and its expression enhanced the migration and invasion of PDAC cells. Moreover, downstream genes affected by RACGAP1 (e.g., MMP28, CEP55, CDK1, ANLN and S100A14) are involved in PDAC pathogenesis. Our strategy to identify antitumor miRNAs and their target genes will help elucidate the molecular pathogenesis of PDAC.

1. Introduction

Due to its aggressive nature, pancreatic ductal adenocarcinoma cancer (PDAC) is the deadliest of all solid cancers [1]. Patients with PDAC often present without symptoms and, by the time of diagnosis, exhibit lymph node and distant metastases as well as vessel invasion [2]. The prognosis of patients with PDAC has not been improved by surgery or current chemotherapy, with the 5-year survival rate remaining at only 5−7% [3]. Recently, molecular target therapies for several cancers have shown remarkable therapeutic efficacy; however, no targeted therapeutics are currently approved for treatment of PDAC [4]. Previous studies have demonstrated that KRAS, TP53 and SMAD are driver oncogenes in PDAC [5]. To improve prognosis, further studies are required to identify anticancer molecules. Comprehensive analysis of RNA networks in PDAC cells is indispensable for the development of novel therapeutic strategies for lethal PDAC.
Developing high-throughput genotyping technologies have been accelerated personalized medicine. Through the latest Genome-Wide Association Studies (GWAS) assays, several genetic risk variants involved in the risk of PDAC developing have been detected [6,7,8,9]. Importantly, GWAS catalogue shows that functional genetic variants revealed by GWAS were localized in non-coding region of human genome. In the near future, GWAS analyses may show variants of miRNAs and risk of developing PDAC.
MicroRNAs (miRNAs) are small non-coding RNAs (19–22 nucleotides, single stranded) that act to fine-tune the expression of protein-coding and non-coding RNAs in a sequence-specific manner [10,11,12,13,14,15]. As a unique characteristic of miRNAs, a single miRNA regulates a vast number of RNA transcripts within a cell [10,11,12,13,14,15]. Therefore, it is possible to identify novel RNA networks based on miRNA regulation using the latest genome analysis strategies in a given cell type. Accumulating evidence has shown that aberrantly expressed miRNAs actually act as oncogenes or tumor suppressors in human cancer cells and are involved in cancer pathogenesis [10,11,12,13,14,15].
In our continuing analyses of PDAC pathogenesis, we attempted to identify antitumor miRNAs and the cancer pathways that they control. Recently, we successfully created the miRNA expression signature of PDAC using RNA-sequencing technologies [16]. Based on antitumor miRNAs by miRNA signature, we have sequentially demonstrated novel RNA networks in PDAC cells [17,18,19,20]. Our previous studies showed significant downregulation of five miRNAs clustered on chromosome 2p16.1 (miR-217, miR-216a-5p, miR-216a-3p, miR-216b-5p and miR-216b-3p) in PDAC tissues, and ectopic expression of these miRNAs inhibited cancer cell migration and invasion [16,17]. A search of oncogenes targeted by miRNAs revealed that miR-216b-3p and miR-217 directly regulate Forkhead box Q1 (FOXQ1) and actin-binding protein Anillin (ANLN) in PDAC cells, respectively [16,17].In addition, FOXQ1 and ANLN were found to be overexpressed in PDAC clinical specimens and acted as oncogenes in PDAC cells [16,17].Searching for novel expression networks based on miRNAs is an effective strategy to identify molecular targets of PDAC.
RNA-sequencing analyses of miRNA expression signatures revealed that miR-204-5p was significantly downregulated in PDAC tissues. Although a tumor suppressor function of miR-204-5p has been reported in several cancers, miR-204-5p regulation of RNA networks in PDAC is still obscure. Here, we aimed to investigate the antitumor roles of miR-204-5p and to identify miR-204-5p-regulated oncogenes involved in PDAC pathogenesis. Comprehensive gene expression analyses and in silico database searches revealed that 25 putative targets are regulated by miR-204-5p in PDAC cells. Among these targets, high expression of seven genes (RACGAP1, DHRS9, AP1S3, FOXC1, PRP11, RHBDL2 and MUC4) was significantly associated with a poor prognosis of patients with PDAC according to analyses of The Cancer Genome Atlas (TCGA) database. In this study, we focused on RACGAP1 (Rac GTPase-activating protein 1) and performed further cell functional analyses. Our present data may provide new insights into the potential mechanisms of PDAC aggressiveness.

2. Results

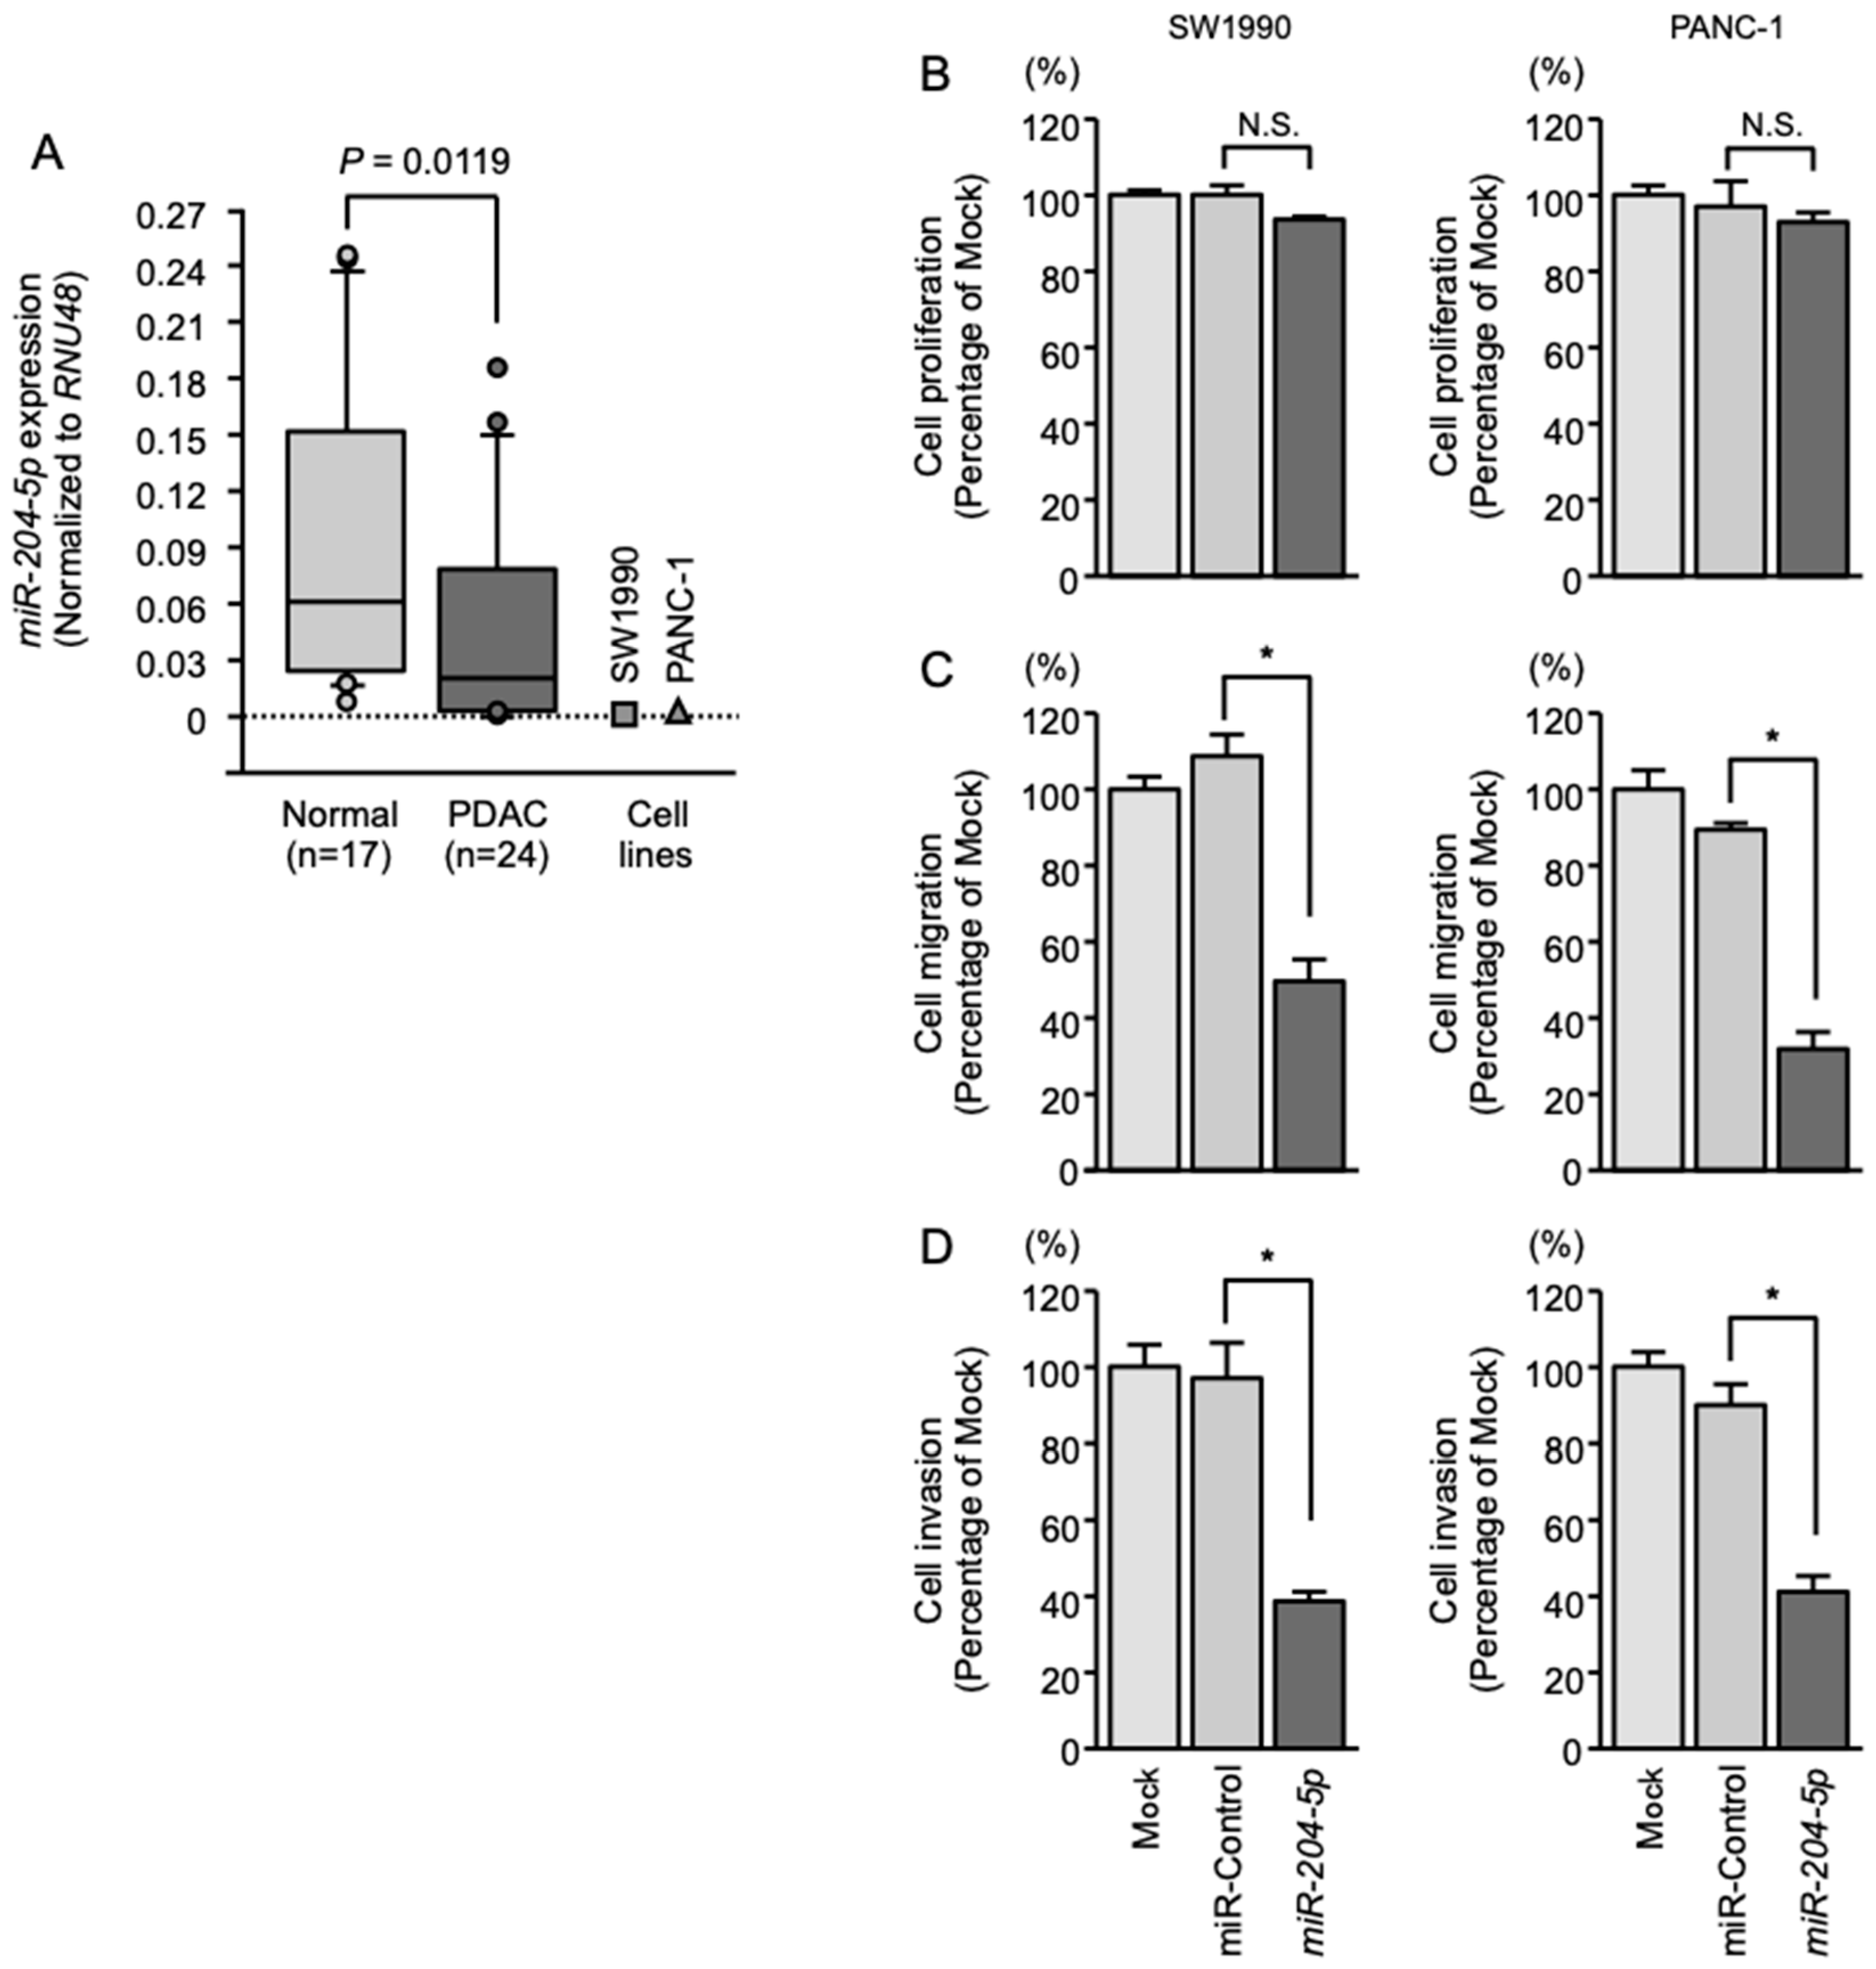
2.1. Expression of miR-204-5p in PDAC Specimens and Cell Lines

Expression of miR-204-5p was evaluated in normal pancreatic tissues (n = 17), PDAC tissues (n = 24) and PDAC cell lines (SW1990 and PANC-1). Expression of miR-204-5p was found to be significantly downregulated in the PDAC specimens and both cell lines than in normal pancreatic tissues (Figure 1A). The clinical features of the patients with PDAC and the normal tissues are summarized in Table 1; Table 2, respectively.

2.2. Effects of Overexpressing miR-204-5p on the Proliferation, Migration and Invasion of PDAC Cells

To evaluate the antitumor effects of miR-204-5p, we applied gain-of-function assays (mature miRNAs transfection) in PDAC cell lines (SW1990 and PANC-1). PDAC cell proliferation was not affected by miR-204-5p overexpression (Figure 1B). In contrast, ectopic expression of miR-204-5p significantly prevented PDAC cell migration and invasion (Figure 1C,D).

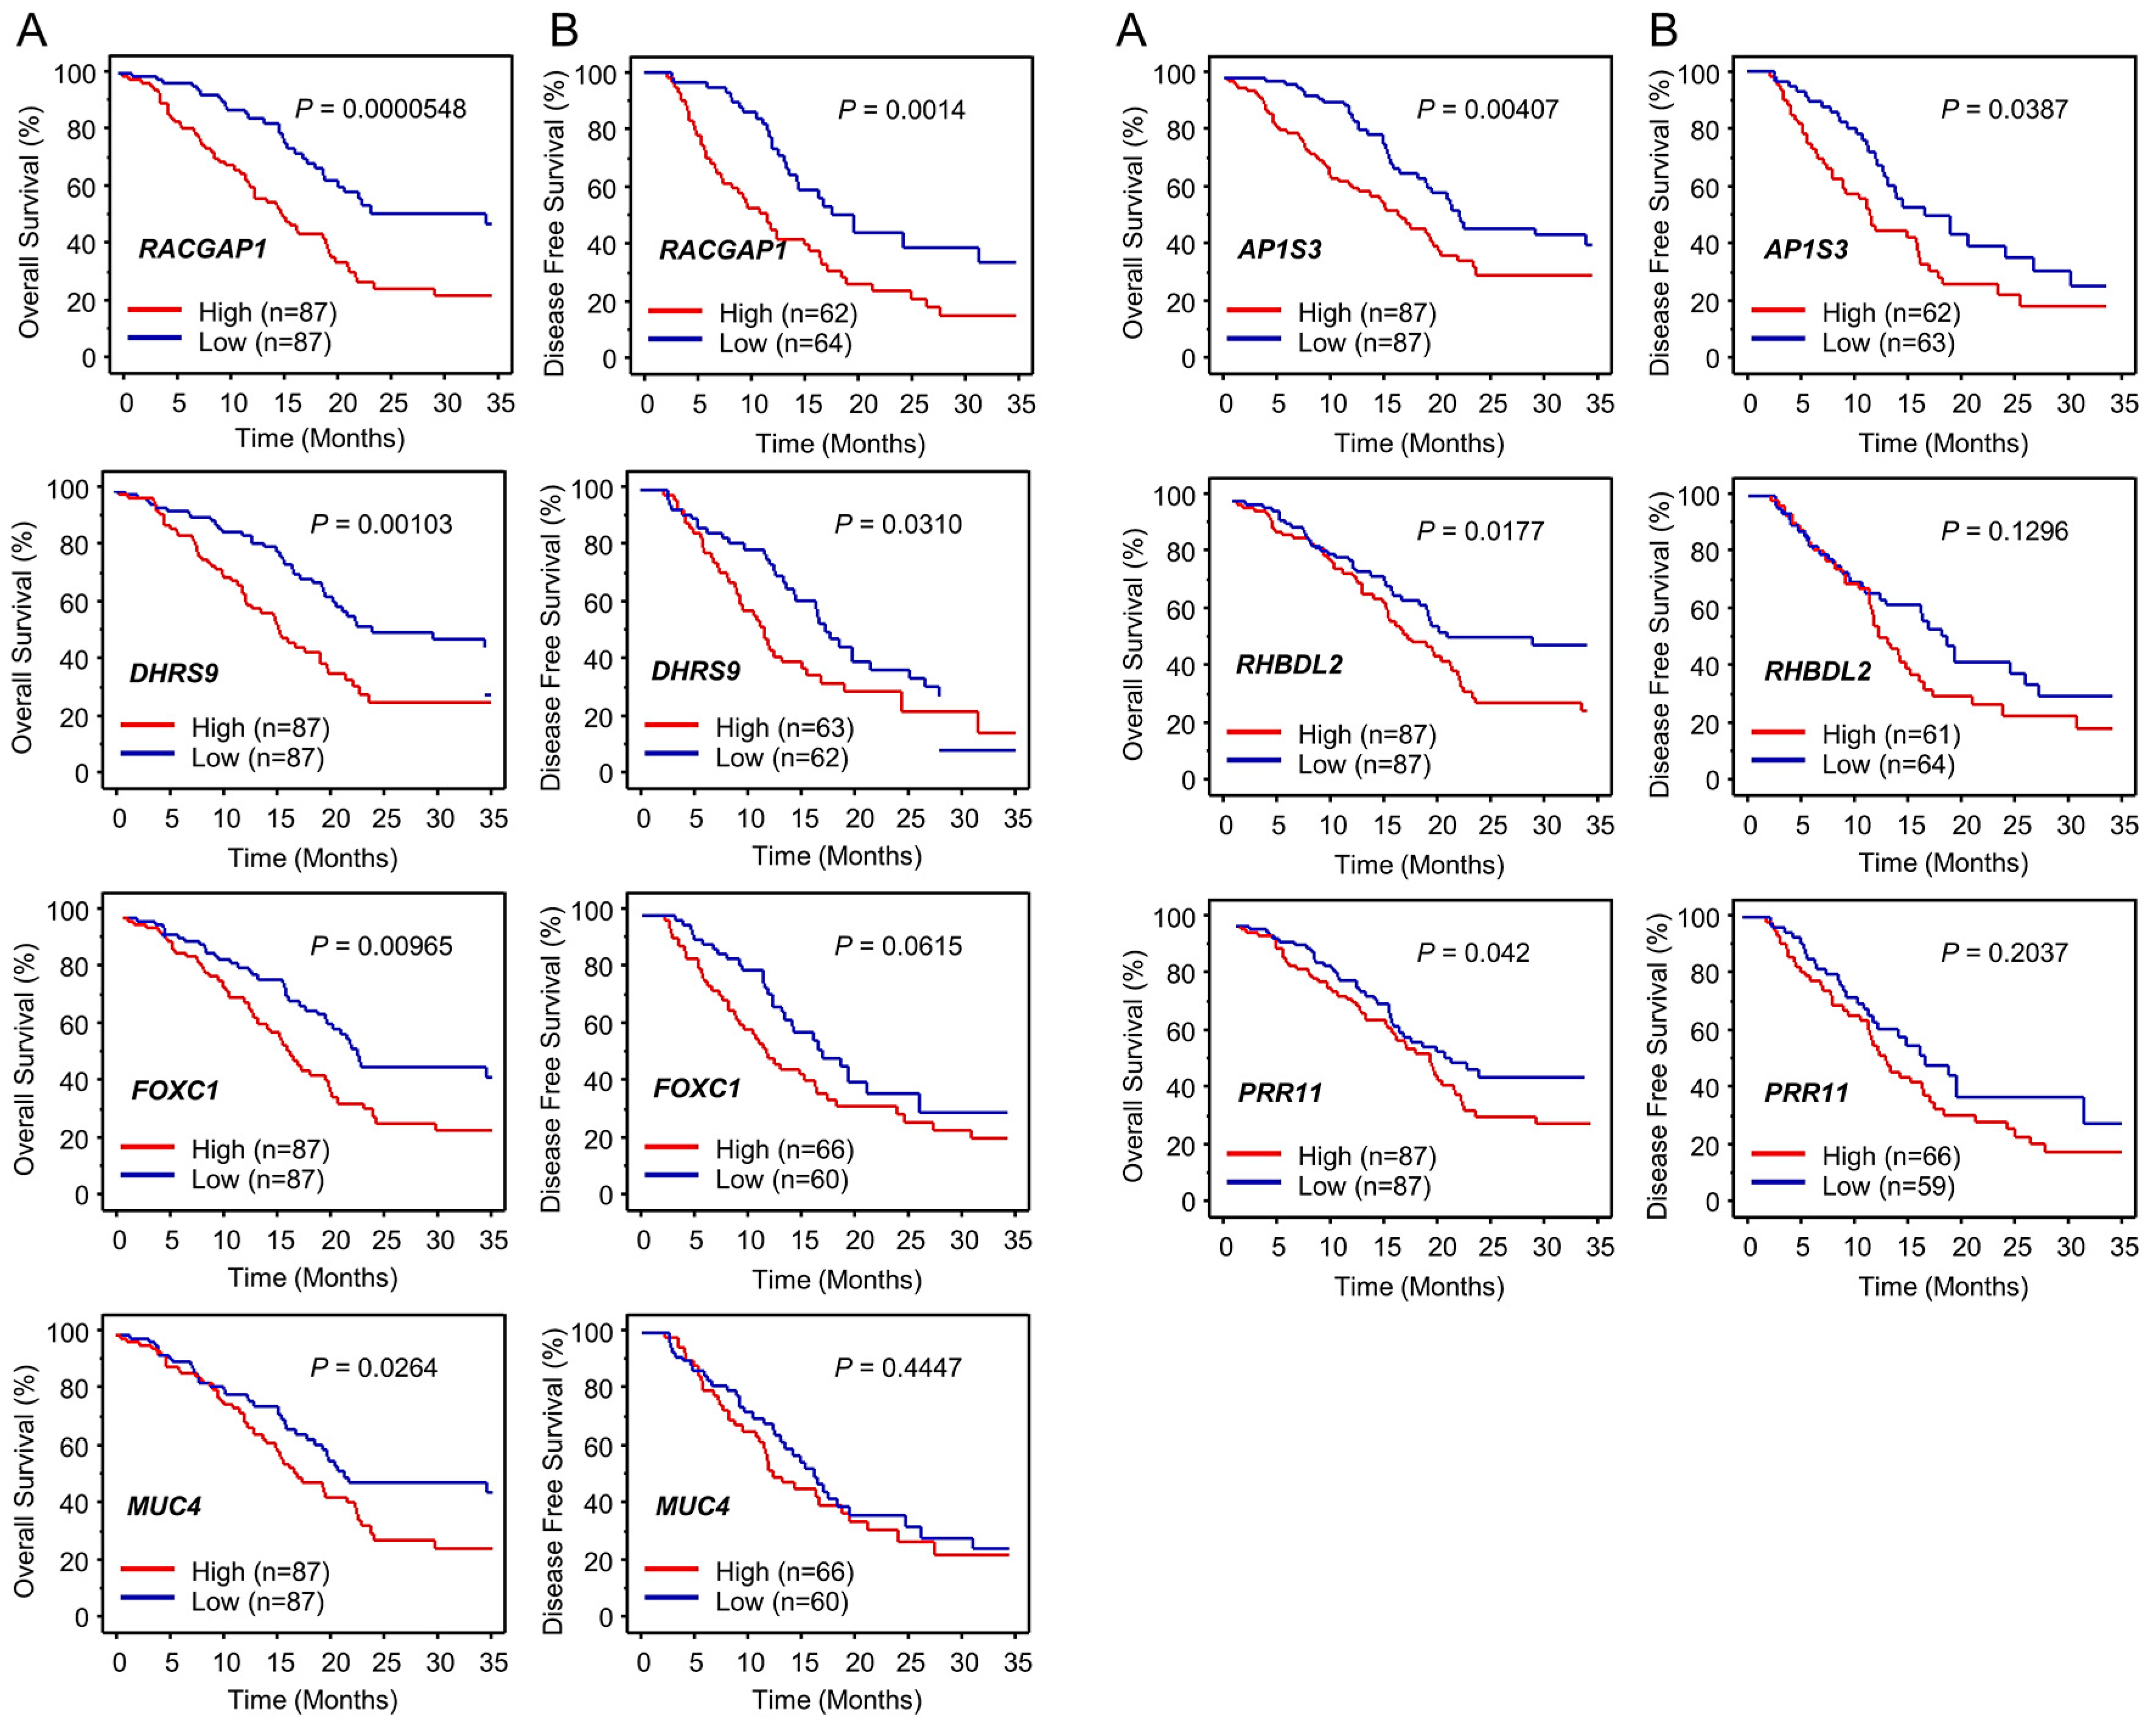
2.3. Identification of Putative Genes Regulated by miR-204-5p in PDAC Cells and Their Clinical Significance

To identify putative oncogenes regulated by miR-204-5p in PDAC cells, in silico analyses were combined with the results of our genome-wide gene expression analyses using an oligonucleotide microarray (in SW1990 cells transfected with miR-204-5p; Gene Expression Omnibus (GEO) accession number: GSE115801). Our strategy to identify putative target genes regulated by miR-204-5p in PDAC cells is shown in Figure S1. From these analyses, 25 genes were identified as candidate oncogenes regulated by miR-204-5p in PDAC (Table 3).
Next, to investigate the clinical significance of these target genes, we determined the relationships between gene expression levels and prognosis (i.e., OS (overall survival) and DFS (disease-free survival) rates) in patients with PDAC using data from TCGA database. Significant associations were detected between upregulated expression of seven genes (RACGAP1, DHRS9, AP1S3, FOXC1, RHBDL2, MUC4 and PRR11) and a poor prognosis in patients with PDAC (OS: p < 0.05) (Table 3 and Figure 2).
We also investigated the pathway analyses using miR-204-5p controlled downregulated genes. Several pathways were identified as miR-204-5p controlled pathways, e.g., “Regulation of actin cytoskeleton”, “Cytokine-cytokine receptor interaction”, “MAPK signaling pathway” and “Endocytosis” (Table S1). In this study, we focused on RACGAP1 because its expression level was most significantly associated with a poor prognosis in patients with PDAC (OS: p = 0.0000548; DFS: p = 0.0014) (Figure 2).

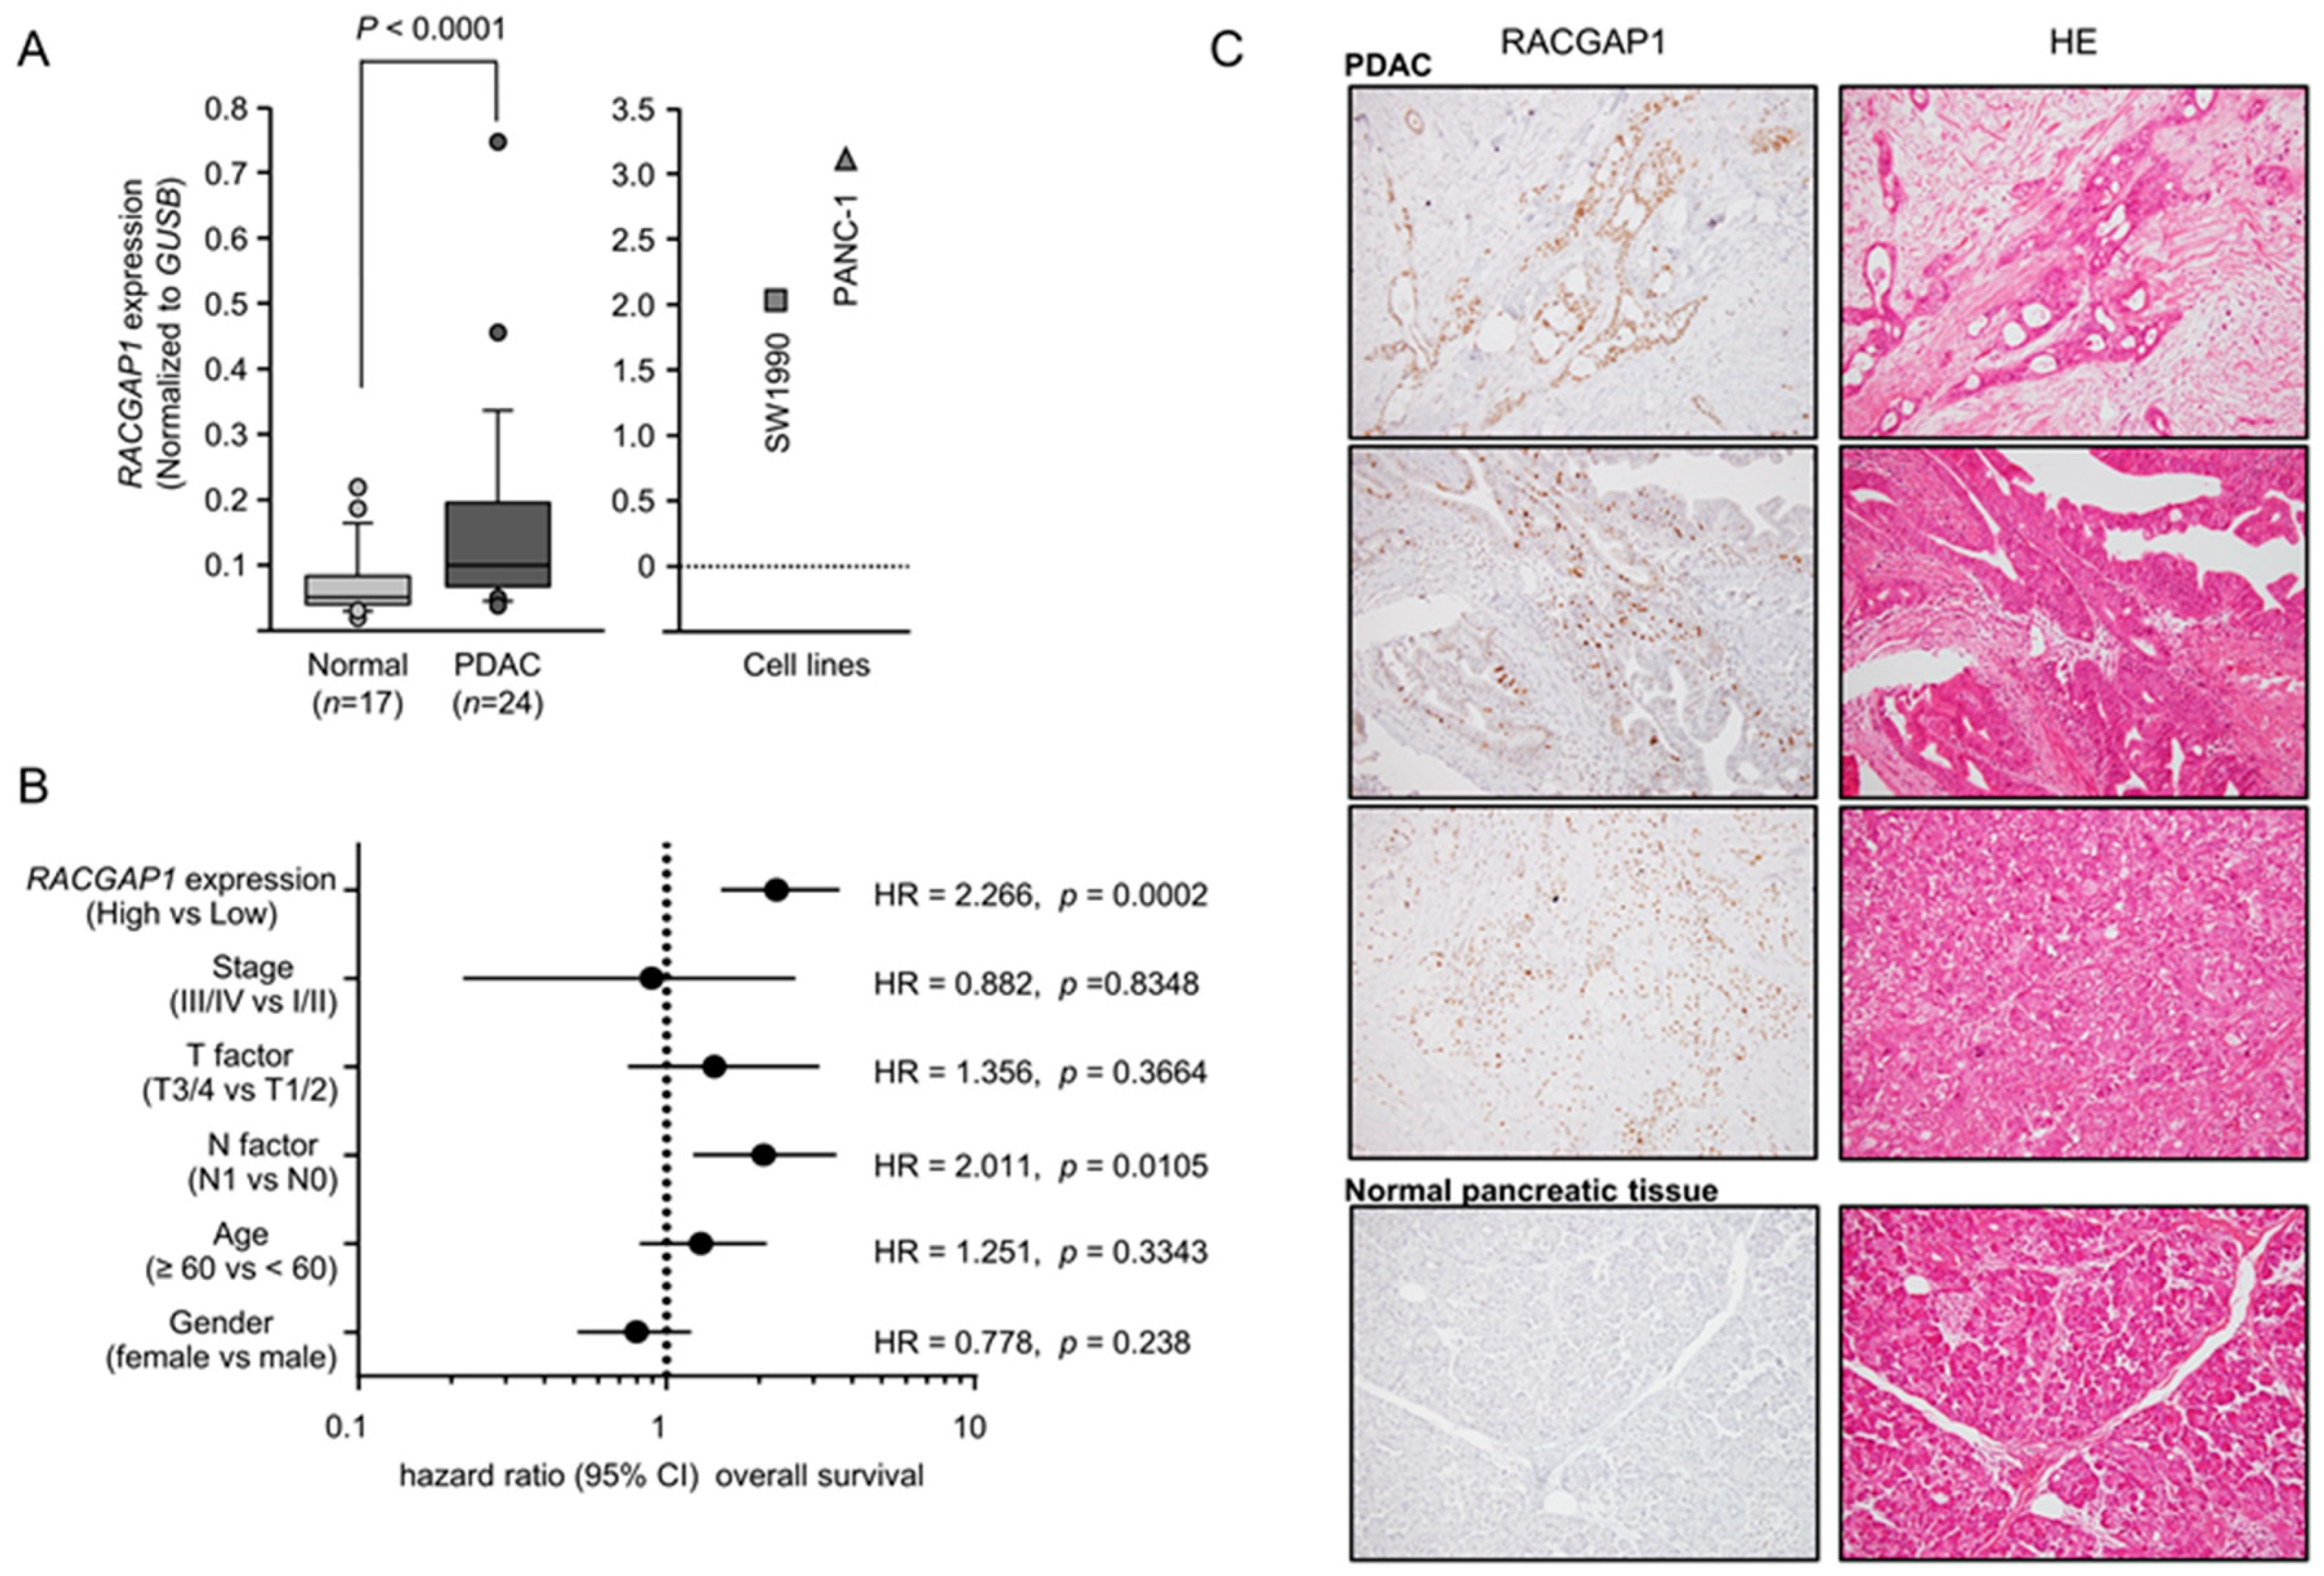
2.4. Expression of RACGAP1 in PDAC Clinical Specimens and Its Clinical Significance

The mRNA expression level of RACGAP1 was significantly upregulated in PDAC tissues (Figure 3A). Negative correlations between RACGAP1 mRNA expression and miR-204-5p expression were analyzed by Spearman’s rank test (R = −0.381, p < 0.0070, Figure S2). We extracted samples of PDAC from the TCGA database. We analyzed clinicopathological factors of miR-204-5p and RACGAP1 expression (miR-204-5p; Figures S3 and S4, RACGAP1). The recurrence of RACGAP1 showed high expression with a significant difference (p < 0.0015). Immunostaining revealed expression of the RACGAP1 protein in PDAC lesions but a lack of expression in noncancerous epithelial tissues (Figure 3C).
Kaplan-Meier analyses showed that OS and DFS rates were significantly lower in patients with PDAC exhibiting elevated RACGAP1 expression compared with low expression (Figure 2). The clinical significance of RACGAP1 expression in terms of OS in patients with PDAC was further assessed by univariate and multivariate Cox hazard regression analyses. RACGAP1 expression was an independent predictor of OS according to the multivariate analysis (hazard ratio = 2.266, p = 0.0002; Figure 3B).
In addition, TCGA database analyses showed that high expression of RACGAP1 was closely associated with poor prognosis (3-year overall survival) of several cancers, e.g., kidney renal papillary cell carcinoma, hepatocellular carcinoma, lung adenocarcinoma, sarcoma and skin cutaneous melanoma (Figure S5).

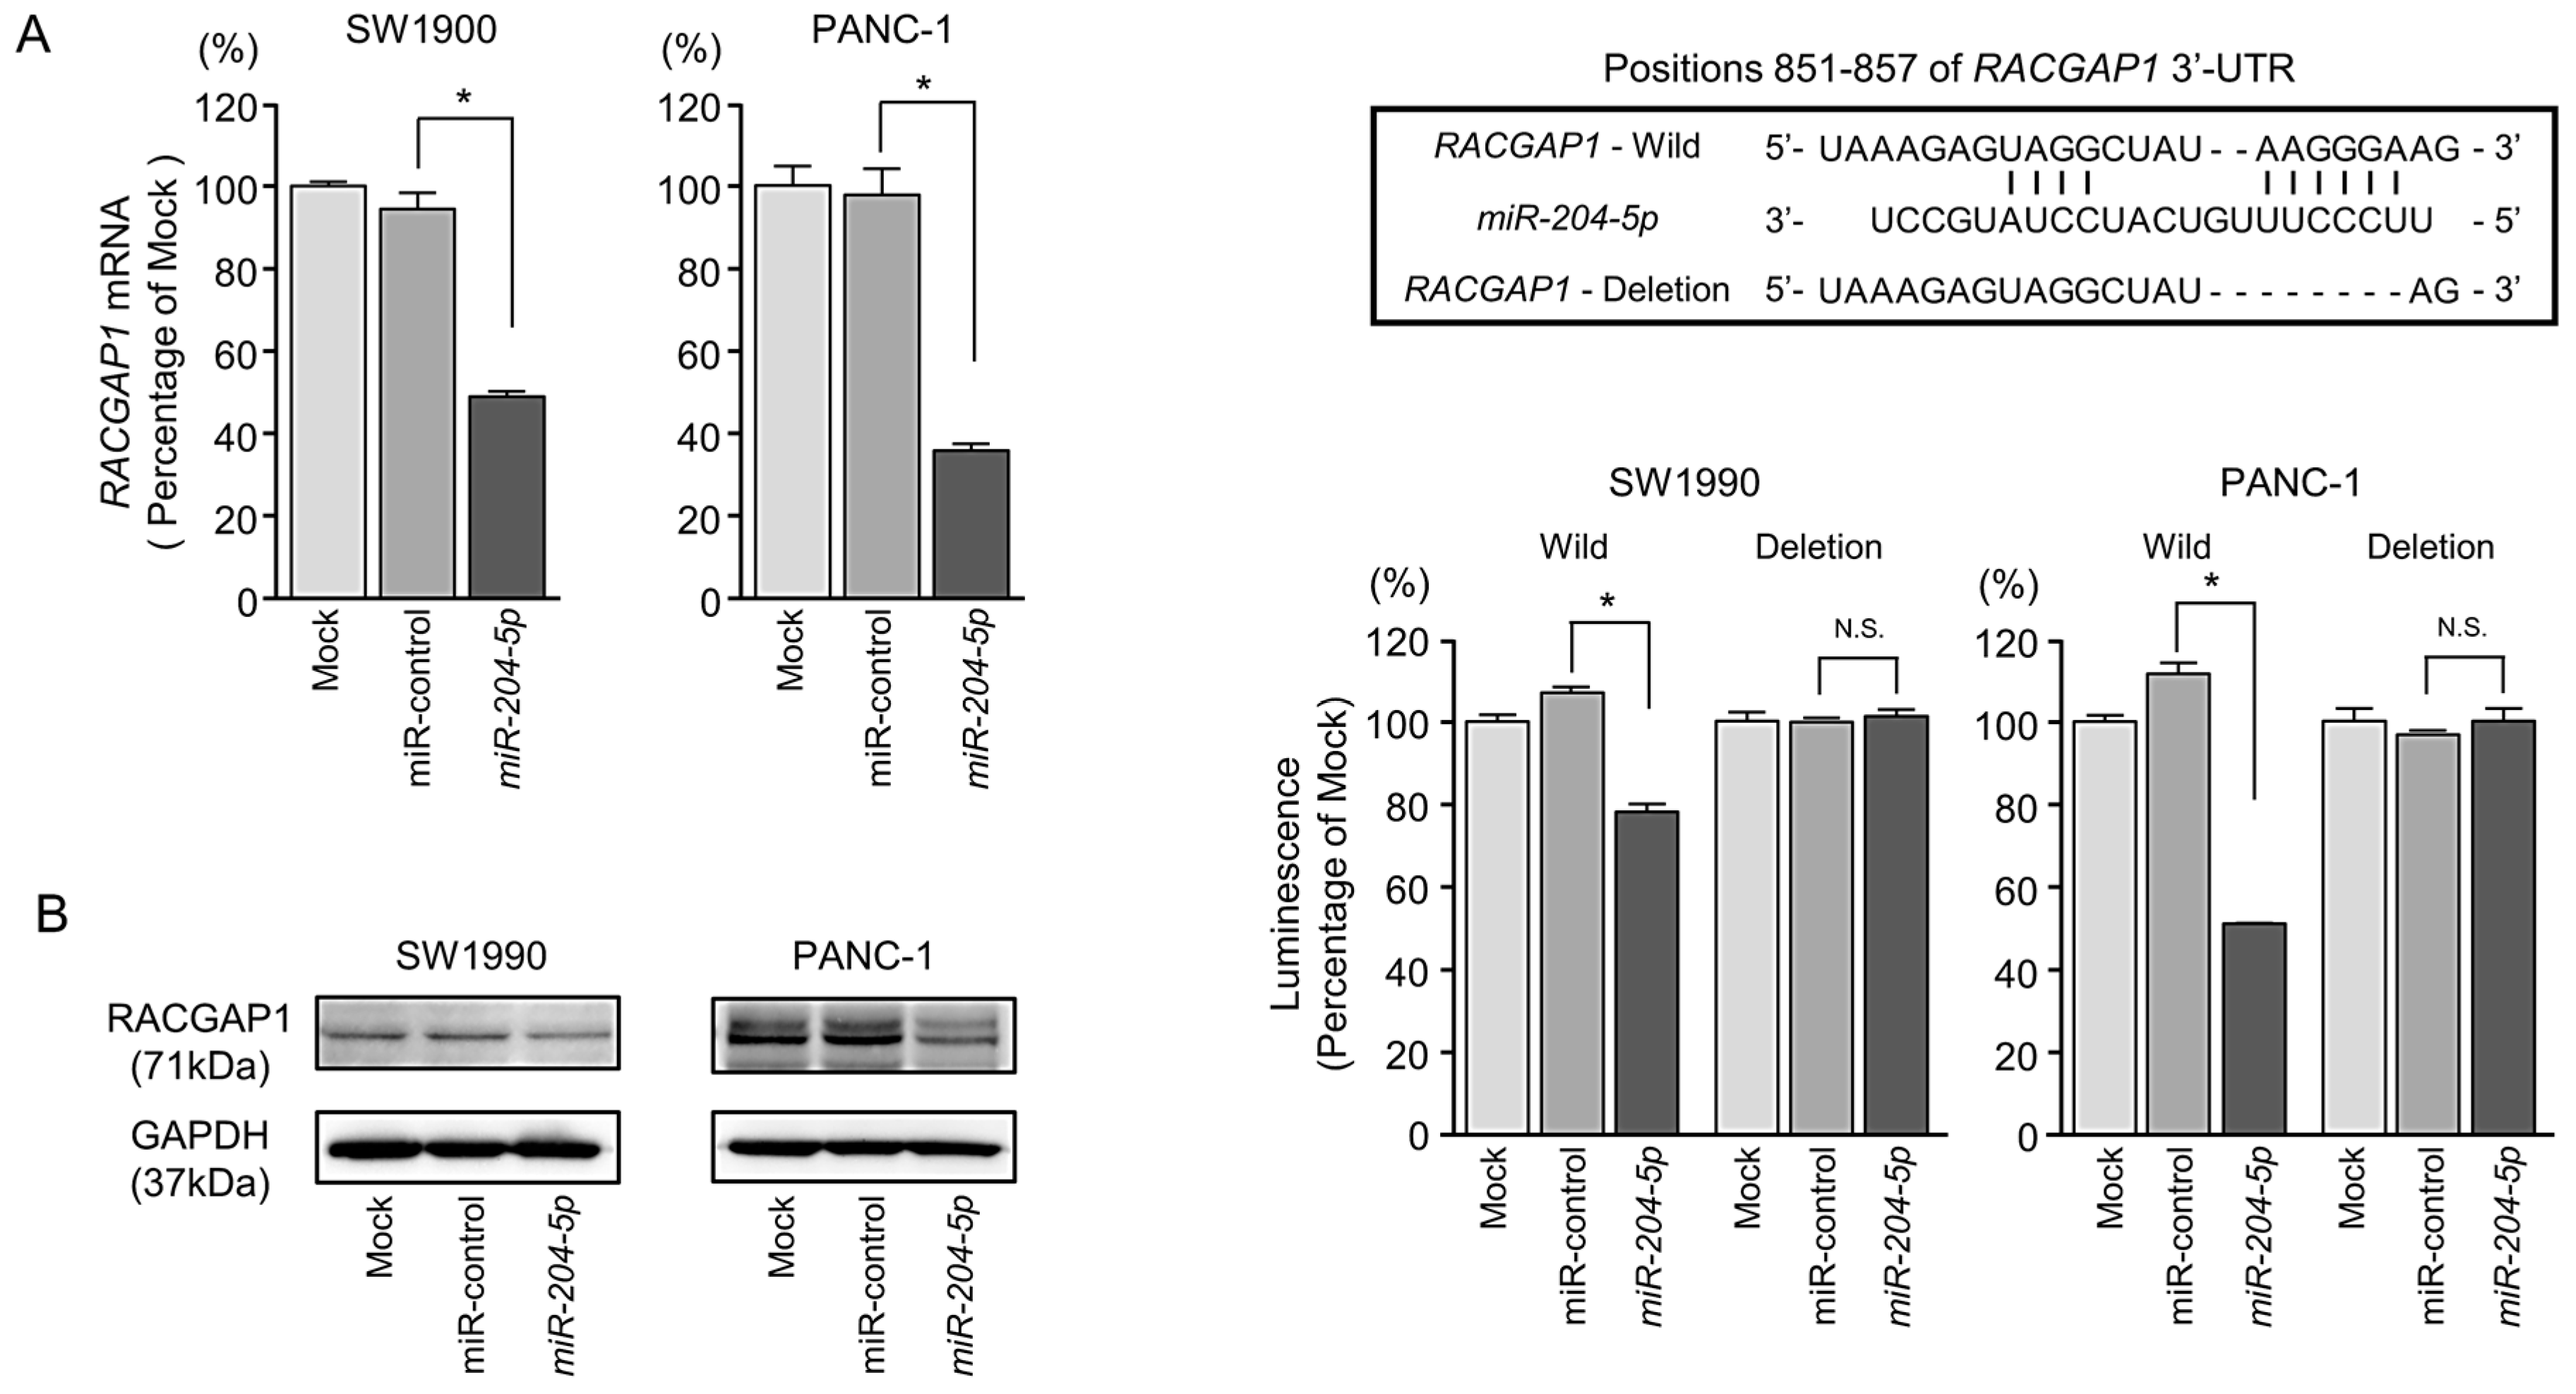
2.5. Direct Regulation of RACGAP1 by miR-204-5p in PDAC Cells

We then assessed whether miR-204-5p regulates the expression of RACGAP1 in PDAC cells. We first confirmed significant downregulation of RACGAP1 mRNA (Figure 4A) and protein (Figure 4B) levels in PDAC cells (SW1990 and PANC-1) transfected with miR-204-5p by qRT-PCR and western blotting, respectively.
According to the TargetScanHuman 7.2 database, RACGAP1 harbors one binding site for miR-204-5p at nucleotide positions 851-857 in the 3′-UTR (Figure 4C, upper).
Next, we performed dual luciferase reporter assays to determine whether this site within RACGAP1 is directly targeted by miR-204-5p by transfecting cells with plasmids harboring wild-type RACGAP1 or RACGAP1 with deletion of positions 851–857 in the 3′-UTR. miR-204-5p suppressed luciferase reporter activity in SW1990 and PANC-1 cells transfected with the wild-type RACGAP1 vector compared with the mock- or miR-control-transfected cells. On the other hand, luciferase reporter activity was not decreased in cells transfected with the vector harboring the RACGAP1 3′-UTR deletion (Figure 4C, lower). These results suggest that miR-204-5p directly binds to putative binding site within the 3′-UTR of RACGAP1.

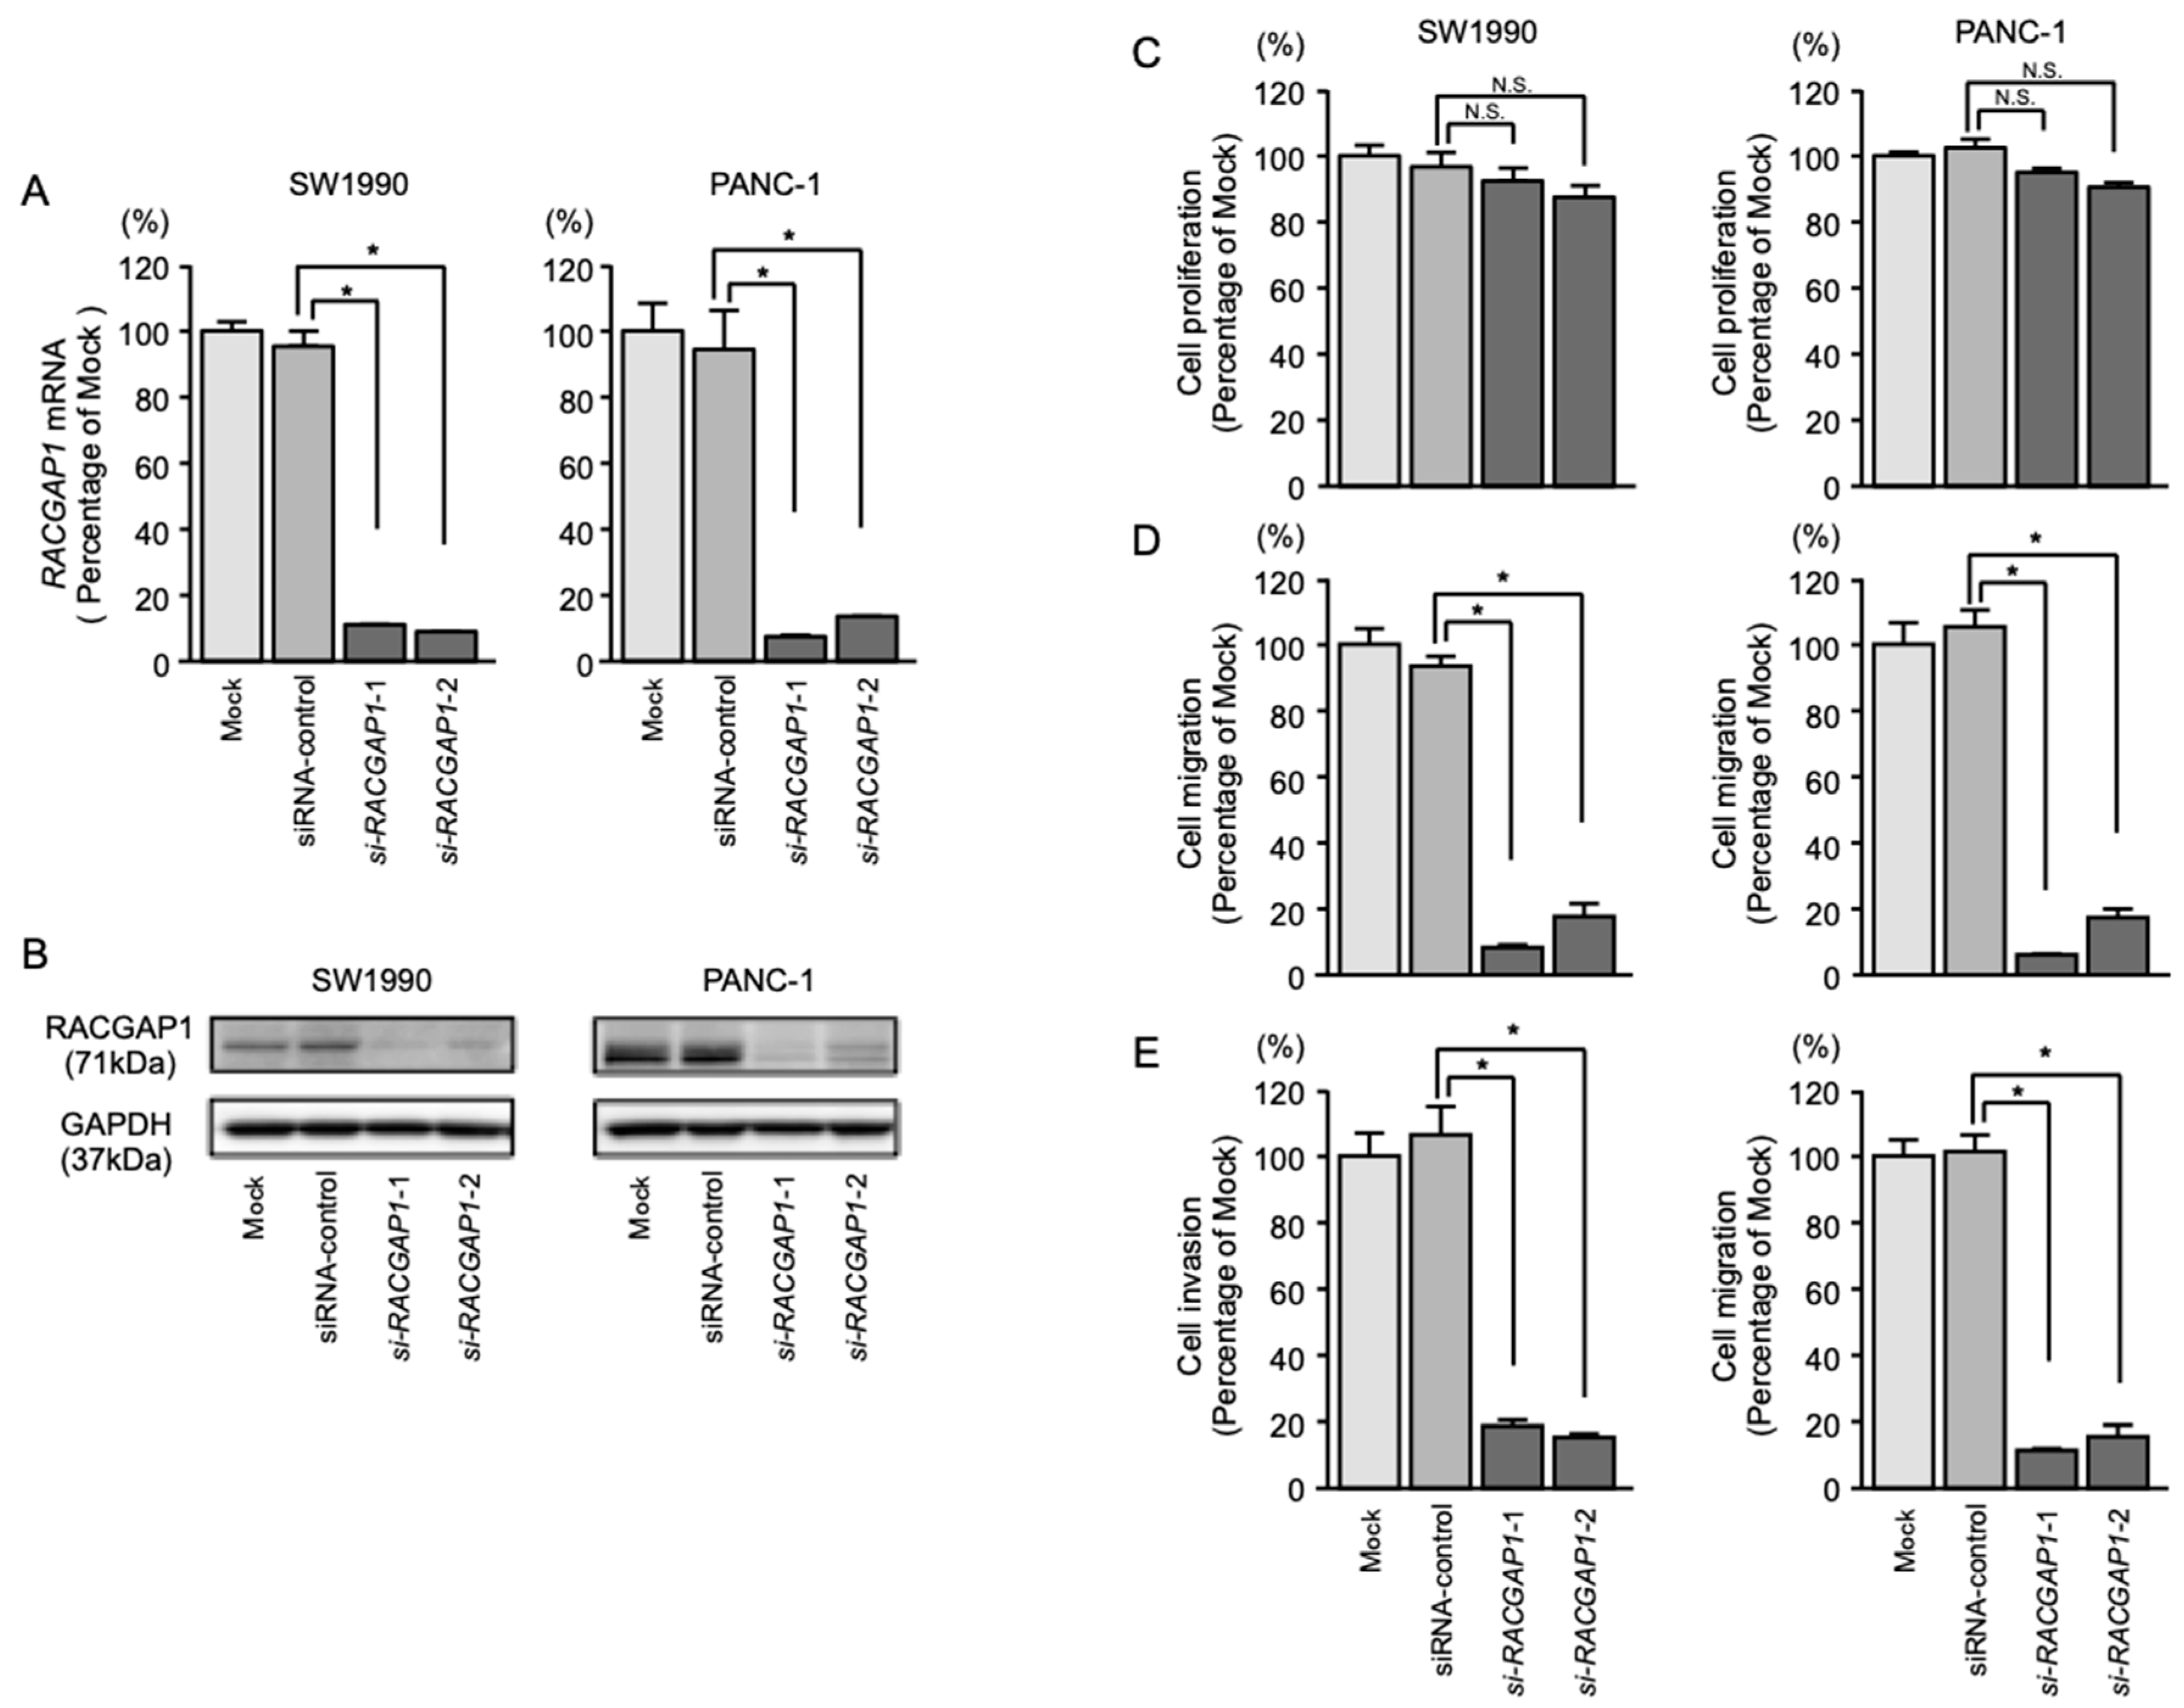
2.6. Effects of RACGAP1 Knockdown on the Proliferation, Migration and Invasion of PDAC Cells

To assess the function of RACGAP1 in PDAC cells, loss-of-function assays using siRNAs targeting RACGAP1 (si-RACGAP1) were performed. High expression levels of RACGAP1 in two cell lines, SW1990 and PANC-1, were confirmed by PCR (Figure 3A). We evaluated the knockdown efficiency of RACGAP1 in si-RACGAP1-transfected SW1990 and PANC-1 cells and confirmed downregulation of RACGAP1 mRNA and protein levels (Figure 5A,B).
Cancer cell migration and invasion were significantly inhibited in si-RACGAP1-transfected cells compared with mock- or siRNA-control-transfected PDAC cells. However, transfection of si-RACGAP1 did not significantly affect cell proliferation (Figure 5C–E).
EMT-related genes were selected and picked up from gene expression analysis data (GSE115801 and GSE115909). Our array data showed that expression of SNAL3 and vimentin were reduced by si-RACGAP1 transfection into SW1990 cells. Expression of fibronectin 1 was reduced by miR-204-5p transfection into SW1990 cells (Tables S3 and S4).

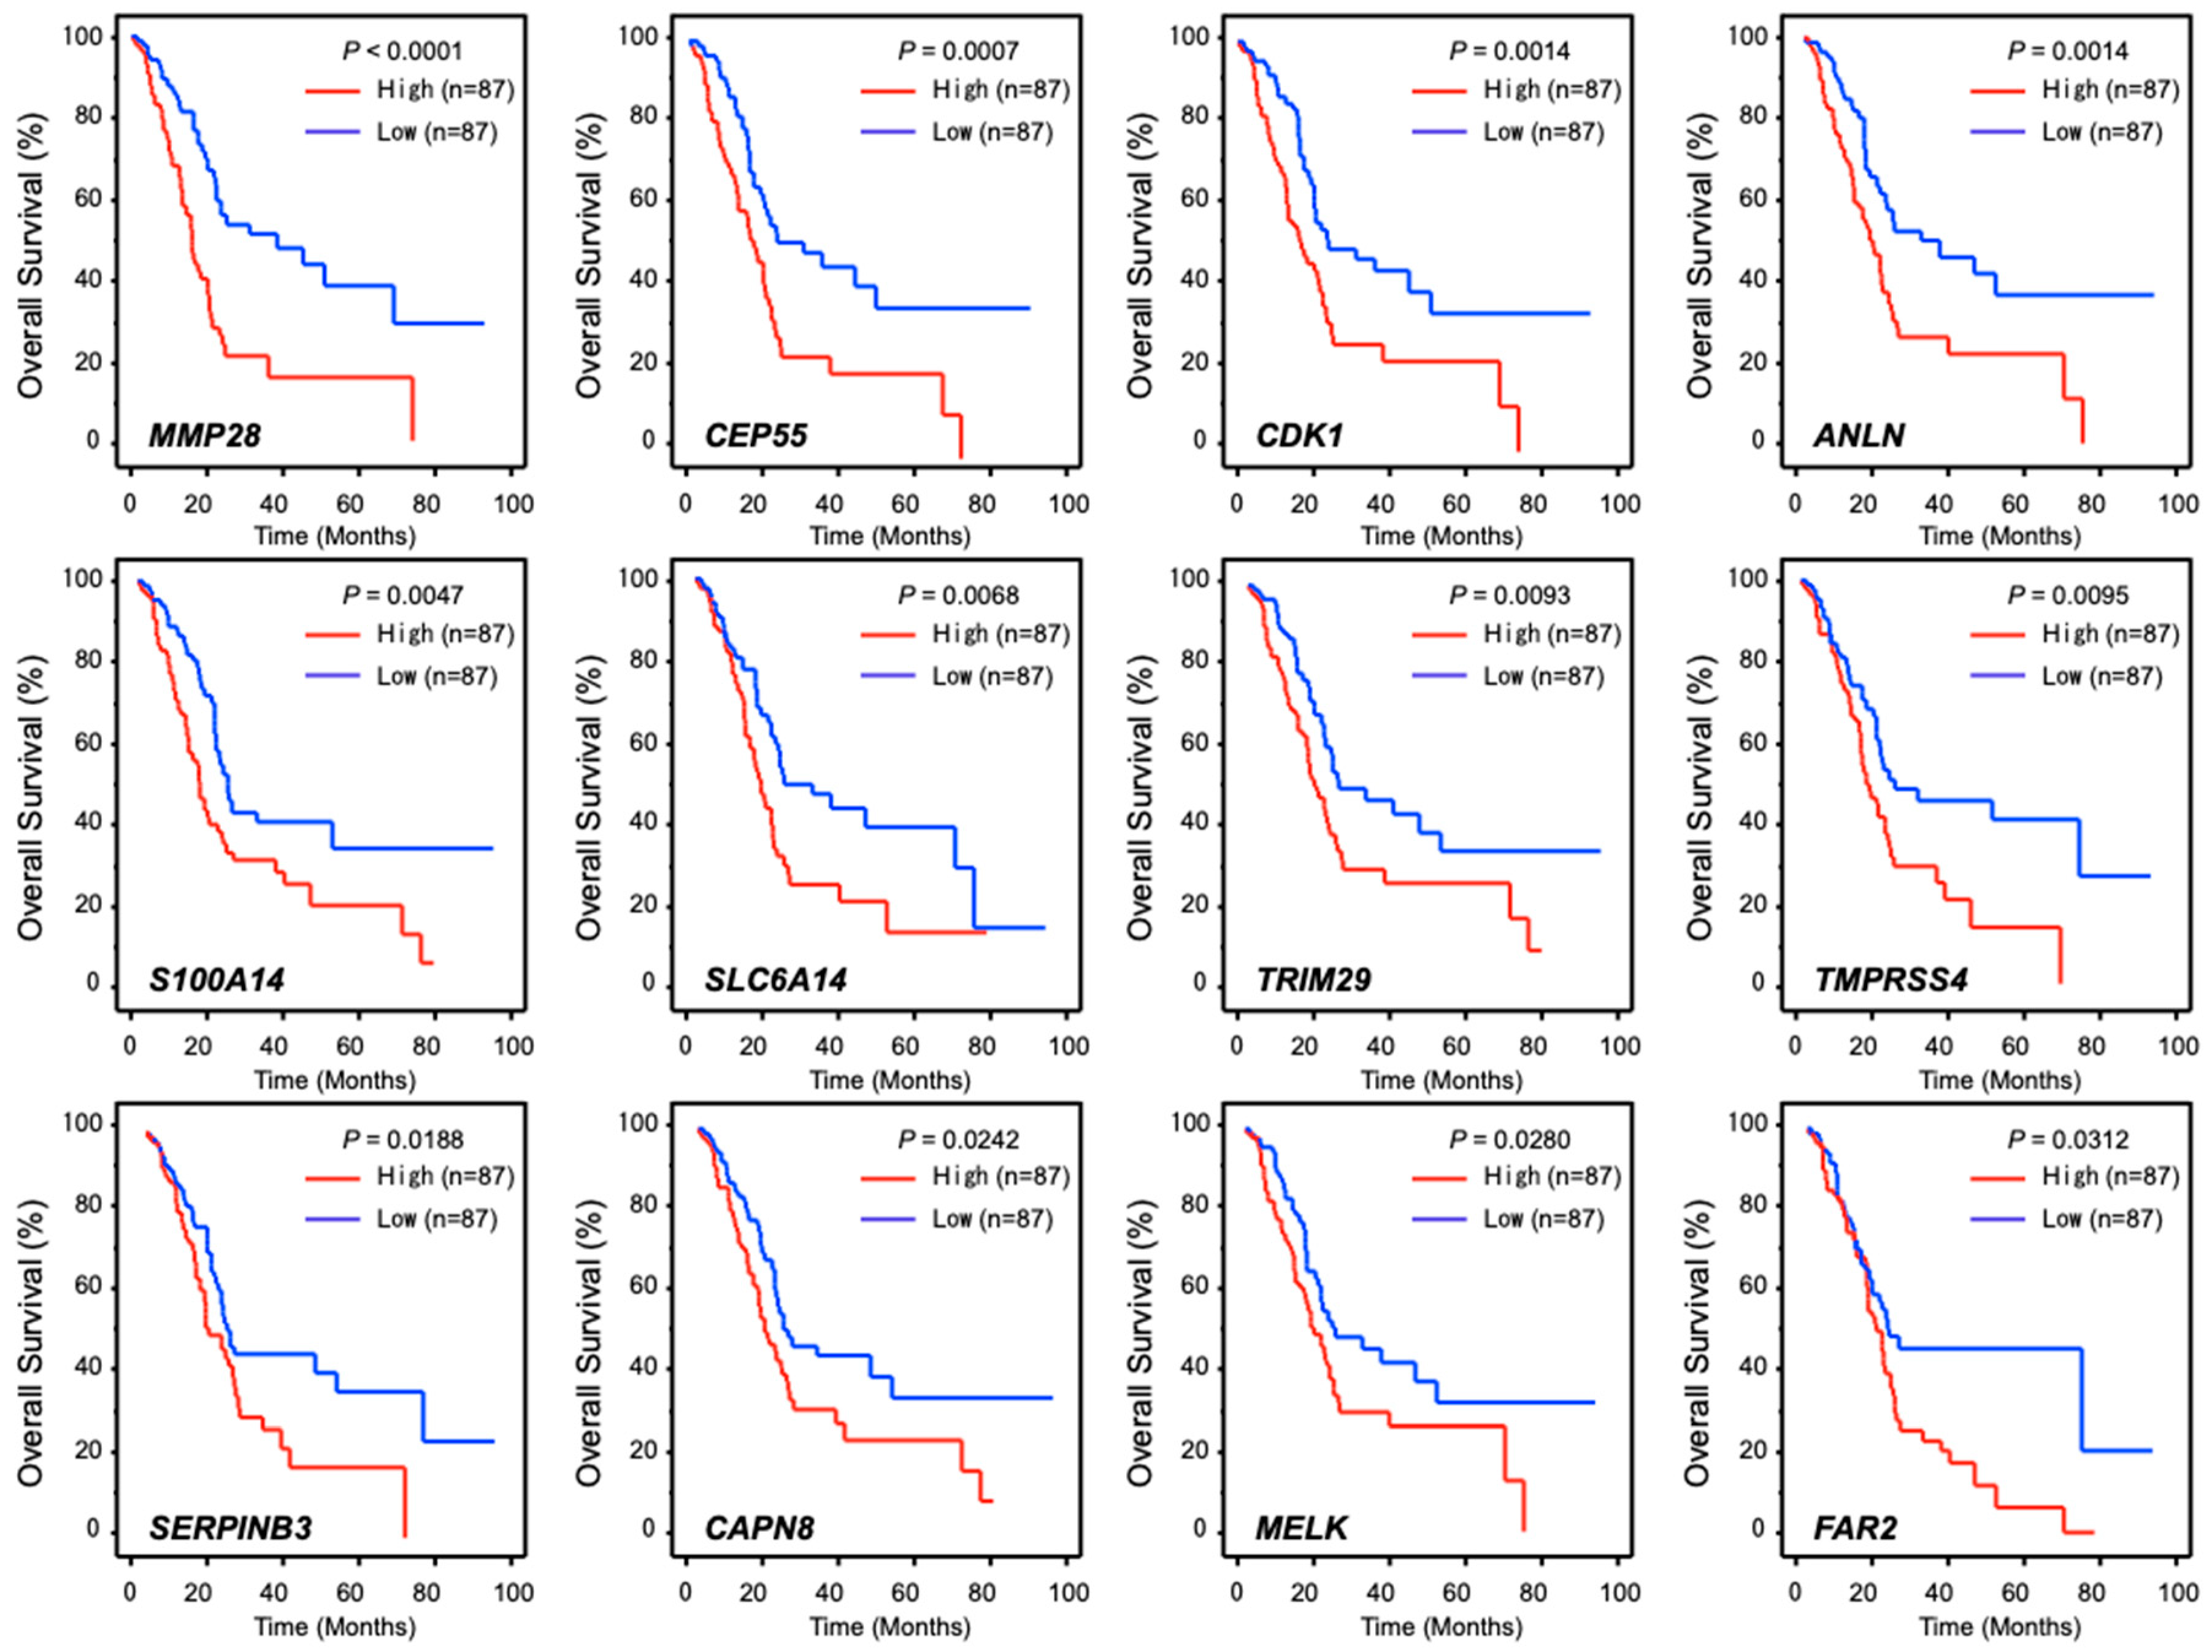
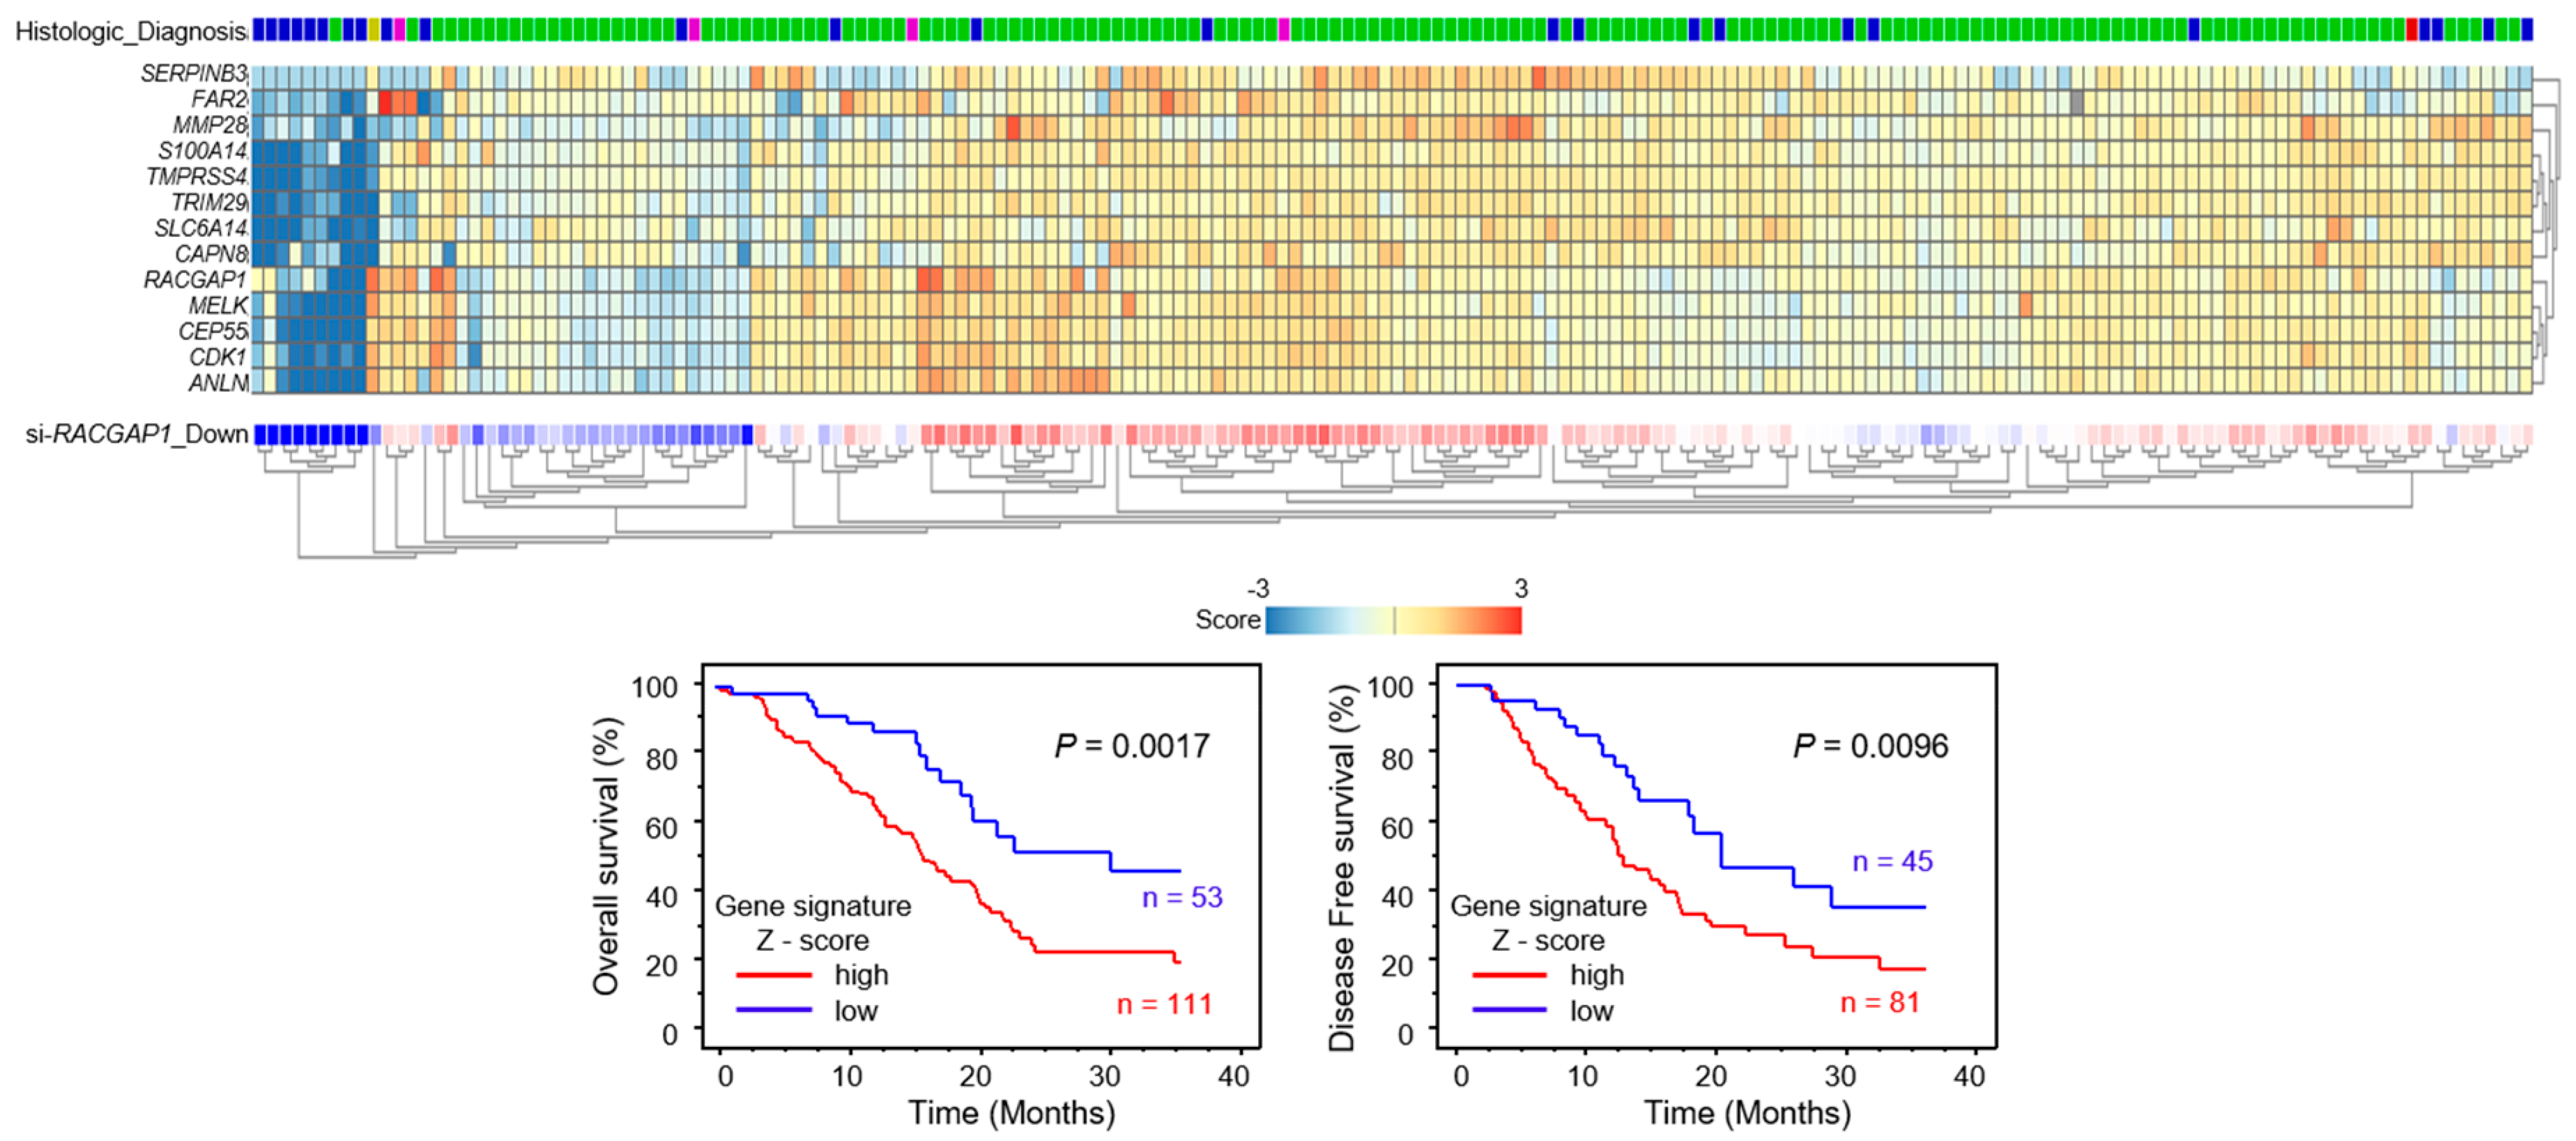
2.7. Identification of RACGAP1-Regulated Genes in PDAC Cells

To identify genes affected downstream of RACGAP1, we applied genome-wide gene expression analyses using SW1990 cells transfected with si-RACGAP1. The gene expression data were deposited in the GEO database (GEO accession number; GSE115909). Our strategy to identify RACGAP1-regulated genes is shown in Figure S6. Using this strategy, we identified 64 putative genes affected by RACGAP1 in PDAC cells (Table 4). Among these genes, high expression levels of 12 genes (MMP28, CEP55, CDK1, ANLN, S100A14, SLC6A14, TRIM29, TMPRSS4, SERPINB3, CAPN8, MELK and FAR2) were significantly associated with overall survival in patients with PDAC, according to analyses of data from TCGA database (Figure 6).
Furthermore, we provided a heatmap gene visualization and validated as a prognostic ability of these 12 genes (Figure 7). As shown in Figure 7, patients with high gene signature expressions (Z-score > 0) were significantly poor OS and DFS rate than those with low gene signature expressions (Z-score ≤ 0) (OS; p = 0.0017, DFS; p = 0.0096, Figure 7). To explore the molecular network controlled by RACGAP1 in PDAC cells, we performed pathway analyses using RACGAP1 mediated downregulated genes (Table S2).
Clinical significance of the expression levels of 12 genes (MMP28, CEP55, CDK1, ANLN, S100A14, SLC6A14, TRIM29, TMPRSS4, SERPINB3, CAPN8, MELK and FAR2) based on data from The Cancer Genome Atlas database. Kaplan-Meier plots of overall survival with log-rank tests comparing the survival of PDAC patients with high (red lines) versus low (blue lines) expression levels of each of the abovementioned genes.

3. Discussion

Numerous protein-coding and noncoding RNAs can be regulated by a single miRNA. Altered miRNA expression can disrupt RNA networks within cancer cells; therefore, manipulation of miRNA expression in cancer cells will help identify novel RNA networks with critical roles in cancer. To obtain novel therapeutic targets in PDAC, we sequentially identified antitumor miRNA-regulated oncogenes and pathways based on our original PDAC miRNA signature [16].
In this study, we focused on miR-204-5p and its regulated genes involved in PDAC pathogenesis. Previous studies indicated that miR-204-5p is downregulated in several cancers, and that restoration of miR-204-5p expression inhibits cancer cell proliferation, migration and invasion [21,22,23]. Our recent study showed greatest downregulation of miR-204-5p in triple-negative breast cancer (TNBC) tissues according to the miRNA signature of TNBC [24]. Ectopic expression of miR-204-5p in TNBC cells inhibited cancer cell migration and invasion, suggesting that miR-204-5p acts as an antitumor miRNA in these cells [24]. We reported that miR-204-5p is a pivotal antitumor miRNA preventing cancer cell progression. We are also interested in the RNA networks controlled by miR-204-5p according to cancer cell type.
Analyses of RNA networks regulated by miR-204-5p will contribute to our understanding of cancer pathogenesis. Our study identified a total of 25 genes as putative oncogenes by miR-204-5p regulation in PDAC cells. Among these targets, the high expression levels of seven genes (RACGAP1, DHRS9, AP1S3, FOXC1, PRP11, RHBDL2 and MUC4) were significantly predictive of a poor prognosis in PDAC patients. These genes are highly involved in PDAC pathogenesis and are important landmarks for elucidating the molecular mechanisms underlying the aggressiveness of PDAC cells.
For example, overexpression of FOXC1 (forkhead box C1), a member of the forkhead box of transcription factors, has been observed in several cancers [25]. Previous studies showed that aberrant expression of FOXC1 enhances epithelial-to-mesenchymal transition and drug resistance [26,27]. In PDAC cells, FOXC1 was found to be a pivotal regulator of insulin-like growth factor 1 receptor signaling, and aberrant activation of this signaling pathway contributed to PDAC cell aggressiveness, metastasis and an epithelial-to-mesenchymal transition phenotype [28]. These findings suggest that FOXC1 is a potential therapeutic target for several cancers, including PDAC. Overexpression of MUC4 (mucin 4), a transmembrane mucin, has been observed frequently in several cancers, including PDAC [29]. Mucins not only protect the epithelium from adverse conditions but also help transmit several signals into the cell [30]. The functions of MUC4 are mediated by multiple receptors, and MUC4 overexpression contributed to tumorigenesis, metastasis and drug resistance in PDAC cells [31]. Recently, we showed overexpression of AP1S3 in TNBC specimens, and silencing of AP1S3 inhibited the proliferation, migration and invasion of TNBC cells [24]. Previous studies showed that FOXC1 was directly regulated by antitumor miR-204-5p in laryngeal squamous cell carcinoma and endometrial cancer [32]. Furthermore, AP1S3 was directly regulated by miR-204-5p in TNBC cells [24]. The miR-204-5p target genes identified in our present study are highly involved in cancer pathogenesis.
We focused on RACGAP1 because its elevated expression was most significantly predictive of a poor prognosis in PDAC patients (p = 0.0000548). Based on analysis of TCGA database, high expression of RACGAP1 is significantly associated with breast cancer, lung adenocarcinoma, papillary renal cell carcinoma, hepatocellular carcinoma and cutaneous melanoma. These data suggest that aberrant expression of RACGAP1 is involved in cancer pathogenesis. As a GTPase-activating protein, RACGAP1 binds to activated G proteins to stimulate GTP hydrolysis, which in turn inactivates the G protein [33]. The function of GTPase-activating proteins opposes that of guanine nucleotide exchange factors, which stimulate G protein activation [34].
Our present data showed that RACGAP1 was overexpressed in PDAC clinical specimens, and silencing of RACGAP1 inhibited cancer cell migration and invasion. Our data suggest that RACGAP1 acts as an oncoprotein rather than a tumor suppressor in PDAC cells. Recent studies reported overexpression of RACGAP1 in several types of cancers (e.g., gastric cancer, colorectal cancer, uterine carcinosarcoma, hepatocellular carcinoma and epithelial ovarian cancer), and its aberrant expression was associated with poor prognosis in patients with these cancers [35,36,37,38,39]. In ovarian cancer, it was found that RACGAP1 expression enhanced activation of RHOA and ERK proteins, and activation of its signaling induced cancer cell migration and invasion. In uterine carcinosarcoma cells, RACGAP1 positively regulated STAT3 phosphorylation and survivin expression, and these activated signaling pathways induced an invasive phenotype [37]. In squamous cell carcinoma, RACGAP1 was found to be regulated by the E2F7 transcription factor, and its expression enhanced doxorubicin resistance [39]. These findings suggest that overexpression of RACGAP1 is related to growth, progression, metastasis and drug resistance in various cancers.
Finally, to investigate RACGAP1-regulated oncogenes and cancer-associated pathways in PDAC, we performed genome-wide expression analyses in PDAC cells after knockdown of RACGAP1. A total of 64 genes were identified as putative targets of RACGAP1. Among these targets, expression of 12 genes (MMP28, CEP55, CDK1, ANLN, S100A14, SLC6A14, TRIM29, TMPRSS4, SERPINB3, CAPN8, MELK and FAR2) was closely associated with a worse prognosis in patients with PDAC. Interestingly, aberrant expression of the actin-binding protein ANLN (anillin) was detected in PDAC clinical specimens, and knockdown of ANLN markedly inhibited the migration and invasion of PDAC cell lines [17]. In addition, that same study found that ANLN was directly controlled by antitumor miR-217 in PDAC cells [17]. These results suggest that RACGAP1 and RACGAP1-mediated genes are possible therapeutic targets for PDAC.
Interestingly, TMPRSS4 and SERPINB3 were identified as a PDAC classifier for discriminating PDAC and early precursor lesions from non-malignant tissue [40]. Notably, silencing of TMPRESS4 expression blocked PDAC cell migration and invasion abilities [40]. Among these targets, we searched for regulation of miRNAs. Aberrant expression of the actin-binding protein ANLN (anillin) was detected in PDAC clinical specimens, and knockdown of ANLN markedly inhibited the migration and invasion of PDAC cell lines [17]. In addition, that same study found that ANLN was directly controlled by antitumor miR-217 in PDAC cells. Ectopic expression of miR-217 was significantly blocked cancer cell aggressiveness features [17]. Moreover, TRIM29, DNA and p53-binding protein is overexpressed in PDAC and its function as a mediator in DNA damage signaling [41]. Aberrant expression of TRIM29 associated with radio-resistance in PDAC cells [41]. Tumor suppressive miR-449a inhibited PDAC cell aggressiveness through targeting TRIM29 [41]. These results suggest that RACGAP1 and RACGAP1-mediated genes are possible therapeutic targets for PDAC. Analysis strategy based on aberrant expressed miRNAs is effective for searching to novel molecular pathogenesis of PDAC.

4. Materials and Methods

4.1. Clinical Samples and PDAC Cell Lines

In this study, 24 PDAC clinical samples were collected from PDAC patients who underwent resection at Kagoshima University Hospital (Kagoshima, Japan) from 1997 to 2016. As controls, 17 pancreatic tissue specimens were collected from noncancerous regions. Gene expression analyses were conducted using total RNA extracted from cryopreserved PDAC tissues, and immunohistochemistry was performed using paraffin-embedded PDAC tissues. The clinical samples were staged according to the American Joint Committee on Cancer/Union Internationale Contre le Cancer TNM staging system. The clinicopathological factors of the clinical specimens are shown in Table 1. The present study was approved by the Institutional Review Board of Kagoshima University. Written informed consent and approval were provided by all patients (approval number: 16-27).
We also used two PDAC cell lines in this study: SW1990 cells purchased from the American Type Culture Collection (Manassas, VA, USA) and PANC-1 cells purchased from RIKEN Cell Bank (Tsukuba, Ibaraki, Japan).

4.2. Quantitative Reverse-Transcription Polymerase Chain Reaction (qRT-PCR)

The procedure used for qRT-PCR has been described previously [42,43,44,45]. Reagents and equipment were purchased from Thermo Fisher Scientific (Waltham, MA, USA). TaqMan qRT-PCR probes targeting miR-204-5p (product ID: 000508) and RACGAP1 (product ID: Hs01100049_mH) were obtained. Probes targeting GUSB (product ID: Hs99999908_m1) and RNU48 (product ID: 001006) were used as internal controls.

4.3. Transfection of Mature miRNAs and Small-Interfering RNAs (siRNAs)

The procedures for miRNA or siRNA transfection into cancer cells have been described previously [42,43,44,45]. The following mature miRNAs or siRNAs were used for transfection: miR-204-5p (product ID: PM11116), negative control miRNA (product ID: AM 17111) and two RACGAP1 siRNAs (product IDs: HSS120934 and HSS120936). The oligonucleotides were transfected at 10 nM into PDAC cell lines using Lipofectamine RNAiMAX and Lipofectamine 2000 (Thermo Fisher Scientific, Waltham, MA, USA).

4.4. Cell Proliferation, Migration and Invasion Assays

As functional analyses, cell proliferation (XTT assay), migration (chamber cells migration assay) and invasion (Matrigel assay) assays were performed, as described previously [42,43,44,45].

4.5. Identification of Genes Regulated by miR-204-5p in PDAC Cells

To identify candidate target genes of miR-204-5p, comprehensive gene expression analyses using an oligonucleotide microarray (Agilent Technologies; Human Ge 60K, Santa Clara, CA, USA) were incorporated with in silico database analyses using the Target Scan Human 7.2 database (June 2016 release: http://www.targetscan.org/vert_71), as described previously (Figure S1) [42,43,44,45]. The microarray data were deposited into the Gene Expression Omnibus (GEO) repository (https://www.ncbi.nlm.nih.gov/ geo/). In addition, data from TCGA database regarding gene expression in PDAC were analyzed (https://cancergenome.nih.gov/).

4.6. Clinical Database Analyses of PDAC

TCGA database was used to investigate the clinical significance of PDAC miRNAs and the genes they regulated (https://tcga-data.nci.nih.gov/tcga/). Gene expression and clinical data were obtained from cBioPortal (http://www.cbioportal.org/) and OncoLnc (http://www.oncolnc.org) (data downloaded on 28 April 2018).

4.7. Plasmid Construction and Dual Luciferase Reporter Assay

The following 2 sequences were cloned into the psiCHECk-2 vector (C8021; Promega Corporation, Madison, WI, USA): the wild-type sequence of the 3′-untranslated regions (UTRs) of RACGAP1, or the deletion-type, which lacked the miR-204-5p target sites from RACGAP1 (position 851–857). The procedures for transfection and dual-luciferase reporter assays were provided in previous studies [42,43,44,45].

4.8. Western Blotting and Immunohistochemistry

For western blotting and immunostaining detection of RACGAP1 expression, anti-RACGAP1 antibodies (product ID: ab2270) were used according to the manufacturer’s instructions (Abcam Plc, Cambridge, UK). An anti-glyceraldehyde 3-phosphate dehydrogenase (GAPDH) antibody (product ID: SAF6698; Wako, Osaka, Japan) was used as an internal loading control for western blotting. Details of these methods have been described previously [42,43,44,45].

4.9. Downstream Genes Affected by RACGAP1 in PDAC Cells

Genome-wide gene expression and database oriented in silico analyses were applied to identify RACGAP1-mediated downstream genes. Our strategy for identification of genes regulated by RACGAP1 is outlined in Figure S6. The microarray data used have been deposited in the GEO repository under accession number GSE115909.

4.10. Statistical Analysis

Comparisons between groups were assessed using the Mann-Whitney U test or one-way analysis of variance followed by Tukey’s multiple comparison test. Differences in survival rates were determined by Kaplan-Meier survival analysis and log-rank test. The Z-scores of target genes mRNA expression data and clinical sample information corresponding to PDAC patients were collected from cBioPortal. R2: Genomics Analysis and Visualization Platform (http://r2.amc.nl) was used to create a heatmap. Furthermore, Z-score was evaluated by a combination of each genes sets. High group (mRNA Z-score > 0) and low group (mRNA Z-score ≤ 0) were analyzed by Kaplan–Meier survival curves and log-rank statistics. The analyses were conducted using Expert StatView version 5.0 (SAS Institute, Inc., Cary, NC, USA) and GraphPad Prism version 7.04 (GraphPad Software, Inc., La Jolla, CA, USA).

5. Conclusions

In conclusion, miR-204-5p was downregulated in PDAC clinical specimens and acted as an antitumor miRNA by targeting several oncogenes involved in PDAC pathogenesis. RACGAP1 was directly regulated by antitumor miR-204-5p, and high expression of RACGAP1 significantly predicted a shorter survival in patients with PDAC. Overexpression of RACGAP1 enhanced PDAC cell migration and invasion, suggesting RACGAP1 as a possible therapeutic target for PDAC patients. Our approach to identify antitumor miRNAs and their regulated target genes in PDAC has potential value for the development of new therapeutic strategies.

Supplementary Materials

The following are available online at https://www.mdpi.com/2072-6694/11/3/327/s1, Figure S1: Strategy for identification of putative genes regulated by miR-204-5p in PDAC cells, Figure S2: Expression levels of RACGAP1 and miR-204-5p were negatively correlated, Figure S3: Analysis of clinicopathological factors related to miR-204-5p expression in TCGA database from cBioportal, Figure S4: Analysis of clinicopathological factors related to RACGAP1 expression in TCGA database from cBioportal, Figure S5: TCGA database analyses showed that high expression of RACGAP1 was closely associated with poor prognosis (3-year OS) of several cancers, Figure S6: Strategy for identification of putative genes regulated by RACGAP1 in PDAC cells. Table S1: Enriched KEGG Pathways in miR-204-5p transfectant on SW1990, Table S2: Enriched KEGG Pathways in si-RACGAP1 transfectant on SW1990, Table S3: EMT related genes regulated by si-RACGAP1 and miR-204-5p, Table S4. MET related genes regulated by si-RACGAP1 and miR-204-5p.

Author Contributions

Conceptualization, M.K., T.I. and N.S.; methodology, N.S.; validation, H.T., M.W. and H.F.; formal analysis, M.K. and T.I.; investigation, N.S. and H.K.; resources, N.S., H.K., Y.Y., Y.Ka., Y.M., K.M. and S.N.; writing—original draft preparation, M.K., T.I. and N.S.; writing—review and editing, N.S., H.K., T.I., H.T., H.F., Y.M. and K.M.; visualization, M.K. and T.I.; supervision, N.S.; funding acquisition, N.S., H.K., Y.Ki., K.T., K.M. and S.N.

Funding

This study was supported by KAKENHI grants 18K16322, 18K08687, 18K08626, 17H04285, 16K19945, 18K15219, 16H05462(B) and 15K10801(C).

Conflicts of Interest

The authors declare no conflicts of interest.

References

  1. Ferlay, J.; Soerjomataram, I.; Dikshit, R.; Eser, S.; Mathers, C.; Rebelo, M.; Parkin, D.M.; Forman, D.; Bray, F. Cancer incidence and mortality worldwide: Sources, methods and major patterns in GLOBOCAN 2012. Int. J. Cancer 2015, 136, E359–E386. [Google Scholar] [CrossRef] [PubMed]
  2. Hidalgo, M. Pancreatic cancer. N. Engl. J. Med. 2010, 362, 1605–1617. [Google Scholar] [CrossRef] [PubMed]
  3. Kamisawa, T.; Wood, L.D.; Itoi, T.; Takaori, K. Pancreatic cancer. Lancet 2016, 388, 73–85. [Google Scholar] [CrossRef]
  4. Chrystoja, C.C.; Diamandis, E.P.; Brand, R.; Ruckert, F.; Haun, R.; Molina, R. Pancreatic cancer. Clin. Chem. 2013, 59, 41–46. [Google Scholar] [CrossRef] [PubMed]
  5. Biankin, A.V.; Waddell, N.; Kassahn, K.S.; Gingras, M.C.; Muthuswamy, L.B.; Johns, A.L.; Miller, D.K.; Wilson, P.J.; Patch, A.M.; Wu, J.; et al. Pancreatic cancer genomes reveal aberrations in axon guidance pathway genes. Nature 2012, 491, 399–405. [Google Scholar] [CrossRef] [PubMed] [Green Version]
  6. Zhang, M.; Wang, Z.; Obazee, O.; Jia, J.; Childs, E.J.; Hoskins, J.; Figlioli, G.; Mocci, E.; Collins, I.; Chung, C.C.; et al. Three new pancreatic cancer susceptibility signals identified on chromosomes 1q32.1, 5p15.33 and 8q24.21. Oncotarget 2016, 7, 66328–66343. [Google Scholar] [CrossRef] [PubMed] [Green Version]
  7. Campa, D.; Rizzato, C.; Stolzenberg-Solomon, R.; Pacetti, P.; Vodicka, P.; Cleary, S.P.; Capurso, G.; Bueno-de-Mesquita, H.B.; Werner, J.; Gazouli, M.; et al. TERT gene harbors multiple variants associated with pancreatic cancer susceptibility. Int. J. Cancer 2015, 137, 2175–2183. [Google Scholar] [CrossRef] [PubMed]
  8. Childs, E.J.; Mocci, E.; Campa, D.; Bracci, P.M.; Gallinger, S.; Goggins, M.; Li, D.; Neale, R.E.; Olson, S.H.; Scelo, G.; et al. Common variation at 2p13.3, 3q29, 7p13 and 17q25.1 associated with susceptibility to pancreatic cancer. Nat. Genet. 2015, 47, 911–916. [Google Scholar] [CrossRef] [PubMed] [Green Version]
  9. Klein, A.P.; Wolpin, B.M.; Risch, H.A.; Stolzenberg-Solomon, R.Z.; Mocci, E.; Zhang, M.; Canzian, F.; Childs, E.J.; Hoskins, J.W.; Jermusyk, A.; et al. Genome-wide meta-analysis identifies five new susceptibility loci for pancreatic cancer. Nat. Commun. 2018, 9, 556. [Google Scholar] [CrossRef] [PubMed] [Green Version]
  10. Bartel, D.P. MicroRNAs: Genomics, biogenesis, mechanism, and function. Cell 2004, 116, 281–297. [Google Scholar] [CrossRef]
  11. Bartel, D.P. MicroRNAs: Target recognition and regulatory functions. Cell 2009, 136, 215–233. [Google Scholar] [CrossRef] [PubMed]
  12. Chen, C.Z. MicroRNAs as oncogenes and tumor suppressors. N. Eng. J. Med. 2005, 353, 1768–1771. [Google Scholar] [CrossRef] [PubMed]
  13. Goto, Y.; Kurozumi, A.; Enokida, H.; Ichikawa, T.; Seki, N. Functional significance of aberrantly expressed microRNAs in prostate cancer. Int. J. Urol. 2015, 22, 242–252. [Google Scholar] [CrossRef] [PubMed] [Green Version]
  14. Koshizuka, K.; Hanazawa, T.; Arai, T.; Okato, A.; Kikkawa, N.; Seki, N. Involvement of aberrantly expressed microRNAs in the pathogenesis of head and neck squamous cell carcinoma. Cancer Metastasis Rev. 2017, 36, 525–545. [Google Scholar] [CrossRef] [PubMed]
  15. Yonemori, K.; Kurahara, H.; Maemura, K.; Natsugoe, S. MicroRNA in pancreatic cancer. J. Hum. Genet. 2017, 62, 33–40. [Google Scholar] [CrossRef] [PubMed]
  16. Yonemori, K.; Seki, N.; Idichi, T.; Kurahara, H.; Osako, Y.; Koshizuka, K.; Arai, T.; Okato, A.; Kita, Y.; Arigami, T.; et al. The microRNA expression signature of pancreatic ductal adenocarcinoma by RNA sequencing: Anti-tumour functions of the microRNA-216 cluster. Oncotarget 2017, 8, 70097–70115. [Google Scholar] [CrossRef] [PubMed]
  17. Idichi, T.; Seki, N.; Kurahara, H.; Yonemori, K.; Osako, Y.; Arai, T.; Okato, A.; Kita, Y.; Arigami, T.; Mataki, Y.; et al. Regulation of actin-binding protein ANLN by antitumor miR-217 inhibits cancer cell aggressiveness in pancreatic ductal adenocarcinoma. Oncotarget 2017, 8, 53180–53193. [Google Scholar] [CrossRef] [PubMed] [Green Version]
  18. Yonemori, K.; Seki, N.; Kurahara, H.; Osako, Y.; Idichi, T.; Arai, T.; Koshizuka, K.; Kita, Y.; Maemura, K.; Natsugoe, S. ZFP36L2 promotes cancer cell aggressiveness and is regulated by antitumor microRNA-375 in pancreatic ductal adenocarcinoma. Cancer Sci. 2017, 108, 124–135. [Google Scholar] [CrossRef] [PubMed]
  19. Idichi, T.; Seki, N.; Kurahara, H.; Fukuhisa, H.; Toda, H.; Shimonosono, M.; Okato, A.; Arai, T.; Kita, Y.; Mataki, Y.; et al. Molecular pathogenesis of pancreatic ductal adenocarcinoma: Impact of passenger strand of pre-miR-148a on gene regulation. Cancer Sci. 2018, 109, 2013–2026. [Google Scholar] [CrossRef] [PubMed]
  20. Idichi, T.; Seki, N.; Kurahara, H.; Fukuhisa, H.; Toda, H.; Shimonosono, M.; Yamada, Y.; Arai, T.; Kita, Y.; Kijima, Y.; et al. Involvement of anti-tumor miR-124-3p and its targets in the pathogenesis of pancreatic ductal adenocarcinoma: Direct regulation of ITGA3 and ITGB1 by miR-124-3p. Oncotarget 2018, 9, 28849–28865. [Google Scholar] [CrossRef] [PubMed]
  21. Canu, V.; Sacconi, A.; Lorenzon, L.; Biagioni, F.; Lo Sardo, F.; Diodoro, M.G.; Muti, P.; Garofalo, A.; Strano, S.; D’Errico, A.; et al. MiR-204 down-regulation elicited perturbation of a gene target signature common to human cholangiocarcinoma and gastric cancer. Oncotarget 2017, 8, 29540–29557. [Google Scholar] [CrossRef] [PubMed] [Green Version]
  22. Chen, Z.; Sangwan, V.; Banerjee, S.; Mackenzie, T.; Dudeja, V.; Li, X.; Wang, H.; Vickers, S.M.; Saluja, A.K. miR-204 mediated loss of myeloid cell leukemia-1 results in pancreatic cancer cell death. Mol. Cancer 2013, 12, 105. [Google Scholar] [CrossRef] [PubMed]
  23. Shi, L.; Zhang, B.; Sun, X.; Lu, S.; Liu, Z.; Liu, Y.; Li, H.; Wang, L.; Wang, X.; Zhao, C. MiR-204 inhibits human NSCLC metastasis through suppression of NUAK1. Br. J. Cancer 2014, 111, 2316–2327. [Google Scholar] [CrossRef] [PubMed] [Green Version]
  24. Toda, H.; Kurozumi, S.; Kijima, Y.; Idichi, T.; Shinden, Y.; Yamada, Y.; Arai, T.; Maemura, K.; Fujii, T.; Horiguchi, J.; et al. Molecular pathogenesis of triple-negative breast cancer based on microRNA expression signatures: Antitumor miR-204-5p targets AP1S3. J. Hum. Genet. 2018, 63, 1197–1210. [Google Scholar] [CrossRef] [PubMed]
  25. Gao, W.; Wu, Y.; He, X.; Zhang, C.; Zhu, M.; Chen, B.; Liu, Q.; Qu, X.; Li, W.; Wen, S.; et al. MicroRNA-204-5p inhibits invasion and metastasis of laryngeal squamous cell carcinoma by suppressing forkhead box C1. J. Cancer 2017, 8, 2356–2368. [Google Scholar] [CrossRef] [PubMed]
  26. Ou-Yang, L.; Xiao, S.J.; Liu, P.; Yi, S.J.; Zhang, X.L.; Ou-Yang, S.; Tan, S.K.; Lei, X. Forkhead box C1 induces epithelialmesenchymal transition and is a potential therapeutic target in nasopharyngeal carcinoma. Mol. Med. Rep. 2015, 12, 8003–8009. [Google Scholar] [CrossRef] [PubMed]
  27. Subramani, R.; Camacho, F.A.; Levin, C.I.; Flores, K.; Clift, A.; Galvez, A.; Terres, M.; Rivera, S.; Kolli, S.N.; Dodderer, J.; et al. FOXC1 plays a crucial role in the growth of pancreatic cancer. Oncogenesis 2018, 7, 52. [Google Scholar] [CrossRef] [PubMed]
  28. Wang, J.; Xu, Y.; Li, L.; Wang, L.; Yao, R.; Sun, Q.; Du, G. FOXC1 is associated with estrogen receptor alpha and affects sensitivity of tamoxifen treatment in breast cancer. Cancer Med. 2017, 6, 275–287. [Google Scholar] [CrossRef] [PubMed]
  29. Hollingsworth, M.A.; Swanson, B.J. Mucins in cancer: Protection and control of the cell surface. Nature Rev. Cancer 2004, 4, 45–60. [Google Scholar] [CrossRef] [PubMed]
  30. Wang, L.; Zhi, X.; Zhu, Y.; Zhang, Q.; Wang, W.; Li, Z.; Tang, J.; Wang, J.; Wei, S.; Li, B.; et al. MUC4-promoted neural invasion is mediated by the axon guidance factor Netrin-1 in PDAC. Oncotarget 2015, 6, 33805–33822. [Google Scholar] [CrossRef] [PubMed]
  31. Xia, P.; Choi, A.H.; Deng, Z.; Yang, Y.; Zhao, J.; Wang, Y.; Hardwidge, P.R.; Zhu, G. Cell membrane-anchored MUC4 promotes tumorigenicity in epithelial carcinomas. Oncotarget 2017, 8, 14147–14157. [Google Scholar] [CrossRef] [PubMed]
  32. Bernards, A.; Settleman, J. GAP control: Regulating the regulators of small GTPases. Trends Cell Biol. 2004, 14, 377–385. [Google Scholar] [CrossRef] [PubMed]
  33. Bos, J.L.; Rehmann, H.; Wittinghofer, A. GEFs and GAPs: Critical elements in the control of small G proteins. Cell 2007, 129, 865–877. [Google Scholar] [CrossRef] [PubMed]
  34. Wang, S.M.; Ooi, L.L.; Hui, K.M. Upregulation of Rac GTPase-activating protein 1 is significantly associated with the early recurrence of human hepatocellular carcinoma. Clin. Cancer Res. 2011, 17, 6040–6051. [Google Scholar] [CrossRef] [PubMed]
  35. Imaoka, H.; Toiyama, Y.; Saigusa, S.; Kawamura, M.; Kawamoto, A.; Okugawa, Y.; Hiro, J.; Tanaka, K.; Inoue, Y.; Mohri, Y.; et al. RacGAP1 expression, increasing tumor malignant potential, as a predictive biomarker for lymph node metastasis and poor prognosis in colorectal cancer. Carcinogenesis 2015, 36, 346–354. [Google Scholar] [CrossRef] [PubMed] [Green Version]
  36. Saigusa, S.; Tanaka, K.; Mohri, Y.; Ohi, M.; Shimura, T.; Kitajima, T.; Kondo, S.; Okugawa, Y.; Toiyama, Y.; Inoue, Y.; et al. Clinical significance of RacGAP1 expression at the invasive front of gastric cancer. Gastric Cancer. 2015, 18, 84–92. [Google Scholar] [CrossRef] [PubMed]
  37. Mi, S.; Lin, M.; Brouwer-Visser, J.; Heim, J.; Smotkin, D.; Hebert, T.; Gunter, M.J.; Goldberg, G.L.; Zheng, D.; Huang, G.S. RNA-seq Identification of RACGAP1 as a Metastatic Driver in Uterine Carcinosarcoma. Clin. Cancer Res. 2016, 22, 4676–4686. [Google Scholar] [CrossRef] [PubMed]
  38. Wang, C.; Wang, W.; Liu, Y.; Yong, M.; Yang, Y.; Zhou, H. Rac GTPase activating protein 1 promotes oncogenic progression of epithelial ovarian cancer. Cancer Sci. 2018, 109, 84–93. [Google Scholar] [CrossRef] [PubMed]
  39. Hazar-Rethinam, M.; de Long, L.M.; Gannon, O.M.; Boros, S.; Vargas, A.C.; Dzienis, M.; Mukhopadhyay, P.; Saenz-Ponce, N.; Dantzic, D.D.; Simpson, F.; et al. RacGAP1 is a novel downstream effector of e2f7-dependent resistance to doxorubicin and is prognostic for overall survival in squamous cell carcinoma. Mol. Cancer Therap. 2015, 14, 1939–1950. [Google Scholar] [CrossRef] [PubMed]
  40. Bhasin, M.K.; Ndebele, K.; Bucur, O.; Yee, E.U.; Otu, H.H.; Plati, J.; Bullock, A.; Gu, X.; Castan, E.; Zhang, P.; et al. Meta-analysis of transcriptome data identifies a novel 5-gene pancreatic adenocarcinoma classifier. Oncotarget 2016, 7, 23263–23281. [Google Scholar] [CrossRef] [PubMed] [Green Version]
  41. Li, F.; Liang, J.; Bai, L. MicroRNA-449a functions as a tumor suppressor in pancreatic cancer by the epigenetic regulation of ATDC expression. Biomed. Pharmacother. 2018, 103, 782–789. [Google Scholar] [CrossRef] [PubMed]
  42. Arai, T.; Kojima, S.; Yamada, Y.; Sugawara, S.; Kato, M.; Yamazaki, K.; Naya, Y.; Ichikawa, T.; Seki, N. Pirin: A potential novel therapeutic target for castration-resistant prostate cancer regulated by miR-455-5p. Mol. Oncol. 2018, 13, 322–337. [Google Scholar] [CrossRef] [PubMed]
  43. Yamada, Y.; Arai, T.; Kojima, S.; Sugawara, S.; Kato, M.; Okato, A.; Yamazaki, K.; Naya, Y.; Ichikawa, T.; Seki, N. Regulation of antitumor miR-144-5p targets oncogenes: Direct regulation of syndecan-3 and its clinical significance. Cancer Sci. 2018, 109, 2919–2936. [Google Scholar] [CrossRef] [PubMed]
  44. Yamada, Y.; Arai, T.; Sugawara, S.; Okato, A.; Kato, M.; Kojima, S.; Yamazaki, K.; Naya, Y.; Ichikawa, T.; Seki, N. Impact of novel oncogenic pathways regulated by antitumor miR-451a in renal cell carcinoma. Cancer Sci. 2018, 109, 1239–1253. [Google Scholar] [CrossRef] [PubMed]
  45. Yamada, Y.; Sugawara, S.; Arai, T.; Kojima, S.; Kato, M.; Okato, A.; Yamazaki, K.; Naya, Y.; Ichikawa, T.; Seki, N. Molecular pathogenesis of renal cell carcinoma: Impact of the anti-tumor miR-29 family on gene regulation. Int. J. Urol. 2018, 25, 953–965. [Google Scholar] [CrossRef] [PubMed]
Figure 1. Downregulated expression and antitumor effect of miR-204-5p in pancreatic ductal adenocarcinoma (PDAC). (A) Expression levels of miR-204-5p in PDAC clinical specimens and cell lines determined by qRT-PCR. Expression levels were normalized to that of RNU48. p = 0.0119. (B) Cell proliferation determined by XTT assays 72 h after transfection of 10 nM miR-204-5p. * p < 0.0001; N.S.: not significant. (C) Cell migration assessed by migration assays. * p < 0.0001. (D) Cell invasion assessed by Matrigel invasion assays. * p < 0.0001.
Cancers 11 00327 g001
Figure 2. Clinical significance of the expression levels of seven genes targeted by miR-204-5p (RACGAP1, DHRS9, AP1S3, FOXC1, PRP11, RHBDL2 and MUC4) based on data from The Cancer Genome Atlas (TCGA) database. (A) Kaplan-Meier plots of overall survival and (B) disease-free survival with log-rank tests comparing the survival of PDAC patients with high (red lines) versus low (blue lines) expression levels of each of the abovementioned genes, based on data from TCGA database.
Cancers 11 00327 g002
Figure 3. Aberrant expression of RACGAP1 in PDAC specimens and its clinical significance. (A) Expression levels of RACGAP1 in PDAC clinical specimens and two cell lines, SW1990 and PANC-1. GUSB expression was evaluated as the internal control. (B) Expression level of RACGAP1 in patients with PDAC according to data from TCGA database (https://cancergenome.nih.gov/). Forest plot of univariate Cox proportional hazards regression analyses of 5-year overall survival rates according to RACGAP1 expression and clinicopathological factors. (C) Immunohistochemical analysis of RACGAP1 in PDAC clinical samples. RACGAP1 was strongly expressed in cancer lesions. In normal pancreatic tissue, expression of RACGAP1 was not recognized. Original magnification: 200×.
Cancers 11 00327 g003
Figure 4. Direct regulation of RACGAP1 by miR-204-5p in PDAC cells. (A) RACGAP1 mRNA expression in PDAC cell lines was evaluated by qRT-PCR at 72 h after transfection of miR-204-5p. GUSB expression was evaluated as the internal control. * p < 0.0001. (B) RACGAP1 protein expression in PDAC cell lines was evaluated by western blotting at 96 h after transfection of miR-204-5p. GAPDH expression was evaluated as the loading control. (C) miR-204-5p binding sites within the 3′-UTR of RACGAP1 mRNA. Dual luciferase reporter assays using vectors harboring either the wild-type RACGAP1 3′-UTR sequence containing the putative miR-204-5p binding site (nucleotide positions 851-857) or the 3′-UTR sequence with deletion of this binding site. Data represent the ratio of Renilla/firefly luciferase activities in PDAC cells transfected with miR-204-5p relative to that in mock-transfected control cells. * p < 0.0001; N.S.: no significant.
Cancers 11 00327 g004
Figure 5. Effects of RACGAP1 knockdown by si-RACGAP1 transfection into PDAC cells. (A) RACGAP1 mRNA expression in PDAC cell lines was evaluated by qRT-PCR at 72 h after transfection with si-RACGAP1-1 or si-RACGAP1-2. GUSB expression was evaluated as the internal control. (B) RACGAP1 protein expression in PDAC cell lines was evaluated by western blotting at 96 h after transfection with si-RACGAP1-1 and si-RACGAP1-2. GAPDH expression was used as the loading control. (C) Cell proliferation was assessed by XTT assays 72 h after transfection with 10 nM si-RACGAP1-1 or si-RACGAP1-2. (D) Cell migration was assessed by migration assays. * p < 0.0001. (E) Cell invasion was assessed by Matrigel invasion assays. * p < 0.0001.
Cancers 11 00327 g005
Figure 6. Clinical significance of RACGAP1 downstream genes associated with a poor prognosis of patients with PDAC.
Cancers 11 00327 g006
Figure 7. Combination analysis with heatmap of 12 target genes related to poor prognosis in PDAC. Heatmap was created using analysis webcite “R2: Genomics Analysis and Visualization Platform (http://r2.amc.nl)”. Z-score was evaluated by a combination of si-RACGAP1 downstream genes based on TCGA datasets. High group (mRNA Z-score > 0) and low group (mRNA Z-score ≤ 0) are displayed as Kaplan–Meier plots with log-rank tests.
Cancers 11 00327 g007
Table 1. Patient characteristics.
Pancreatic Ductal Adenocarcinoma (PDAC)FactorsNumber(%)
Total number24
Average age(range), years67.0 (42–79)
GenderMale12(50.0)
Female12(50.0)
T categorypT11(4.2)
pT20(0)
pT323(95.8)
pT40(0)
N category08(33.3)
116(66.7)
M category023(95.8)
11(4.2)
Lymphatic invasion01(4.2)
111(45.8)
29(37.5)
33(12.5)
Vascular invasion01(4.2)
110(41.7)
211(45.8)
32(8.3)
Neoadjuvant Chemotherapy(−)12(50.0)
(+)12(50.0)
Adjuvant Chemotherapy(−)7(29.2)
(+)17(70.8)
Recurrence(−)7(29.2)
(+)17(70.8)
Table 2. Patient characteristics.
Normal Pancreatic TissueFactorsNumber(%)
Total number17
Average age (range), years64.8 (42–85)
GenderMale6(35.3)
Female11(64.7)
Table 3. Candidate target genes regulated by miR-204-5p.
Entrez Gene IDGene SymbolGene NameTarget SitesGEOArray (SW1990)OncoLnc OS_p-Value PDAC
Conserved SitesPoorly SitesFC (log)Mock vs. miR-204-5p
29127RACGAP1Rac GTPase activating protein 1011.34−1.0160.00005
10170DHRS9dehydrogenase/reductase (SDR family) member 9021.57−1.0780.00103
130340AP1S3adaptor-related protein complex 1, sigma 3 subunit021.17−3.0040.00407
2296FOXC1forkhead box C1111.01−1.0590.00965
54933RHBDL2rhomboid, veinlet-like 2 (Drosophila)011.18−1.0610.01770
4585MUC4mucin 4, cell surface associated011.42−1.5690.02640
55771PRR11proline rich 11101.42−1.4060.04200
4680CEACAM6carcinoembryonic antigen-related cell adhesion molecule 6 (non-specific cross reacting antigen)013.50−1.2600.07160
6505SLC1A1solute carrier family 1 (neuronal/epithelial high affinity glutamate transporter, system Xag), member 1021.52−1.3970.08320
2335FN1fibronectin 1013.73−1.0230.09500
3397ID1inhibitor of DNA binding 1, dominant negative helix-loop-helix protein011.29−1.3840.15300
55808ST6GALNAC1ST6 (α-N-acetyl-neuraminyl-2,3-β-galactosyl-1,3)-N-acetylgalactosaminide alpha-2,6-sialyltransferase 1011.36−1.3670.15300
54210TREM1triggering receptor expressed on myeloid cells 1011.55−1.0670.15700
8905AP1S2adaptor-related protein complex 1, sigma 2 subunit201.04−1.8060.17700
147495APCDD1adenomatosis polyposis coli down-regulated 1011.18−1.2760.21200
4837NNMTnicotinamide N-methyltransferase012.69−1.0600.21900
7851MALLmal, T-cell differentiation protein-like111.44−1.2520.22600
493ATP2B4ATPase, Ca++ transporting, plasma membrane 4011.35−1.1490.23600
1295COL8A1collagen, type VIII, α 1014.62−1.1310.36400
219699UNC5Bunc-5 homolog B (C. elegans)111.42−1.6280.59600
2192FBLN1fibulin 1011.62−1.2620.65300
5159PDGFRBPlatelet-derived growth factor receptor, beta polypeptide021.80−2.2350.77500
2182ACSL4acyl-CoA synthetase long-chain family member 4121.05−1.5700.79200
140885SIRPAsignal-regulatory protein alpha011.20−1.1940.80000
1809DPYSL3dihydropyrimidinase-like 3112.07−1.1850.99600
GEO: Gene Expression Omnibus; FC: Fold-Change; OS: Overall Survival; PDAC: Pancreatic Ductal Adenocarcinoma.
Table 4. RACGAP1-meditade downstream genes in PDAC.
Entrez GeneIDGene SymbolGeneNamemiR-204-5p Conserved Sites TotalmiR-204-5p Poorly Conserved Sites TotalGEO FC (log)Array(SW1990) Mock vs. si-RACGAP1OncoLnc OS_p-Value PAAD
79148MMP28matrix metallopeptidase 28--1.44652−1.308901.45E-05
29127RACGAP1Rac GTPase activating protein 1011.34429−3.041180.0000548
55165CEP55centrosomal protein 55 kDa--1.09192−1.058210.000736
983CDK1cyclin-dependent kinase 1--1.41425−1.035950.00137
54443ANLNanillin, actin binding protein--1.72921−1.192680.00142
57402S100A14S100 calcium binding protein A14--1.06798−1.198080.00469
11254SLC6A14solute carrier family 6 (amino acid transporter), member 14013.01708−1.205490.00678
23650TRIM29tripartite motif containing 29--2.00490−1.230480.00934
56649TMPRSS4transmembrane protease, serine 4--1.96115−1.272890.00954
6317SERPINB3serpin peptidase inhibitor, clade B (ovalbumin), member 3--1.74282−1.154750.0188
388743CAPN8calpain 8--1.92729−2.402230.0242
9833MELKmaternal embryonic leucine zipper kinase011.21153−1.040520.028
55711FAR2fatty acyl CoA reductase 2--1.04894−1.132500.0312
1893ECM1extracellular matrix protein 1--1.14510−1.032340.0531
11178LZTS1leucine zipper, putative tumor suppressor 1--1.30061−1.643720.0591
6696SPP1secreted phosphoprotein 1--2.67411−1.792080.0639
5349FXYD3FXYD domain containing ion transport regulator 3--1.80037−1.464280.0677
4680CEACAM6carcinoembryonic antigen-related cell adhesion molecule 6 (non-specific cross reacting antigen)013.49703−1.048480.0716
80736SLC44A4solute carrier family 44, member 4--1.84270−1.144950.0761
80856KIAA1715KIAA1715021.05264−1.704610.0891
412STSsteroid sulfatase (microsomal), isozyme S--1.32435−2.628440.0996
1087CEACAM7carcinoembryonic antigen-related cell adhesion molecule 7--1.89107−1.112930.105
29969MDFICMyoD family inhibitor domain containing011.20813−1.202990.11
23596OPN3opsin 3--1.28539−1.531330.122
56241SUSD2sushi domain containing 2--1.30384−1.264760.123
55808ST6GALNAC1ST6 (alpha-N-acetyl-neuraminyl-2,3-β-galactosyl-1,3)-N-acetylgalactosaminide α-2,6-sialyltransferase 1011.35766−1.552780.153
90459ERI1exoribonuclease 1--1.08766−1.076010.158
1999ELF3E74-like factor 3 (ETS domain transcription factor, epithelial-specific)--1.18538−1.057790.174
121457IKBIPIKBKB interacting protein--1.10964−1.063440.185
50810HDGFRP3hepatoma-derived growth factor, related protein 3--1.37815−1.691050.187
1048CEACAM5carcinoembryonic antigen-related cell adhesion molecule 5--2.76693−1.961320.188
147495APCDD1adenomatosis polyposis coli down-regulated 1011.17965−1.339230.212
200958MUC20mucin 20, cell surface associated--1.50494−1.283290.232
54843SYTL2synaptotagmin-like 2--1.90048−1.173070.242
7031TFF1trefoil factor 1--2.40095−1.136880.242
1847DUSP5dual specificity phosphatase 5--1.47556−1.775970.269
85477SCINscinderin--1.14779−1.626770.285
10000AKT3v-akt murine thymoma viral oncogene homolog 3--1.02342−1.077800.317
89932PAPLNpapilin, proteoglycan-like sulfated glycoprotein021.81417−1.082330.332
51056LAP3leucine aminopeptidase 3--1.06387−1.231370.343
4688NCF2neutrophil cytosolic factor 2--2.00063−1.141830.422
22795NID2nidogen 2 (osteonidogen)--1.78329−1.099230.425
8706B3GALNT1β-1,3-N-acetyl-galactosaminyl-transferase 1 (globoside blood group)--1.06403−1.074570.474
10551AGR2anterior gradient 2--2.04850−1.207590.491
1009CDH11cadherin 11, type 2, OB-cadherin (osteoblast)103.64065−1.326680.526
340547VSIG1V-set and immunoglobulin domain containing 1--1.78237−1.449810.54
219699UNC5Bunc-5 homolog B (C. elegans)111.42242−1.489440.596
154141MBOAT1membrane bound O-acyltransferase domain containing 1--1.03451−1.039930.615
3455IFNAR2interferon (α, β and ω) receptor 2031.07229−1.110070.618
2357FPR1formyl peptide receptor 1021.09684−1.926650.629
29887SNX10sorting nexin 10--1.20341−1.638180.64
91607SLFN11Schlafen family member 11--1.37401−1.230240.661
79071ELOVL6ELOVL fatty acid elongase 6121.48750−1.187730.727
3075CFHcomplement factor H--1.64335−1.259600.732
5159PDGFRBplatelet-derived growth factor receptor, β polypeptide021.79906−3.935980.775
10855HPSEheparanase--1.10037−1.257240.783
2877GPX2glutathione peroxidase 2 (gastrointestinal)--2.06843−1.243290.84
634CEACAM1carcinoembryonic antigen-related cell adhesion molecule 1 (biliary glycoprotein)--1.41681−1.083760.843
54749EPDR1ependymin related 1--1.00831−1.253560.86
2124EVI2Becotropic viral integration site 2B--1.54469−1.323680.939
3310HSPA6heat shock 70kDa protein 6 (HSP70B’)--1.34685−1.102700.956
6453ITSN1intersectin 1 (SH3 domain protein)--1.21741−1.040960.982
30001ERO1LERO1-like (S. cerevisiae)011.05476−1.33509No data
100499177THAP9-AS1THAP9 antisense RNA 1--1.02990−1.06954No data

