MEK Inhibition Induces Canonical WNT Signaling through YAP in KRAS Mutated HCT-15 Cells, and a Cancer Preventive FOXO3/FOXM1 Ratio in Combination with TNKS Inhibition

 ,
,  and
and 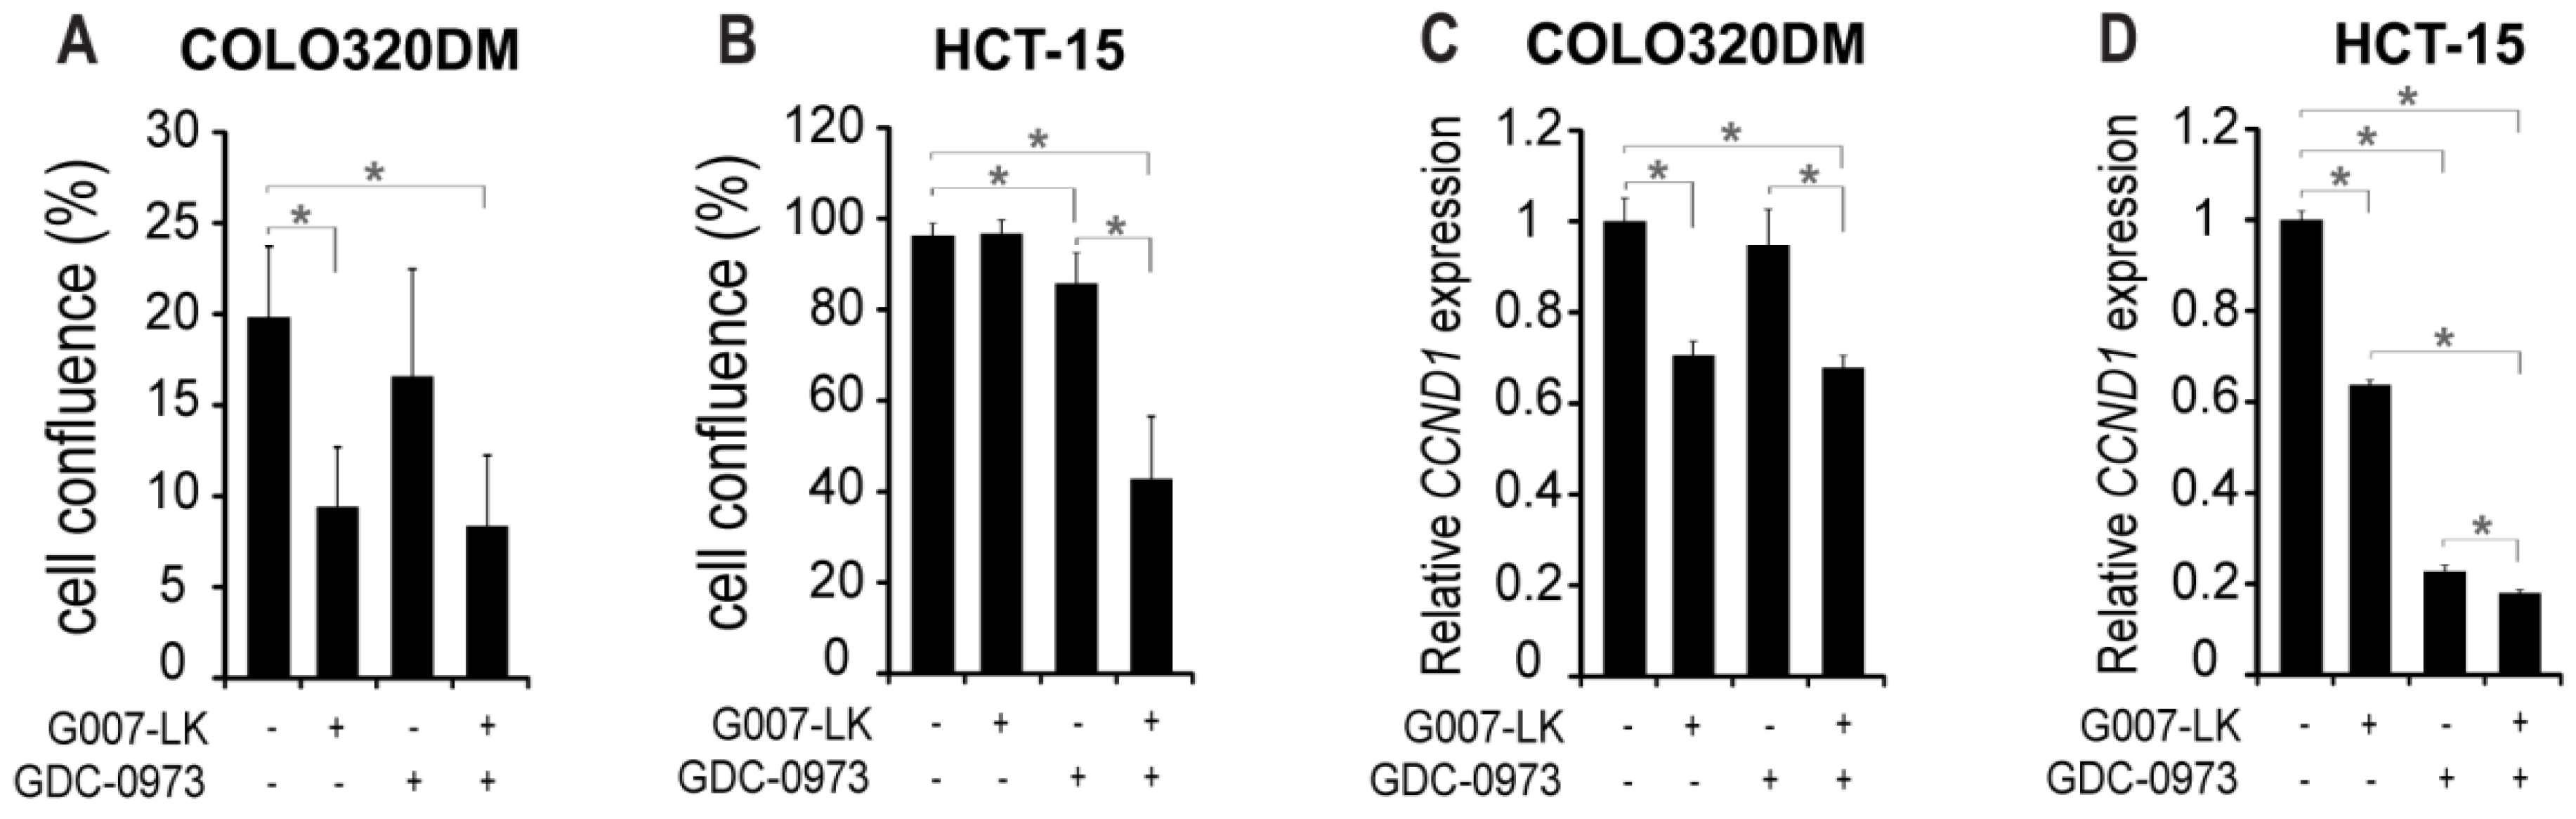
Abstract
1. Introduction
2. Results
2.1. MEK Inhibition Sensitizes KRAS Mutant HCT-15 Colorectal Cancer Cells to Tankyrase Inhibition
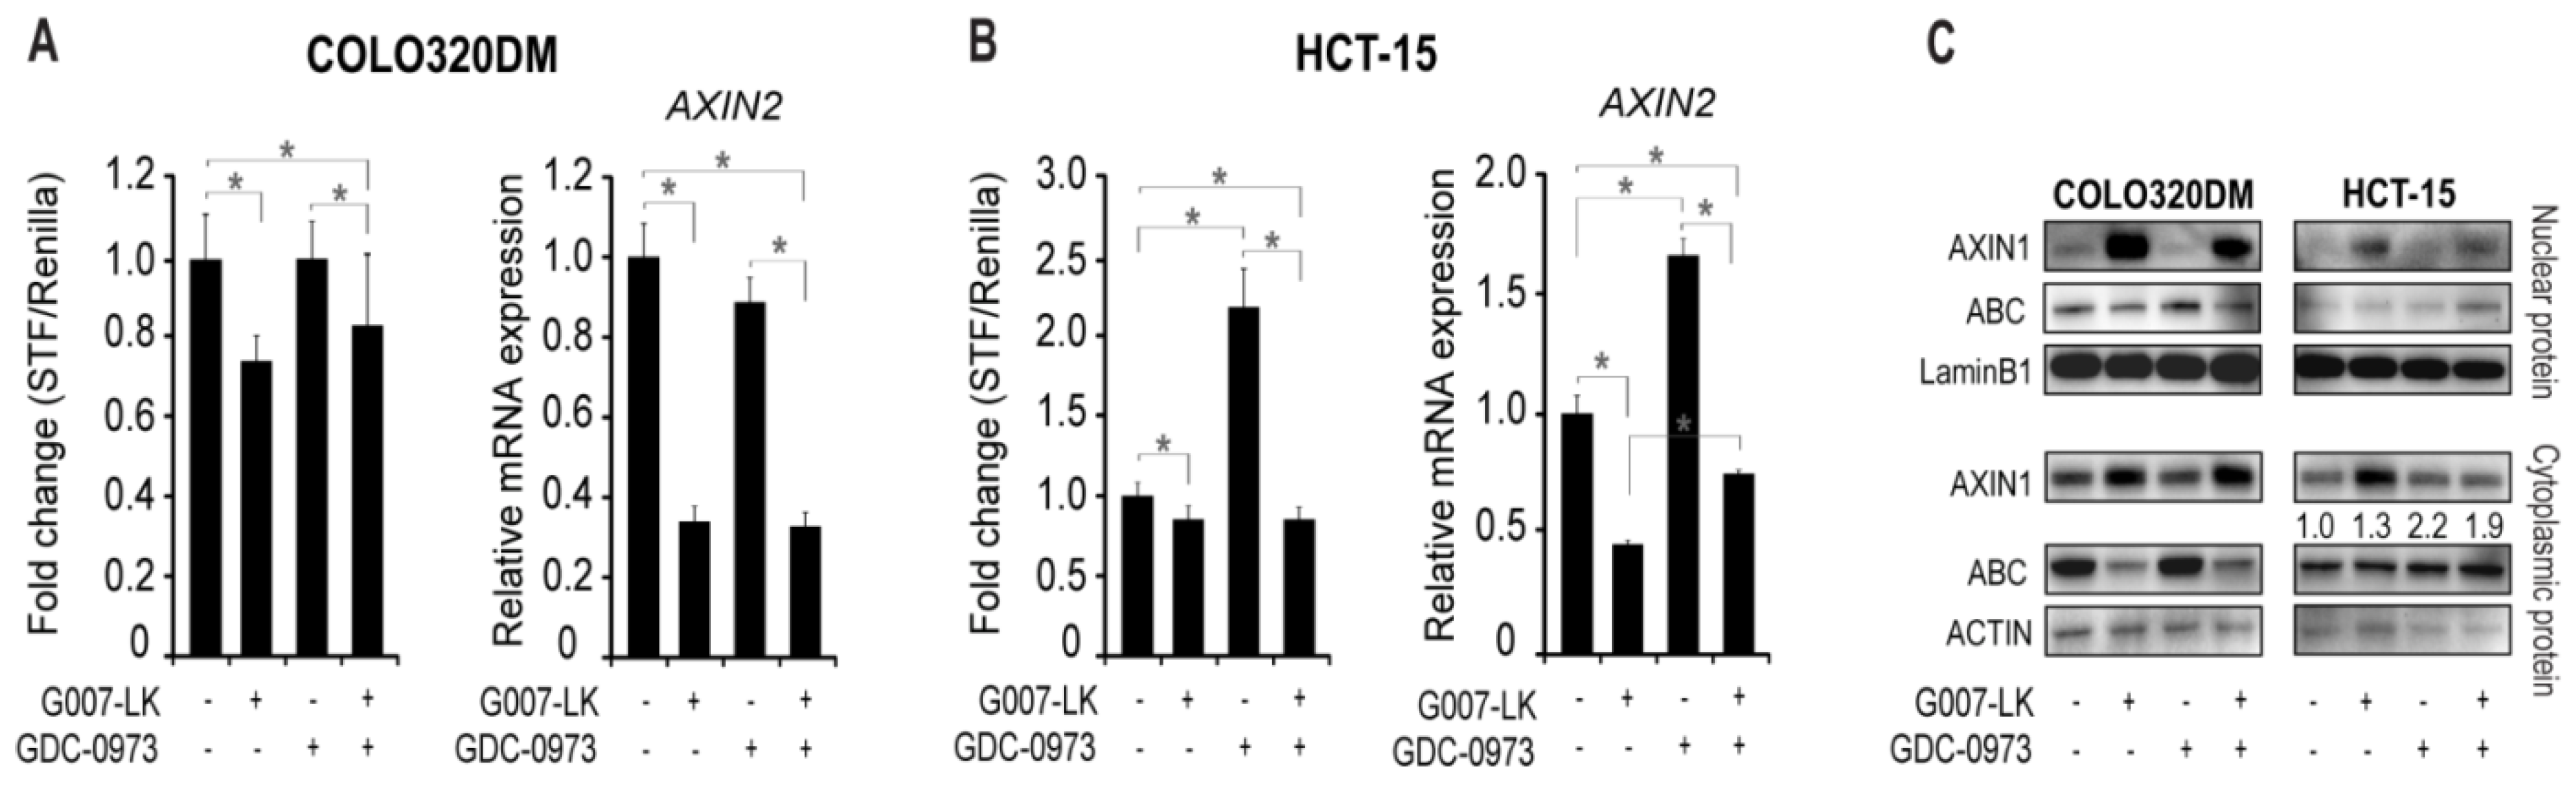
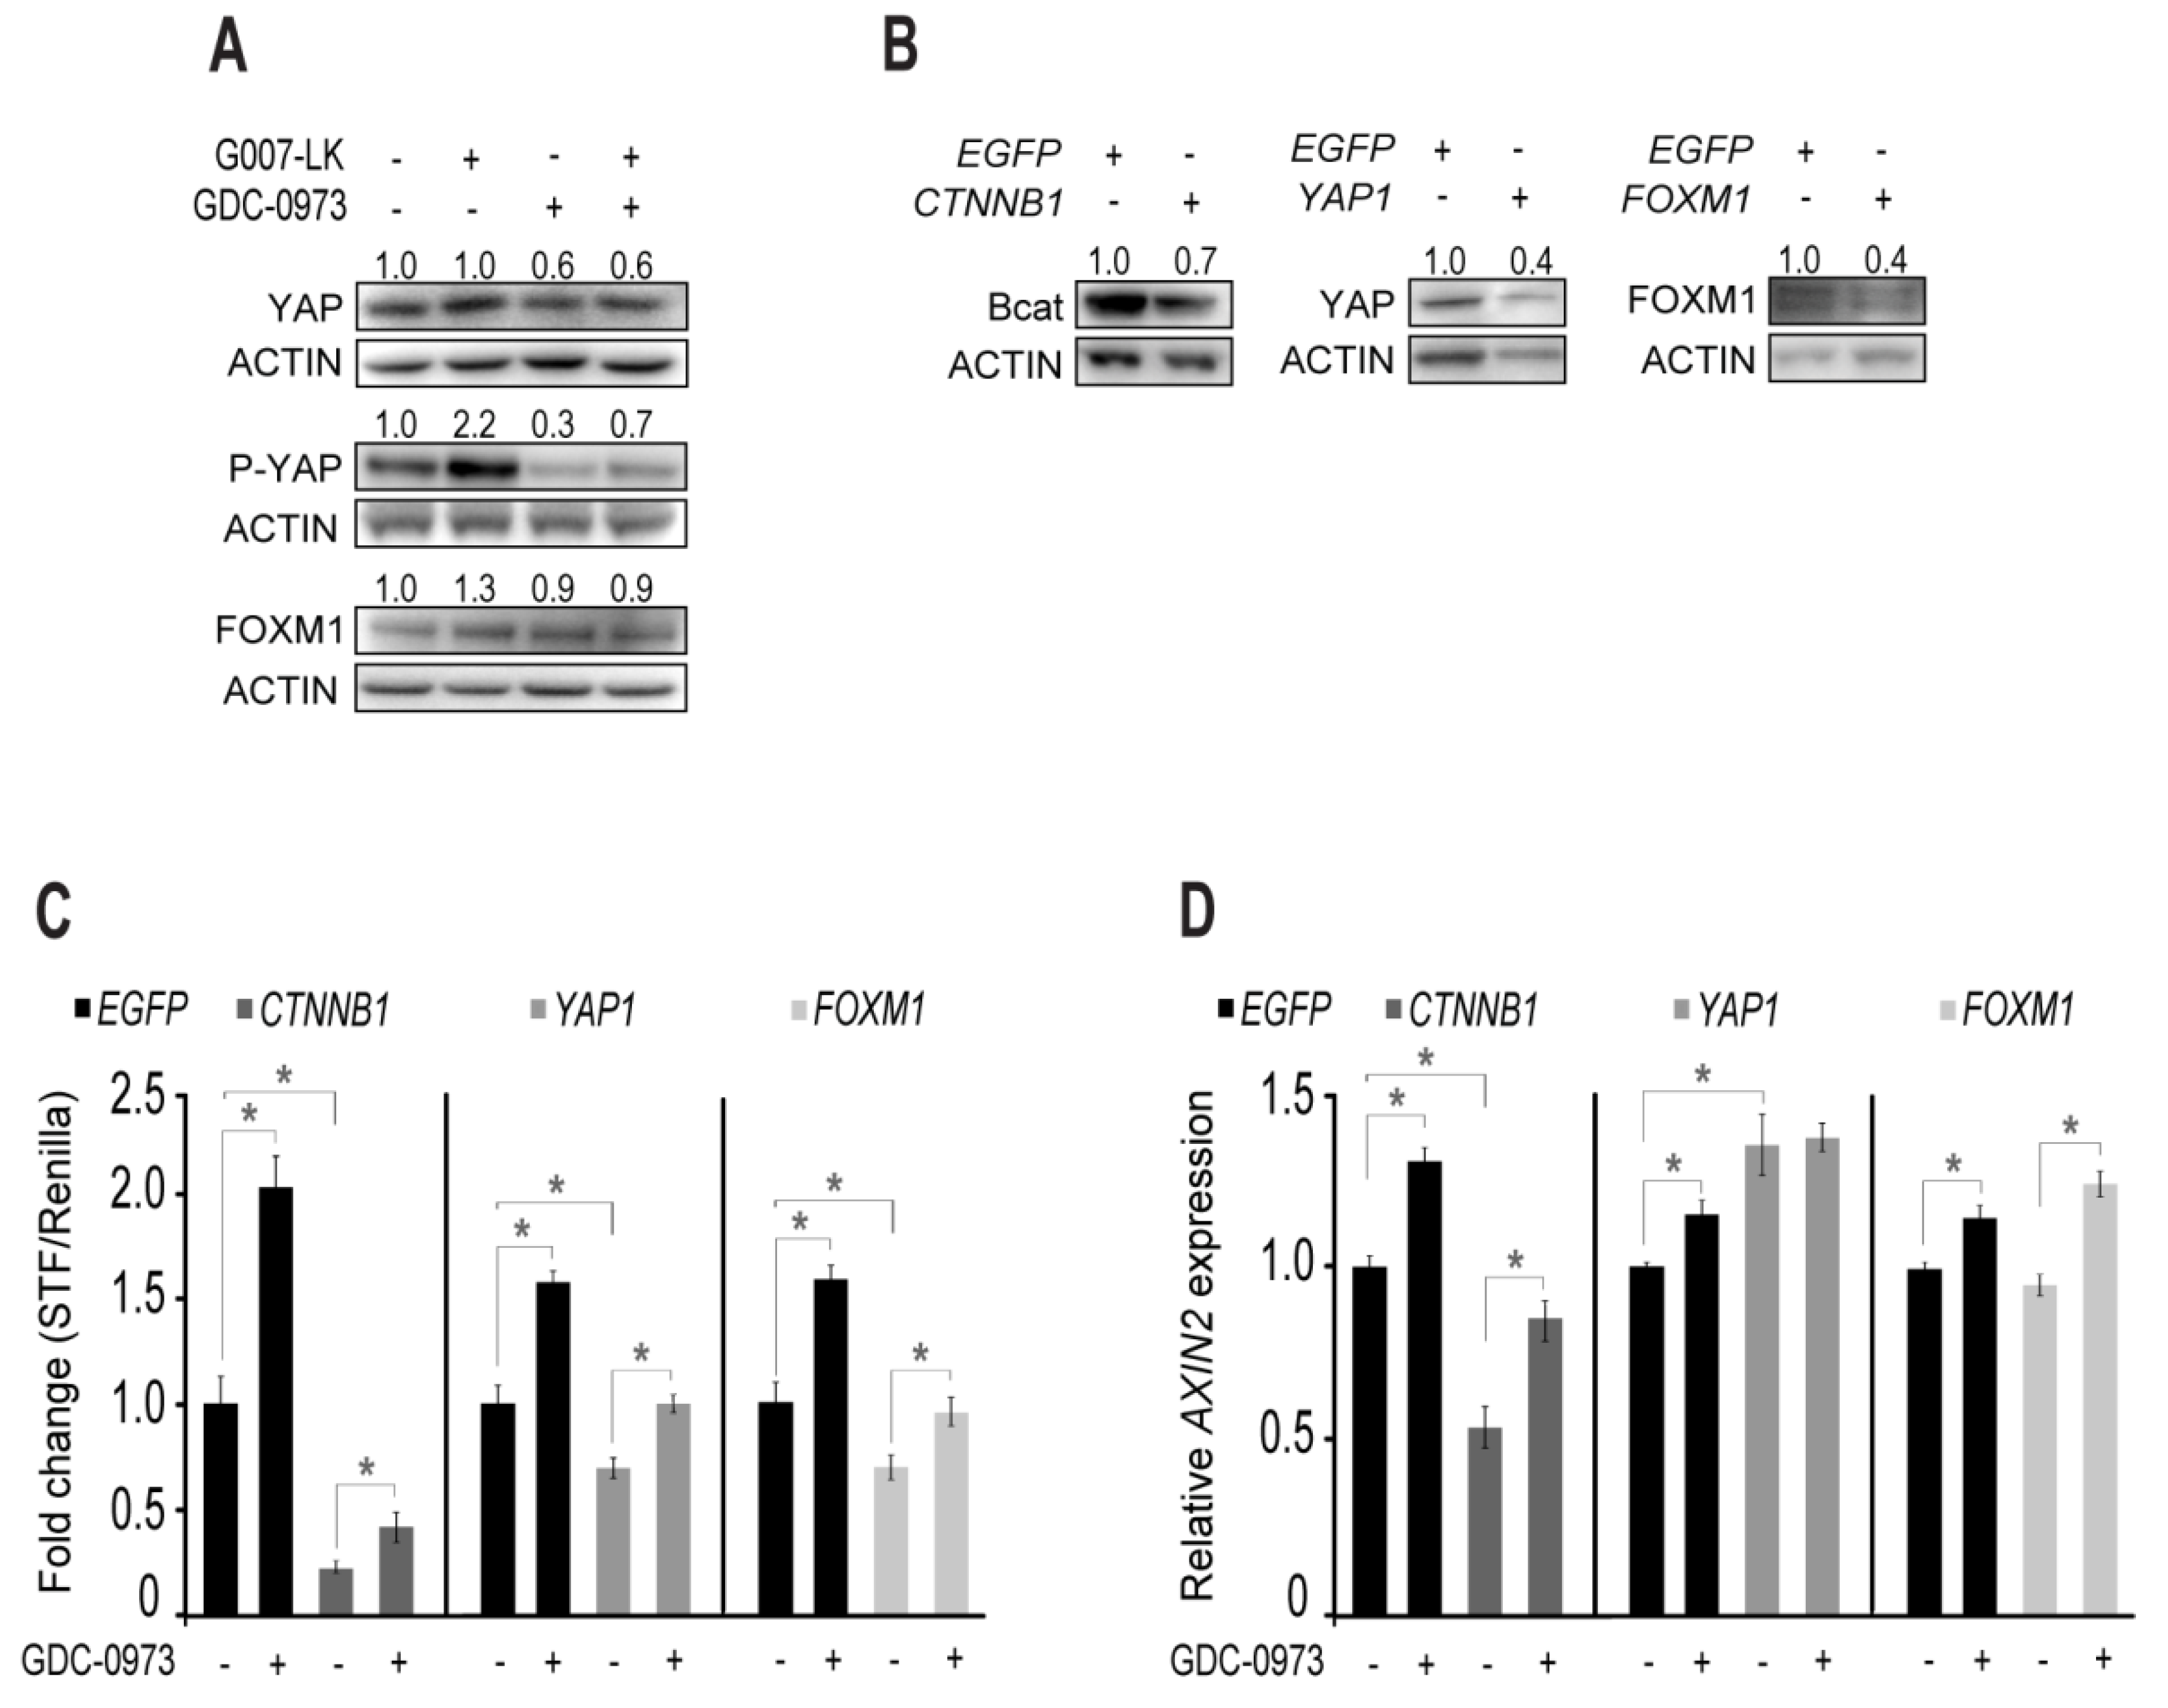
2.2. MEK Inhibition Induces Canonical WNT Signaling in HCT-15 Cells
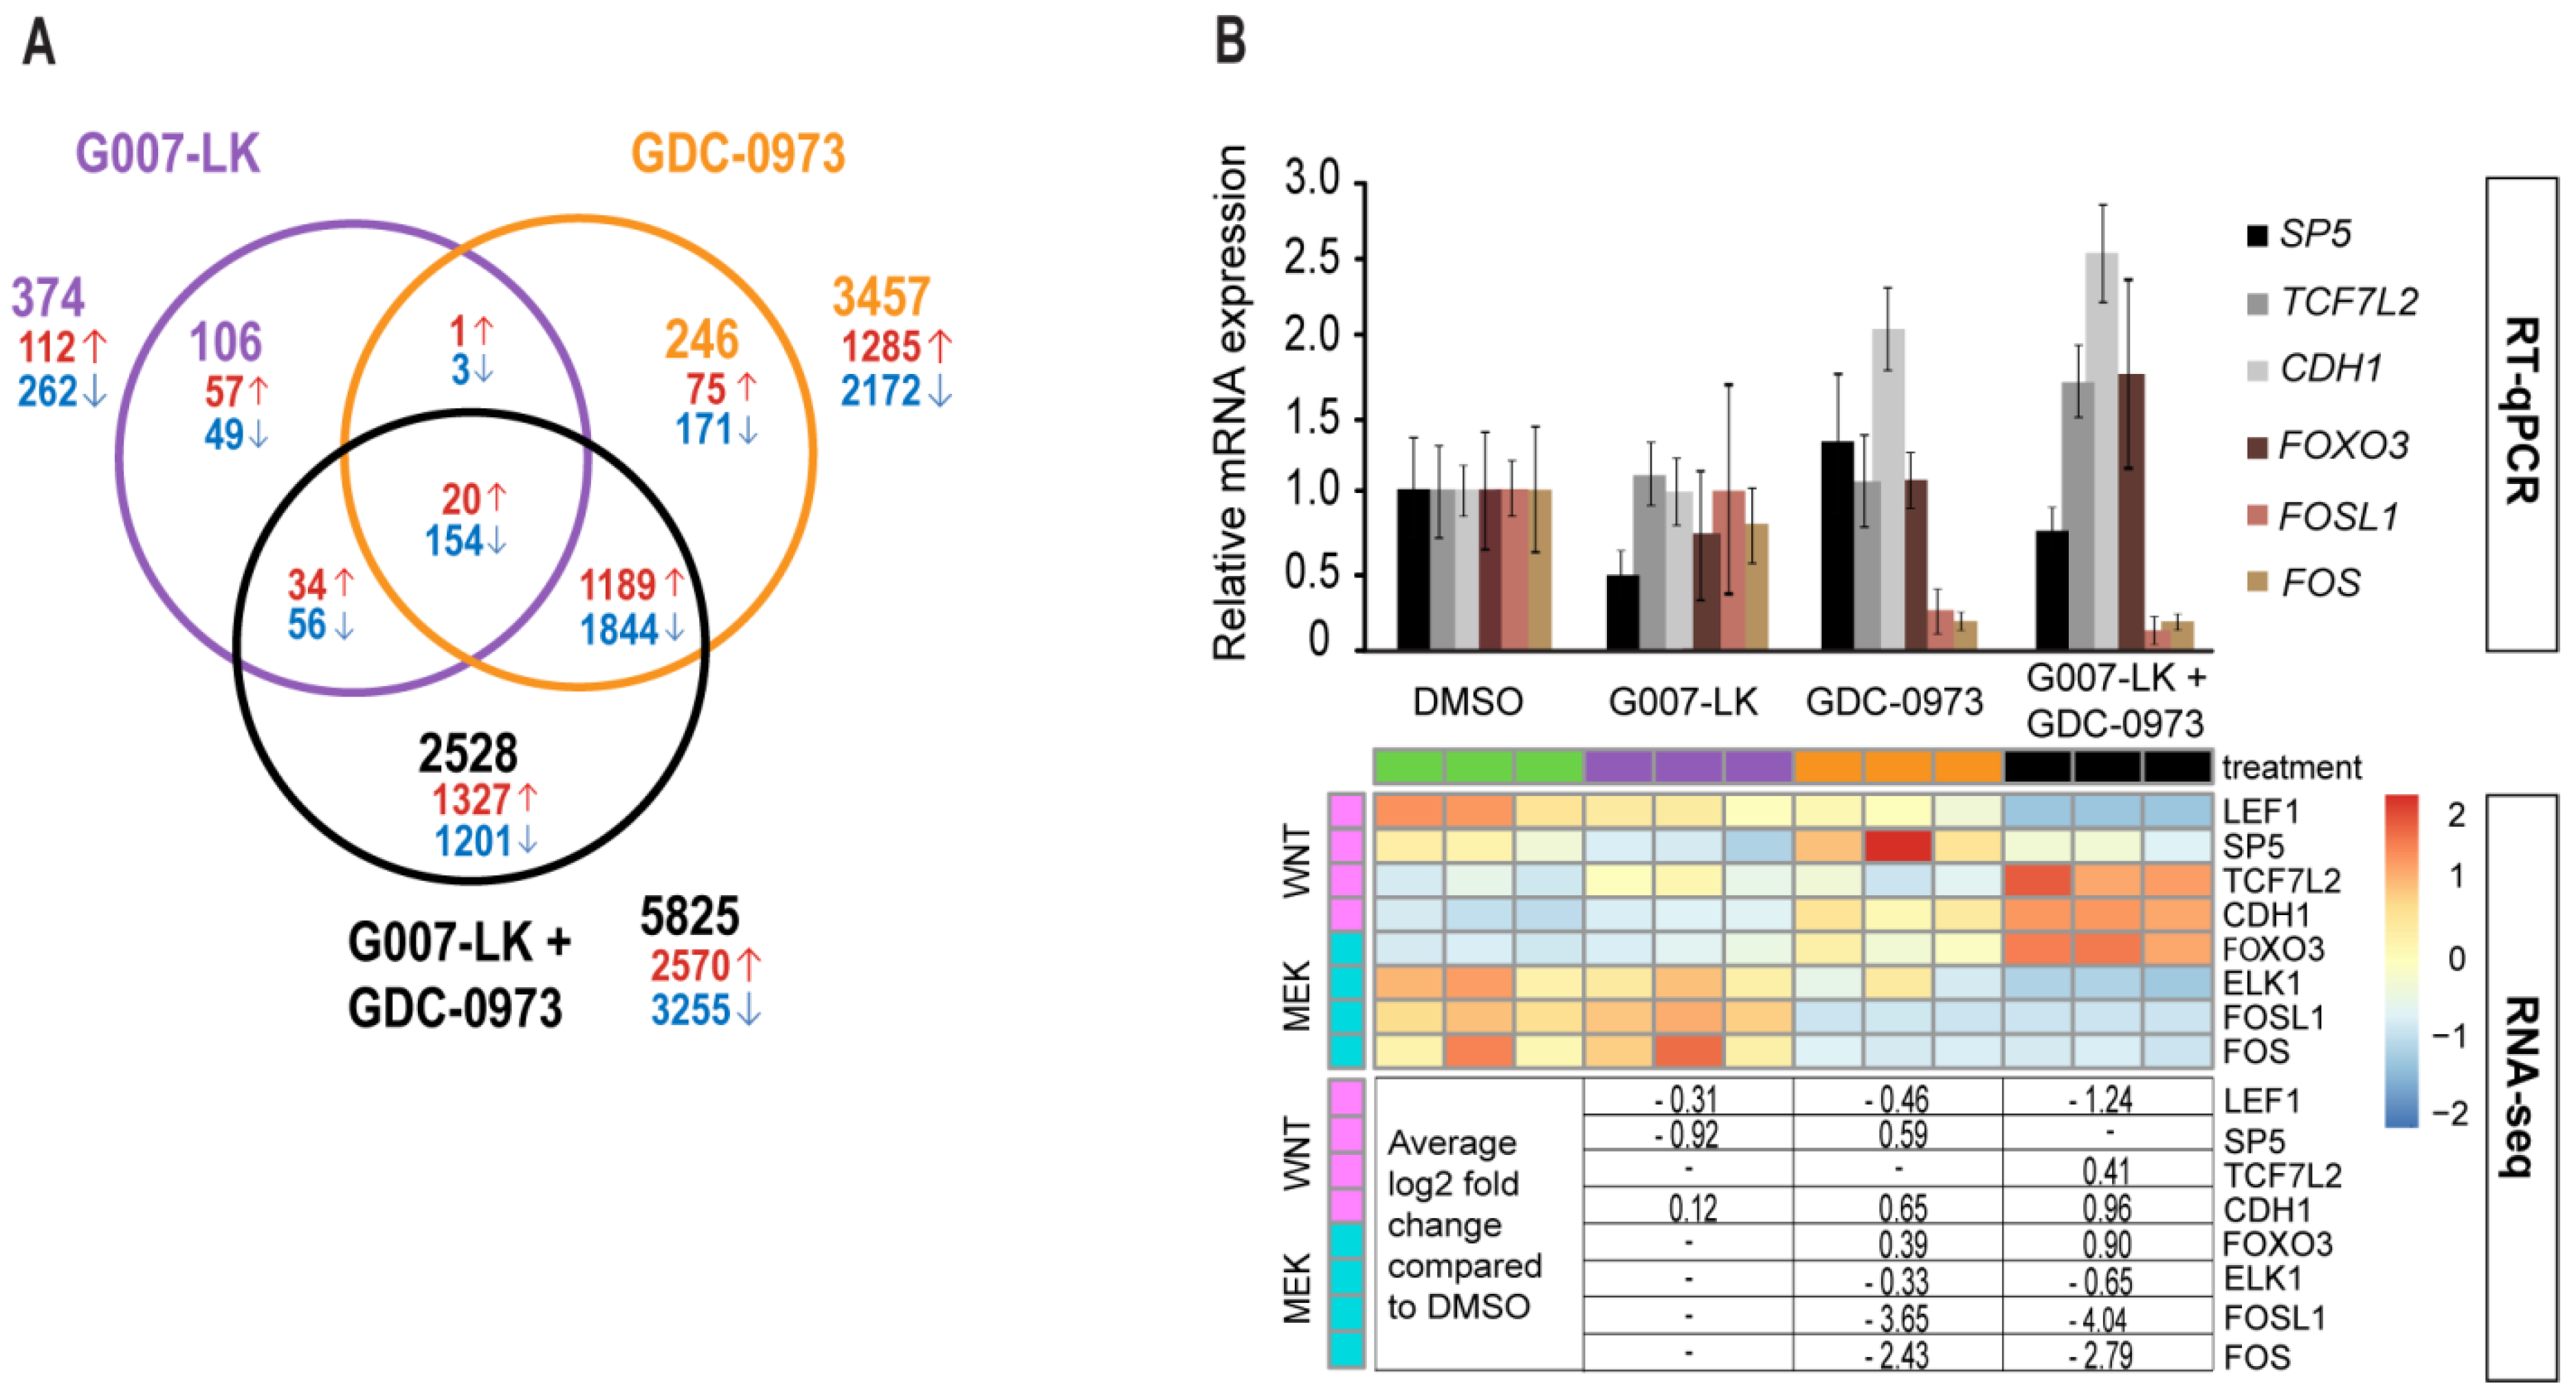
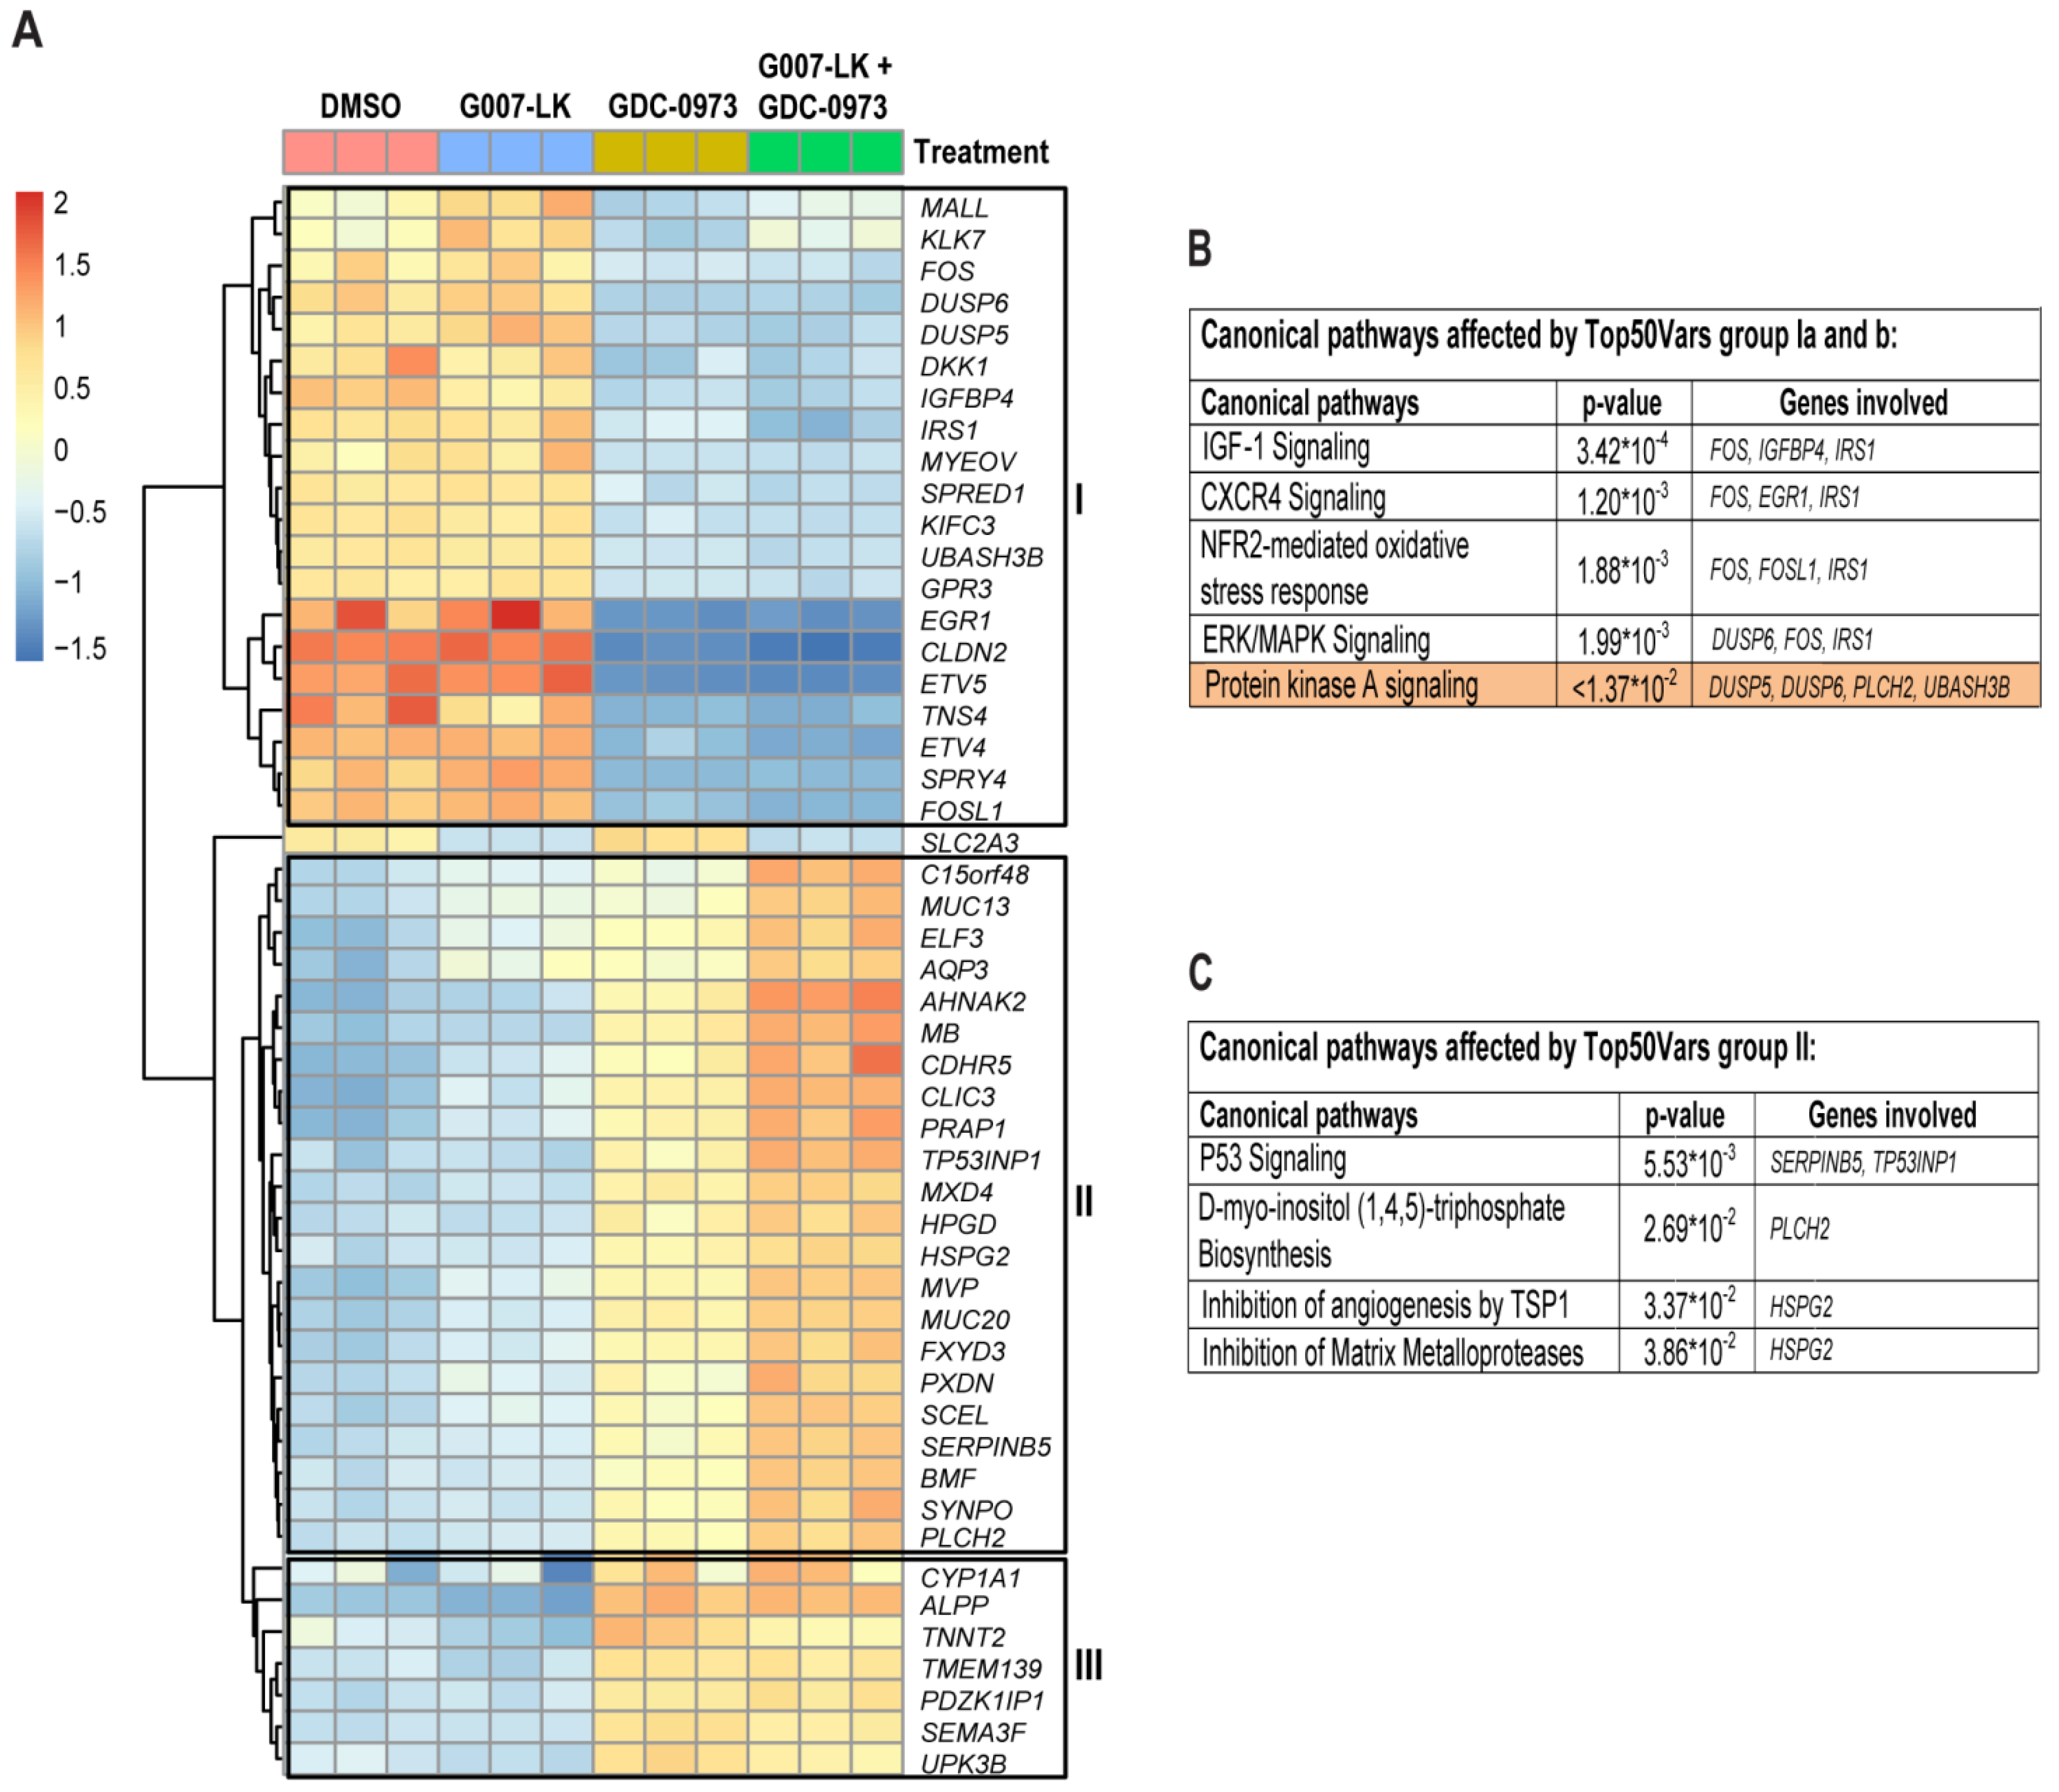
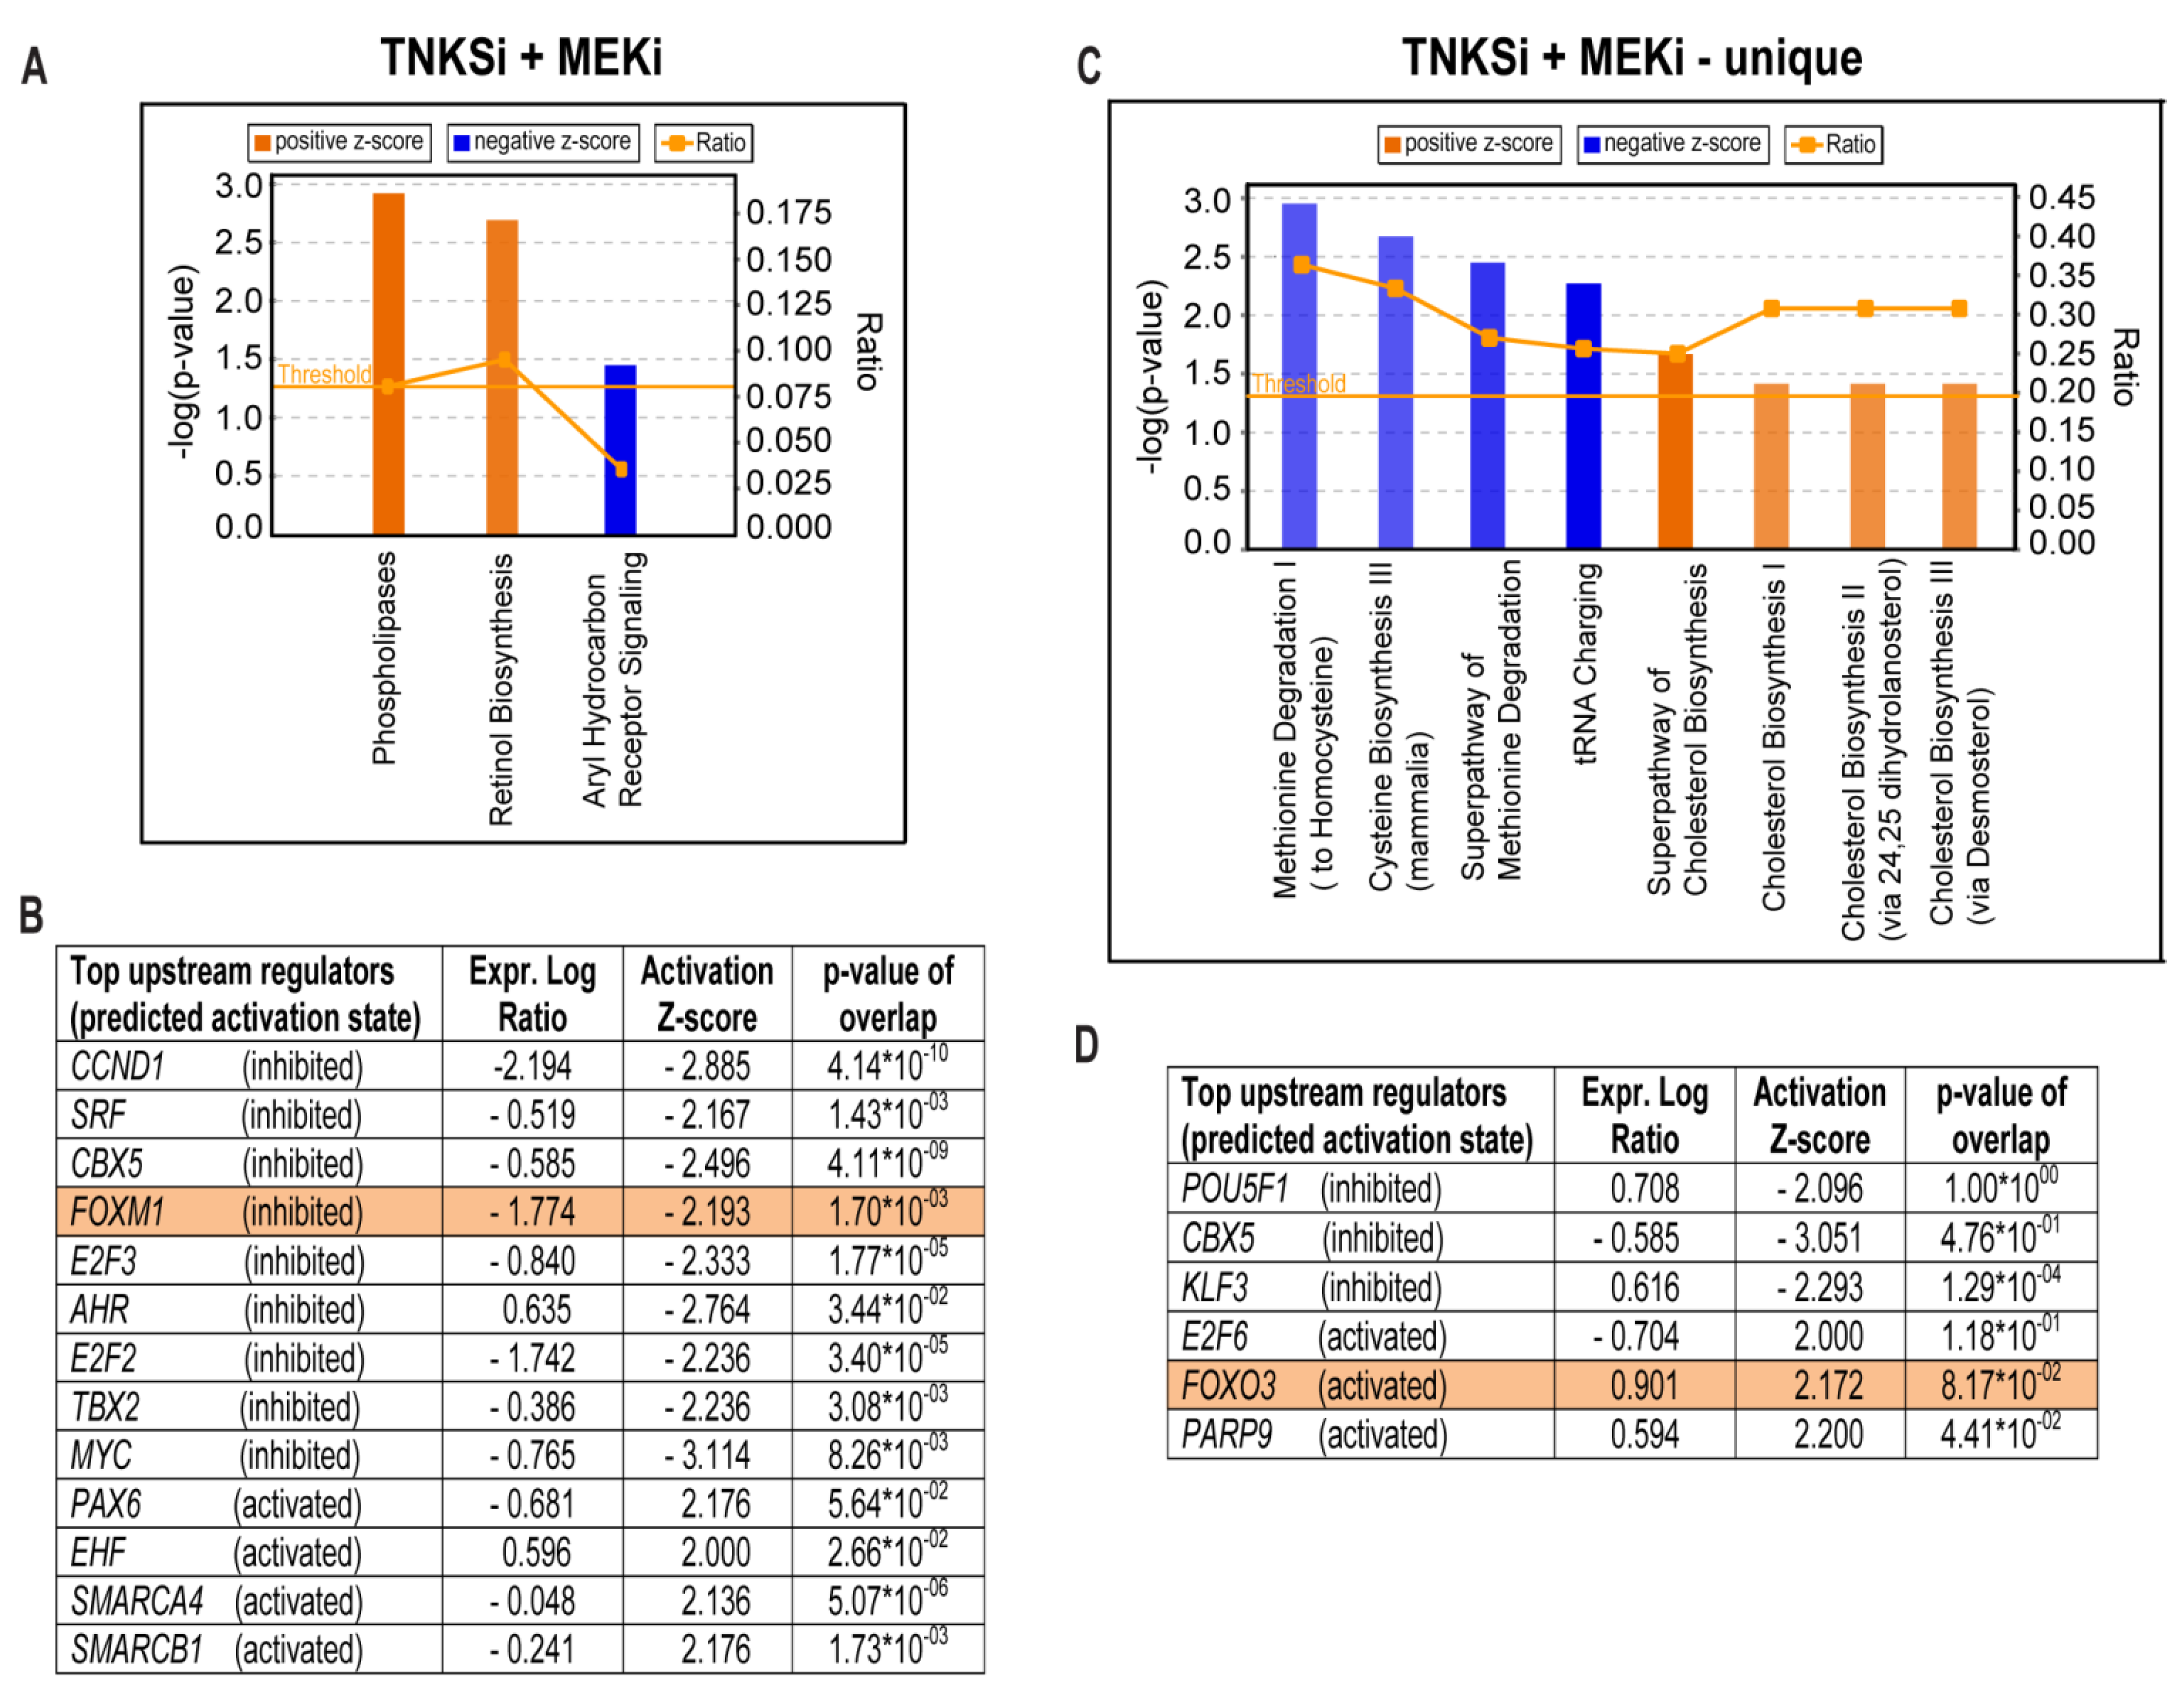
2.3. RNAseq Analysis Reveals a Positive FOXO3/FOXM1 Ratio with Combined TNKS/MEK Inhibition in HCT-15 Cells
2.4. RNAseq Analysis Suggests YAP or FOXM1 Mediated Induction of Canonical WNT Signaling
2.5. Feedback Activation of YAP is Responsible for Enhanced AXIN2 Transcription upon MEK Inhibition in HCT-15 Cells
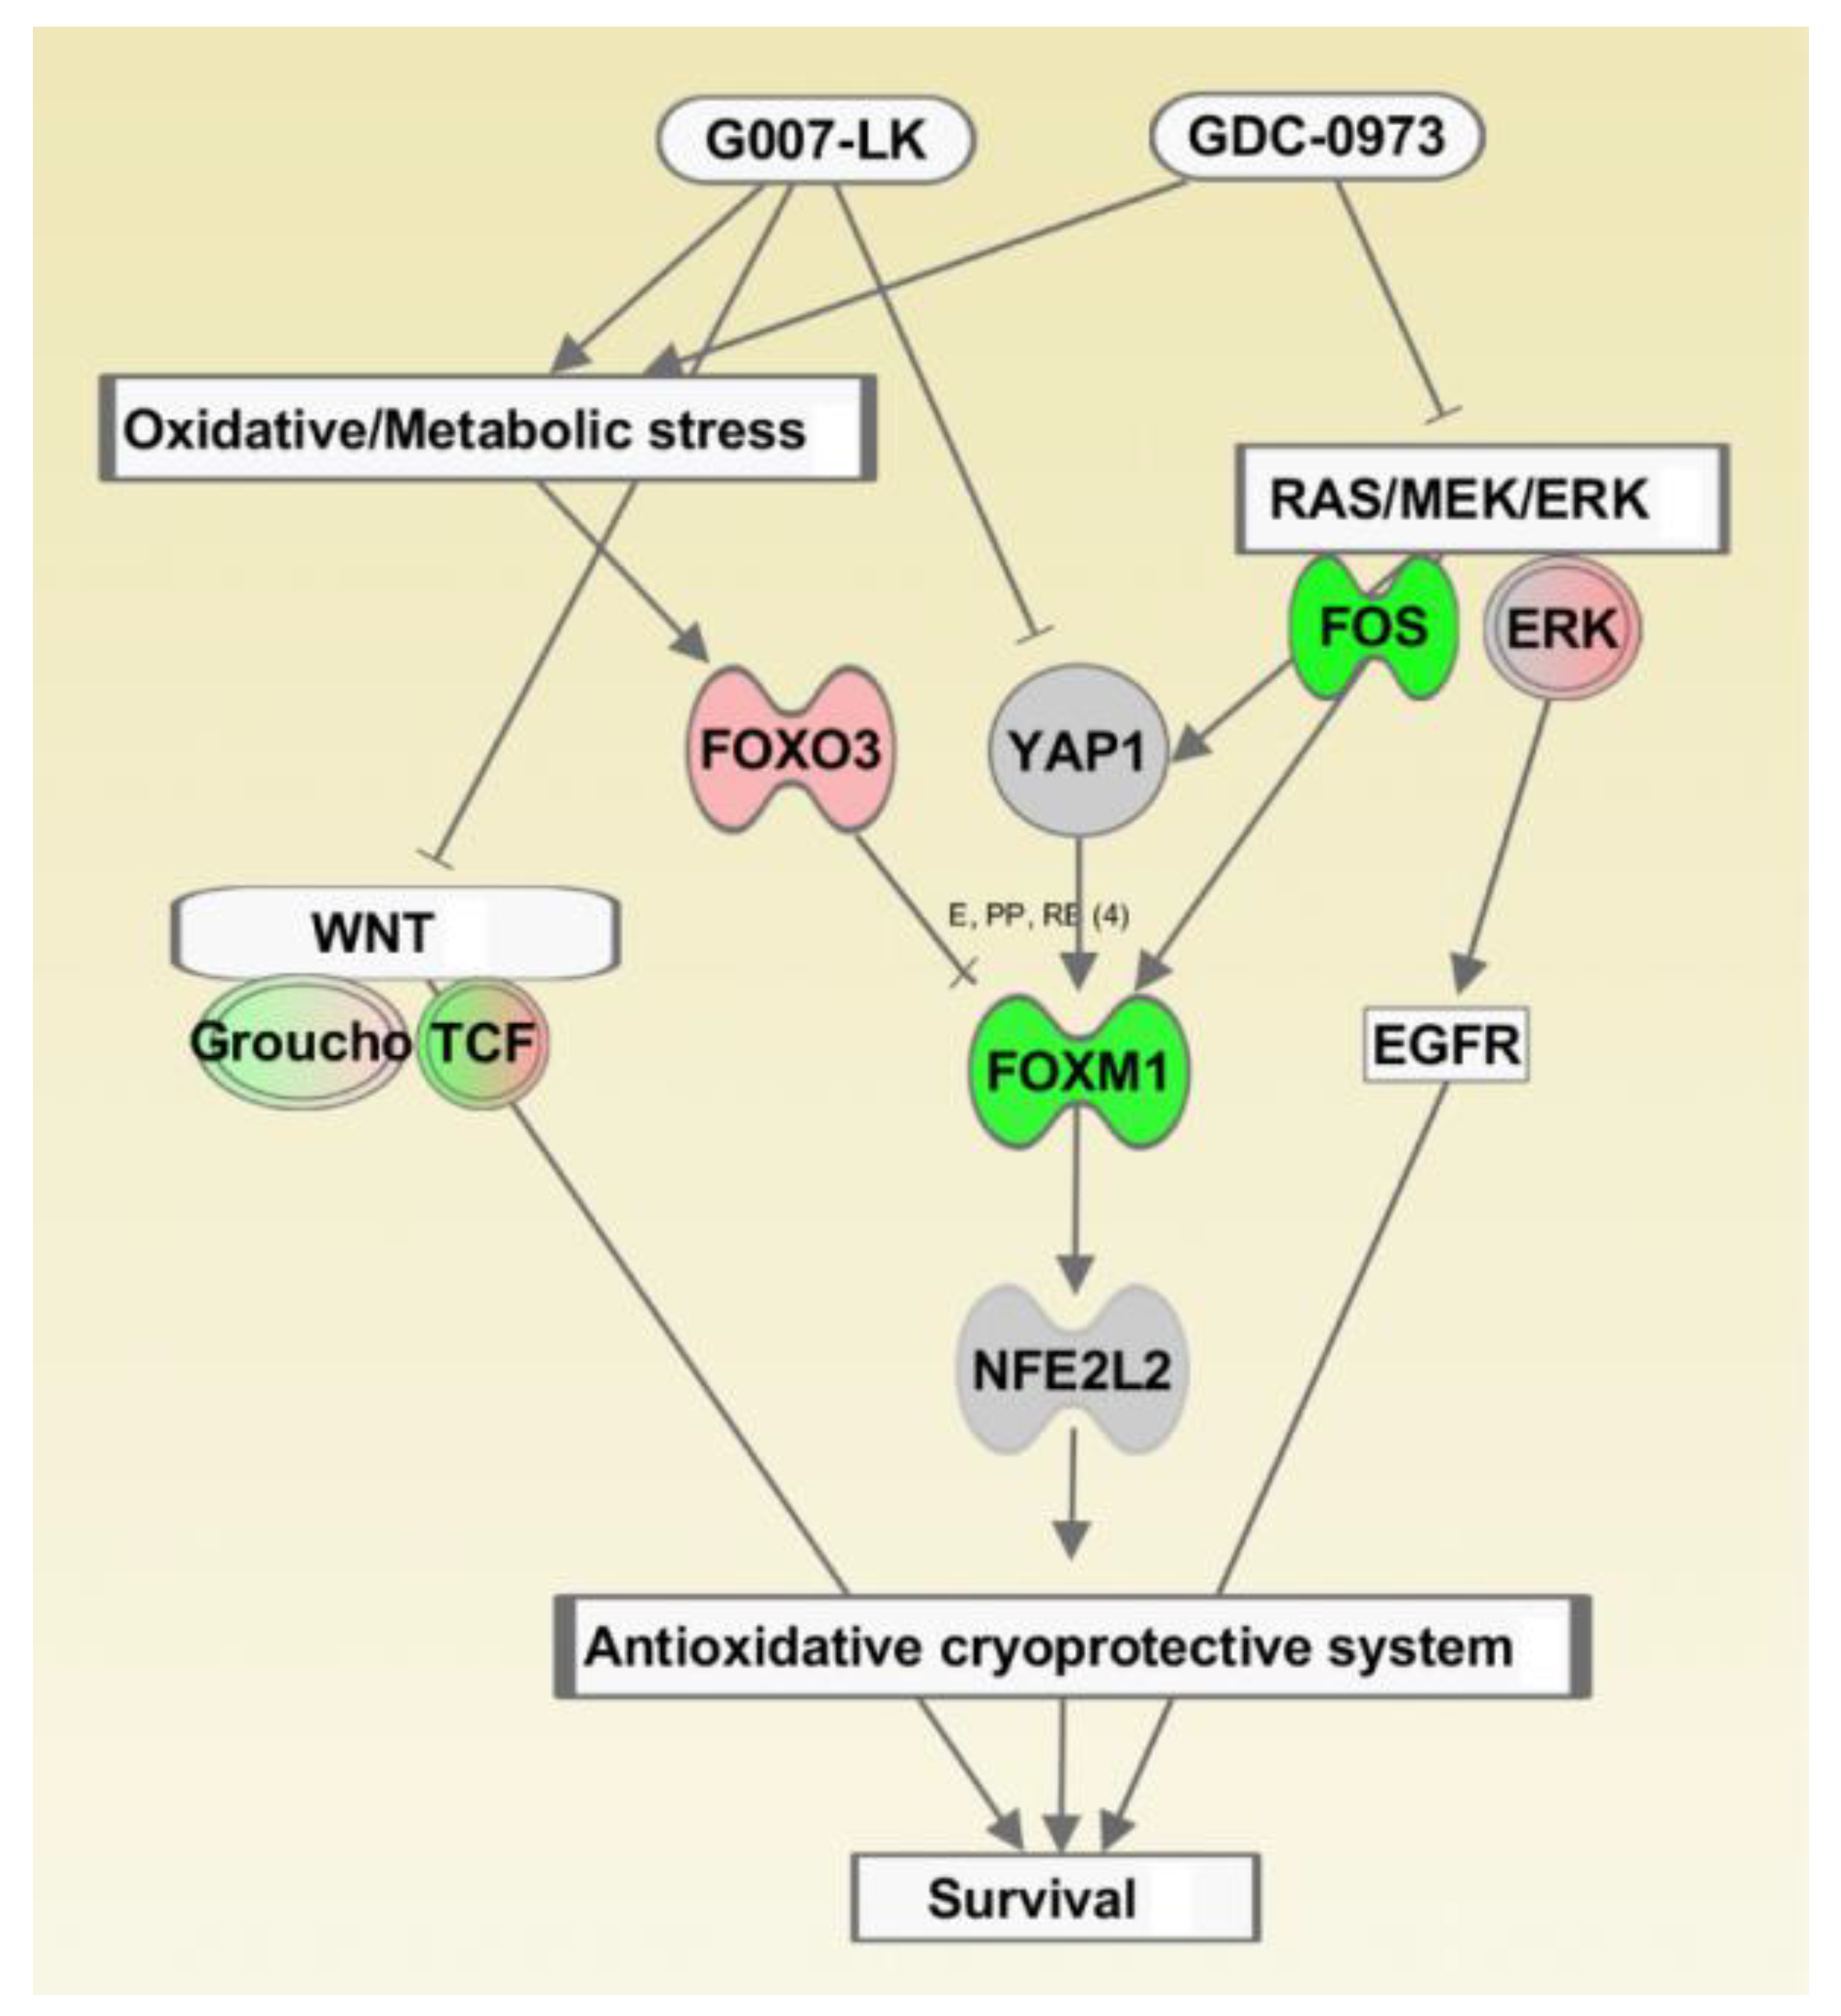
3. Discussion
4. Materials and Methods
4.1. Cell Lines
4.2. Inhibitors
4.3. Proliferation Analysis
4.4. SuperTopFlash (STF) Assay
4.5. RNA Extraction and Quantitative Real Time PCR (RT-qPCR)
4.6. esiRNA Mediated Knock Down
4.7. RNA Sequencing
4.8. Western Blot Protein Analysis
4.9. Statistical Analysis
5. Conclusions
Supplementary Materials
Author Contributions
Funding
Conflicts of Interest
References
- World Health Organization. Cancer—The Problem. Available online: http://www.who.int/news-room/fact-sheets/detail/cancer (accessed on 21 September 2018).
- Munemitsu, S.; Albert, I.; Souza, B.; Rubinfeld, B.; Polakis, P. Regulation of intracellular beta-catenin levels by the adenomatous polyposis coli (APC) tumor-suppressor protein. Proc. Natl. Acad. Sci. USA 1995, 92, 3046–3050. [Google Scholar] [CrossRef] [PubMed]
- Jeong, W.J.; Ro, E.J.; Choi, K.Y. Interaction between Wnt/beta-catenin and RAS-ERK pathways and an anti-cancer strategy via degradations of beta-catenin and RAS by targeting the Wnt/beta-catenin pathway. NPJ Precis. Oncol. 2018, 2, 5. [Google Scholar] [CrossRef] [PubMed]
- Phelps, R.A.; Chidester, S.; Dehghanizadeh, S.; Phelps, J.; Sandoval, I.T.; Rai, K.; Broadbent, T.; Sarkar, S.; Burt, R.W.; Jones, D.A. A two-step model for colon adenoma initiation and progression caused by APC loss. Cell 2009, 137, 623–634. [Google Scholar] [CrossRef]
- Fearon, E.R. Molecular genetics of colorectal cancer. Annu. Rev. Pathol. 2011, 6, 479–507. [Google Scholar] [CrossRef] [PubMed]
- Moon, B.S.; Jeong, W.J.; Park, J.; Kim, T.I.; Min do, S.; Choi, K.Y. Role of oncogenic K-Ras in cancer stem cell activation by aberrant Wnt/beta-catenin signaling. J. Natl. Cancer Inst. 2014, 106, djt373. [Google Scholar] [CrossRef] [PubMed]
- Jeong, W.J.; Yoon, J.; Park, J.C.; Lee, S.H.; Lee, S.H.; Kaduwal, S.; Kim, H.; Yoon, J.B.; Choi, K.Y. Ras stabilization through aberrant activation of Wnt/beta-catenin signaling promotes intestinal tumorigenesis. Sci. Signal. 2012, 5, ra30. [Google Scholar] [CrossRef] [PubMed]
- Kimelman, D.; Xu, W. beta-catenin destruction complex: Insights and questions from a structural perspective. Oncogene 2006, 25, 7482–7491. [Google Scholar] [CrossRef]
- Huang, S.M.; Mishina, Y.M.; Liu, S.; Cheung, A.; Stegmeier, F.; Michaud, G.A.; Charlat, O.; Wiellette, E.; Zhang, Y.; Wiessner, S.; et al. Tankyrase inhibition stabilizes axin and antagonizes Wnt signalling. Nature 2009, 461, 614–620. [Google Scholar] [CrossRef]
- Waaler, J.; Machon, O.; Tumova, L.; Dinh, H.; Korinek, V.; Wilson, S.R.; Paulsen, J.E.; Pedersen, N.M.; Eide, T.J.; Machonova, O.; et al. A novel tankyrase inhibitor decreases canonical Wnt signaling in colon carcinoma cells and reduces tumor growth in conditional APC mutant mice. Cancer Res. 2012, 72, 2822–2832. [Google Scholar] [CrossRef]
- Lin, L.; Bivona, T.G. The Hippo effector YAP regulates the response of cancer cells to MAPK pathway inhibitors. Mol Cell. Oncol. 2016, 3, e1021441. [Google Scholar] [CrossRef]
- Casas-Selves, M.; Kim, J.; Zhang, Z.; Helfrich, B.A.; Gao, D.; Porter, C.C.; Scarborough, H.A.; Bunn, P.A., Jr.; Chan, D.C.; Tan, A.C.; et al. Tankyrase and the canonical Wnt pathway protect lung cancer cells from EGFR inhibition. Cancer Res. 2012, 72, 4154–4164. [Google Scholar] [CrossRef]
- Schoumacher, M.; Hurov, K.E.; Lehar, J.; Yan-Neale, Y.; Mishina, Y.; Sonkin, D.; Korn, J.M.; Flemming, D.; Jones, M.D.; Antonakos, B.; et al. Inhibiting Tankyrases sensitizes KRAS-mutant cancer cells to MEK inhibitors via FGFR2 feedback signaling. Cancer Res. 2014, 74, 3294–3305. [Google Scholar] [CrossRef]
- Solberg, N.T.; Waaler, J.; Lund, K.; Mygland, L.; Olsen, P.A.; Krauss, S. TANKYRASE Inhibition Enhances the Antiproliferative Effect of PI3K and EGFR Inhibition, Mutually Affecting beta-CATENIN and AKT Signaling in Colorectal Cancer. Mol. Cancer Res. 2018, 16, 543–553. [Google Scholar] [CrossRef] [PubMed]
- Voronkov, A.; Holsworth, D.D.; Waaler, J.; Wilson, S.R.; Ekblad, B.; Perdreau-Dahl, H.; Dinh, H.; Drewes, G.; Hopf, C.; Morth, J.P.; et al. Structural basis and SAR for G007-LK, a lead stage 1,2,4-triazole based specific tankyrase 1/2 inhibitor. J. Med. Chem. 2013, 56, 3012–3023. [Google Scholar] [CrossRef] [PubMed]
- Hoeflich, K.P.; Merchant, M.; Orr, C.; Chan, J.; Den Otter, D.; Berry, L.; Kasman, I.; Koeppen, H.; Rice, K.; Yang, N.Y.; et al. Intermittent administration of MEK inhibitor GDC-0973 plus PI3K inhibitor GDC-0941 triggers robust apoptosis and tumor growth inhibition. Cancer Res. 2012, 72, 210–219. [Google Scholar] [CrossRef] [PubMed]
- Perez-Roger, I.; Kim, S.H.; Griffiths, B.; Sewing, A.; Land, H. Cyclins D1 and D2 mediate myc-induced proliferation via sequestration of p27(Kip1) and p21(Cip1). EMBO J. 1999, 18, 5310–5320. [Google Scholar] [CrossRef] [PubMed]
- Jeanteur, P. [The role of APC in colonic cancerogenesis: Zeroing in on Myc]. Bull. Cancer 1998, 85, 925–928. [Google Scholar]
- Mouradov, D.; Sloggett, C.; Jorissen, R.N.; Love, C.G.; Li, S.; Burgess, A.W.; Arango, D.; Strausberg, R.L.; Buchanan, D.; Wormald, S.; et al. Colorectal cancer cell lines are representative models of the main molecular subtypes of primary cancer. Cancer Res. 2014, 74, 3238–3247. [Google Scholar] [CrossRef]
- Lustig, B.; Jerchow, B.; Sachs, M.; Weiler, S.; Pietsch, T.; Karsten, U.; van de Wetering, M.; Clevers, H.; Schlag, P.M.; Birchmeier, W.; et al. Negative feedback loop of Wnt signaling through upregulation of conductin/axin2 in colorectal and liver tumors. Mol. Cell. Biol. 2002, 22, 1184–1193. [Google Scholar] [CrossRef]
- Jho, E.H.; Zhang, T.; Domon, C.; Joo, C.K.; Freund, J.N.; Costantini, F. Wnt/beta-catenin/Tcf signaling induces the transcription of Axin2, a negative regulator of the signaling pathway. Mol. Cell. Biol. 2002, 22, 1172–1183. [Google Scholar] [CrossRef]
- Lau, T.; Chan, E.; Callow, M.; Waaler, J.; Boggs, J.; Blake, R.A.; Magnuson, S.; Sambrone, A.; Schutten, M.; Firestein, R.; et al. A novel tankyrase small-molecule inhibitor suppresses APC mutation-driven colorectal tumor growth. Cancer Res. 2013, 73, 3132–3144. [Google Scholar] [CrossRef]
- Wang, B.; Krall, E.B.; Aguirre, A.J.; Kim, M.; Widlund, H.R.; Doshi, M.B.; Sicinska, E.; Sulahian, R.; Goodale, A.; Cowley, G.S.; et al. ATXN1L, CIC, and ETS Transcription Factors Modulate Sensitivity to MAPK Pathway Inhibition. Cell Rep. 2017, 18, 1543–1557. [Google Scholar] [CrossRef]
- Lawlor, G.; Doran, P.P.; MacMathuna, P.; Murray, D.W. MYEOV (myeloma overexpressed gene) drives colon cancer cell migration and is regulated by PGE2. J. Exp. Clin. Cancer Res. 2010, 29, 81. [Google Scholar] [CrossRef]
- Gu, X.; Li, B.; Jiang, M.; Fang, M.; Ji, J.; Wang, A.; Wang, M.; Jiang, X.; Gao, C. RNA sequencing reveals differentially expressed genes as potential diagnostic and prognostic indicators of gallbladder carcinoma. Oncotarget 2015, 6, 20661–20671. [Google Scholar] [CrossRef]
- Huang, B.H.; Zhuo, J.L.; Leung, C.H.; Lu, G.D.; Liu, J.J.; Yap, C.T.; Hooi, S.C. PRAP1 is a novel executor of p53-dependent mechanisms in cell survival after DNA damage. Cell Death Dis. 2012, 3, e442. [Google Scholar] [CrossRef]
- Wang, M.; Li, X.; Zhang, J.; Yang, Q.; Chen, W.; Jin, W.; Huang, Y.R.; Yang, R.; Gao, W.Q. AHNAK2 is a Novel Prognostic Marker and Oncogenic Protein for Clear Cell Renal Cell Carcinoma. Theranostics 2017, 7, 1100–1113. [Google Scholar] [CrossRef]
- Yao, S.; Fan, L.Y.; Lam, E.W. The FOXO3-FOXM1 axis: A key cancer drug target and a modulator of cancer drug resistance. Semin. Cancer Biol. 2018, 50, 77–89. [Google Scholar] [CrossRef]
- Yung, M.M.; Chan, D.W.; Liu, V.W.; Yao, K.M.; Ngan, H.Y. Activation of AMPK inhibits cervical cancer cell growth through AKT/FOXO3a/FOXM1 signaling cascade. BMC Cancer 2013, 13, 327. [Google Scholar] [CrossRef]
- Gong, X.D.; Yuan, H.H.; Wang, J.Y.; Guo, Y.H.; Shi, J.; Jiang, B. [Effects of AG1478 on the expression of FOXM1 gene via FOXO3a in non-small cell lung cancer cells]. Zhonghua Zhong Liu Za Zhi 2013, 35, 572–578. [Google Scholar]
- Lam, E.W.; Brosens, J.J.; Gomes, A.R.; Koo, C.Y. Forkhead box proteins: Tuning forks for transcriptional harmony. Nat. Rev. Cancer 2013, 13, 482–495. [Google Scholar] [CrossRef]
- Karadedou, C.T.; Gomes, A.R.; Chen, J.; Petkovic, M.; Ho, K.K.; Zwolinska, A.K.; Feltes, A.; Wong, S.Y.; Chan, K.Y.; Cheung, Y.N.; et al. FOXO3a represses VEGF expression through FOXM1-dependent and -independent mechanisms in breast cancer. Oncogene 2012, 31, 1845–1858. [Google Scholar] [CrossRef]
- Kim, J.H.; Park, S.Y.; Jun, Y.; Kim, J.Y.; Nam, J.S. Roles of Wnt Target Genes in the Journey of Cancer Stem Cells. Int. J. Mol. Sci. 2017, 18. [Google Scholar] [CrossRef]
- Wei, X.; Ye, J.; Shang, Y.; Chen, H.; Liu, S.; Liu, L.; Wang, R. Ascl2 activation by YAP1/KLF5 ensures the self-renewability of colon cancer progenitor cells. Oncotarget 2017, 8, 109301–109318. [Google Scholar] [CrossRef]
- Rosenbluh, J.; Nijhawan, D.; Cox, A.G.; Li, X.; Neal, J.T.; Schafer, E.J.; Zack, T.I.; Wang, X.; Tsherniak, A.; Schinzel, A.C.; et al. beta-Catenin-driven cancers require a YAP1 transcriptional complex for survival and tumorigenesis. Cell 2012, 151, 1457–1473. [Google Scholar] [CrossRef]
- Kapoor, A.; Yao, W.; Ying, H.; Hua, S.; Liewen, A.; Wang, Q.; Zhong, Y.; Wu, C.J.; Sadanandam, A.; Hu, B.; et al. Yap1 activation enables bypass of oncogenic Kras addiction in pancreatic cancer. Cell 2014, 158, 185–197. [Google Scholar] [CrossRef]
- Fan, Q.; Cai, Q.; Xu, Y. FOXM1 is a downstream target of LPA and YAP oncogenic signaling pathways in high grade serous ovarian cancer. Oncotarget 2015, 6, 27688–27699. [Google Scholar] [CrossRef]
- Wang, I.C.; Snyder, J.; Zhang, Y.; Lander, J.; Nakafuku, Y.; Lin, J.; Chen, G.; Kalin, T.V.; Whitsett, J.A.; Kalinichenko, V.V. Foxm1 mediates cross talk between Kras/mitogen-activated protein kinase and canonical Wnt pathways during development of respiratory epithelium. Mol. Cell. Biol. 2012, 32, 3838–3850. [Google Scholar] [CrossRef]
- Azzolin, L.; Panciera, T.; Soligo, S.; Enzo, E.; Bicciato, S.; Dupont, S.; Bresolin, S.; Frasson, C.; Basso, G.; Guzzardo, V.; et al. YAP/TAZ incorporation in the beta-catenin destruction complex orchestrates the Wnt response. Cell 2014, 158, 157–170. [Google Scholar] [CrossRef]
- Cai, J.; Maitra, A.; Anders, R.A.; Taketo, M.M.; Pan, D. beta-Catenin destruction complex-independent regulation of Hippo-YAP signaling by APC in intestinal tumorigenesis. Genes Dev. 2015, 29, 1493–1506. [Google Scholar] [CrossRef]
- Zhang, N.; Wei, P.; Gong, A.; Chiu, W.T.; Lee, H.T.; Colman, H.; Huang, H.; Xue, J.; Liu, M.; Wang, Y.; et al. FoxM1 promotes beta-catenin nuclear localization and controls Wnt target-gene expression and glioma tumorigenesis. Cancer Cell 2011, 20, 427–442. [Google Scholar] [CrossRef]
- Dong, G.Z.; Jeong, J.H.; Lee, Y.I.; Han, Y.E.; Shin, J.S.; Kim, Y.J.; Jeon, R.; Kim, Y.H.; Park, T.J.; Kim, K.I.; et al. A lignan induces lysosomal dependent degradation of FoxM1 protein to suppress beta-catenin nuclear translocation. Sci. Rep. 2017, 7, 45951. [Google Scholar] [CrossRef]
- Waaler, J.; Machon, O.; von Kries, J.P.; Wilson, S.R.; Lundenes, E.; Wedlich, D.; Gradl, D.; Paulsen, J.E.; Machonova, O.; Dembinski, J.L.; et al. Novel synthetic antagonists of canonical Wnt signaling inhibit colorectal cancer cell growth. Cancer Res. 2011, 71, 197–205. [Google Scholar] [CrossRef] [PubMed]
- Jia, J.; Qiao, Y.; Pilo, M.G.; Cigliano, A.; Liu, X.; Shao, Z.; Calvisi, D.F.; Chen, X. Tankyrase inhibitors suppress hepatocellular carcinoma cell growth via modulating the Hippo cascade. PLoS ONE 2017, 12, e0184068. [Google Scholar] [CrossRef] [PubMed]
- Miyaki, M.; Konishi, M.; Kikuchi-Yanoshita, R.; Enomoto, M.; Igari, T.; Tanaka, K.; Muraoka, M.; Takahashi, H.; Amada, Y.; Fukayama, M.; et al. Characteristics of somatic mutation of the adenomatous polyposis coli gene in colorectal tumors. Cancer Res. 1994, 54, 3011–3020. [Google Scholar]
- Lin, L.; Sabnis, A.J.; Chan, E.; Olivas, V.; Cade, L.; Pazarentzos, E.; Asthana, S.; Neel, D.; Yan, J.J.; Lu, X.; et al. The Hippo effector YAP promotes resistance to RAF- and MEK-targeted cancer therapies. Nat. Genet. 2015, 47, 250–256. [Google Scholar] [CrossRef]
- Huraskin, D.; Eiber, N.; Reichel, M.; Zidek, L.M.; Kravic, B.; Bernkopf, D.; von Maltzahn, J.; Behrens, J.; Hashemolhosseini, S. Wnt/beta-catenin signaling via Axin2 is required for myogenesis and, together with YAP/Taz and Tead1, active in IIa/IIx muscle fibers. Development 2016, 143, 3128–3142. [Google Scholar] [CrossRef] [PubMed]
- Park, H.W.; Kim, Y.C.; Yu, B.; Moroishi, T.; Mo, J.S.; Plouffe, S.W.; Meng, Z.; Lin, K.C.; Yu, F.X.; Alexander, C.M.; et al. Alternative Wnt Signaling Activates YAP/TAZ. Cell 2015, 162, 780–794. [Google Scholar] [CrossRef] [PubMed]
- Conrad, W.H.; Swift, R.D.; Biechele, T.L.; Kulikauskas, R.M.; Moon, R.T.; Chien, A.J. Regulating the response to targeted MEK inhibition in melanoma: Enhancing apoptosis in NRAS- and BRAF-mutant melanoma cells with Wnt/beta-catenin activation. Cell Cycle 2012, 11, 3724–3730. [Google Scholar] [CrossRef]
- Ma, Q. Role of nrf2 in oxidative stress and toxicity. Annu. Rev. Pharmacol. Toxicol. 2013, 53, 401–426. [Google Scholar] [CrossRef]
- Ciamporcero, E.; Daga, M.; Pizzimenti, S.; Roetto, A.; Dianzani, C.; Compagnone, A.; Palmieri, A.; Ullio, C.; Cangemi, L.; Pili, R.; et al. Crosstalk between Nrf2 and YAP contributes to maintaining the antioxidant potential and chemoresistance in bladder cancer. Free Radic. Biol. Med. 2018, 115, 447–457. [Google Scholar] [CrossRef]
- Palorini, R.; Votta, G.; Pirola, Y.; De Vitto, H.; De Palma, S.; Airoldi, C.; Vasso, M.; Ricciardiello, F.; Lombardi, P.P.; Cirulli, C.; et al. Protein Kinase A Activation Promotes Cancer Cell Resistance to Glucose Starvation and Anoikis. PLoS Genet. 2016, 12, e1005931. [Google Scholar] [CrossRef] [PubMed]
- Sato, A.; Okada, M.; Shibuya, K.; Watanabe, E.; Seino, S.; Narita, Y.; Shibui, S.; Kayama, T.; Kitanaka, C. Pivotal role for ROS activation of p38 MAPK in the control of differentiation and tumor-initiating capacity of glioma-initiating cells. Stem Cell Res. 2014, 12, 119–131. [Google Scholar] [CrossRef] [PubMed]
- Love, M.I.; Huber, W.; Anders, S. Moderated estimation of fold change and dispersion for RNA-seq data with DESeq2. Genome Biol. 2014, 15, 550. [Google Scholar] [CrossRef] [PubMed]
- R Core Team. R: A Language and Environment for Statistical Computing; R Foundation for Statistical Computing: Vienna, Austria, 2008; Available online: https://www.R-project.org/ (accessed on 1 April 2018).
- Kolde, R. pheatmap: Pretty Heatmaps. R package version 1.0.10. Available online: https://CRAN.R-project.org/package=pheatmap (accessed on 1 June 2018).
- Chen, C.H.; Hsia, T.C.; Yeh, M.H.; Chen, T.W.; Chen, Y.J.; Chen, J.T.; Wei, Y.L.; Tu, C.Y.; Huang, W.C. MEK inhibitors induce Akt activation and drug resistance by suppressing negative feedback ERK-mediated HER2 phosphorylation at Thr701. Mol. Oncol. 2017, 11, 1273–1287. [Google Scholar] [CrossRef] [PubMed]


© 2019 by the authors. Licensee MDPI, Basel, Switzerland. This article is an open access article distributed under the terms and conditions of the Creative Commons Attribution (CC BY) license (http://creativecommons.org/licenses/by/4.0/).
Share and Cite
Solberg, N.T.; Melheim, M.; Strand, M.F.; Olsen, P.A.; Krauss, S. MEK Inhibition Induces Canonical WNT Signaling through YAP in KRAS Mutated HCT-15 Cells, and a Cancer Preventive FOXO3/FOXM1 Ratio in Combination with TNKS Inhibition. Cancers 2019, 11, 164. https://doi.org/10.3390/cancers11020164
Solberg NT, Melheim M, Strand MF, Olsen PA, Krauss S. MEK Inhibition Induces Canonical WNT Signaling through YAP in KRAS Mutated HCT-15 Cells, and a Cancer Preventive FOXO3/FOXM1 Ratio in Combination with TNKS Inhibition. Cancers. 2019; 11(2):164. https://doi.org/10.3390/cancers11020164
Chicago/Turabian StyleSolberg, Nina Therese, Maria Melheim, Martin Frank Strand, Petter Angell Olsen, and Stefan Krauss. 2019. "MEK Inhibition Induces Canonical WNT Signaling through YAP in KRAS Mutated HCT-15 Cells, and a Cancer Preventive FOXO3/FOXM1 Ratio in Combination with TNKS Inhibition" Cancers 11, no. 2: 164. https://doi.org/10.3390/cancers11020164
APA StyleSolberg, N. T., Melheim, M., Strand, M. F., Olsen, P. A., & Krauss, S. (2019). MEK Inhibition Induces Canonical WNT Signaling through YAP in KRAS Mutated HCT-15 Cells, and a Cancer Preventive FOXO3/FOXM1 Ratio in Combination with TNKS Inhibition. Cancers, 11(2), 164. https://doi.org/10.3390/cancers11020164