Tyrosyl-DNA Phosphodiesterase 1 and Topoisomerase I Activities as Predictive Indicators for Glioblastoma Susceptibility to Genotoxic Agents


 and
and
Abstract

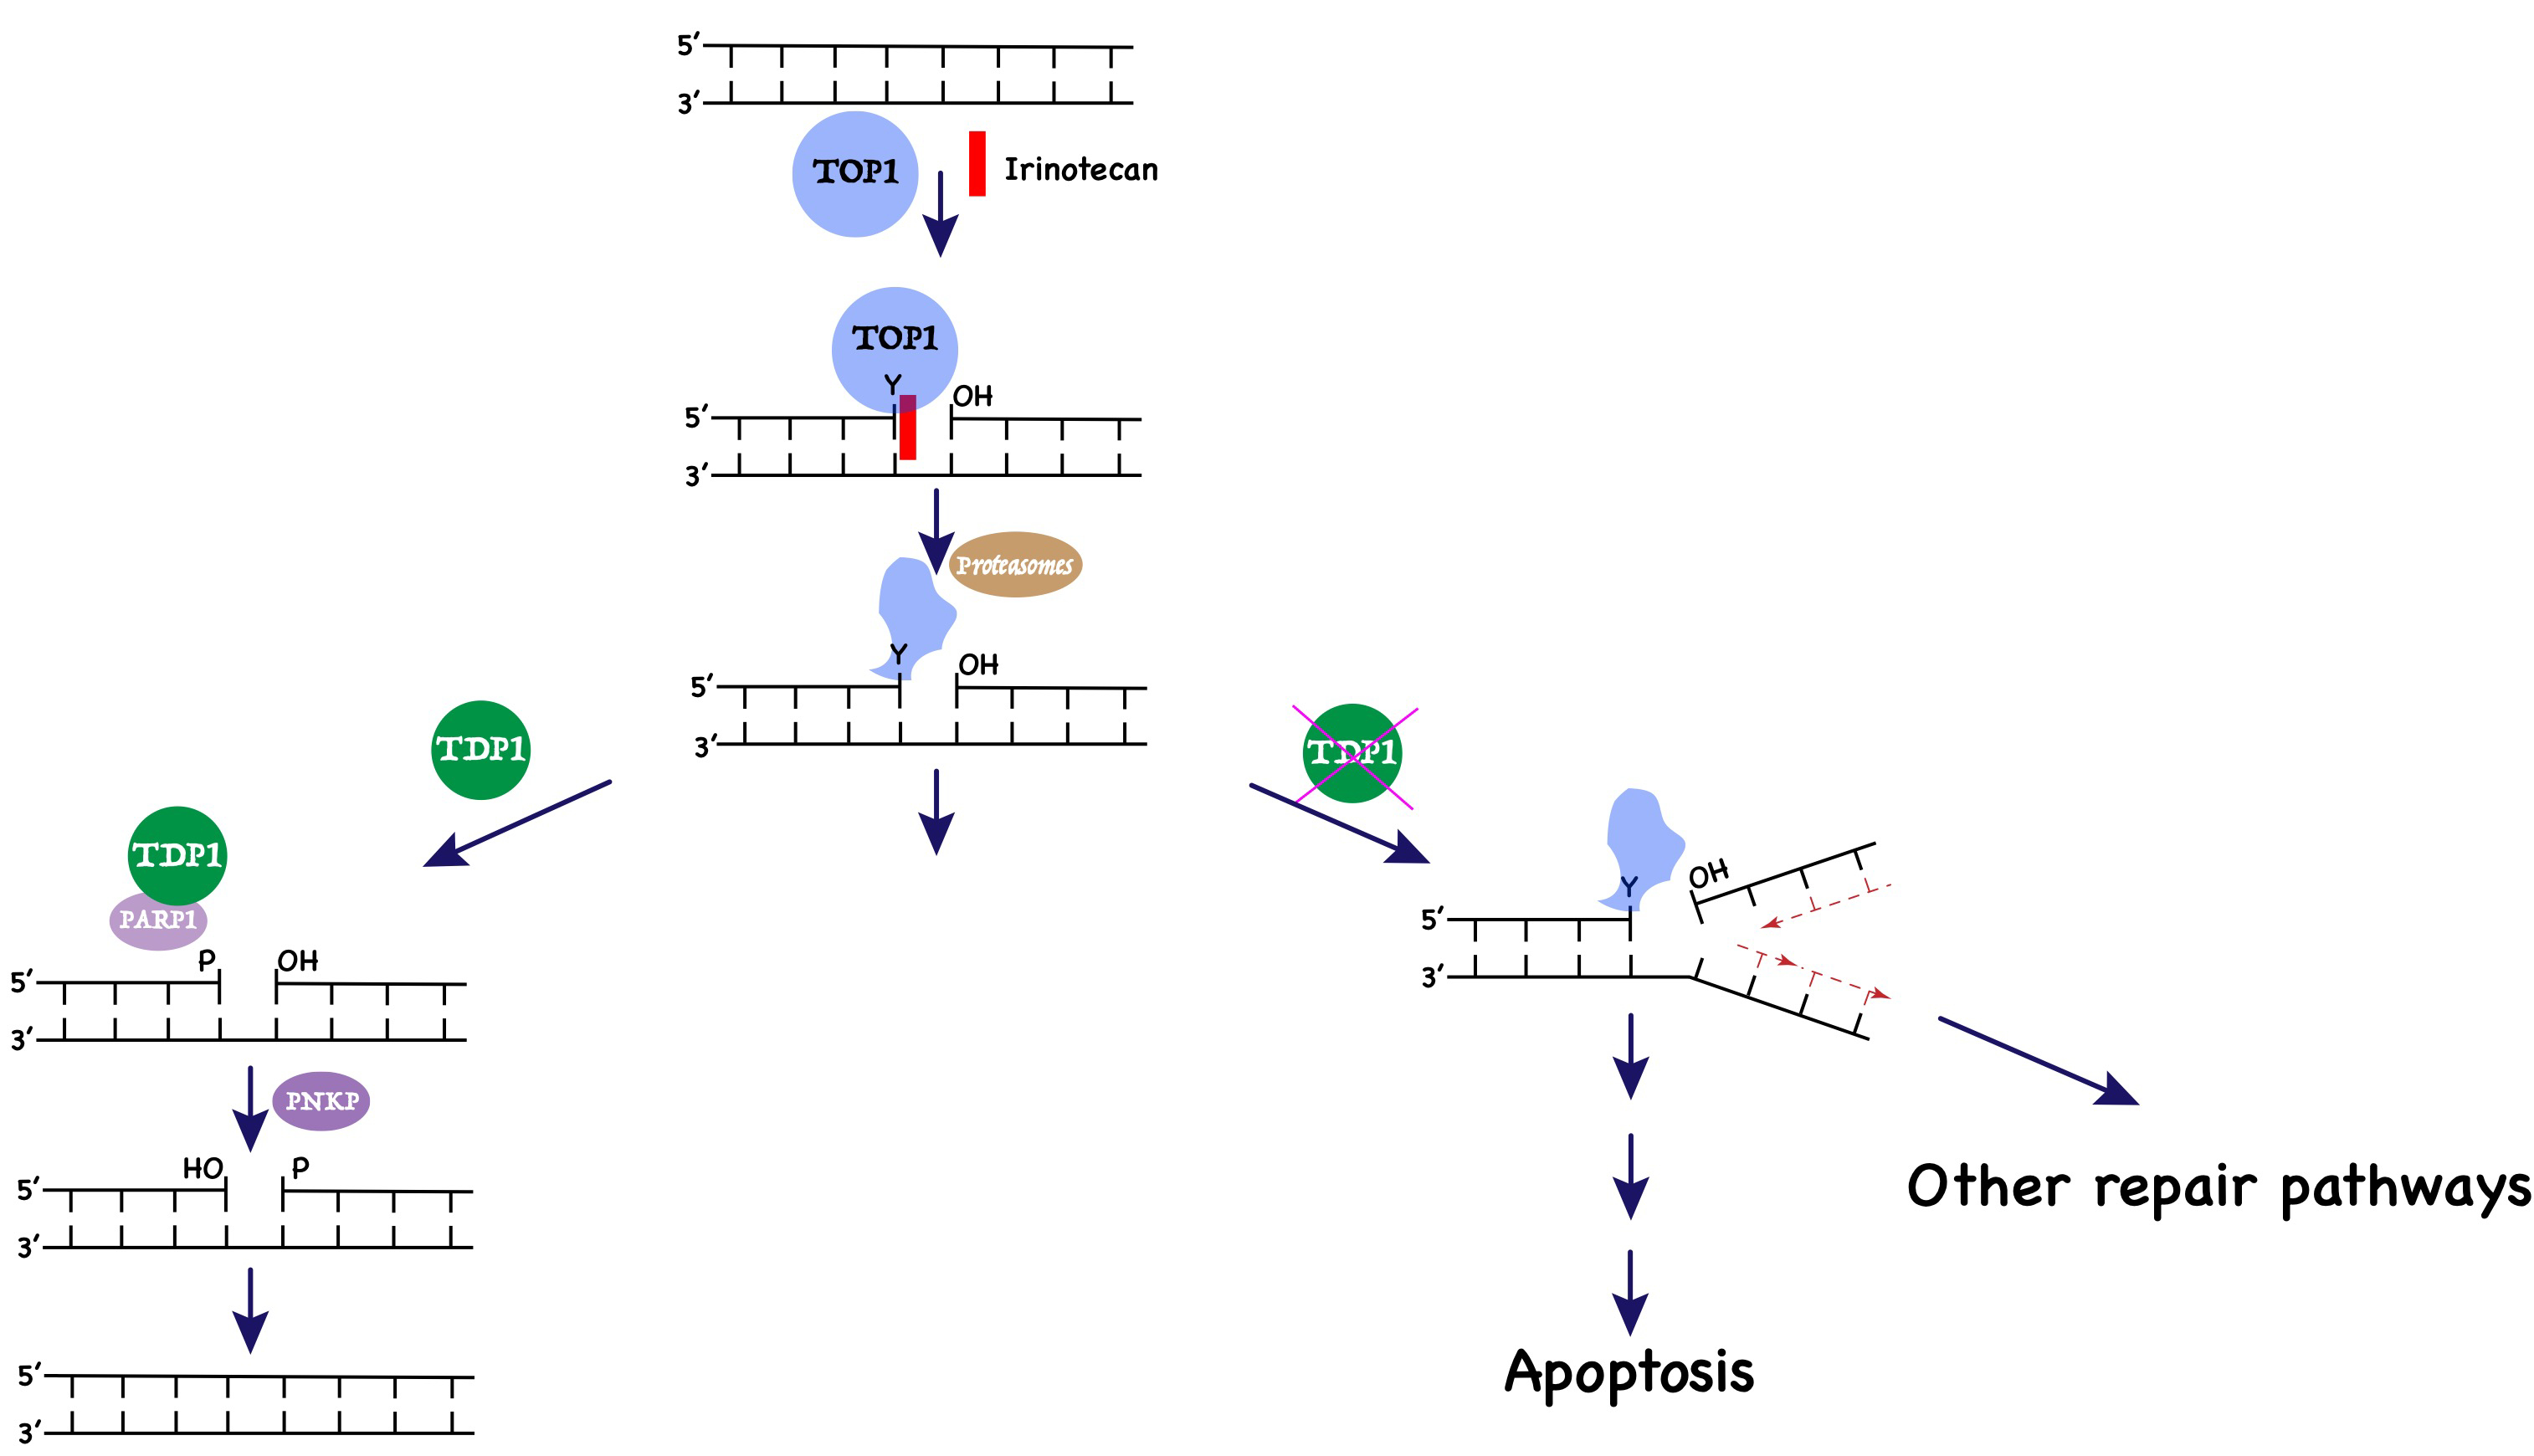
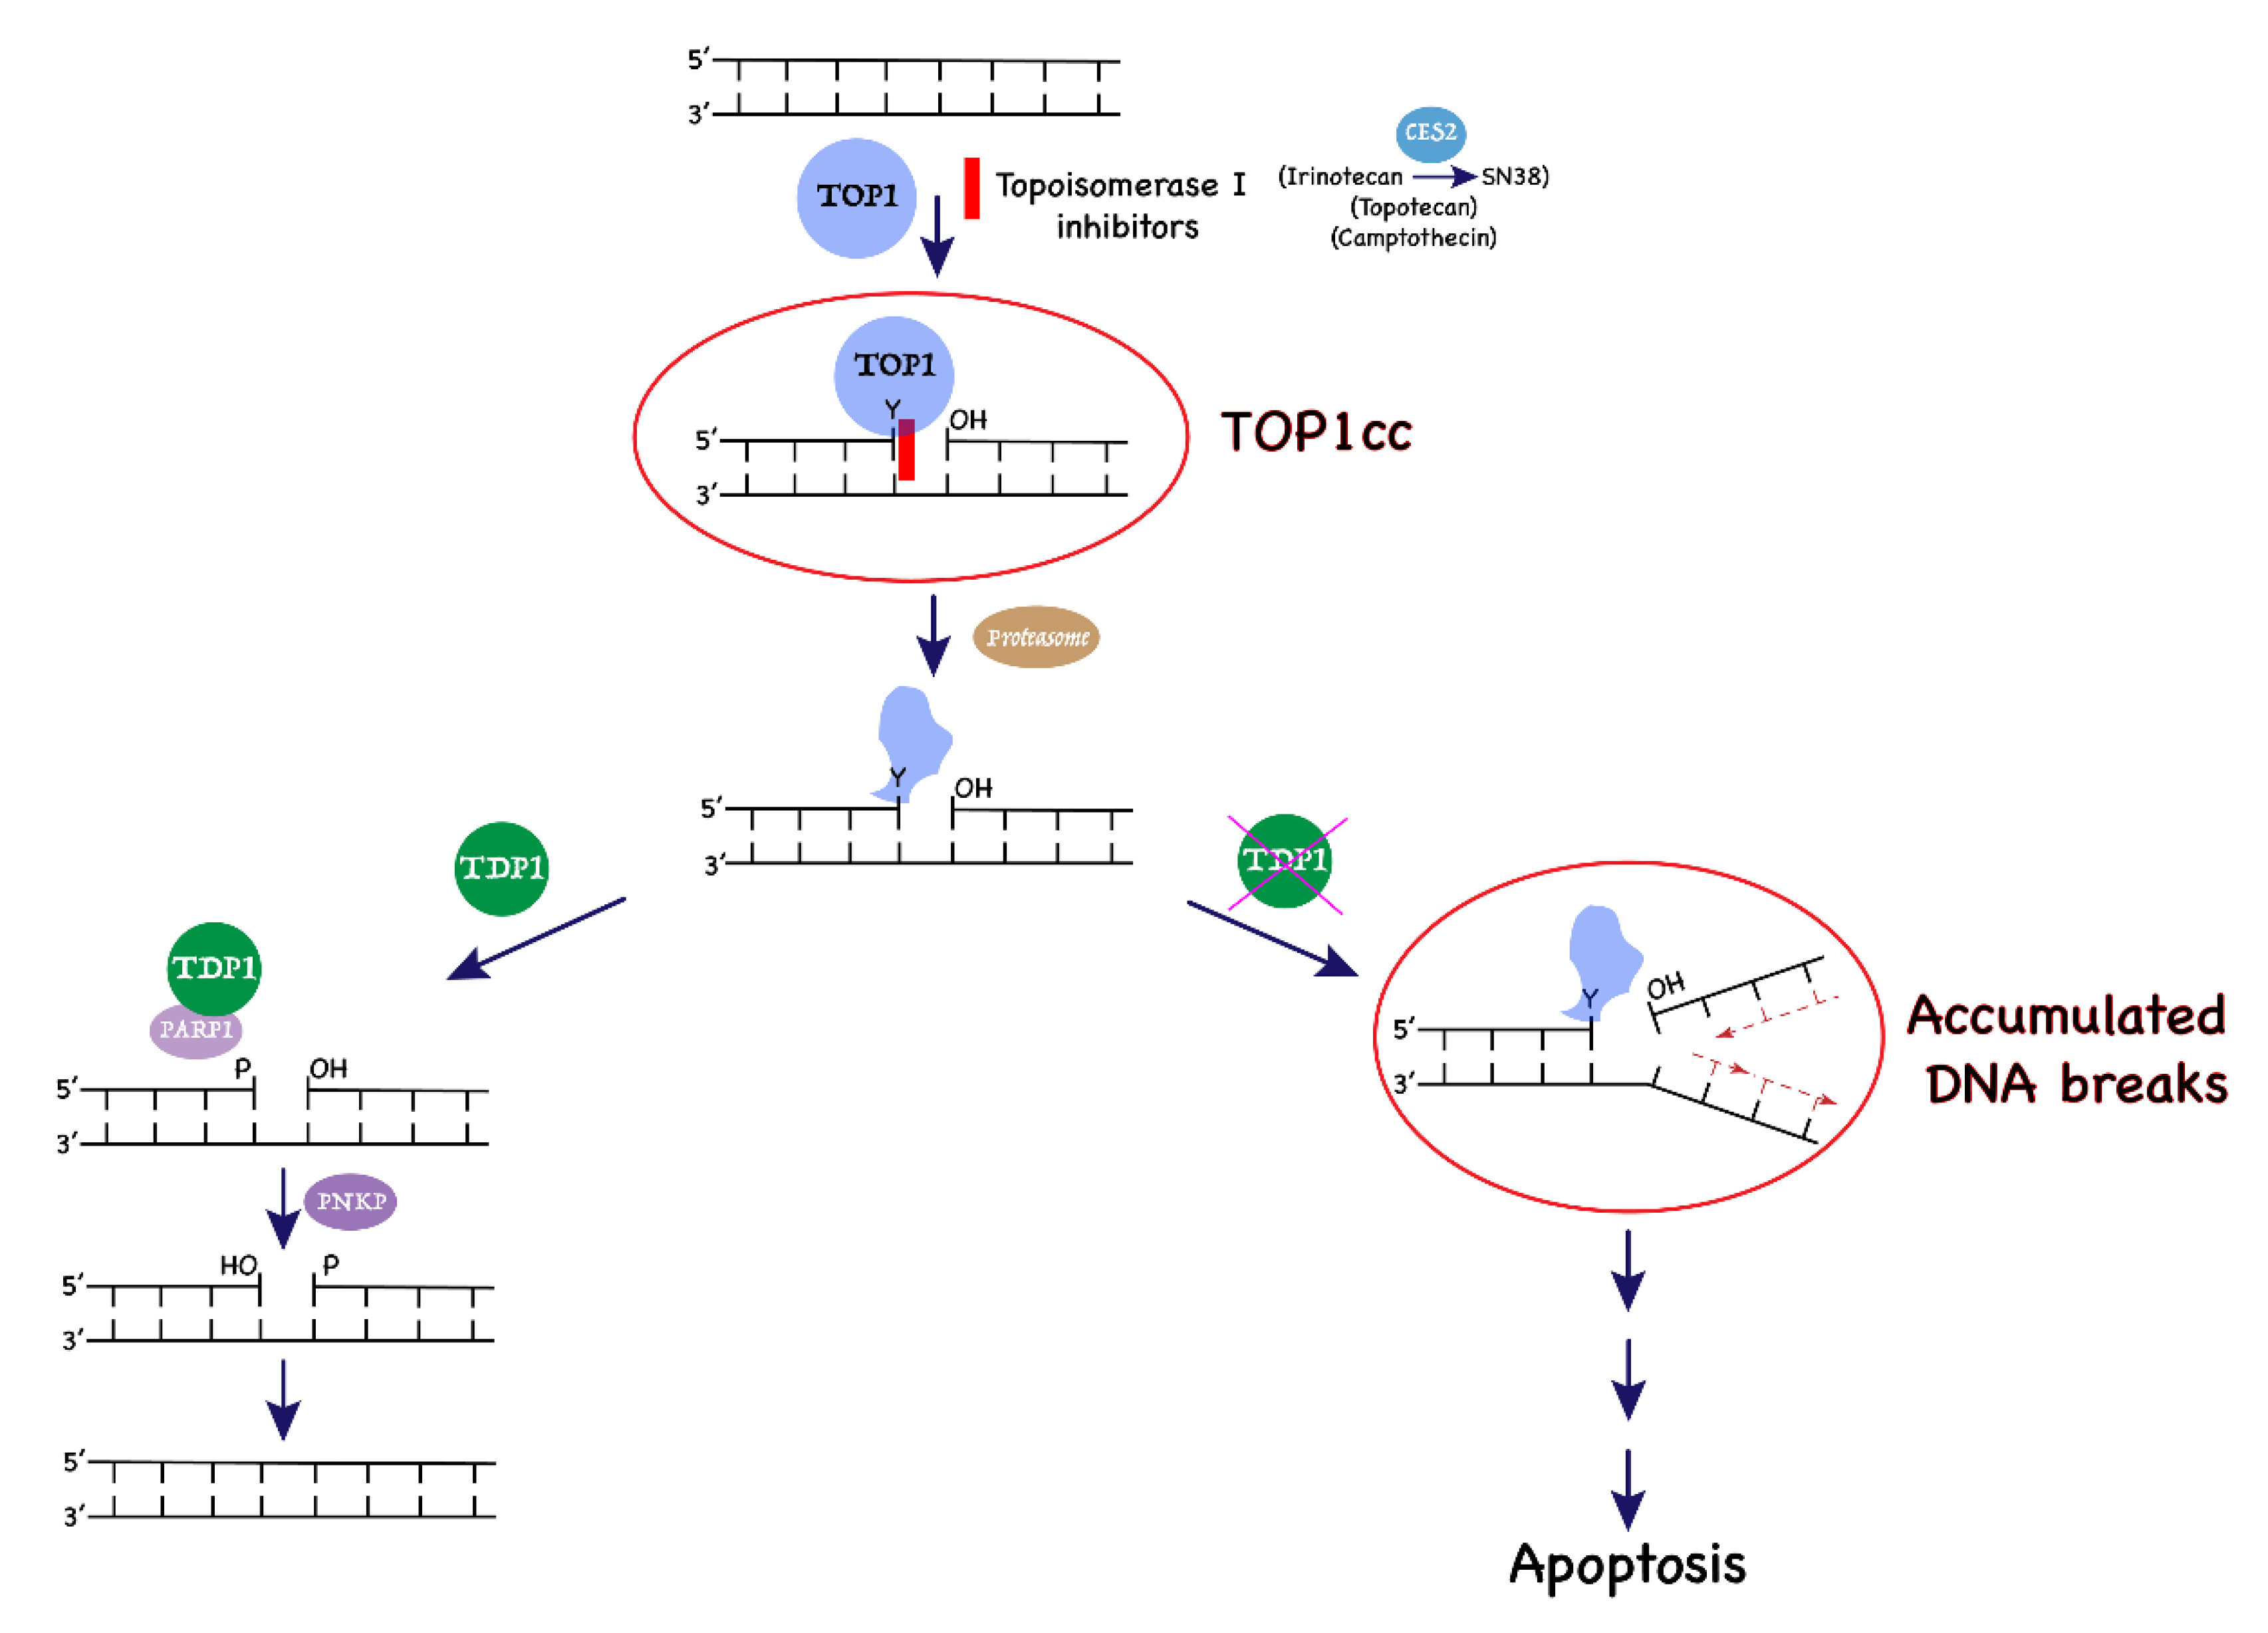
1. Introduction
2. Results
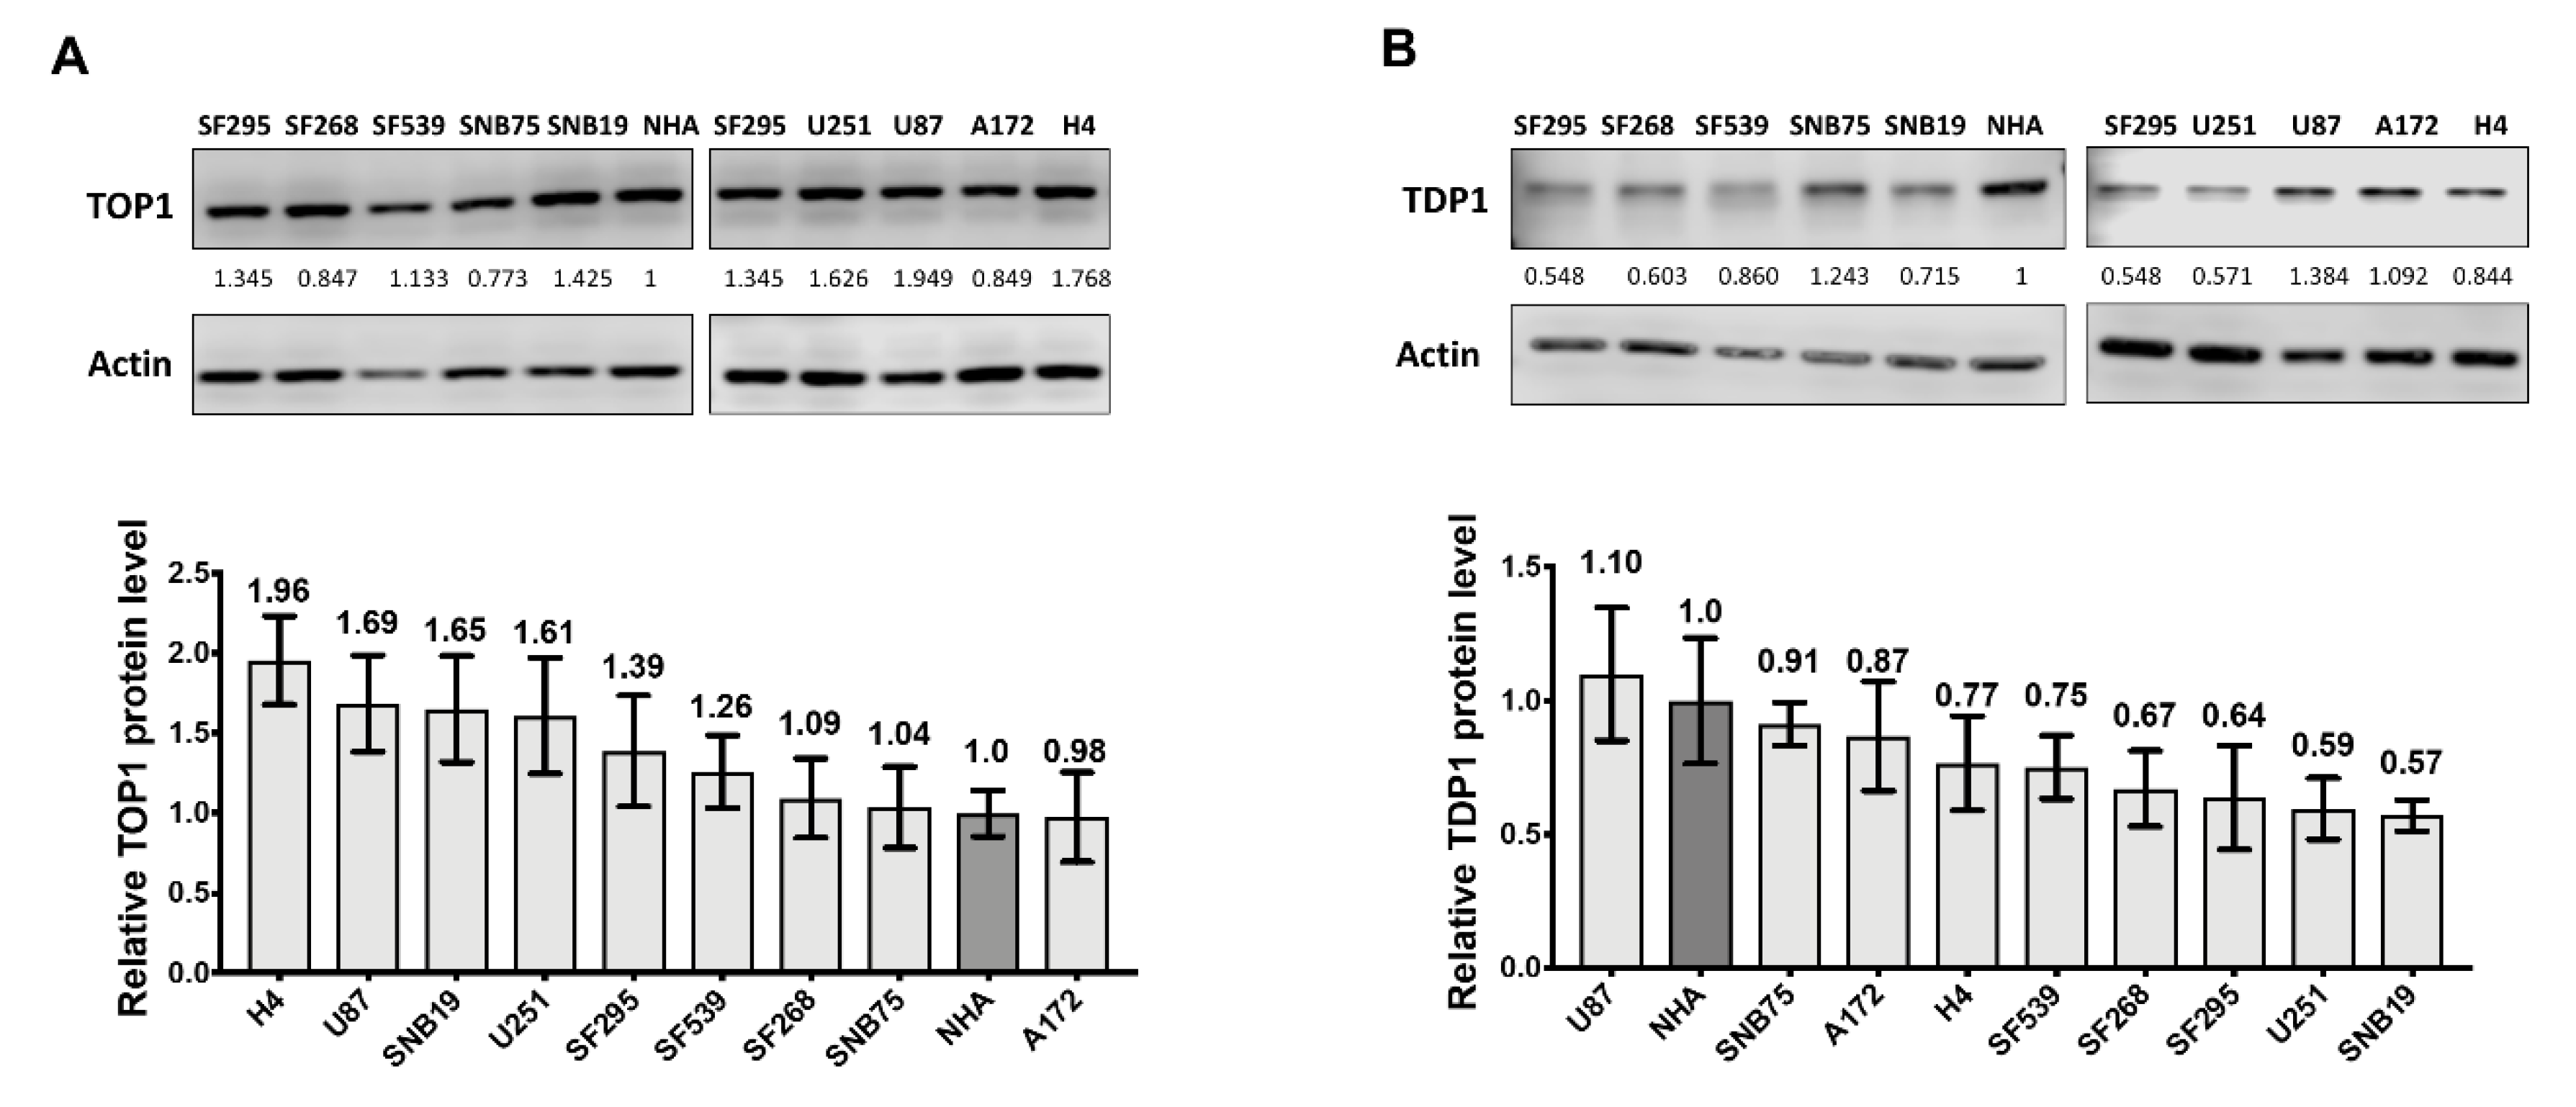
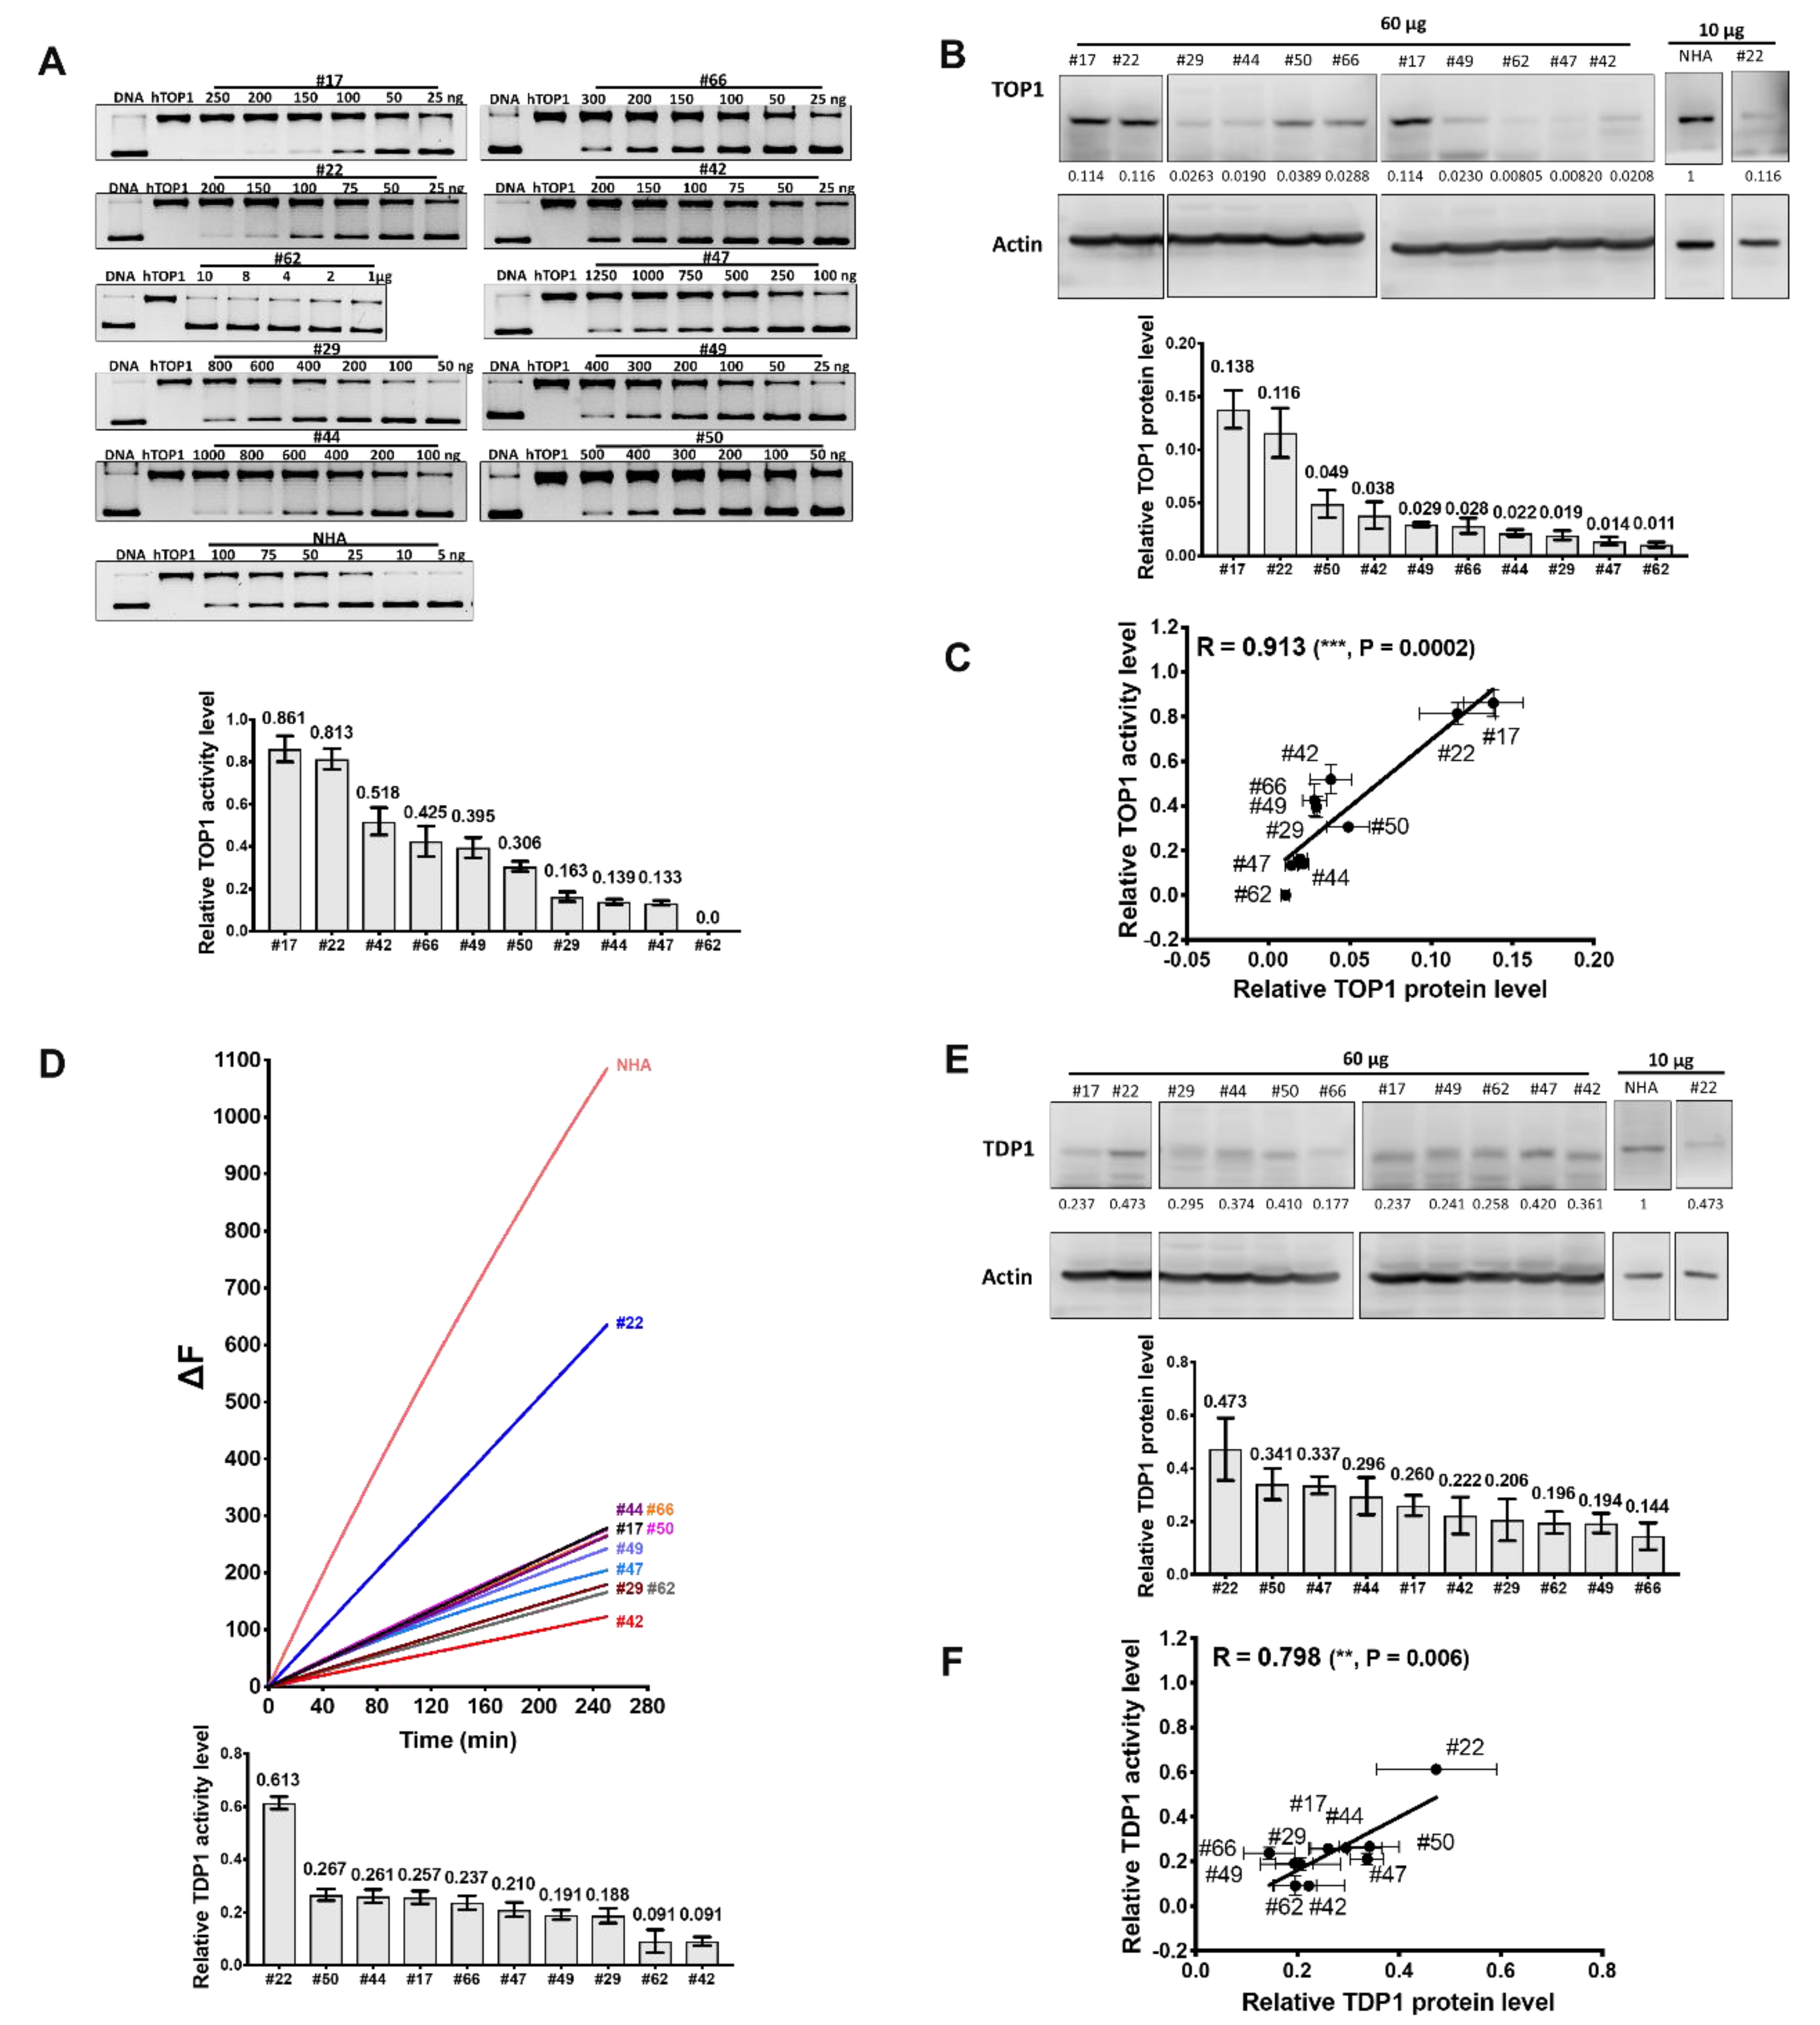
2.1. Comparison of TOP1 and TDP1 Expression in GBM Cell Lines and Correlation with Irinotecan IC50
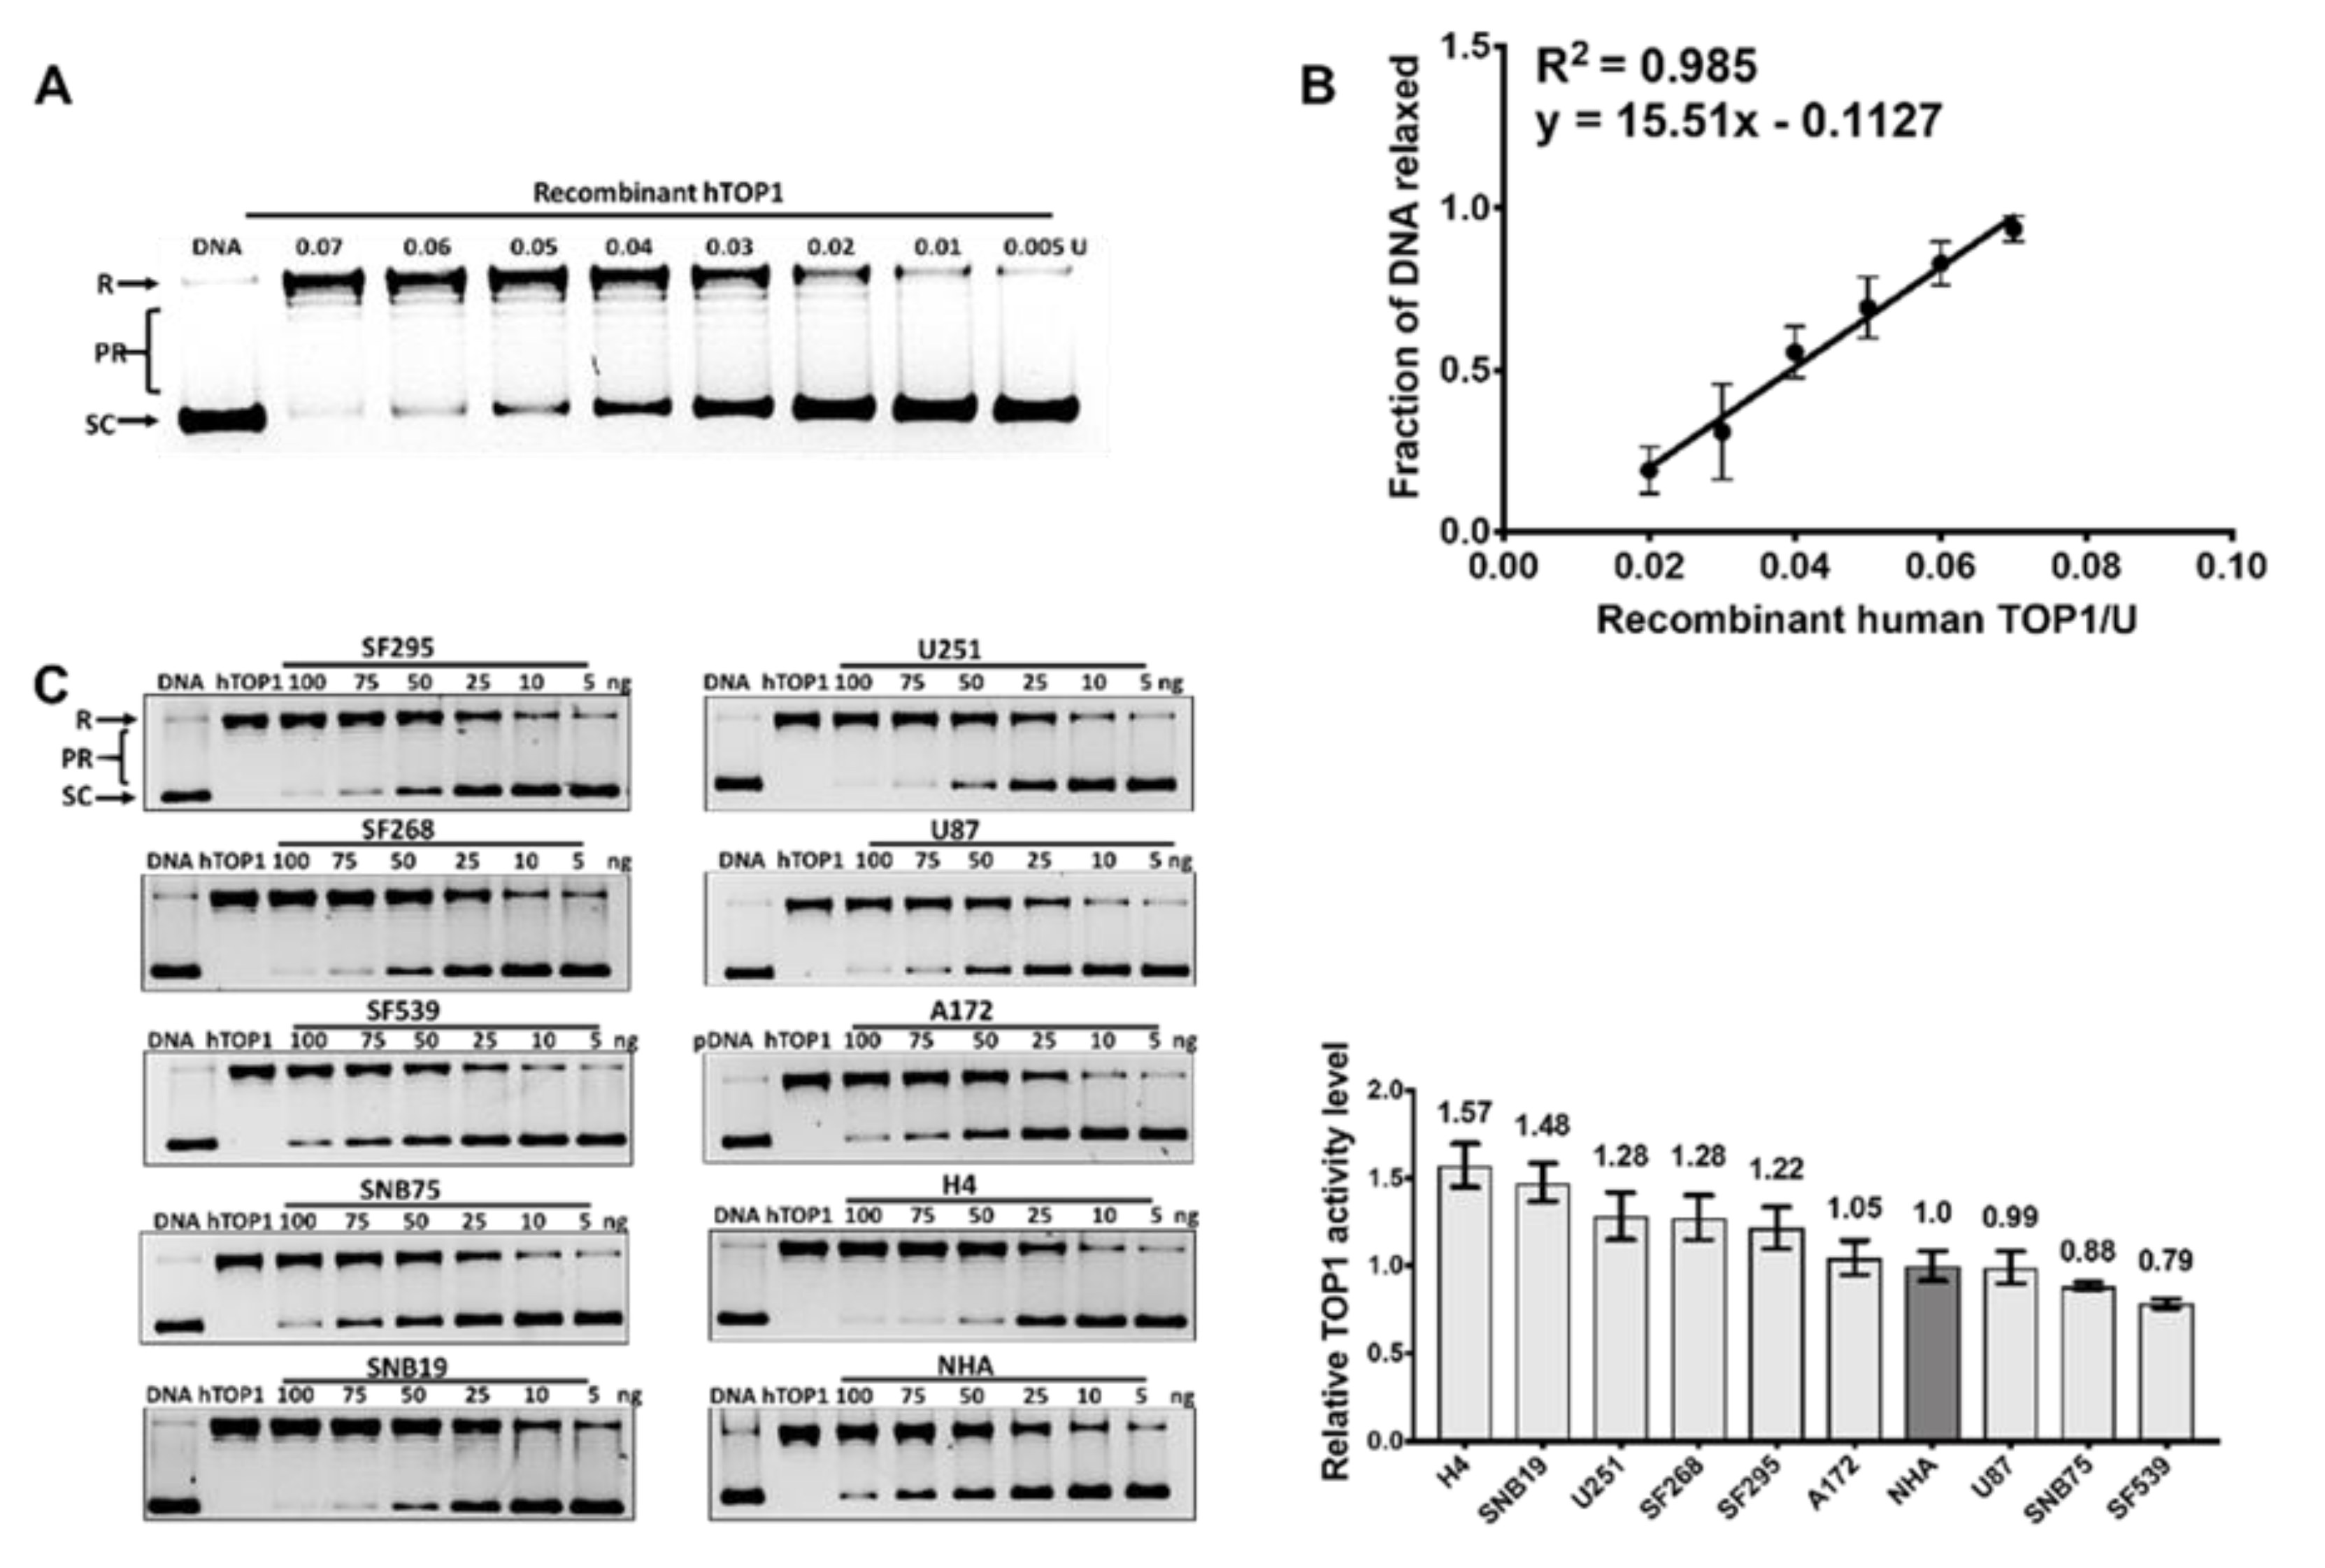
2.2. TOP1 Enzymatic Activity in GBM Cell Lines Does not Correspond to the TOP1 Protein Level
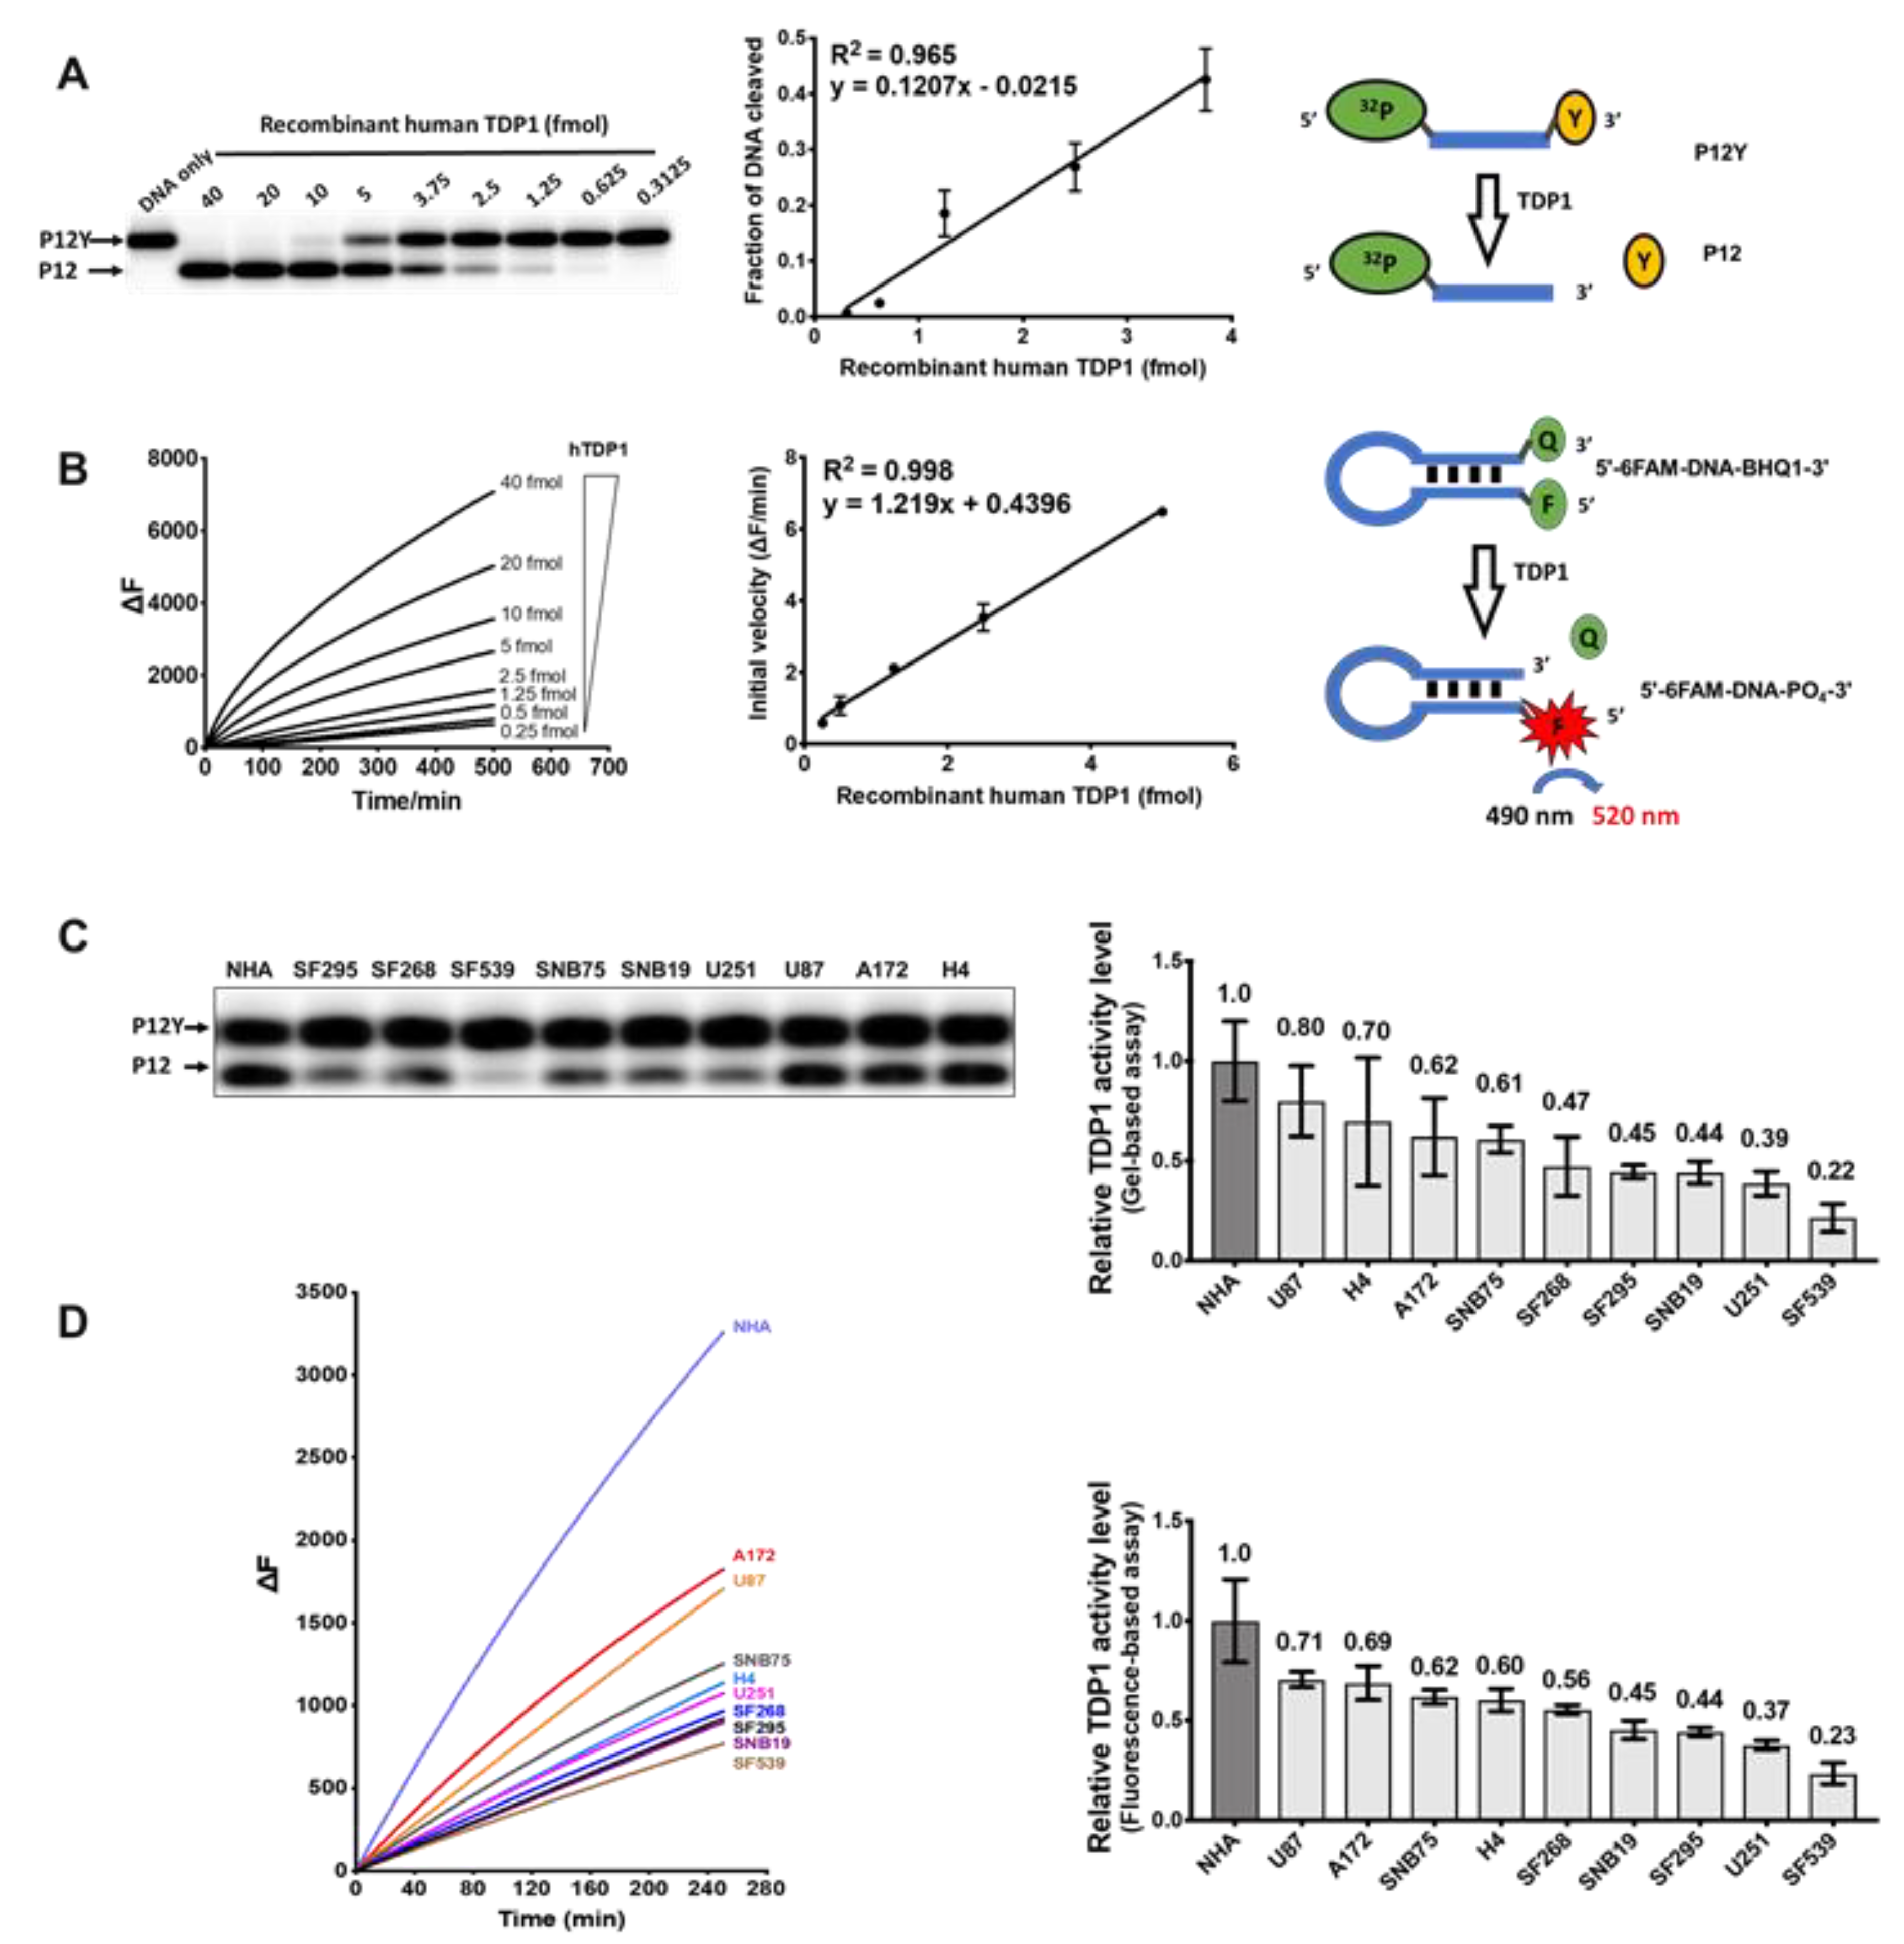
2.3. Measurement of TDP1 Activity in GBM Cell Lines by Gel-Based and Fluorescence-Based Assays
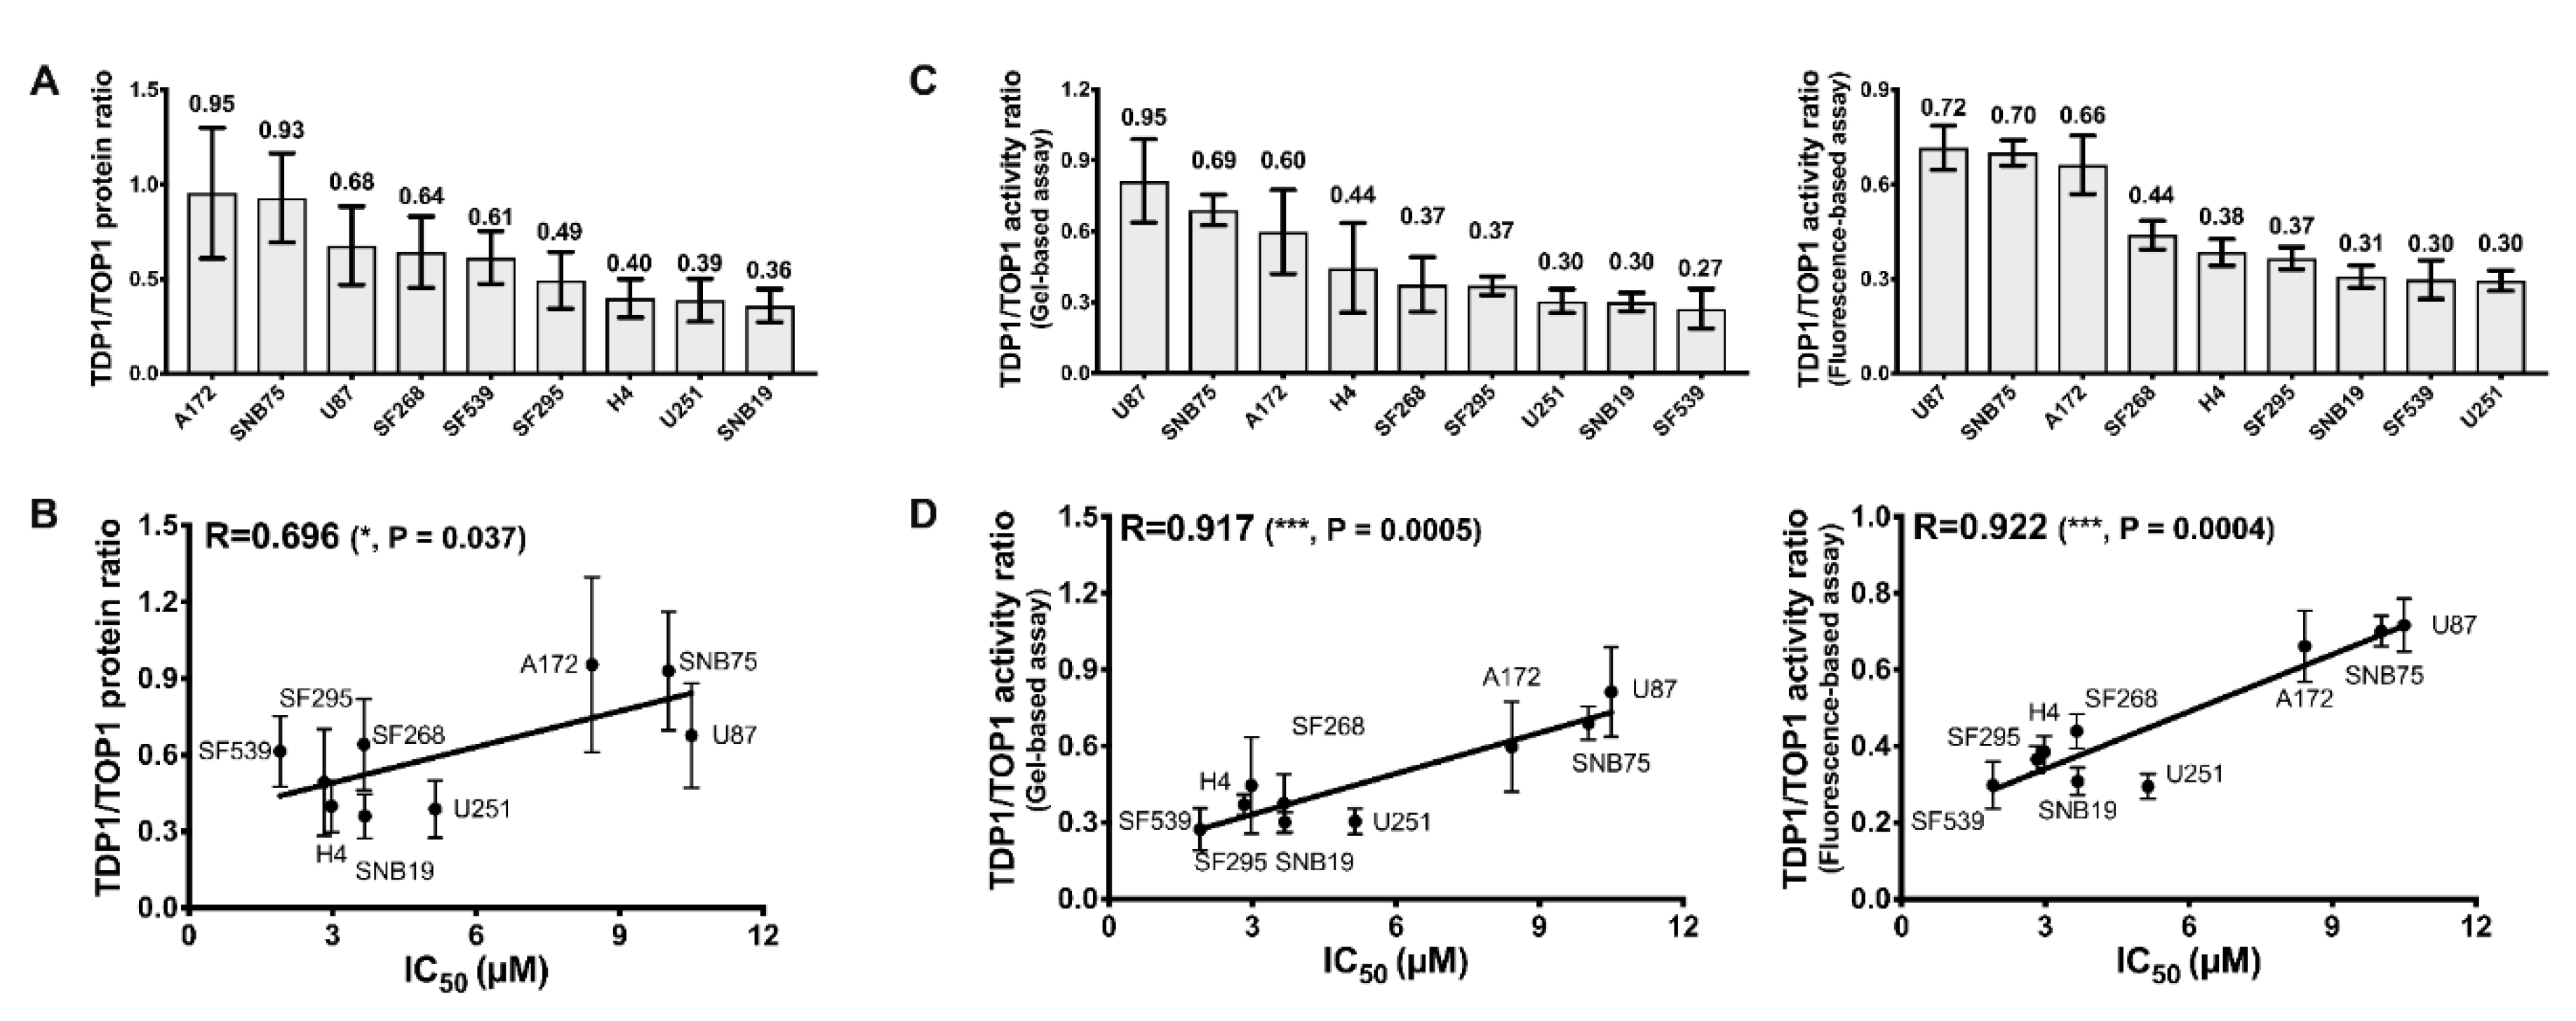
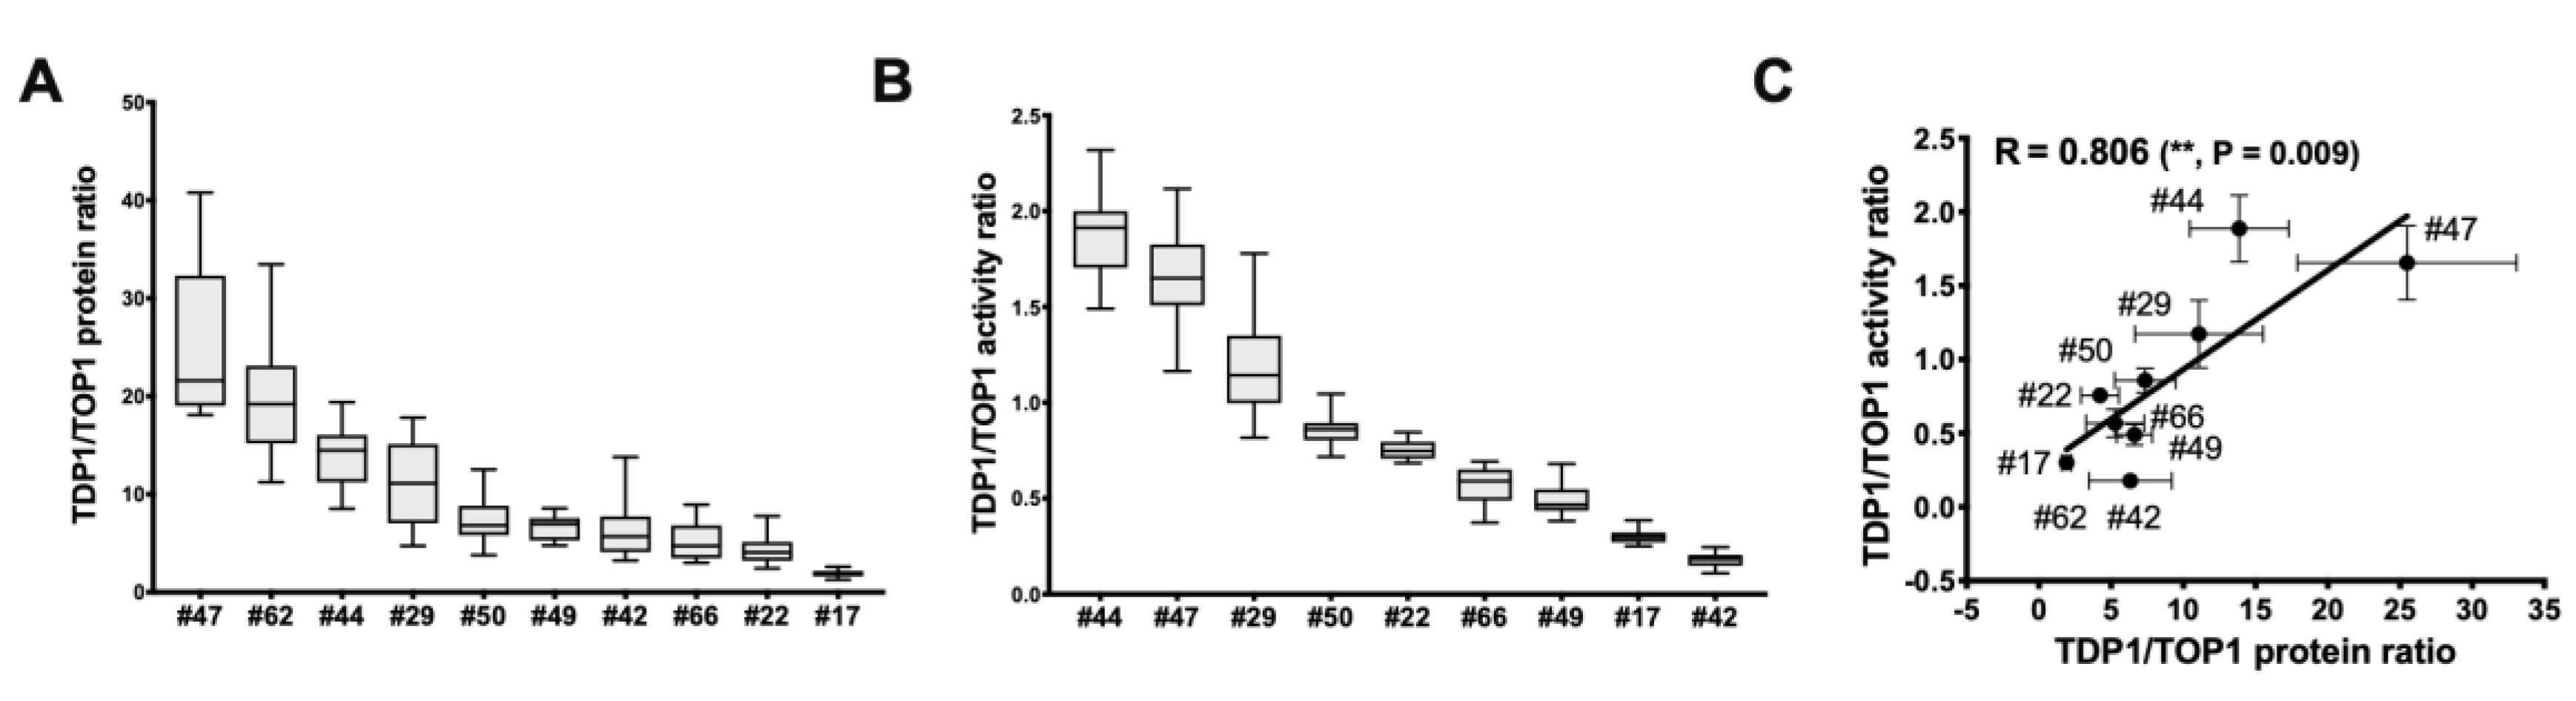
2.4. TDP1/TOP1 Activity Ratio in GBM WCE Is a Strong Predictor of Irinotecan IC50
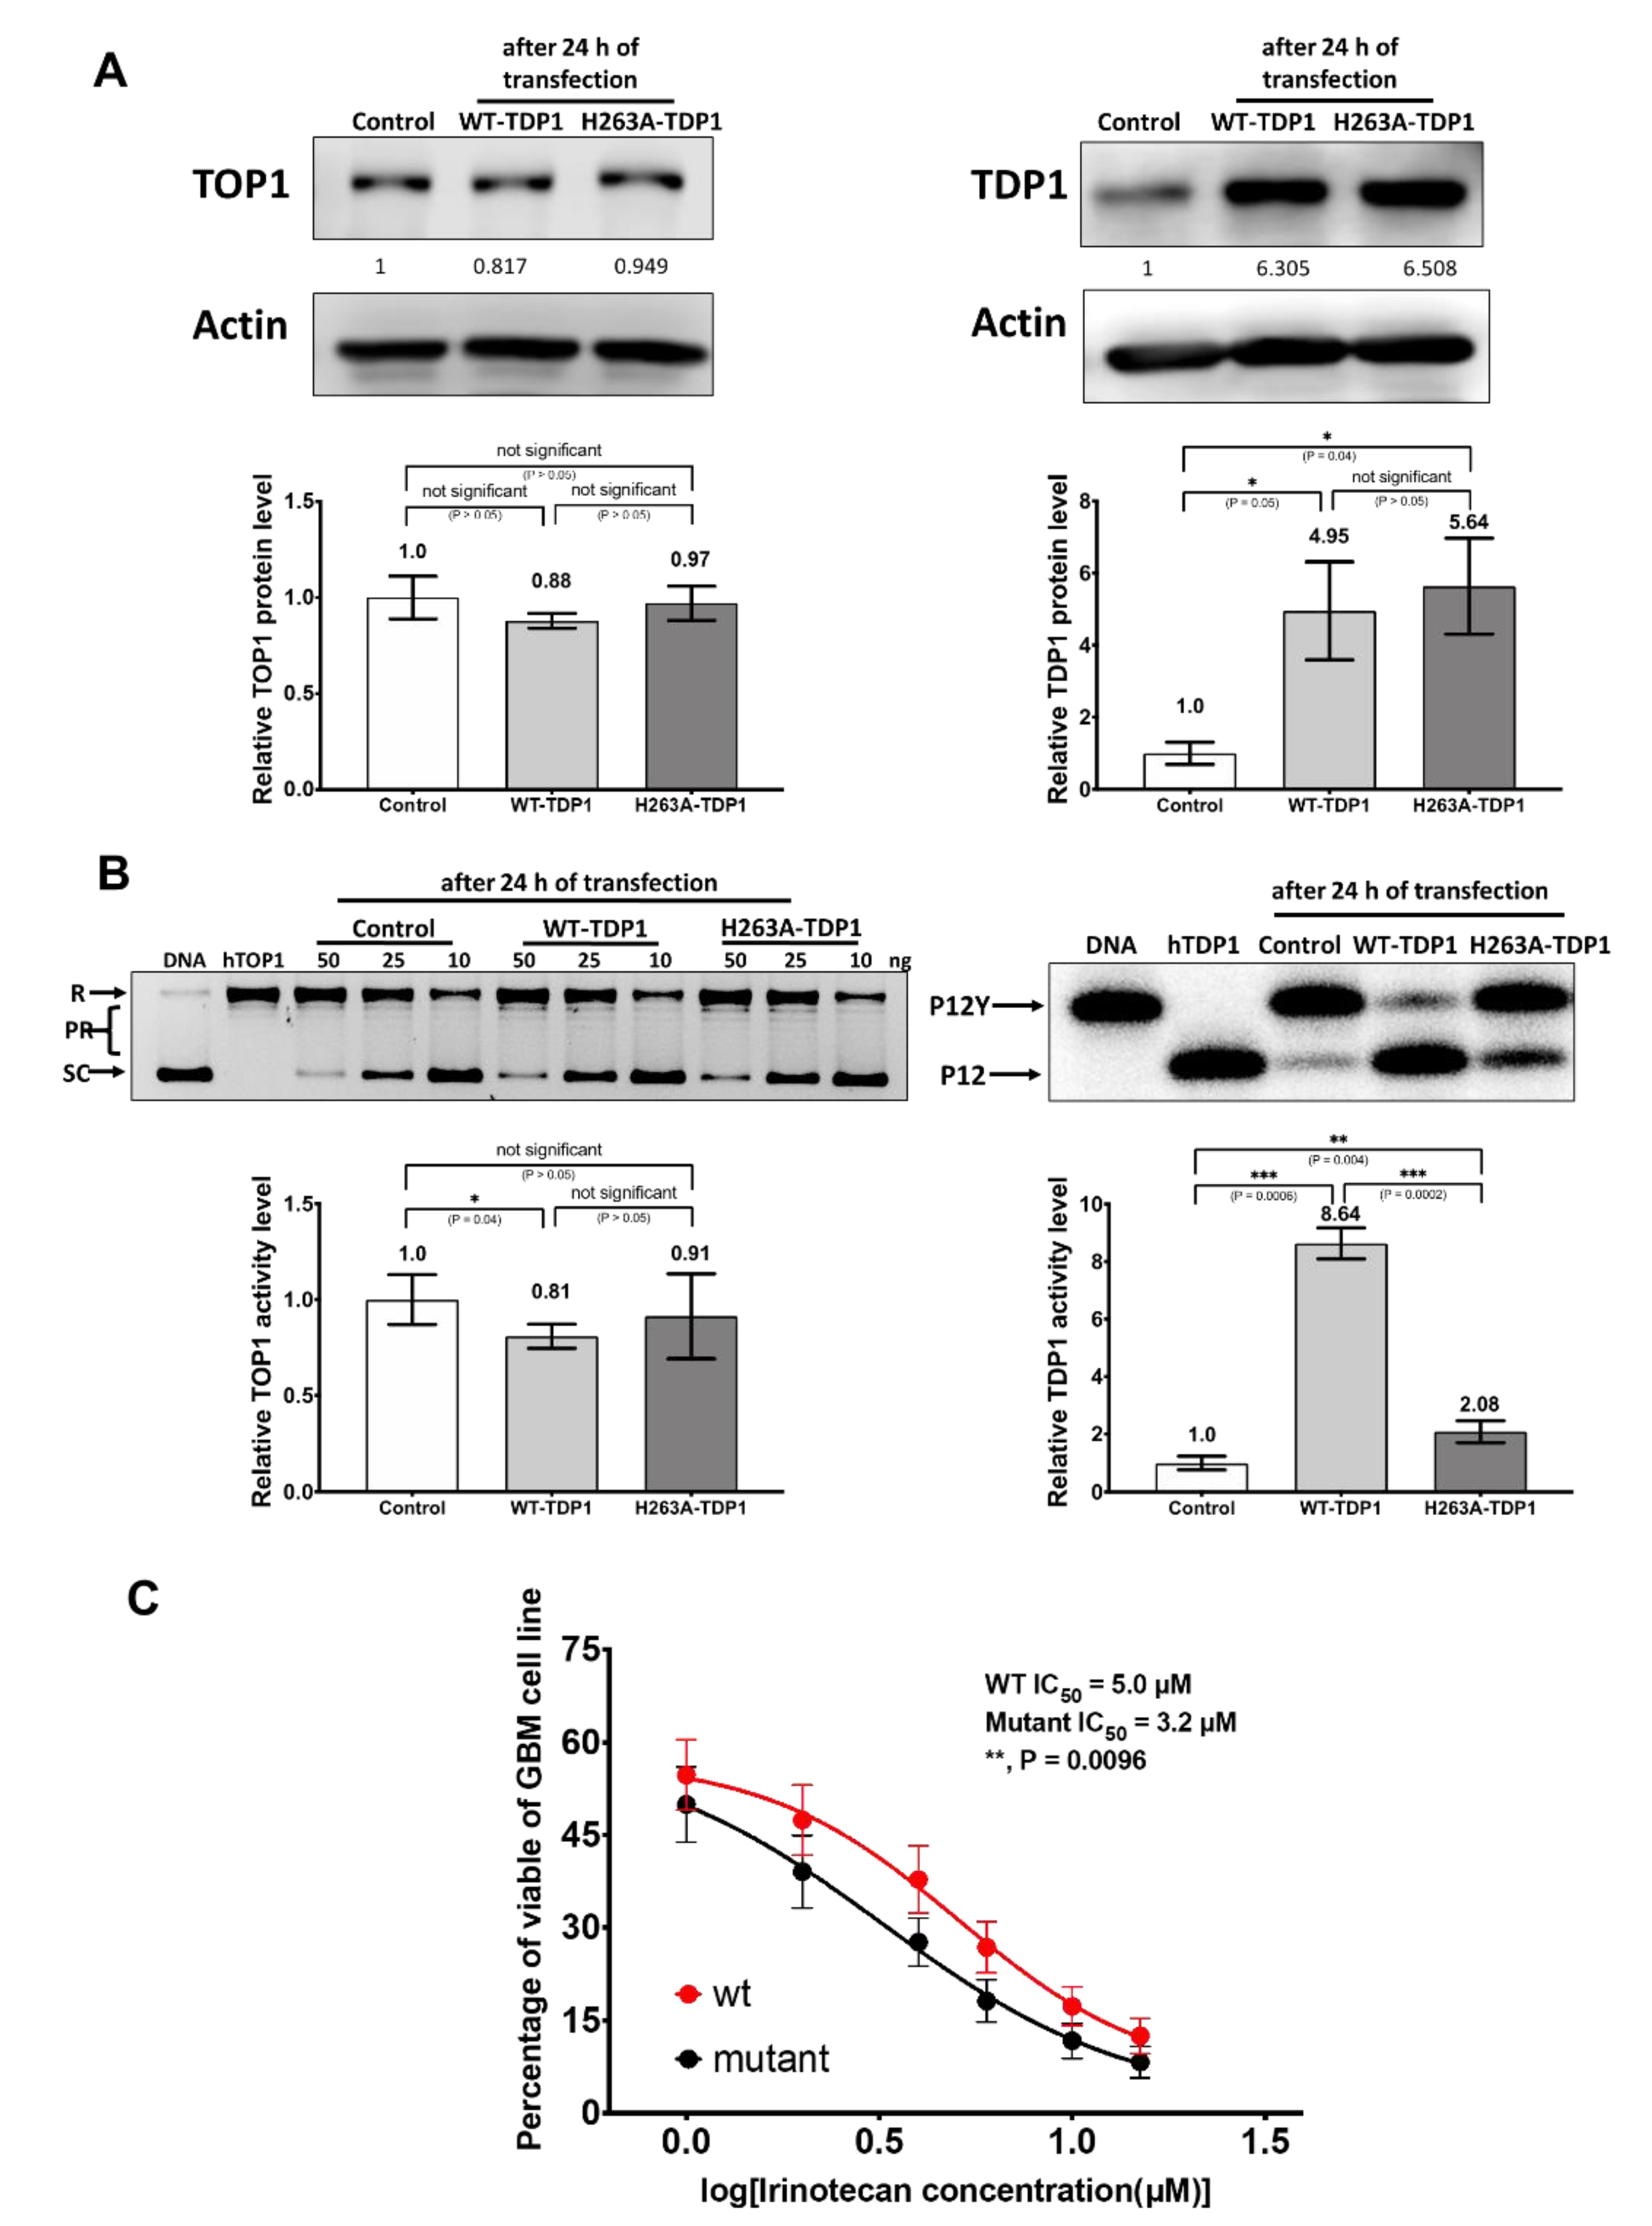
2.5. Increased Resistance to Irinotecan Following Transfection with Recombinant TDP1
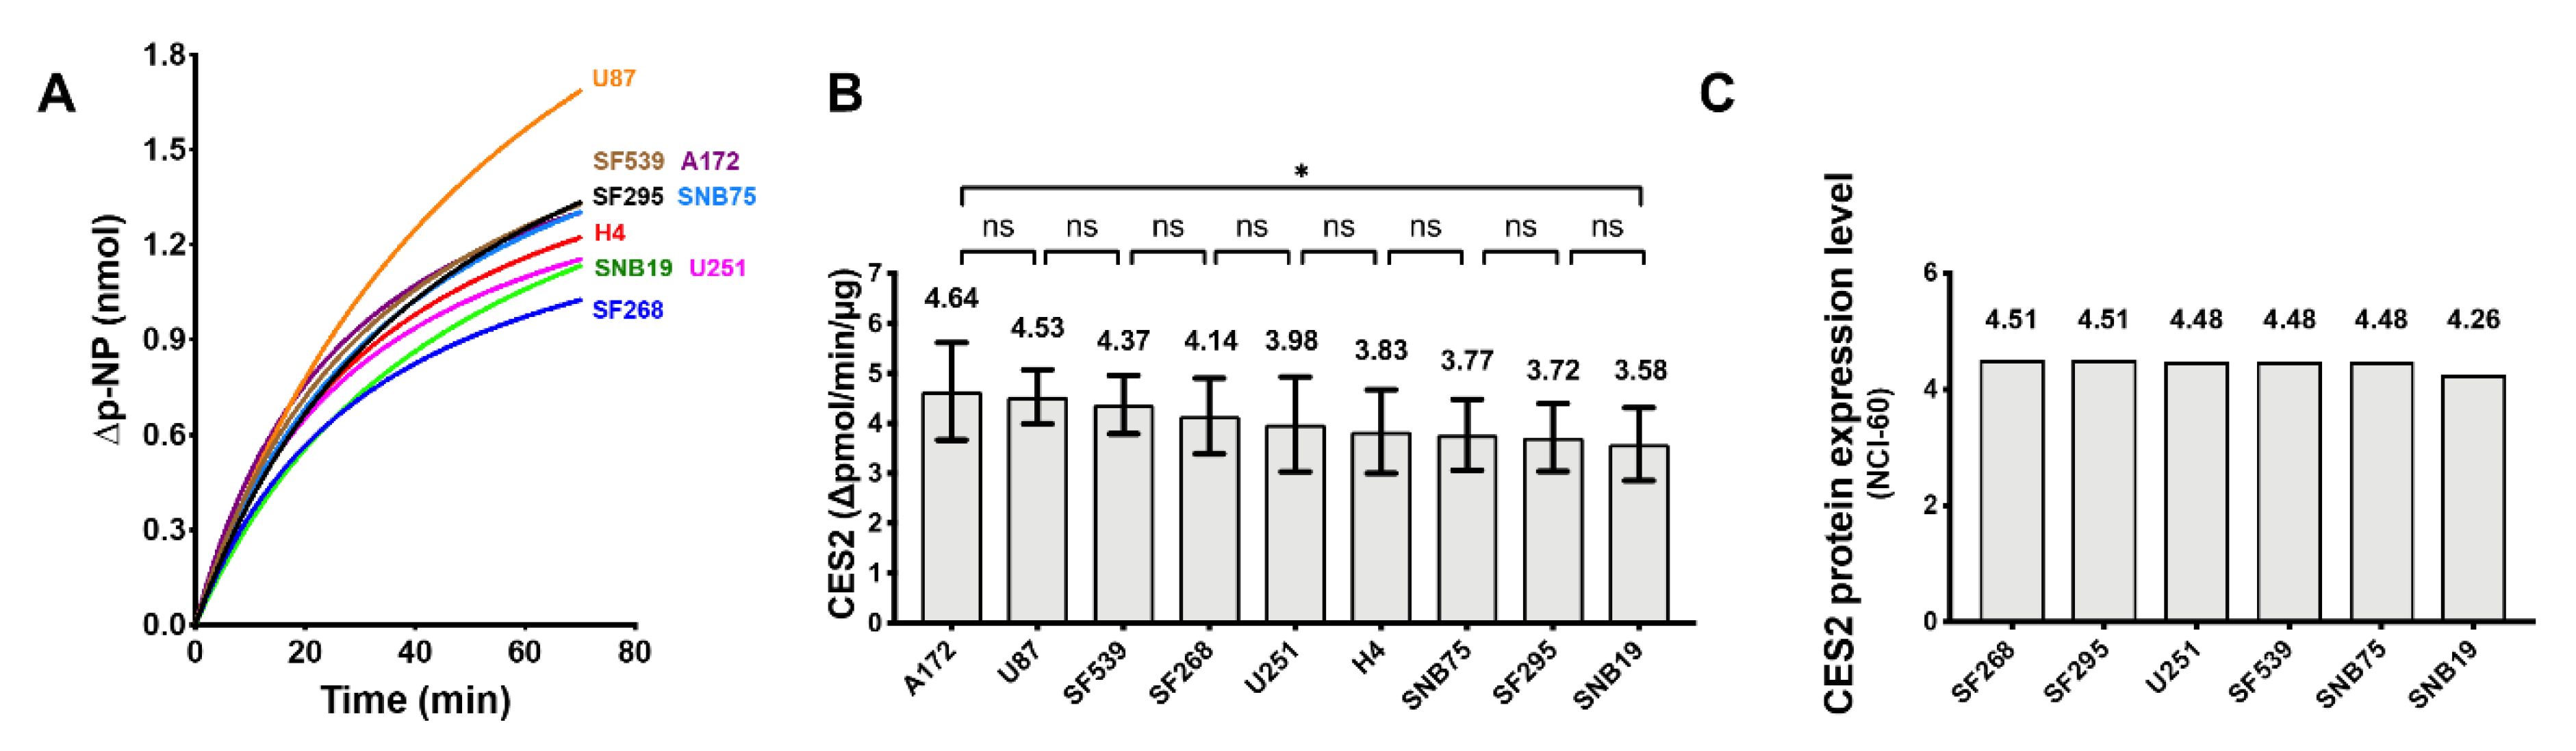
2.6. Carboxylesterase 2 (CES2) Activity in the GBM Cell Lines
2.7. Variable Levels of TDP1, TOP1 Activities, and the TDP1/TOP1 Activity Ratio in GBM Patient Tumor Cell Lysates
3. Discussion
4. Materials and Methods
4.1. GBM Cell Lines
4.2. GBM Whole Cell Extract (WCE) Preparation
4.3. Western Blots
4.4. Irinotecan IC50 Measurement for GBM Cell Lines
4.5. Human Topoisomerase I (hTOP1) Relaxation Activity Measurement
4.6. Human TDP1 Activity Measurement
4.6.1. Gel-Based TDP1 Assay
4.6.2. Human TDP1 Activity Measurement by Fluorescence-Based Assay
4.7. Transfection with Wild-Type (WT) and Mutant TDP1 cDNA Clones
4.8. Protein Extraction from GBM Patient Samples
4.9. Carboxylesterase 2 Activity Measurement
4.10. Statistical Analysis
5. Conclusions
Supplementary Materials
Author Contributions
Funding
Acknowledgments
Conflicts of Interest
References
- Paolillo, M.; Boselli, C.; Schinelli, S. Glioblastoma under Siege: An Overview of Current Therapeutic Strategies. Brain Sci. 2018, 8, 15. [Google Scholar] [CrossRef] [PubMed]
- Fuchs, C.; Mitchell, E.P.; Hoff, P.M. Irinotecan in the Treatment of Colorectal Cancer. Cancer Treat. Rev. 2006, 32, 491–503. [Google Scholar] [CrossRef] [PubMed]
- Van Meerbeeck, J.P.; Fennell, D.A.; De Ruysscher, D.K. Small-Cell Lung Cancer. Lancet 2011, 378, 1741–1755. [Google Scholar] [CrossRef]
- Goldwirt, L.; Beccaria, K.; Carpentier, A.; Farinotti, R.; Fernandez, C. Irinotecan and Temozolomide Brain Distribution: A Focus on ABCB1. Cancer Chemother. Pharmacol. 2014, 74, 185–193. [Google Scholar] [CrossRef] [PubMed]
- Cloughesy, T.F.; Filka, E.; Nelson, G.; Kabbinavar, F.; Friedman, H.; Miller, L.L.; Elfring, G.L. Irinotecan Treatment for Recurrent Malignant Glioma using an Every-3-Week Regimen. Am. J. Clin. Oncol. 2002, 25, 204–208. [Google Scholar] [CrossRef] [PubMed]
- Friedman, H.S.; Petros, W.P.; Friedman, A.H.; Schaaf, L.J.; Kerby, T.; Lawyer, J.; Parry, M.; Houghton, P.J.; Lovell, S.; Rasheed, K.; et al. Irinotecan Therapy in Adults with Recurrent or Progressive Malignant Glioma. J. Clin. Oncol. 1999, 17, 1516–1525. [Google Scholar] [CrossRef] [PubMed]
- Vredenburgh, J.J.; Desjardins, A.; Reardon, D.A.; Friedman, H.S. Experience with Irinotecan for the Treatment of Malignant Glioma. Neuro Oncol. 2009, 11, 80–91. [Google Scholar] [CrossRef] [PubMed]
- Lee, E.Q.; McFaline-Figueroa, J.R.; Cloughesy, T.F.; Wen, P.Y. Is it Time to Reconsider the Role of Irinotecan for the Treatment of High-Grade Gliomas? Neuro Oncol. 2018, 20, 1144. [Google Scholar] [CrossRef]
- Gruber, M.L.; Buster, W.P. Temozolomide in Combination with Irinotecan for Treatment of Recurrent Malignant Glioma. Am. J. Clin. Oncol. 2004, 27, 33–38. [Google Scholar] [CrossRef]
- Vredenburgh, J.J.; Desjardins, A.; Herndon, J.E., II; Marcello, J.; Reardon, D.A.; Quinn, J.A.; Rich, J.N.; Sathornsumetee, S.; Gururangan, S.; Sampson, J.; et al. Bevacizumab Plus Irinotecan in Recurrent Glioblastoma Multiforme. J. Clin. Oncol. 2007, 25, 4722–4729. [Google Scholar] [CrossRef]
- Friedman, H.S.; Prados, M.D.; Wen, P.Y.; Mikkelsen, T.; Schiff, D.; Abrey, L.E.; Yung, W.K.; Paleologos, N.; Nicholas, M.K.; Jensen, R.; et al. Bevacizumab Alone and in Combination with Irinotecan in Recurrent Glioblastoma. J. Clin. Oncol. 2009, 27, 4733–4740. [Google Scholar] [CrossRef] [PubMed]
- Pommier, Y.; Leo, E.; Zhang, H.; Marchand, C. DNA Topoisomerases and their Poisoning by Anticancer and Antibacterial Drugs. Chem. Biol. 2010, 17, 421–433. [Google Scholar] [CrossRef] [PubMed]
- Pommier, Y.; Sun, Y.; Huang, S.N.; Nitiss, J.L. Roles of Eukaryotic Topoisomerases in Transcription, Replication and Genomic Stability. Nat. Rev. Mol. Cell Biol. 2016, 17, 703–721. [Google Scholar] [CrossRef]
- Pommier, Y. Topoisomerase I Inhibitors: Camptothecins and Beyond. Nat. Rev. Cancer 2006, 6, 789–802. [Google Scholar] [CrossRef] [PubMed]
- Huang, X.; Traganos, F.; Darzynkiewicz, Z. DNA Damage Induced by DNA Topoisomerase I-and Topoisomerase II-Inhibitors Detected by Histone H2AX Phosphorylation in Relation to the Cell Cycle Phase and Apoptosis. Cell Cycle 2003, 2, 614–619. [Google Scholar] [CrossRef] [PubMed]
- Hsiang, Y.H.; Lihou, M.G.; Liu, L.F. Arrest of Replication Forks by Drug-Stabilized Topoisomerase I-DNA Cleavable Complexes as a Mechanism of Cell Killing by Camptothecin. Cancer Res. 1989, 49, 5077–5082. [Google Scholar] [PubMed]
- Sordet, O.; Khan, Q.A.; Plo, I.; Pourquier, P.; Urasaki, Y.; Yoshida, A.; Antony, S.; Kohlhagen, G.; Solary, E.; Saparbaev, M.; et al. Apoptotic Topoisomerase I-DNA Complexes Induced by Staurosporine-Mediated Oxygen Radicals. J. Biol. Chem. 2004, 279, 50499–50504. [Google Scholar] [CrossRef] [PubMed]
- Pourquier, P.; Ueng, L.M.; Fertala, J.; Wang, D.; Park, H.J.; Essigmann, J.M.; Bjornsti, M.A.; Pommier, Y. Induction of Reversible Complexes between Eukaryotic DNA Topoisomerase I and DNA-Containing Oxidative Base Damages. 7, 8-Dihydro-8-Oxoguanine and 5-Hydroxycytosine. J. Biol. Chem. 1999, 274, 8516–8523. [Google Scholar] [CrossRef]
- Pourquier, P.; Bjornsti, M.A.; Pommier, Y. Induction of Topoisomerase I Cleavage Complexes by the Vinyl Chloride Adduct 1, N6-Ethenoadenine. J. Biol. Chem. 1998, 273, 27245–27249. [Google Scholar] [CrossRef]
- Ashour, M.E.; Atteya, R.; El-Khamisy, S.F. Topoisomerase-Mediated Chromosomal Break Repair: An Emerging Player in Many Games. Nat. Rev. Cancer 2015, 15, 137–151. [Google Scholar] [CrossRef]
- Pommier, Y.; Barcelo, J.M.; Rao, V.A.; Sordet, O.; Jobson, A.G.; Thibaut, L.; Miao, Z.H.; Seiler, J.A.; Zhang, H.; Marchand, C.; et al. Repair of Topoisomerase I-Mediated DNA Damage. Prog. Nucleic Acid Res. Mol. Biol. 2006, 81, 179–229. [Google Scholar] [PubMed]
- Pommier, Y.; Huang, S.Y.; Gao, R.; Das, B.B.; Murai, J.; Marchand, C. Tyrosyl-DNA-Phosphodiesterases (TDP1 and TDP2). DNA Repair (Amst.) 2014, 19, 114–129. [Google Scholar] [CrossRef] [PubMed]
- Kawale, A.S.; Povirk, L.F. Tyrosyl-DNA Phosphodiesterases: Rescuing the Genome from the Risks of Relaxation. Nucleic Acids Res. 2018, 46, 520–537. [Google Scholar] [CrossRef] [PubMed]
- Interthal, H.; Pouliot, J.J.; Champoux, J.J. The Tyrosyl-DNA Phosphodiesterase Tdp1 is a Member of the Phospholipase D Superfamily. Proc. Natl. Acad. Sci. USA 2001, 98, 12009–12014. [Google Scholar] [CrossRef] [PubMed]
- El-Khamisy, S.F.; Saifi, G.M.; Weinfeld, M.; Johansson, F.; Helleday, T.; Lupski, J.R.; Caldecott, K.W. Defective DNA Single-Strand Break Repair in Spinocerebellar Ataxia with Axonal Neuropathy-1. Nature 2005, 434, 108–113. [Google Scholar] [CrossRef] [PubMed]
- Takashima, H.; Boerkoel, C.F.; John, J.; Saifi, G.M.; Salih, M.A.; Armstrong, D.; Mao, Y.; Quiocho, F.A.; Roa, B.B.; Nakagawa, M.; et al. Mutation of TDP1, Encoding a Topoisomerase I-Dependent DNA Damage Repair Enzyme, in Spinocerebellar Ataxia with Axonal Neuropathy. Nat. Genet. 2002, 32, 267–272. [Google Scholar] [CrossRef] [PubMed]
- Interthal, H.; Chen, H.J.; Kehl-Fie, T.E.; Zotzmann, J.; Leppard, J.B.; Champoux, J.J. SCAN1 Mutant Tdp1 Accumulates the Enzyme--DNA Intermediate and Causes Camptothecin Hypersensitivity. EMBO J. 2005, 24, 2224–2233. [Google Scholar] [CrossRef]
- Meisenberg, C.; Gilbert, D.C.; Chalmers, A.; Haley, V.; Gollins, S.; Ward, S.E.; El-Khamisy, S.F. Clinical and Cellular Roles for TDP1 and TOP1 in Modulating Colorectal Cancer Response to Irinotecan. Mol. Cancer Ther. 2015, 14, 575–585. [Google Scholar] [CrossRef] [PubMed]
- Alagoz, M.; Wells, O.S.; El-Khamisy, S.F. TDP1 Deficiency Sensitizes Human Cells to Base Damage via Distinct Topoisomerase I and PARP Mechanisms with Potential Applications for Cancer Therapy. Nucleic Acids Res. 2014, 42, 3089–3103. [Google Scholar] [CrossRef]
- Roy, A.; Tesauro, C.; Frohlich, R.; Hede, M.S.; Nielsen, M.J.; Kjeldsen, E.; Bonven, B.; Stougaard, M.; Gromova, I.; Knudsen, B.R. Decreased Camptothecin Sensitivity of the Stem-Cell-Like Fraction of Caco2 Cells Correlates with an Altered Phosphorylation Pattern of Topoisomerase I. PLoS ONE 2014, 9, e99628. [Google Scholar] [CrossRef]
- Bandyopadhyay, K.; Li, P.; Gjerset, R.A. CK2-Mediated Hyperphosphorylation of Topoisomerase I Targets Serine 506, Enhances Topoisomerase I-DNA Binding, and Increases Cellular Camptothecin Sensitivity. PLoS ONE 2012, 7, e50427. [Google Scholar] [CrossRef] [PubMed]
- Murai, J.; Huang, S.Y.; Das, B.B.; Dexheimer, T.S.; Takeda, S.; Pommier, Y. Tyrosyl-DNA Phosphodiesterase 1 (TDP1) Repairs DNA Damage Induced by Topoisomerases I and II and Base Alkylation in Vertebrate Cells. J. Biol. Chem. 2012, 287, 12848–12857. [Google Scholar] [CrossRef]
- Jensen, P.W.; Falconi, M.; Kristoffersen, E.L.; Simonsen, A.T.; Cifuentes, J.B.; Marcussen, L.B.; Frohlich, R.; Vagner, J.; Harmsen, C.; Juul, S.; et al. Real-Time Detection of TDP1 Activity using a Fluorophore-Quencher Coupled DNA-Biosensor. Biosens. Bioelectron. 2013, 48, 230–237. [Google Scholar] [CrossRef] [PubMed]
- Fam, H.K.; Walton, C.; Mitra, S.A.; Chowdhury, M.; Osborne, N.; Choi, K.; Sun, G.; Wong, P.C.; O’Sullivan, M.J.; Turashvili, G.; et al. TDP1 and PARP1 Deficiency are Cytotoxic to Rhabdomyosarcoma Cells. Mol. Cancer Res. 2013, 11, 1179–1192. [Google Scholar] [CrossRef] [PubMed]
- Senter, P.D.; Beam, K.S.; Mixan, B.; Wahl, A.F. Identification and Activities of Human Carboxylesterases for the Activation of CPT-11, a Clinically Approved Anticancer Drug. Bioconjug. Chem. 2001, 12, 1074–1080. [Google Scholar] [CrossRef]
- Thomas, A.; Pommier, Y. Targeting Topoisomerase I in the Era of Precision Medicine. Clin. Cancer Res. 2019. [Google Scholar] [CrossRef]
- Gomez-Manzano, C.; Alonso, M.M.; Yung, W.K.; McCormick, F.; Curiel, D.T.; Lang, F.F.; Jiang, H.; Bekele, B.N.; Zhou, X.; Alemany, R.; et al. Delta-24 Increases the Expression and Activity of Topoisomerase I and Enhances the Antiglioma Effect of Irinotecan. Clin. Cancer Res. 2006, 12, 556–562. [Google Scholar] [CrossRef]
- Pavillard, V.; Charasson, V.; Laroche-Clary, A.; Soubeyran, I.; Robert, J. Cellular Parameters Predictive of the Clinical Response of Colorectal Cancers to Irinotecan. A Preliminary Study. Anticancer Res. 2004, 24, 579–585. [Google Scholar]
- Meisenberg, C.; Ward, S.E.; Schmid, P.; El-Khamisy, S.F. TDP1/TOP1 Ratio as a Promising Indicator for the Response of Small Cell Lung Cancer to Topotecan. J. Cancer Sci. Ther. 2014, 6, 258–267. [Google Scholar] [CrossRef]
- Yu, D.; Khan, E.; Khaleque, M.A.; Lee, J.; Laco, G.; Kohlhagen, G.; Kharbanda, S.; Cheng, Y.C.; Pommier, Y.; Bharti, A. Phosphorylation of DNA Topoisomerase I by the C-Abl Tyrosine Kinase Confers Camptothecin Sensitivity. J. Biol. Chem. 2004, 279, 51851–51861. [Google Scholar] [CrossRef]
- Noach, N.; Segev, Y.; Levi, I.; Segal, S.; Priel, E. Modification of Topoisomerase I Activity by Glucose and by O-GlcNAcylation of the Enzyme Protein. Glycobiology 2007, 17, 1357–1364. [Google Scholar] [CrossRef] [PubMed]
- Yu, H.; Park, J.; Lee, J.; Choi, K.; Choi, C. Constitutive Expression of MAP Kinase Phosphatase-1 Confers Multi-Drug Resistance in Human Glioblastoma Cells. Cancer Res. Treat. 2012, 44, 195–201. [Google Scholar] [CrossRef] [PubMed]
- Jandu, H.; Aluzaite, K.; Fogh, L.; Thrane, S.W.; Noer, J.B.; Proszek, J.; Do, K.N.; Hansen, S.N.; Damsgaard, B.; Nielsen, S.L.; et al. Molecular Characterization of Irinotecan (SN-38) Resistant Human Breast Cancer Cell Lines. BMC Cancer 2016, 16, 34. [Google Scholar] [CrossRef] [PubMed]
- Rajapakse, V.N.; Luna, A.; Yamade, M.; Loman, L.; Varma, S.; Sunshine, M.; Iorio, F.; Sousa, F.G.; Elloumi, F.; Aladjem, M.I.; et al. CellMinerCDB for Integrative Cross-Database Genomics and Pharmacogenomics Analyses of Cancer Cell Lines. iScience 2018, 10, 247–264. [Google Scholar] [CrossRef] [PubMed]
- Reinhold, W.C.; Sunshine, M.; Varma, S.; Doroshow, J.H.; Pommier, Y. Using CellMiner 1.6 for Systems Pharmacology and Genomic Analysis of the NCI-60. Clin. Cancer Res. 2015, 21, 3841–3852. [Google Scholar] [CrossRef] [PubMed]
- Comeaux, E.Q.; van Waardenburg, R.C. Tyrosyl-DNA Phosphodiesterase I Resolves both Naturally and Chemically Induced DNA Adducts and its Potential as a Therapeutic Target. Drug Metab. Rev. 2014, 46, 494–507. [Google Scholar] [CrossRef] [PubMed]
- Interthal, H.; Chen, H.J.; Champoux, J.J. Human Tdp1 Cleaves a Broad Spectrum of Substrates, Including Phosphoamide Linkages. J. Biol. Chem. 2005, 280, 36518–36528. [Google Scholar] [CrossRef]
- Zakharenko, A.L.; Luzina, O.A.; Sokolov, D.N.; Kaledin, V.I.; Nikolin, V.P.; Popova, N.A.; Patel, J.; Zakharova, O.D.; Chepanova, A.A.; Zafar, A.; et al. Novel Tyrosyl-DNA Phosphodiesterase 1 Inhibitors Enhance the Therapeutic Impact of Topotesmall Es, Cyrillican on in Vivo Tumor Models. Eur. J. Med. Chem. 2019, 161, 581–593. [Google Scholar] [CrossRef]
- Komarova, A.O.; Drenichev, M.S.; Dyrkheeva, N.S.; Kulikova, I.V.; Oslovsky, V.E.; Zakharova, O.D.; Zakharenko, A.L.; Mikhailov, S.N.; Lavrik, O.I. Novel Group of Tyrosyl-DNA-Phosphodiesterase 1 Inhibitors Based on Disaccharide Nucleosides as Drug Prototypes for Anti-Cancer Therapy. J. Enzym. Inhib. Med. Chem. 2018, 33, 1415–1429. [Google Scholar] [CrossRef]
- Lountos, G.T.; Zhao, X.Z.; Kiselev, E.; Tropea, J.E.; Needle, D.; Pommier, Y.; Burke, T.R.; Waugh, D.S. Identification of a Ligand Binding Hot Spot and Structural Motifs Replicating Aspects of Tyrosyl-DNA Phosphodiesterase I (TDP1) Phosphoryl Recognition by Crystallographic Fragment Cocktail Screening. Nucleic Acids Res. 2019. [Google Scholar] [CrossRef]
- Zhang, X.R.; Wang, H.W.; Tang, W.L.; Zhang, Y.; Yang, H.; Hu, D.X.; Ravji, A.; Marchand, C.; Kiselev, E.; Ofori-Atta, K.; et al. Discovery, Synthesis, and Evaluation of Oxynitidine Derivatives as Dual Inhibitors of DNA Topoisomerase IB (TOP1) and Tyrosyl-DNA Phosphodiesterase 1 (TDP1), and Potential Antitumor Agents. J. Med. Chem. 2018, 61, 9908–9930. [Google Scholar] [CrossRef] [PubMed]
- Desai, S.D.; Li, T.K.; Rodriguez-Bauman, A.; Rubin, E.H.; Liu, L.F. Ubiquitin/26S Proteasome-Mediated Degradation of Topoisomerase I as a Resistance Mechanism to Camptothecin in Tumor Cells. Cancer Res. 2001, 61, 5926–5932. [Google Scholar] [PubMed]
- Beidler, D.R.; Cheng, Y.C. Camptothecin Induction of a Time- and Concentration-Dependent Decrease of Topoisomerase I and its Implication in Camptothecin Activity. Mol. Pharmacol. 1995, 47, 907–914. [Google Scholar] [PubMed]
- Hudson, J.J.; Chiang, S.C.; Wells, O.S.; Rookyard, C.; El-Khamisy, S.F. SUMO Modification of the Neuroprotective Protein TDP1 Facilitates Chromosomal Single-Strand Break Repair. Nat. Commun. 2012, 3, 733. [Google Scholar] [CrossRef] [PubMed]
- Chiang, S.C.; Carroll, J.; El-Khamisy, S.F. TDP1 Serine 81 Promotes Interaction with DNA Ligase IIIalpha and Facilitates Cell Survival Following DNA Damage. Cell Cycle 2010, 9, 588–595. [Google Scholar] [CrossRef] [PubMed]
- Das, B.B.; Antony, S.; Gupta, S.; Dexheimer, T.S.; Redon, C.E.; Garfield, S.; Shiloh, Y.; Pommier, Y. Optimal Function of the DNA Repair Enzyme TDP1 Requires its Phosphorylation by ATM and/Or DNA-PK. EMBO J. 2009, 28, 3667–3680. [Google Scholar] [CrossRef] [PubMed]
- Das, B.B.; Huang, S.Y.; Murai, J.; Rehman, I.; Ame, J.C.; Sengupta, S.; Das, S.K.; Majumdar, P.; Zhang, H.; Biard, D.; et al. PARP1-TDP1 Coupling for the Repair of Topoisomerase I-Induced DNA Damage. Nucleic Acids Res. 2014, 42, 4435–4449. [Google Scholar] [CrossRef] [PubMed]
- Berti, M.; Ray Chaudhuri, A.; Thangavel, S.; Gomathinayagam, S.; Kenig, S.; Vujanovic, M.; Odreman, F.; Glatter, T.; Graziano, S.; Mendoza-Maldonado, R.; et al. Human RECQ1 Promotes Restart of Replication Forks Reversed by DNA Topoisomerase I Inhibition. Nat. Struct. Mol. Biol. 2013, 20, 347–354. [Google Scholar] [CrossRef] [PubMed]
- Regairaz, M.; Zhang, Y.W.; Fu, H.; Agama, K.K.; Tata, N.; Agrawal, S.; Aladjem, M.I.; Pommier, Y. Mus81-Mediated DNA Cleavage Resolves Replication Forks Stalled by Topoisomerase I-DNA Complexes. J. Cell Biol. 2011, 195, 739–749. [Google Scholar] [CrossRef] [PubMed]
- Zhang, Y.W.; Regairaz, M.; Seiler, J.A.; Agama, K.K.; Doroshow, J.H.; Pommier, Y. Poly(ADP-Ribose) Polymerase and XPF-ERCC1 Participate in Distinct Pathways for the Repair of Topoisomerase I-Induced DNA Damage in Mammalian Cells. Nucleic Acids Res. 2011, 39, 3607–3620. [Google Scholar] [CrossRef]
- Das, S.K.; Rehman, I.; Ghosh, A.; Sengupta, S.; Majumdar, P.; Jana, B.; Das, B.B. Poly(ADP-Ribose) Polymers Regulate DNA Topoisomerase I (Top1) Nuclear Dynamics and Camptothecin Sensitivity in Living Cells. Nucleic Acids Res. 2016, 44, 8363–8375. [Google Scholar] [CrossRef]
- Meisenberg, C.; Ashour, M.E.; El-Shafie, L.; Liao, C.; Hodgson, A.; Pilborough, A.; Khurram, S.A.; Downs, J.A.; Ward, S.E.; El-Khamisy, S.F. Epigenetic Changes in Histone Acetylation Underpin Resistance to the Topoisomerase I Inhibitor Irinotecan. Nucleic Acids Res. 2017, 45, 1159–1176. [Google Scholar] [CrossRef] [PubMed]
- Antony, S.; Marchand, C.; Stephen, A.G.; Thibaut, L.; Agama, K.K.; Fisher, R.J.; Pommier, Y. Novel High-Throughput Electrochemiluminescent Assay for Identification of Human Tyrosyl-DNA Phosphodiesterase (Tdp1) Inhibitors and Characterization of Furamidine (NSC 305831) as an Inhibitor of Tdp1. Nucleic Acids Res. 2007, 35, 4474–4484. [Google Scholar] [CrossRef] [PubMed]
- Simplicio, A.L.; Coroadinha, A.S.; Gilmer, J.F.; Lamego, J. A Methodology for Detection and Quantification of Esterase Activity. Methods Mol. Biol. 2013, 984, 309–319. [Google Scholar] [PubMed]


| Cell Lines | Irinotecan IC50 (μM) |
|---|---|
| SF539 | 1.91 ± 0.32 |
| SF295 | 2.83 ± 0.51 |
| H4 | 2.93 ± 0.44 |
| SF268 | 3.66 ± 0.76 |
| SNB19 | 3.68 ± 0.55 |
| U251 | 5.15 ± 1.17 |
| A172 | 8.42 ± 0.94 |
| SNB75 | 10.02 ± 1.38 |
| U87 | 10.50 ± 1.74 |
© 2019 by the authors. Licensee MDPI, Basel, Switzerland. This article is an open access article distributed under the terms and conditions of the Creative Commons Attribution (CC BY) license (http://creativecommons.org/licenses/by/4.0/).
Share and Cite
Wang, W.; Rodriguez-Silva, M.; Acanda de la Rocha, A.M.; Wolf, A.L.; Lai, Y.; Liu, Y.; Reinhold, W.C.; Pommier, Y.; Chambers, J.W.; Tse-Dinh, Y.-C. Tyrosyl-DNA Phosphodiesterase 1 and Topoisomerase I Activities as Predictive Indicators for Glioblastoma Susceptibility to Genotoxic Agents. Cancers 2019, 11, 1416. https://doi.org/10.3390/cancers11101416
Wang W, Rodriguez-Silva M, Acanda de la Rocha AM, Wolf AL, Lai Y, Liu Y, Reinhold WC, Pommier Y, Chambers JW, Tse-Dinh Y-C. Tyrosyl-DNA Phosphodiesterase 1 and Topoisomerase I Activities as Predictive Indicators for Glioblastoma Susceptibility to Genotoxic Agents. Cancers. 2019; 11(10):1416. https://doi.org/10.3390/cancers11101416
Chicago/Turabian StyleWang, Wenjie, Monica Rodriguez-Silva, Arlet M. Acanda de la Rocha, Aizik L. Wolf, Yanhao Lai, Yuan Liu, William C. Reinhold, Yves Pommier, Jeremy W. Chambers, and Yuk-Ching Tse-Dinh. 2019. "Tyrosyl-DNA Phosphodiesterase 1 and Topoisomerase I Activities as Predictive Indicators for Glioblastoma Susceptibility to Genotoxic Agents" Cancers 11, no. 10: 1416. https://doi.org/10.3390/cancers11101416
APA StyleWang, W., Rodriguez-Silva, M., Acanda de la Rocha, A. M., Wolf, A. L., Lai, Y., Liu, Y., Reinhold, W. C., Pommier, Y., Chambers, J. W., & Tse-Dinh, Y.-C. (2019). Tyrosyl-DNA Phosphodiesterase 1 and Topoisomerase I Activities as Predictive Indicators for Glioblastoma Susceptibility to Genotoxic Agents. Cancers, 11(10), 1416. https://doi.org/10.3390/cancers11101416