miRNA-130a Significantly Improves Accuracy of SGA Nutritional Assessment Tool in Prediction of Malnutrition and Cachexia in Radiotherapy-Treated Head and Neck Cancer Patients

Abstract
:1. Introduction
2. Materials and Methods
2.1. Study Group
2.2. Nutritional Assessment
2.3. miRNA and ELISA
2.4. Statistical Analysis
3. Results
3.1. miRNA-130a as a Predictor of Malnutrition and Cachexia
3.2. Comparison of the Impact of SGA and miRNA-130a on the Malnutrition and Cachexia Risk Score in Various Models
3.3. miRNA-130a Improves the Accuracy of SGA Tool in the Detection of Malnutrition and Cachexia
3.4. miRNA 130a and Grade of Cachexia
3.5. miRNA-130a and Patients’ Survival
4. Discussion
5. Conclusions
Author Contributions
Funding
Conflicts of Interest
References
- Argilés, J.M.; Alvarez, B.; López-Soriano, F.J. The metabolic basis of cancer cachexia. Med. Res. Rev. 1997, 17, 477–498. [Google Scholar] [CrossRef]
- Fearon, K.C.; Moses, A.G. Cancer cachexia. Int. J. Cardiol. 2002, 85, 73–81. [Google Scholar] [CrossRef]
- Couch, M.E.; Dittus, K.; Toth, M.J.; Willis, M.S.; Guttridge, D.C.; George, J.R.; Barnes, C.A.; Gourin, C.G.; Der-Torossian, H. Cancer cachexia update in head and neck cancer: Definitions and diagnostic features. Head Neck 2015, 37, 594–604. [Google Scholar] [CrossRef] [PubMed]
- Aoyagi, T.; Terracina, K.P.; Raza, A.; Matsubara, H.; Takabe, K. Cancer cachexia, mechanism and treatment. World J. Gastrointest Oncol. 2015, 7, 17–29. [Google Scholar] [CrossRef] [PubMed]
- Alshadwi, A.; Nadershah, M.; Carlson, E.R.; Young, L.S.; Burke, P.A.; Daley, B.J. Nutritional considerations for head and neck cancer patients: A review of the literature. J. Oral Maxillofac. Surg. 2013, 71, 1853–1860. [Google Scholar] [CrossRef] [PubMed]
- Gorenc, M.; Kozjek, N.R.; Strojana, P. Malnutrition and cachexia in patients with head and neck cancer treated with (chemo)radiotherapy. Rep. Pract. Oncol. Radiother. 2015, 20, 249–258. [Google Scholar] [CrossRef] [PubMed]
- Tisdale, M.J. Mechanisms of cancer cachexia. Physiol. Rev. 2009, 89, 381–410. [Google Scholar] [CrossRef] [PubMed]
- Seelaender, M.; Batista, M., Jr.; Lira, F.; Silverio, R.; Rossi-Fanelli, F. Inflammation in cancer cachexia: To resolve or not to resolve (is that the question?). Clin. Nutr. 2012, 31, 562–566. [Google Scholar] [CrossRef] [PubMed]
- Porporato, P.E. Understanding cachexia as a cancer metabolism syndrome. Oncogenesis 2016, 5, e200. [Google Scholar] [CrossRef] [PubMed]
- Camargo, R.G.; Quintas Teixeira Ribeiro, H.; Geraldo, M.V.; Matos-Neto, E.; Neves, R.X.; Carnevali, L.C., Jr.; Donatto, F.F.; Alcântara, P.S.; Ottoch, J.P.; Seelaender, M. Cancer Cachexia and MicroRNAs. Mediators Inflamm. 2015, 2015, 367561–367565. [Google Scholar] [CrossRef] [PubMed]
- Acunzo, M.; Croce, C.M. MicroRNA in Cancer and Cachexia—A Mini-Review. J. Infect. Dis. 2015, 212, S74–S77. [Google Scholar] [CrossRef] [PubMed]
- Kulyté, A.; Lorente-Cebrián, S.; Gao, H.; Mejhert, N.; Agustsson, T.; Arner, P.; Rydén, M.; Dahlman, I. MicroRNA profiling links miR-378 to enhanced adipocyte lipolysis in human cancer cachexia. Am. J. Physiol. Endocrinol. Metabol. 2014, 306, E267–E274. [Google Scholar] [CrossRef] [PubMed] [Green Version]
- He, W.A.; Calore, F.; Londhe, P.; Canella, A.; Guttridge, D.C.; Croce, C.M. Microvesicles containing miRNAs promote muscle cell death in cancer cachexia via TLR7. Proc. Natl. Acad. Sci. USA 2014, 111, 4525–4529. [Google Scholar] [CrossRef] [PubMed] [Green Version]
- Li, Z.C.; Han, N.; Li, X.; Li, G.; Liu, Y.Z.; Sun, G.X.; Wang, Y.; Chen, G.T.; Li, G.F. Decreased expression of microRNA-130a correlates with TNF-α in the development of osteoarthritis. Int. J. Clin. Exp. Pathol. 2015, 8, 2555–2564. [Google Scholar] [PubMed]
- Zhang, J.; Wu, H.; Li, P.; Zhao, Y.; Liu, M.; Tang, H. NF-κB-modulated miR-130a targets TNF-α in cervical cancer cells. J. Transl. Med. 2014, 12, 155. [Google Scholar] [CrossRef] [PubMed] [Green Version]
- Cederholm, T.; Barazzoni, R.; Austin, P.; Ballmer, P.; Biolo, G.; Bischoff, S.C.; Compher, C.; Correia, I.; Higashiguchi, T.; Holst, M. ESPEN guidelines on definitions and terminology of clinical nutrition. Clin. Nutr. 2017, 36, 49–64. [Google Scholar] [CrossRef] [PubMed]
- Loumaye, A.; Thissen, J.P. Biomarkers of cancer cachexia. Clin. Biochem. 2017, 50, 1281–1288. [Google Scholar] [CrossRef] [PubMed] [Green Version]
- Johns, N.; Tan, B.H.; MacMillan, M.; Solheim, T.S.; Ross, J.A.; Baracos, V.E.; Damaraju, S.; Fearon, K.C. Genetic basis of interindividual susceptibility to cancer cachexia: Selection of potential candidate gene polymorphisms for association studies. J. Genet. 2014, 93, 893–916. [Google Scholar] [CrossRef] [PubMed]
- Sharma, M.; Juvvuna, P.K.; Kukreti, H.; McFarlane, C. Mega roles of microRNAs in regulation of skeletal muscle health and disease. Front. Physiol. 2014, 5, 239. [Google Scholar] [CrossRef] [PubMed]
- Fabbri, M.; Paone, A.; Calore, F.; Galli, R.; Gaudio, E.; Santhanam, R.; Lovat, F.; Fadda, P.; Mao, C.; Nuovo, G.J. MicroRNAs bind to Toll-like receptors to induce prometastatic inflammatory response. Proc. Natl. Acad. Sci. USA 2012, 109, E2110–E2116. [Google Scholar] [CrossRef] [PubMed] [Green Version]
- Soares, R.J.; Cagnin, S.; Chemello, F.; Silvestrin, M.; Musaro, A.; De Pitta, C.; Lanfranchi, G.; Sandri, M. Involvement of microRNAs in the regulation of muscle wasting during catabolic conditions. J. Biol. Chem. 2014, 289, 21909–21925. [Google Scholar] [CrossRef] [PubMed]
- Xie, H.; Lim, B.; Lodish, H.F. MicroRNAs induced during adipogenesis that accelerate fat cell development are downregulated in obesity. Diabetes 2009, 58, 1050–1057. [Google Scholar] [CrossRef] [PubMed] [Green Version]


| Factor | Study Group (n = 70) | |
|---|---|---|
| Gender | Male | 56 (80%) |
| Female | 14 (20%) | |
| Age | median (range) | 63 (42–87) |
| >63 | 40 (57.1%) | |
| ≤63 | 30 (42.9%) | |
| Histopathological diagnosis | Squamous-cell carcinoma | 64 (91.4%) |
| Other | 6 (8.6%) | |
| Tumor location | Upper throat | 19 (27.1%) |
| - Nasopharynx | 2 (2.9%) | |
| - Oropharynx | 17 (24.2%) | |
| Lower throat | 51 (72.9%) | |
| - Hypopharynx | 13 (18.6%) | |
| - Larynx | 38 (54.3%) | |
| Others | 32 (45.7%) | |
| T stage | T1 | 2 (2.9%) |
| T2 | 9 (12.9%) | |
| T3 | 21 (30%) | |
| T4 | 38 (54.2%) | |
| N stage | N0 | 21 (30%) |
| N1 | 8 (11.4%) | |
| N2 | 36 (51.5%) | |
| N3 | 5 (7.1%) | |
| M stage | Mx | 4 (5.7%) |
| M0 | 65 (92.9%) | |
| M1 | 1 (1.4%) | |
| Disease stage | I | 2 (2.9%) |
| III | 15 (21.4%) | |
| IVA | 44 (62.9%) | |
| IVB | 4 (5.7%) | |
| IVC | 5 (7.1%) | |
| Performance status (PS) | ≤1 | 62 (89.4%) |
| >1 | 8 (10.6%) | |
| Type of treatment | Surgery + radiotherapy (RTH) | 34 (48.5%) |
| Surgery + chemoradiation | 16 (22.9%) | |
| RTH alone | 10 (14.3%) | |
| Induction chemoradiotherapy (CHTH) + RTH | 3 (4.3%) | |
| Concurrent chemoradiation | 7 (10%) | |
| Alcohol consumption | Yes | 29 (41.4%) |
| No | 41 (58.6%) | |
| Smoking status | Smoker | 57 (81.4%) |
| Non-smoker | 13 (18.6%) | |
| Current smoker | 50 (87.7%) | |
| Former smoker | 7 (12.3%) | |
| Parenteral nutrition | Yes | 12 (17.1%) |
| No | 58 (82.9%) | |
| Weight (kg) | Mean ± SD | 65.04 ± 12.01 |
| Body mass index (BMI) | Mean ± SD | 23.34 ± 4.55 |
| ≥18.5 | 51 (72.9%) | |
| <18.5 | 19 (27.1%) | |
| Subjective Global Assessment (SGA) | A | 10 (14.3%) |
| B | 35 (50%) | |
| C | 25 (35.7%) | |
| Nutritional Risk Score (NRS) | 2 | 47 (67.1%) |
| 3 | 20 (28.6%) | |
| 4 | 2 (2.9%) | |
| 5 | 1 (1.4%) | |
| Total protein (g/L) | Median ± SD | 6.71 ± 0.53 |
| Albumin (g/L) | Median ± SD | 3.34 ± 0.26 |
| Prealbumin (g/dL) | Median ± SD | 0.20 ± 0.08 |
| Transferrin (g/L) | Median ± SD | 2.50 ± 0.60 |
| Factor | miRNA-130a Expression | p | |
|---|---|---|---|
| Gender | Male | 0.211 ± 0.10 | 0.369 |
| Female | 0.199 ± 0.13 | ||
| Age | <63 years | 0.204 ± 0.10 | 0.542 |
| ≥63 years | 0.209 ± 0.11 | ||
| Histopathological diagnosis | Squamous cell carcinoma (SCC) | 0.210 ± 0.11 | 0.09 |
| Other | 0.153 ± 0.07 | ||
| Tumor location | Larynx | 0.199 ± 0.13 | 0.773 |
| Other | 0.210 ± 0.07 | ||
| Disease stage | I–III | 0.188 ± 0.12 | 0.659 |
| IVA–IVC | 0.206 ± 0.10 | ||
| Performance status | ≤1 | 0.199 ± 0.11 | 0.218 |
| >1 | 0.220 ± 0.05 | ||
| Alcohol consumption | Yes | 0.222 ± 0.11 | 0.392 |
| No | 0.201 ± 0.10 | ||
| Smoking status | Smoker | 0.210 ± 0.09 | 0.521 |
| Non-smoker | 0.189 ± 0.13 | ||
| Parenteral nutrition | Yes | 0.222 ± 0.07 | 0.493 |
| No | 0.199 ± 0.11 | ||
| SGA | A | 0.213 ± 0.08 | 0.370 |
| B+C | 0.203 ± 0.11 | ||
| A+B | 0.196 ± 0.10 | 0.588 | |
| C | 0.214 ± 0.11 | ||
| Plasma TNF-α concentration | High | 0.193 ± 0.07 | 0.029 |
| Low | 0.222 ± 0.14 | ||
| Factor (Median) | miRNA-130a Expression | p | |
|---|---|---|---|
| High | Low | ||
| Weight (kg) (I) All patients | 66 ± 12.30 | 62 ± 11.0 | 0.107 |
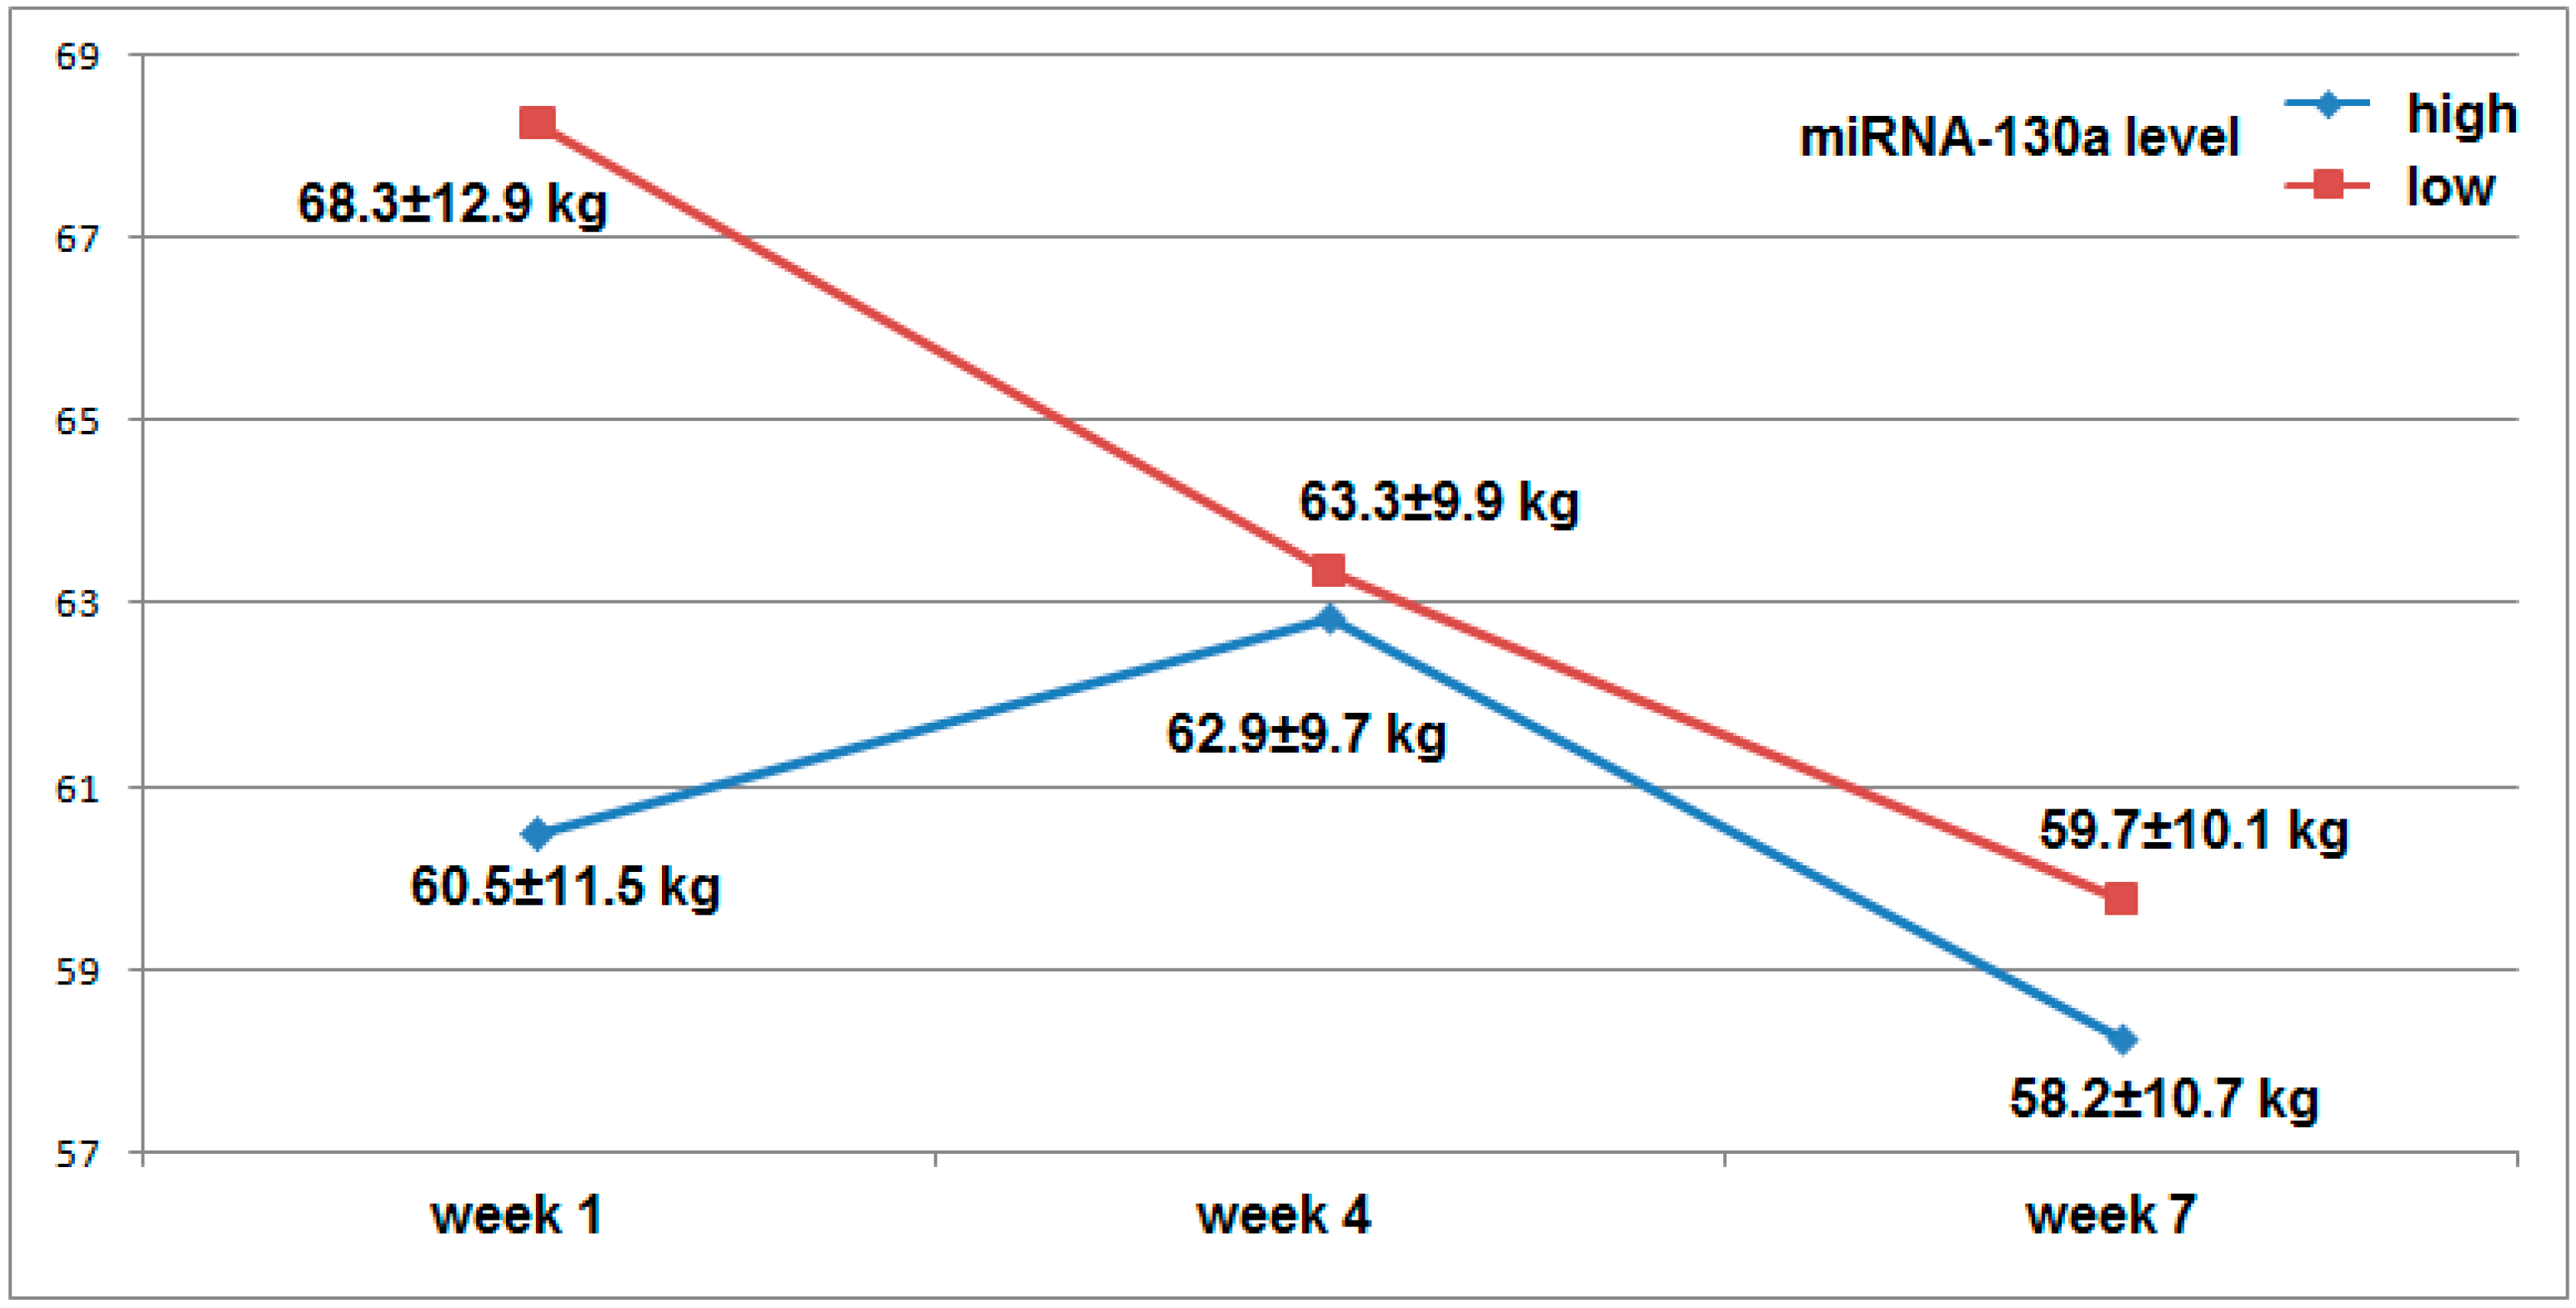
| Weight (kg) (I) Men | 60.5 ± 11.50 | 68.3 ± 12.90 | 0.036 |
| Weight (kg) (I) Women | 68 ± 7.34 | 67 ± 8.95 | 0.943 |
| Weight (kg) (VII) All patients | 58.5 ± 10.16 | 59 ± 9.73 | 0.838 |
| Weight (kg) (VII) Men | 58.2 ± 10.70 | 59.7 ± 10.10 | 0.542 |
| Weight (kg) (VII) Women | 58 ± 8.25 | 62 ± 7.30 | 0.391 |
| BMI (I) All patients | 22.95 ± 4.55 | 22.91 ± 4.58 | 0.385 |
| BMI (I) Men | 24.39 ± 4.58 | 22.99 ± 4.38 | 0.217 |
| BMI (I) Women | 22.57 ± 4.32 | 19.16 ± 4.36 | 0.296 |
| BMI (VII) All patients | 20.07 ± 3.85 | 19.37 ± 3.86 | 0.351 |
| BMI (VII) Men | 20.42 ± 3.85 | 19.37 ± 3.88 | 0.315 |
| BMI (VII) Women | 19.20 ± 3.89 | 18.68 ± 3.85 | 0.432 |
| Transferrin (g/L) | 2.50 ± 0.60 | 2.50 ± 0.61 | 0.418 |
| Prealbumin (g/dL) | 0.20 ± 0.08 | 0.20 ± 0.08 | 0.774 |
| TP (g/L) (I) | 6.71 ± 0.52 | 6.65 ± 0.54 | 0.611 |
| TP (g/L) (VII) | 6.58 ± 0.67 | 6.28 ± 0.68 | 0.101 |
| Albumin (g/L) (I) | 3.34 ± 0.42 | 3.34 ± 0.25 | 0.857 |
| Albumin (g/L) (VII) | 3.25 ± 0.40 | 3.09 ± 0.44 | 0.095 |
| TNF-α plasma level (pg/mL) | 9.41 ± 1.30 | 10.11 ± 1.37 | 0.016 |
| Factor | miRNA-130a Expression | |||
|---|---|---|---|---|
| High | Low | p, OR (95% CI) | ||
| SGA All patients | A | 8 (80%) | 2 (20%) | 0.039 5.60 (1.095–28.65) |
| B and C | 25 (41.7%) | 35 (58.3%) | ||
| A and B | 21 (46.7%) | 24 (53.3%) | 0.915 0.948 (0.356–2.523) | |
| C | 12 (48%) | 13 (52%) | ||
| SGA Without parenteral nutrition | A | 7 (77.8%) | 2 (22.2%) | 0.045 5.526 (1.037–29.453) |
| B and C | 19 (38.8%) | 30 (61.2%) | ||
| A and B | 19 (46.3%) | 22 (53.7%) | 0.719 1.234 (0.393–3.875) | |
| C | 7 (41.2%) | 10 (58.8%) | ||
| SGA Parenterally nourished | A | 1 | 0 | 0.591 2.539 (0.085–75.77) |
| B and C | 6 (54.5%) | 5 (45.5%) | ||
| A and B | 2 (50%) | 2 (50%) | 0.680 0.60 (0.053–6.795) | |
| C | 5 (62.5%) | 3 (37.5%) | ||
| NRS All patients | 2 and 3 | 33 (49.3%) | 34 (50.7%) | 0.211 6.797 (0.338–136.68) |
| 4 | 0 | 3 | ||
| 2 | 22 (46.8%) | 25 (53.2%) | 0.936 0.960 (0.354–2.607) | |
| 3 and 4 | 11 (47.8%) | 12 (52.2%) | ||
| NRS Without parenteral nutrition | 2 and 3 | 26 (46.4%) | 30 (53.6%) | 0.350 4.344 (0.200–94.59) |
| 4 | 0 | 2 | ||
| 2 | 18 (46.2%) | 21 (53.8%) | 0.771 1.179 (0.390–3.566) | |
| 3 and 4 | 8 (42.1%) | 11 (57.9%) | ||
| NRS Parenterally nourished | 2 and 3 | 7 (63.6%) | 4 (36.4%) | 0.355 5.00 (0.166–150.93) |
| 4 | 0 | 1 | ||
| 2 | 4 (50%) | 4 (50%) | 0.417 0.333 (0.023–4.736) | |
| 3 and 4 | 3 (75%) | 1 (25%) | ||
| BMI (I) All patients | <24.9 (N and UW) | 22 (46.8%) | 25 (53.2%) | 0.936 0.960 (0.354–2.607) |
| >25.0 (OW) | 11 (47.8%) | 12 (52.2%) | ||
| <18.5 (UW) | 10 (45.5%) | 12 (54.5%) | 0.848 0.906 (0.329–2.493) | |
| >18.5 (N and OW) | 23 (47.9%) | 25 (52.1%) | ||
| BMI (I) Without parenteral nutrition | <24.9 (N and UW) | 18 (46.2%) | 21 (53.8%) | 0.771 1.179 (0.390–3.566) |
| >25.0 (OW) | 8 (42.1%) | 11 (57.9%) | ||
| <18.5 (UW) | 8 (44.4%) | 10 (55.6%) | 0.969 0.978 (0.319–2.994) | |
| >18.5 (N and OW) | 18 (45%) | 22 (55%) | ||
| BMI (I) Parenterally nourished | <24.9 (N and UW) | 4 (50%) | 4 (50%) | 0.417 0.333 (0.023–4.736) |
| >25.0 (OW) | 3 (75%) | 1 (25%) | ||
| <18.5 (UW) | 2 (50%) | 2 (50%) | 0.680 0.60 (0.053–6.795) | |
| >18.5 (N and OW) | 5 (62.5%) | 3 (37.5%) | ||
| BMI (VII) All patients | <24.9 (N and UW) | 24 (45.3%) | 29 (54.7%) | 0.583 0.736 (0.246–2.200) |
| >25.0 (OW) | 9 (52.9%) | 8 (47.1%) | ||
| <18.5 (UW) | 5 (26.3%) | 14 (73.7%) | 0.038 3.409 (1.068–10.880) | |
| >18.5 (N and OW) | 28 (54.9%) | 23 (45.1%) | ||
| BMI (VII) Without parenteral nutrition | <24.9 (N and UW) | 20 (44.4%) | 25 (55.6%) | 0.545 0.739 (0.277–1.969) |
| >25.0 (OW) | 13 (52%) | 12 (48%) | ||
| <18.5 (UW) | 5 (31.3%) | 11 (68.7%) | 0.153 0.422 (0.129–1.380) | |
| >18.5 (N and OW) | 28 (51.9%) | 26 (48.1%) | ||
| BMI VII Parenterally nourished | <24.9 (N and UW) | 4 (50%) | 4 (50%) | 0.417 0.333 (0.023–4.636) |
| >25.0 (OW) | 3 (75%) | 1 (25%) | ||
| <18.5 (UW) | 0 | 3 | 0.07 0.048 (0.002–1.279) | |
| >18.5 (N and OW) | 7 (77.8%) | 2 (22.2%) | ||
| Weight loss All patients | <%5 | 21 (63.6%) | 12 (36.4%) | 0.001 6.344 (2.206–18.24) |
| >%5 | 8 (21.6%) | 29 (78.4%) | ||
| <10% | 27 (57.4%) | 20 (42.6%) | 0.001 14.18 (2.974–67.55) | |
| >10% | 2 (8.7%) | 21 (91.3%) | ||
| Weight loss Without parenteral nutrition | <%5 | 28 (66.7%) | 14 (33.3%) | <0.001 9.20 (2.882–29.36) |
| >%5 | 5 (17.9%) | 23 (82.1%) | ||
| <10% | 31 (62%) | 19 (38%) | <0.001 14.68 (3.059–70.48) | |
| >10% | 2 (10%) | 18 (90%) | ||
| Weight loss Parenterally nourished | <%5 | 4 (80%) | 1 (20%) | 0.216 5.333 (0.375–75.78) |
| >%5 | 3 (%) | 4 (%) | ||
| <10% | 7 (77.8%) | 2 (22.2%) | 0.070 21.0 (0.782–564.18) | |
| >10% | 0 | 3 | ||
| Model 1 | Weight Loss >5% | Weight Loss <5% | p, OR (95% CI) | |
| SGA | A+B | 20 (44.4%) | 25 (55.6%) | 0.215 1.88 (0.695–5.061) |
| C | 15 (60%) | 10 (40%) | ||
| miRNA-130a | Low expression | 27 (73%) | 10 (27%) | <0.001 8.438 (2.873–24.78) |
| High expression | 8 (24.2%) | 25 (75.8%) | ||
| Model 2 | Weight Loss >5% + High TNF-α | Weight Loss <5% + Low TNF-α | p, OR (95% CI) | |
| SGA | A+B | 12 (52.2%) | 11 (47.8%) | 0.0395 5.958 (1.090–32.57) |
| C | 13 (86.7%) | 2 (13.3%) | ||
| miRNA-130a | Low expression | 22 (95.7%) | 1 (4.3%) | <0.001 88.0 (8.226–941.37) |
| High expression | 3 (20%) | 12 (80%) | ||
| Model 3 | Weight Loss >10% | Weight Loss <10% | p, OR (95% CI) | |
| SGA | A+B | 15 (32.6%) | 31 (67.4%) | 0.951 0.968 (0.339–2.763) |
| C | 8 (33.3%) | 16 (66.7%) | ||
| miRNA-130a | Low expression | 22 (59.5%) | 15 (40.5%) | <0.001 46.93 (5.772–381.66) |
| High expression | 1 (3%) | 32 (97%) | ||
| Model 4 | Weight Loss >10% + High TNF-α | Weight Loss <10% + Low TNF-α | p, OR (95% CI) | |
| SGA | A+B | 10 (40%) | 15 (60%) | 0.09 3.375 (0.813–14.02) |
| C | 9 (69.2%) | 4 (30.8%) | ||
| miRNA-130a | Low expression | 18 (85.7%) | 3 (14.3%) | <0.001 96.0 (9.053–1018) |
| High expression | 1 (5.9%) | 16 (94.1%) | ||
| Model 1 | Weight Loss >5% | Weight Loss <5% | p | |
| SGA | C | 15 (60%) | 10 (40%) | 0.407 |
| miRNA-130a | Low expression | 27 (73%) | 10 (27%) | |
| Model 2 | High TNF-α + Weight Loss >5% | Low TNF-α + Weight Loss <5% | p | |
| SGA | C | 13 (86.7%) | 2 (13.3%) | 0.550 |
| miRNA-130a | Low expression | 22 (95.7%) | 1 (4.3%) | |
| Model 3 | Weight Loss >10% | Weight Loss <10% | p | |
| SGA | C | 8 (33.3%) | 16 (66.7%) | 0.049 |
| miRNA-130a | Low expression | 22 (59.5%) | 15 (40.5%) | |
| Model 4 | High TNF-α + Weight Loss >10% | Low TNF-α + Weight Loss <10% | p | |
| SGA | C | 9 (69.2%) | 4 (30.8%) | 0.387 |
| miRNA-130a | Low expression | 18 (85.7%) | 3 (14.3%) | |
| Model 1 | Weight Loss >5% | Weight Loss <5% | p | |
| SGA | B+C | 31 (44.3%) | 29 (55.7%) | 0.033 |
| miRNA-130a | Low expression | 27 (73%) | 10 (27%) | |
| Model 2 | High TNF-α + Weight Loss >5% | Low TNF-α + Weight Loss <5% | p | |
| SGA | B+C | 24 (72.7%) | 9 (27.3%) | 0.036 |
| miRNA-130a | Low expression | 22 (96.7%) | 1 (3.3%) | |
| Model 3 | Weight Loss >10% | Weight Loss <10% | p | |
| SGA | B+C | 20 (33.3%) | 40 (66.7%) | 0.034 |
| miRNA-130a | Low expression | 21 (56.8%) | 16 (43.2%) | |
| Model 4 | High TNF-α + Weight Loss >10% | low TNF-α + Weight Loss <10% | p | |
| SGA | B+C | 19 (57.6%) | 14 (42.4%) | 0.038 |
| miRNA-130a | Low expression | 18 (85.7%) | 3 (14.3%) | |
| Cachexia Model | Sensitivity | Specificity | PPV | NPV | |
|---|---|---|---|---|---|
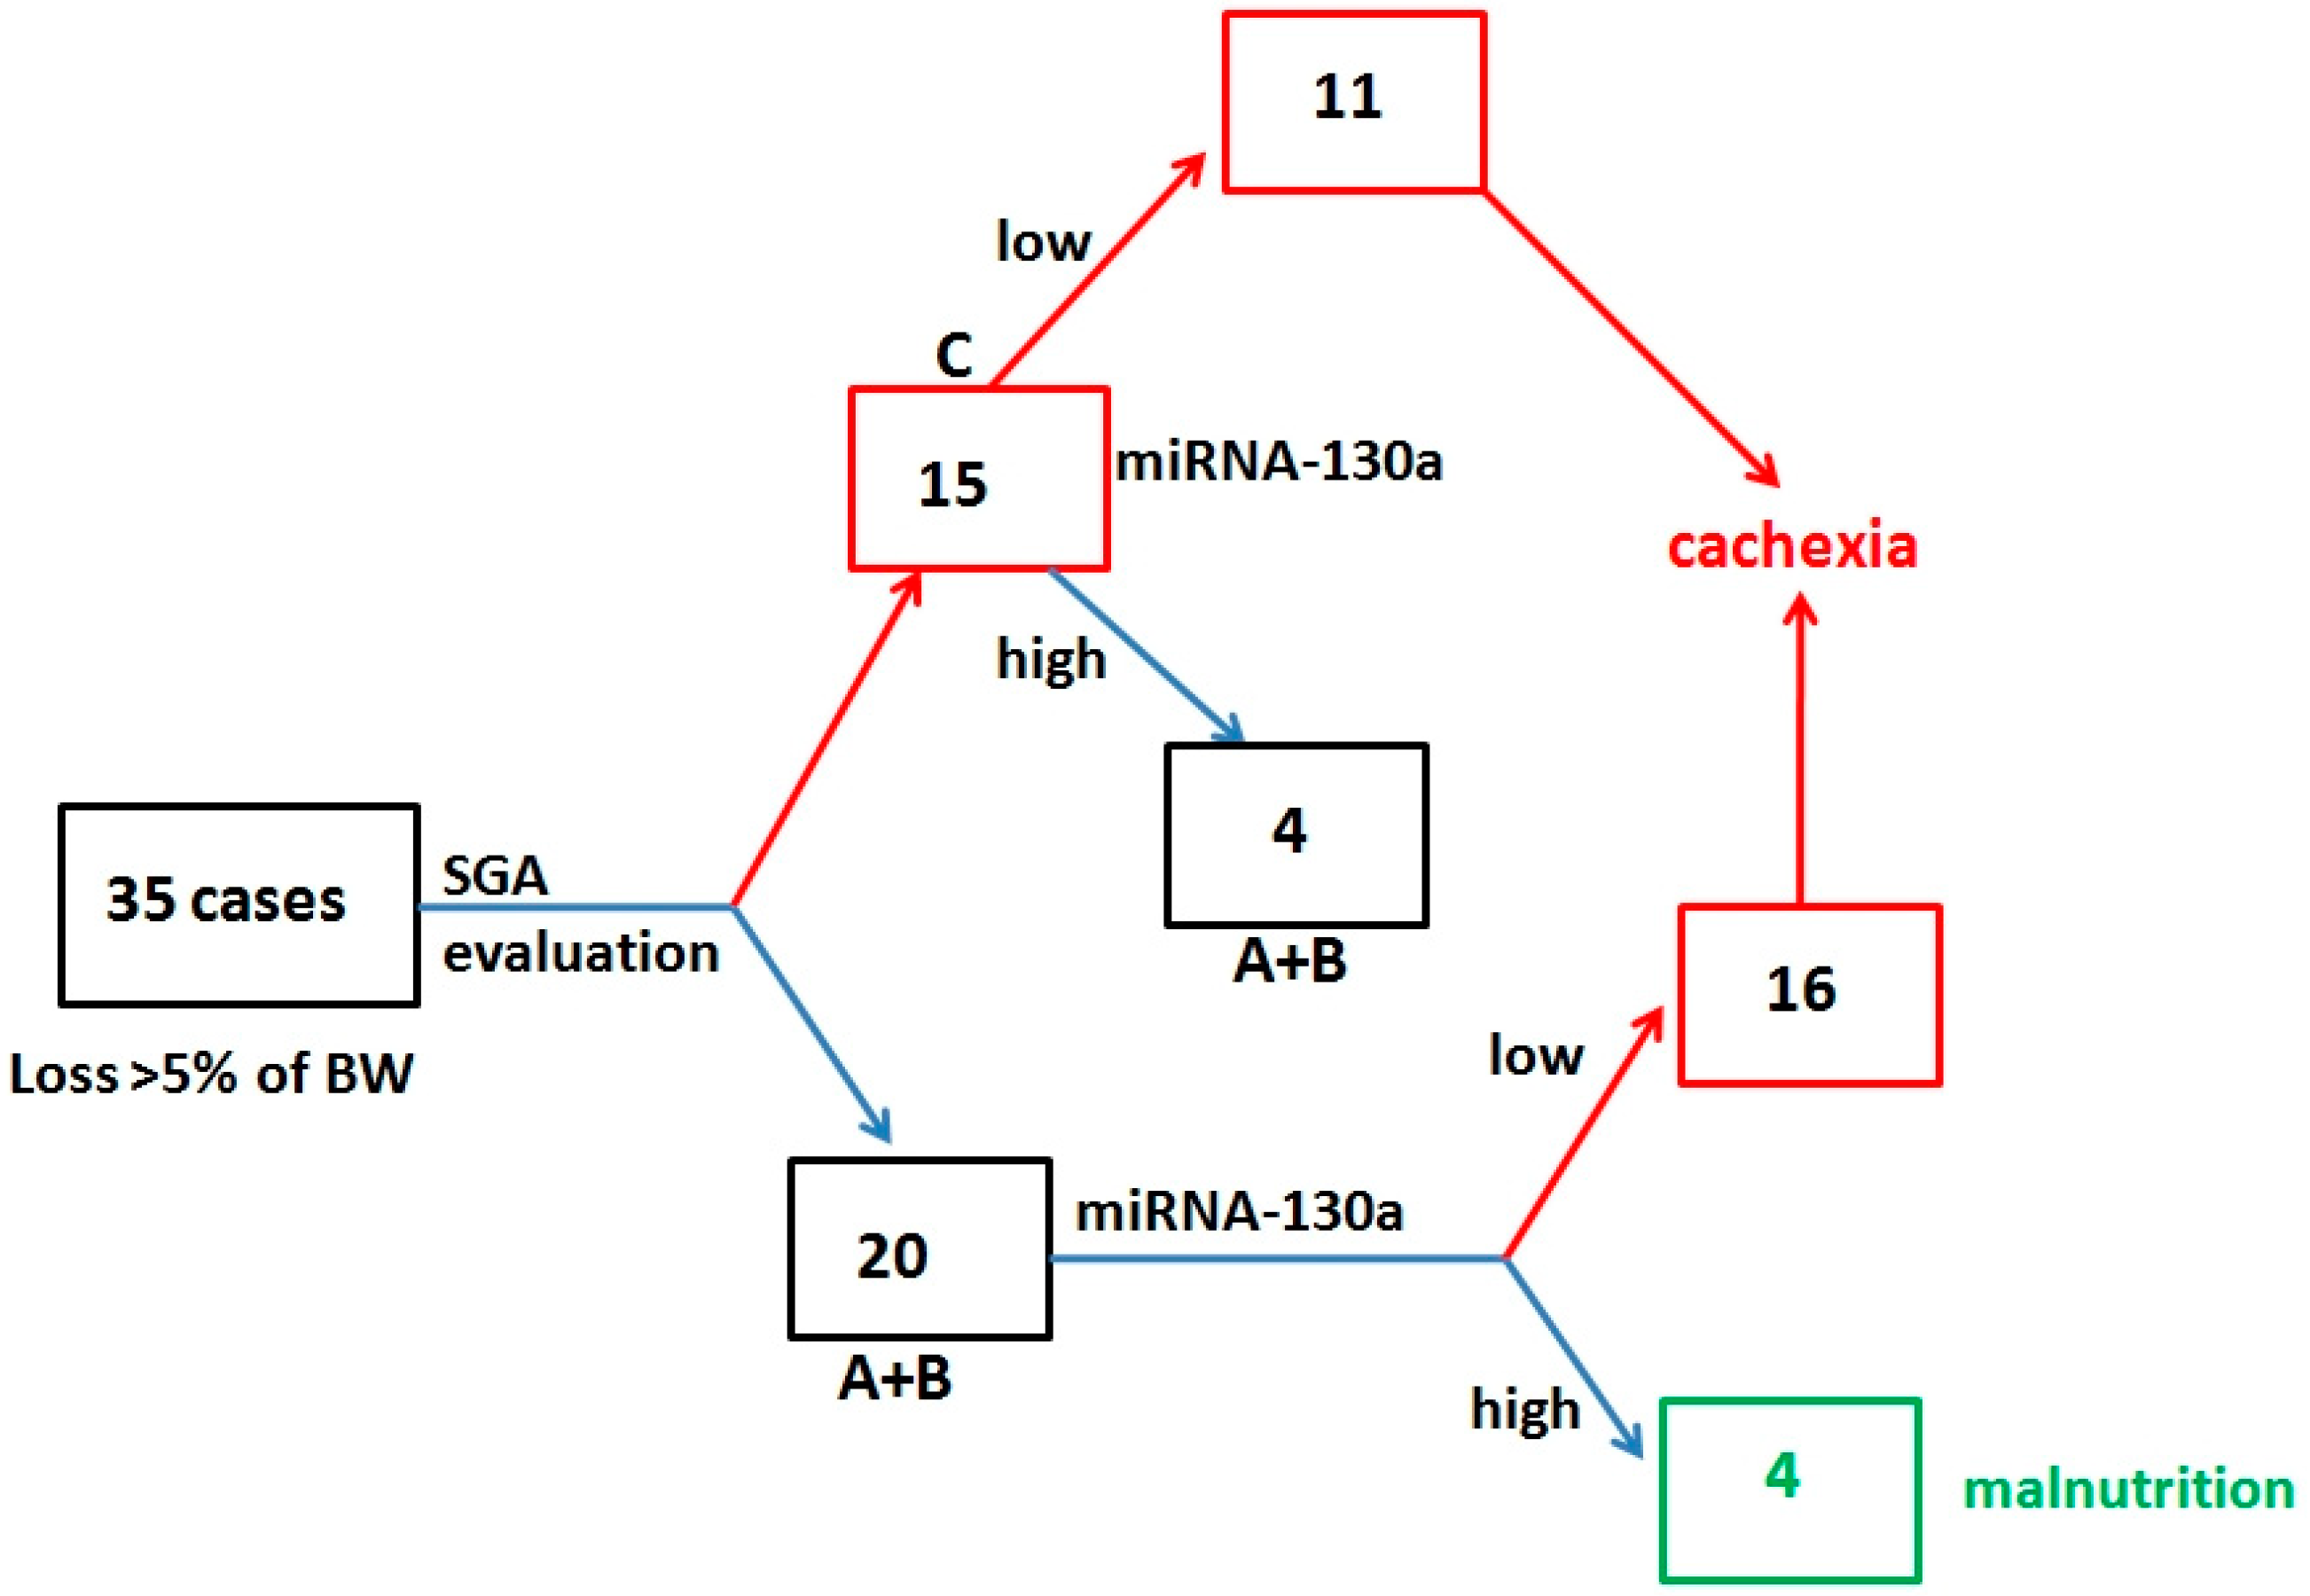
| miRNA | Loss >5% of BW | 77.1% | 71.4% | 73% | 75.8% |
| SGA-C | 42.9% | 71.4% | 60% | 55.6% | |
| SGA-C + miRNA | 88.6% | 94.3% | 93.9% | 89.2% | |
| miRNA | high TNF-α + loss >5% of BW | 88% | 45% | 70.7% | 78.6% |
| SGA-C | 50% | 60% | 61.9% | 52% | |
| SGA-C + miRNA | 84.6% | 90% | 92.3% | 90% | |
| miRNA | Loss >10% of BW | 91.3% | 66% | 56.8% | 93.9% |
| SGA-C | 39.1% | 66% | 64% | 68.9% | |
| SGA-C + miRNA | 91.3% | 91.5% | 84% | 95.6% | |
| miRNA | high TNF-α + loss >10% of BW | 94.7% | 50% | 58.1% | 92.9% |
| SGA-C | 47.4% | 53.8% | 57.1% | 58.3% | |
| SGA-C + miRNA | 94.7% | 84.6% | 81.8% | 95.6% | |
© 2018 by the authors. Licensee MDPI, Basel, Switzerland. This article is an open access article distributed under the terms and conditions of the Creative Commons Attribution (CC BY) license (http://creativecommons.org/licenses/by/4.0/).
Share and Cite
Powrózek, T.; Mlak, R.; Brzozowska, A.; Mazurek, M.; Gołębiowski, P.; Małecka-Massalska, T. miRNA-130a Significantly Improves Accuracy of SGA Nutritional Assessment Tool in Prediction of Malnutrition and Cachexia in Radiotherapy-Treated Head and Neck Cancer Patients. Cancers 2018, 10, 294. https://doi.org/10.3390/cancers10090294
Powrózek T, Mlak R, Brzozowska A, Mazurek M, Gołębiowski P, Małecka-Massalska T. miRNA-130a Significantly Improves Accuracy of SGA Nutritional Assessment Tool in Prediction of Malnutrition and Cachexia in Radiotherapy-Treated Head and Neck Cancer Patients. Cancers. 2018; 10(9):294. https://doi.org/10.3390/cancers10090294
Chicago/Turabian StylePowrózek, Tomasz, Radosław Mlak, Anna Brzozowska, Marcin Mazurek, Paweł Gołębiowski, and Teresa Małecka-Massalska. 2018. "miRNA-130a Significantly Improves Accuracy of SGA Nutritional Assessment Tool in Prediction of Malnutrition and Cachexia in Radiotherapy-Treated Head and Neck Cancer Patients" Cancers 10, no. 9: 294. https://doi.org/10.3390/cancers10090294
APA StylePowrózek, T., Mlak, R., Brzozowska, A., Mazurek, M., Gołębiowski, P., & Małecka-Massalska, T. (2018). miRNA-130a Significantly Improves Accuracy of SGA Nutritional Assessment Tool in Prediction of Malnutrition and Cachexia in Radiotherapy-Treated Head and Neck Cancer Patients. Cancers, 10(9), 294. https://doi.org/10.3390/cancers10090294