
Qualitative and Quantitative Detection of Botulinum Neurotoxins from Complex Matrices: Results of the First International Proficiency Test


Abstract
:
1. Introduction
- (i)
- The high variability of BoNTs. The group of BoNTs can be distinguished into seven confirmed serotypes, A through G. While serotypes A, B, E, and F cause botulism in humans, serotypes C and D have been attributed to veterinary botulism [3]. The last decade has shown that there is a previously unrecognized variability among BoNT molecules: the serotypes A, B, E, and F can be distinguished into more than 40 subtypes based on their amino acid sequence, antibody binding and functional activity. Depending on the serotype, the sequence variability among subtypes can reach 36% on amino acid level [4,5,6,7,8,9,10,11]. Additionally, mosaic toxins have been described [12,13,14].
- (ii)
- Complex formation of BoNTs. In acidic bacterial supernatants the neurotoxins are not found as pure 150 kDa di-chain toxins, but are associated with non-toxic non-hemagglutinin (NTNHA), and additionally—depending on serotype and subtype—with up to three different hemagglutinins (HA17, HA33 and HA70) constituting different high molecular weight progenitor toxin complexes (PTCs): M-PTC is composed of BoNT plus a corresponding NTNHA forming an interlocked complex of 290 kDa [15] and is produced by all strains. The L-PTC consisting of BoNT, NTNHA, HA70, HA17, and HA33 at a stoichiometry of 1:1:3:3:6 resulting in a 760 kDa molecule [16,17] is found in strains producing serotypes A, B, C, D and G. While the exact mechanism of BoNT uptake is currently under investigation, it has already been shown that the complex proteins play a role in stabilizing the toxin during the passage through the gastrointestinal tract (NTNHA) and in the adsorption process at intestinal epithelia (HA proteins) [15,18,19,20,21]. On the genetic level, the genes encoding for BoNT and the different complex proteins are arranged in a bicistronic gene cluster comprising an ntnha-bont operon and an ha operon (ha+orfX– cluster; [4]). Apart from this cluster, a second gene cluster is observed, where the genes encoding HA are replaced by three genes encoding OrfX proteins of yet unknown expression and function (ha–orfX+ cluster [4,19]).
- (iii)
- The exquisite toxicity of BoNTs. The BoNTs constitute the most poisonous toxins known today. Lethal amounts of crystalline BoNT/A L-PTC in humans are estimated from primate studies to be 1 μg/kg body weight when taken orally, 10 ng/kg by inhalation and 1 ng/kg intravenously or intramuscularly [22].
- (iv)
- The highly specific mechanism of intoxication. After oral uptake, BoNTs reach the neuromuscular junction of cholinergic neurons. As members of the family of A–B protein toxins the BoNT molecules consist of a 100 kDa B-domain called heavy chain (HC) and an enzymatically active 50 kDa A-domain called light chain (LC) which are covalently linked by a disulfide bridge [23]. The HC confers receptor binding and cellular uptake, while the LC acts as zinc-dependent metalloprotease that specifically cleaves proteins of the soluble N-ethylmaleimide-sensitive factor attachment protein receptor (SNARE) complex which mediates the release of acetylcholine from synaptic vesicles. The SNARE complex is formed by the assembly of the proteins synaptosome-associated protein of 25 kDa (SNAP-25), syntaxin and vesicle-associated membrane protein (VAMP)/synaptobrevin [24]. While BoNT/A, C and E cleave at different sites of SNAP-25, BoNT/C also targets syntaxin. BoNT/B, D, F and G cleave at distinct sites of VAMP. After cleavage of any of the above-mentioned SNARE proteins, the formation of the SNARE complex is inhibited, resulting in the blockage of neurotransmitter release. This leads to the classical paralytic symptoms of botulism [25,26].
2. Results and Discussion
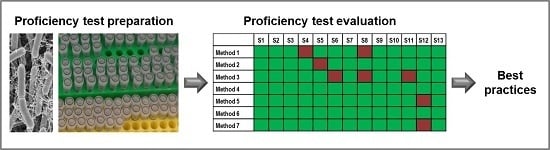
2.1. Preparation of the BoNT Proficiency Test
- (i)
- The samples were planned to comprise the most important BoNT serotypes pathogenic to humans, i.e., BoNT/A, BoNT/B and BoNT/E, to test the laboratories’ ability to detect and to differentiate the different neurotoxins (serotyping). BoNT/F was not considered further as PT material in this very first PT due to the rareness of natural BoNT/F cases and concerns regarding the stability of recombinant BoNT/F material. From all the different subtypes of serotypes described so far, subtypes BoNT/A1, BoNT/B1 and BoNT/E1 were chosen as representative subtypes and used in this study (abbreviated BoNT/A, B and E throughout this manuscript). Additionally, the 150 kDa neurotoxins as smallest, but fully functional and well defined entity representing the causative agent of botulism were used in this first PT. The purity of activated recombinant BoNT/A, BoNT/B and BoNT/E was determined to be ≥99% for BoNT/A, ≥96% for BoNT/B and ≥93% for BoNT/E, respectively (for details see [59]). To test for serotyping capabilities, BoNT/A, BoNT/B and BoNT/E were included as samples in the PT at an intermediate concentration (10 ng/mL) in 0.1% BSA/PBS (Table 1).
- (ii)
- The samples needed to be detectable with a range of different techniques, as the PT was open with respect to the methods applied by the participants. The expectation of a technically open PT was to obtain information on best analytical practices. To this end, four different concentrations of purified BoNT/A spiked into buffer containing a stabilizing protein (BSA) were selected: a very high (1000 ng/mL), a high (100 ng/mL), an intermediate (10 ng/mL) and a moderate (0.5 ng/mL) concentration of recombinantly expressed, highly purified BoNT/A in 0.1% BSA/PBS (Table 1).
- (iii)
- In order to analyze the influence of complex matrices on the detection of BoNT, the intermediate concentration of BoNT/A (10 ng/mL) was spiked into human serum, semi-skimmed milk and a particle-free, sterile extract of minced meat. Both food matrices (semi-skimmed milk and meat extract) were also spiked with the high concentration (100 ng/mL) of BoNT/A, assuming that in food poisoning the toxin concentration would be higher.
- (iv)
- Finally, a complex sample was set up comprising both BoNT/A and BoNT/B at equal concentrations (5 ng/mL each) in 0.1% BSA/PBS. This sample mimicked naturally occurring C. botulinum strains that produce two or three different BoNTs [62].

| Samples Selected as Potential PT Samples for Further Stability Testing | PT Sample Number | |
|---|---|---|
| 1 | 1000 ng/mL of BoNT/A in 0.1% BSA/PBS | S12 |
| 2 | 100 ng/mL of BoNT/A in 0.1% BSA/PBS | S7 |
| 3 | 10 ng/mL of BoNT/A in 0.1% BSA/PBS | S2 |
| 4 | 0.5 ng/mL of BoNT/A in 0.1% BSA/PBS | S9 |
| 5 | 100 ng/mL of BoNT/A in semi-skimmed milk | S13 |
| 6 | 10 ng/mL of BoNT/A in semi-skimmed milk | S10 |
| 7 | 100 ng/mL of BoNT/A in meat extract | S5 |
| 8 | 10 ng/mL of BoNT/A in meat extract | S1 |
| 9 | 10 ng/mL of BoNT/A in human serum | S11 |
| 10 | 5 ng/mL of BoNT/A and 5 ng/mL of BoNT/B in 0.1% BSA/PBS | S8 |
| 11 | 10 ng/mL of BoNT/B in 0.1% BSA/PBS | S6 |
| 12 | 10 ng/mL of BoNT/E in 0.1% BSA/PBS | S4 |
| 13 | 0.1% BSA/PBS | S3 |

| Sample | Matrix | Serotype/Measurand | c(theoretical) * (ng/mL) | c(nominal) ** (ng/mL) | σ(rob) (ng/mL) | σp (ng/mL) |
|---|---|---|---|---|---|---|
| S1 | Meat extract | BoNT/A | 10 | 10.5 | 1.4 | 2.68 |
| S2 | 0.1% BSA/PBS | BoNT/A | 10 | 9.9 | 1.3 | 2.52 |
| S3 | 0.1% BSA/PBS | – | – | – | – | – |
| S4 | 0.1% BSA/PBS | BoNT/E | 10 | 10.9 | 0.9 | 2.77 |
| S5 | Meat extract | BoNT/A | 100 | 108.0 | 10.0 | 27.60 |
| S6 | 0.1% BSA/PBS | BoNT/B | 10 | 9.0 | 0.9 | 2.29 |
| S7 | 0.1% BSA/PBS | BoNT/A | 100 | 100.0 | 9.0 | 25.50 |
| S8/A | 0.1% BSA/PBS | BoNT/A | 5 | 4.7 | 0.3 | 1.21 |
| S8/B | 0.1% BSA/PBS | BoNT/B | 5 | 4.5 | 0.5 | 1.15 |
| S9 | 0.1% BSA/PBS | BoNT/A | 0.5 | 0.5 | 0.1 | 0.13 |
| S10 | Milk | BoNT/A | 10 | 10.3 | 0.8 | 2.64 |
| S11 | Serum | BoNT/A | 10 | 9.8 | 0.3 | 2.51 |
| S12 | 0.1% BSA/PBS | BoNT/A | 1000 | 1001.0 | 69.0 | 255.00 |
| S13 | Milk | BoNT/A | 100 | 112.0 | 13.0 | 28.50 |
2.2. Results of the BoNT Proficiency Test
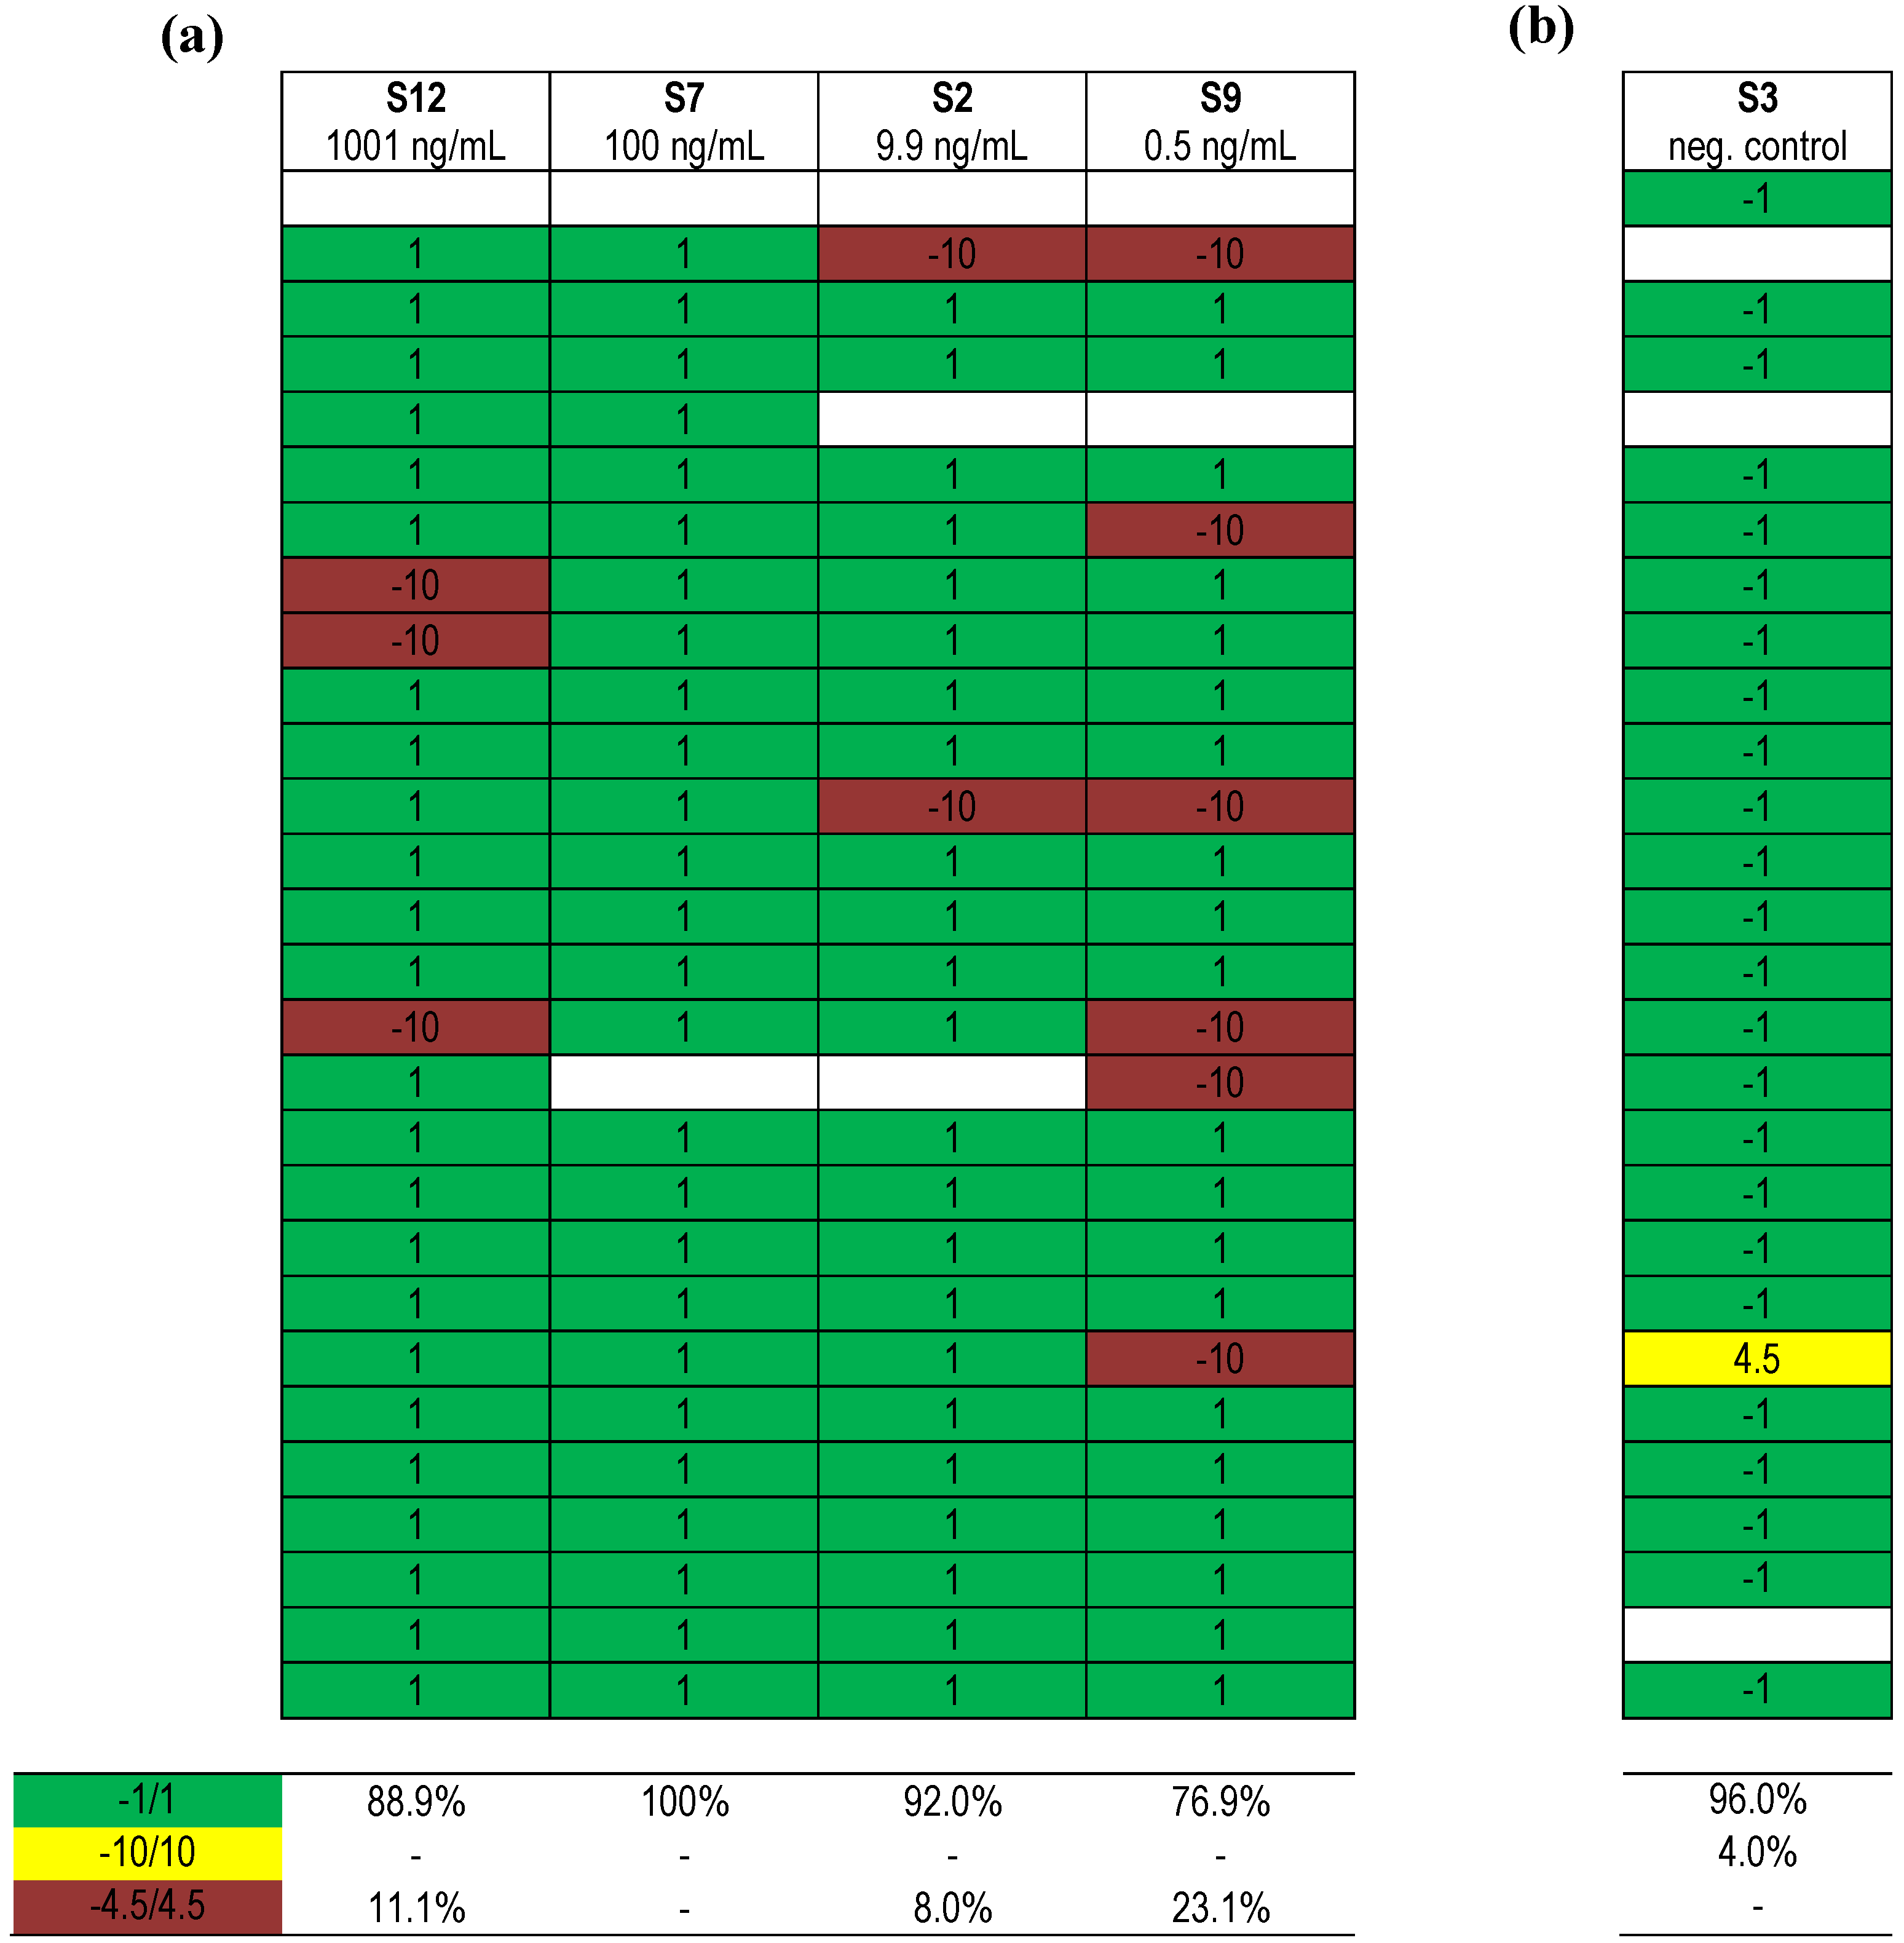
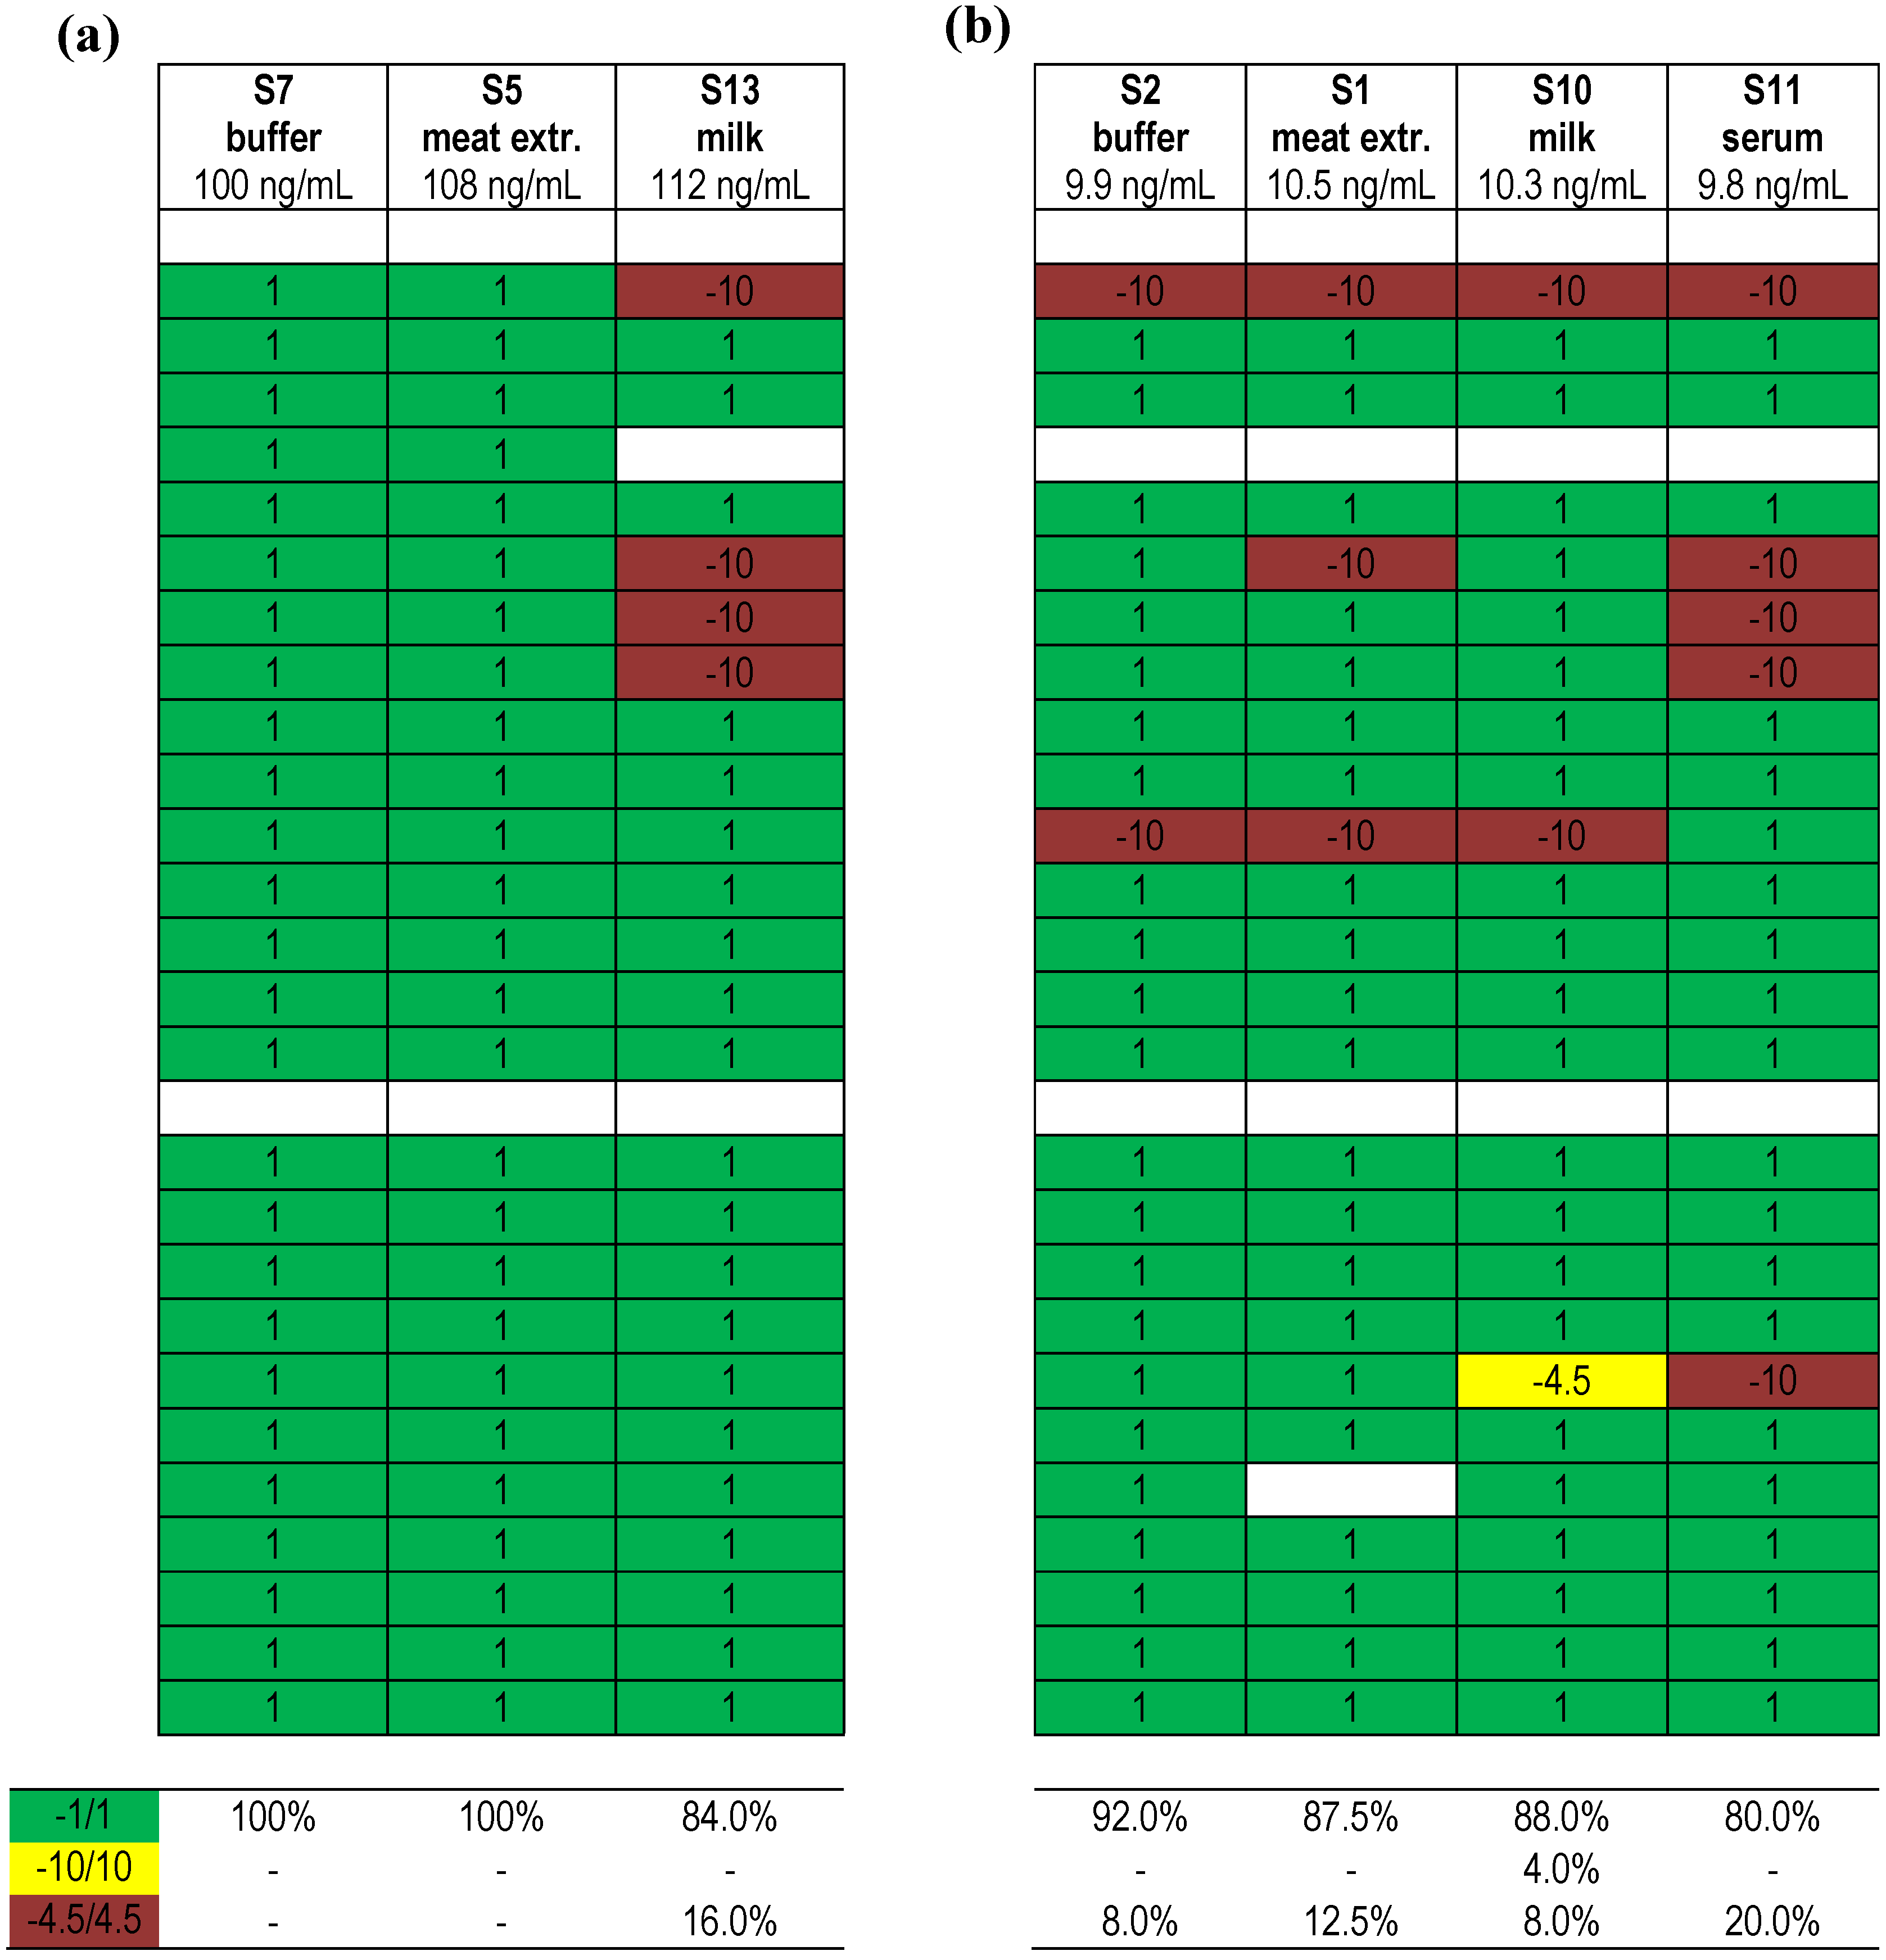
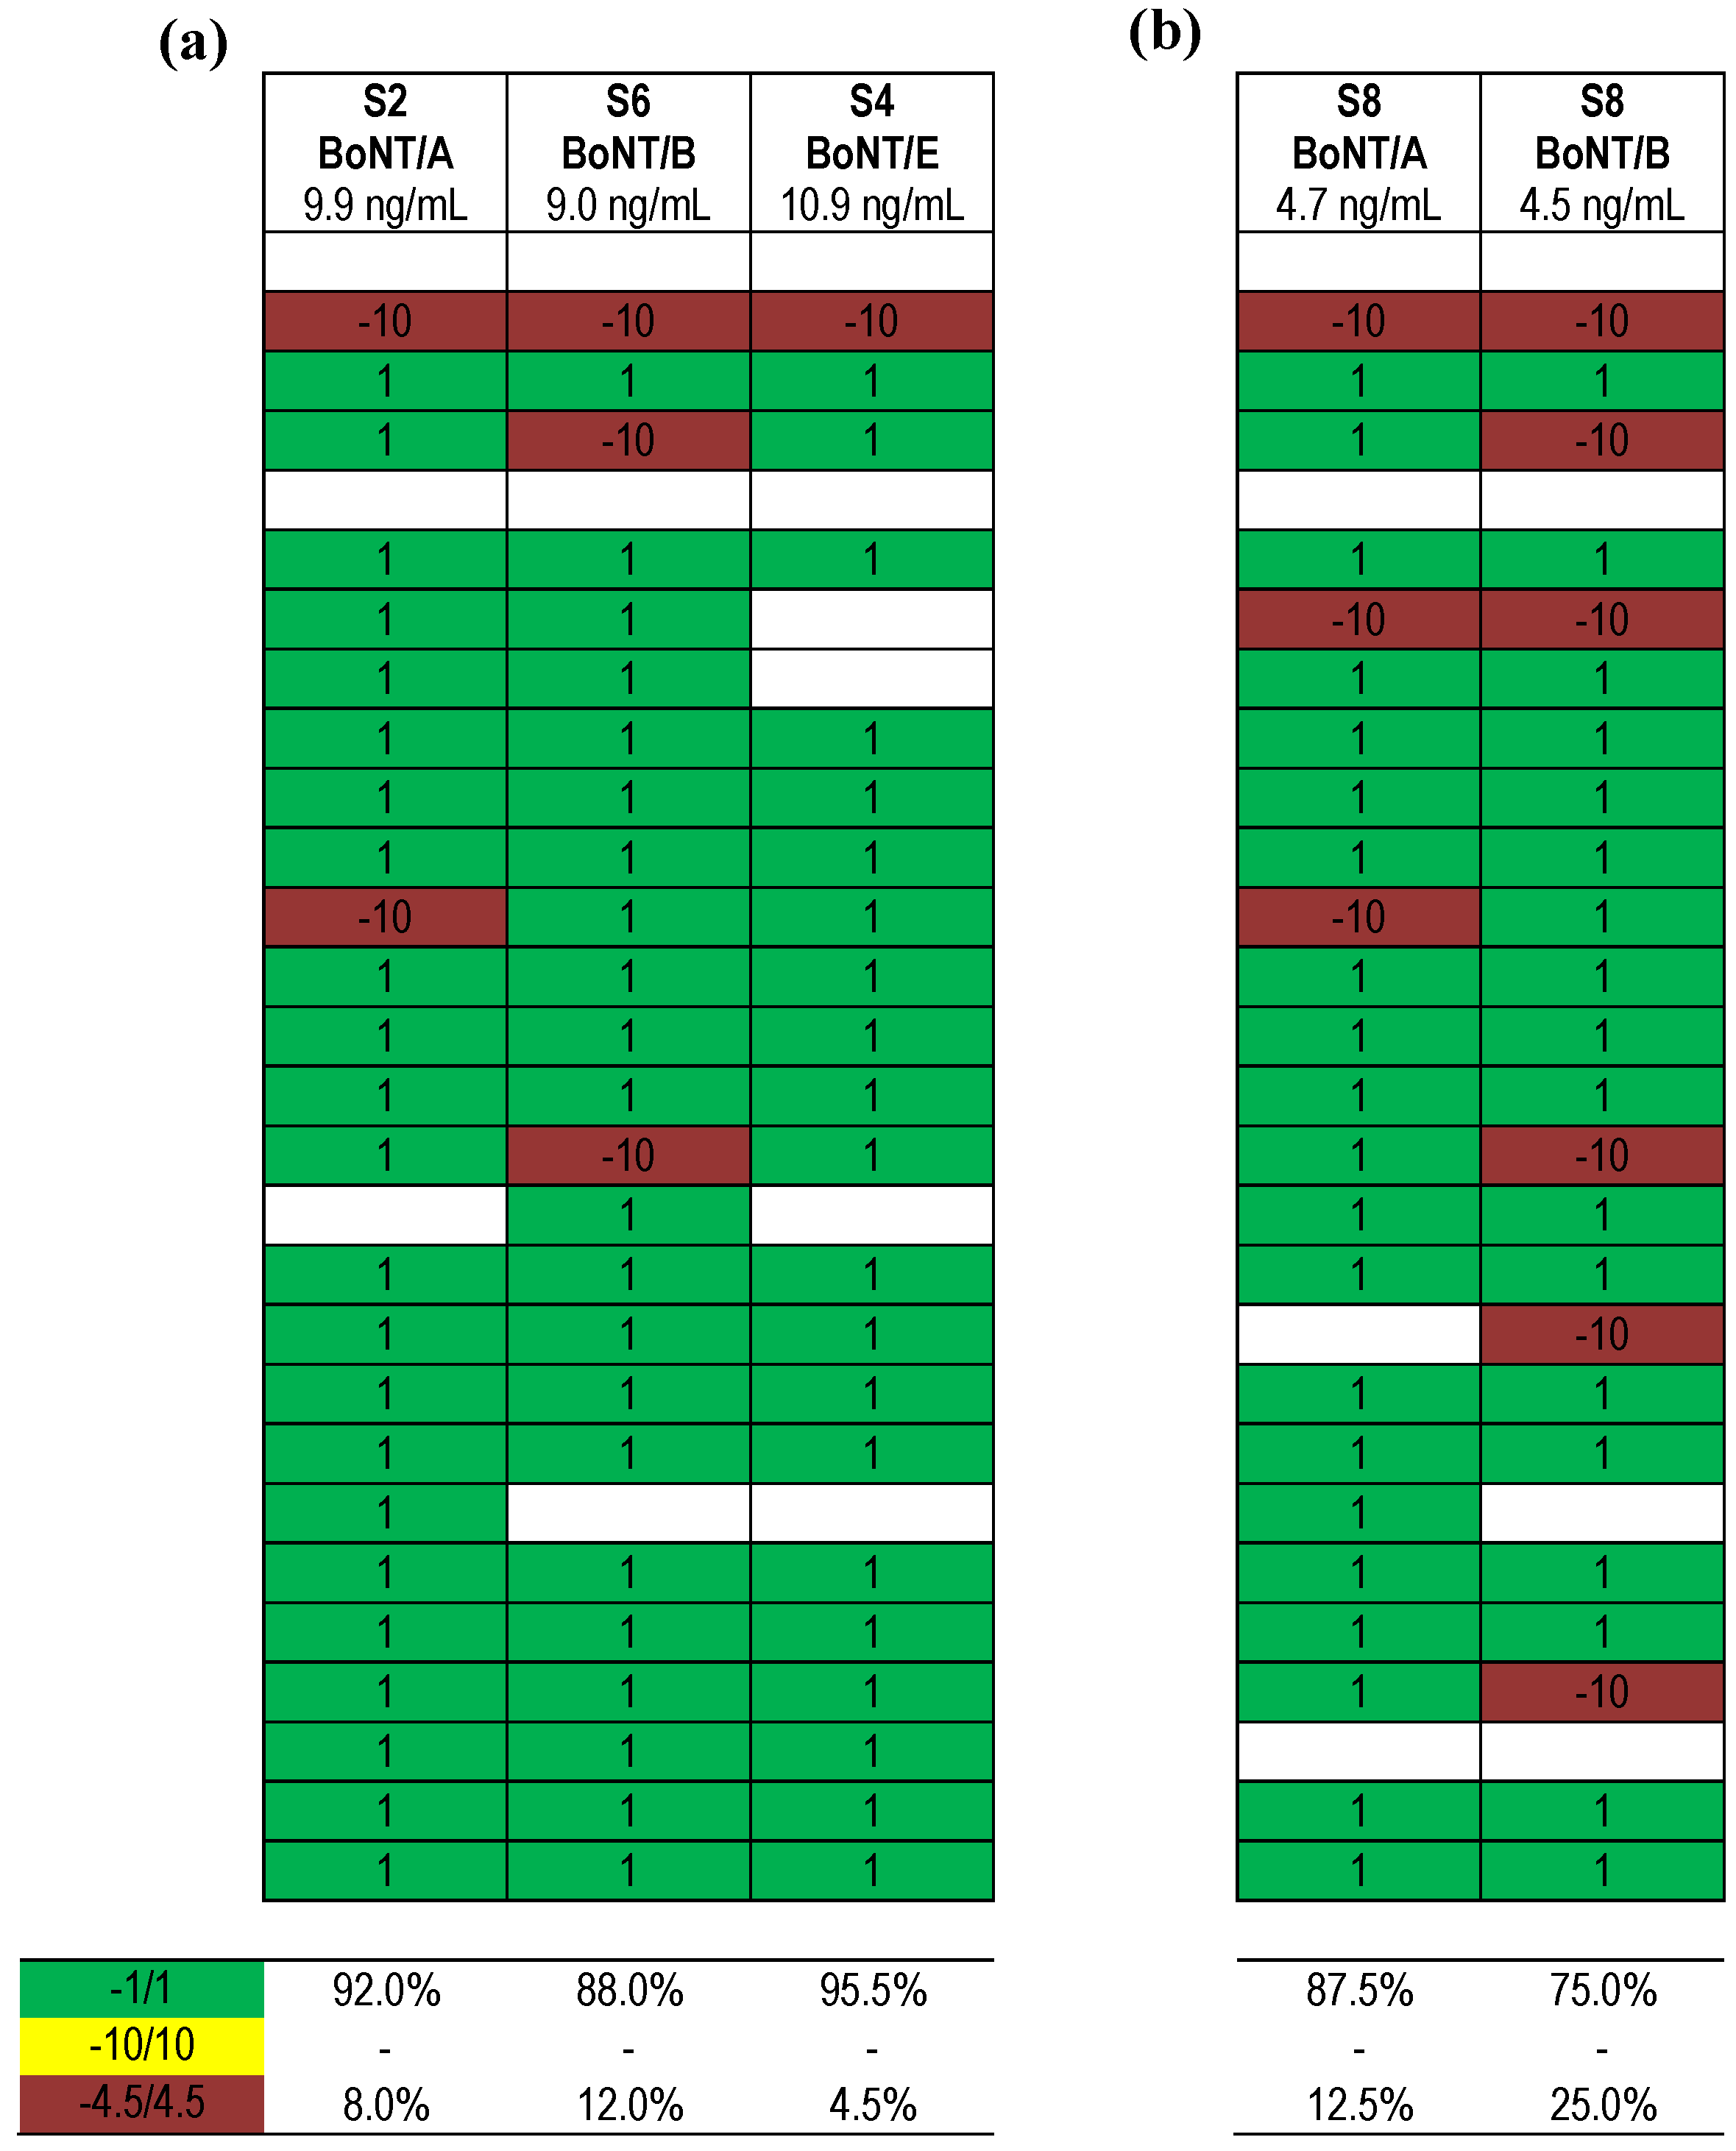
2.2.1. Qualitative Results of the BoNT Proficiency Test
| (1) | correct positive (1), correct negative (−1), with serotyping | |
| (2) | correct positive (1), correct negative (−1), without serotyping | |
| (3) | false positive (10), false negative (−10) | |
| (4) | one of two reported results false positive (4.5) or false negative (−4.5) | |
| (5) | No response or not analyzed |
- (i)
- based on sample identity comparing results provided for corresponding samples (e.g., comparison of results submitted for a given concentration of BoNT in buffer, milk, meat extract and serum; comparison of results given for different concentrations or different serotypes);
- (ii)
- based on the comparison of different technological approaches (i.e., comparison of different approaches like mouse bioassay, MS-based approaches or different ELISA assays displayed against each other).

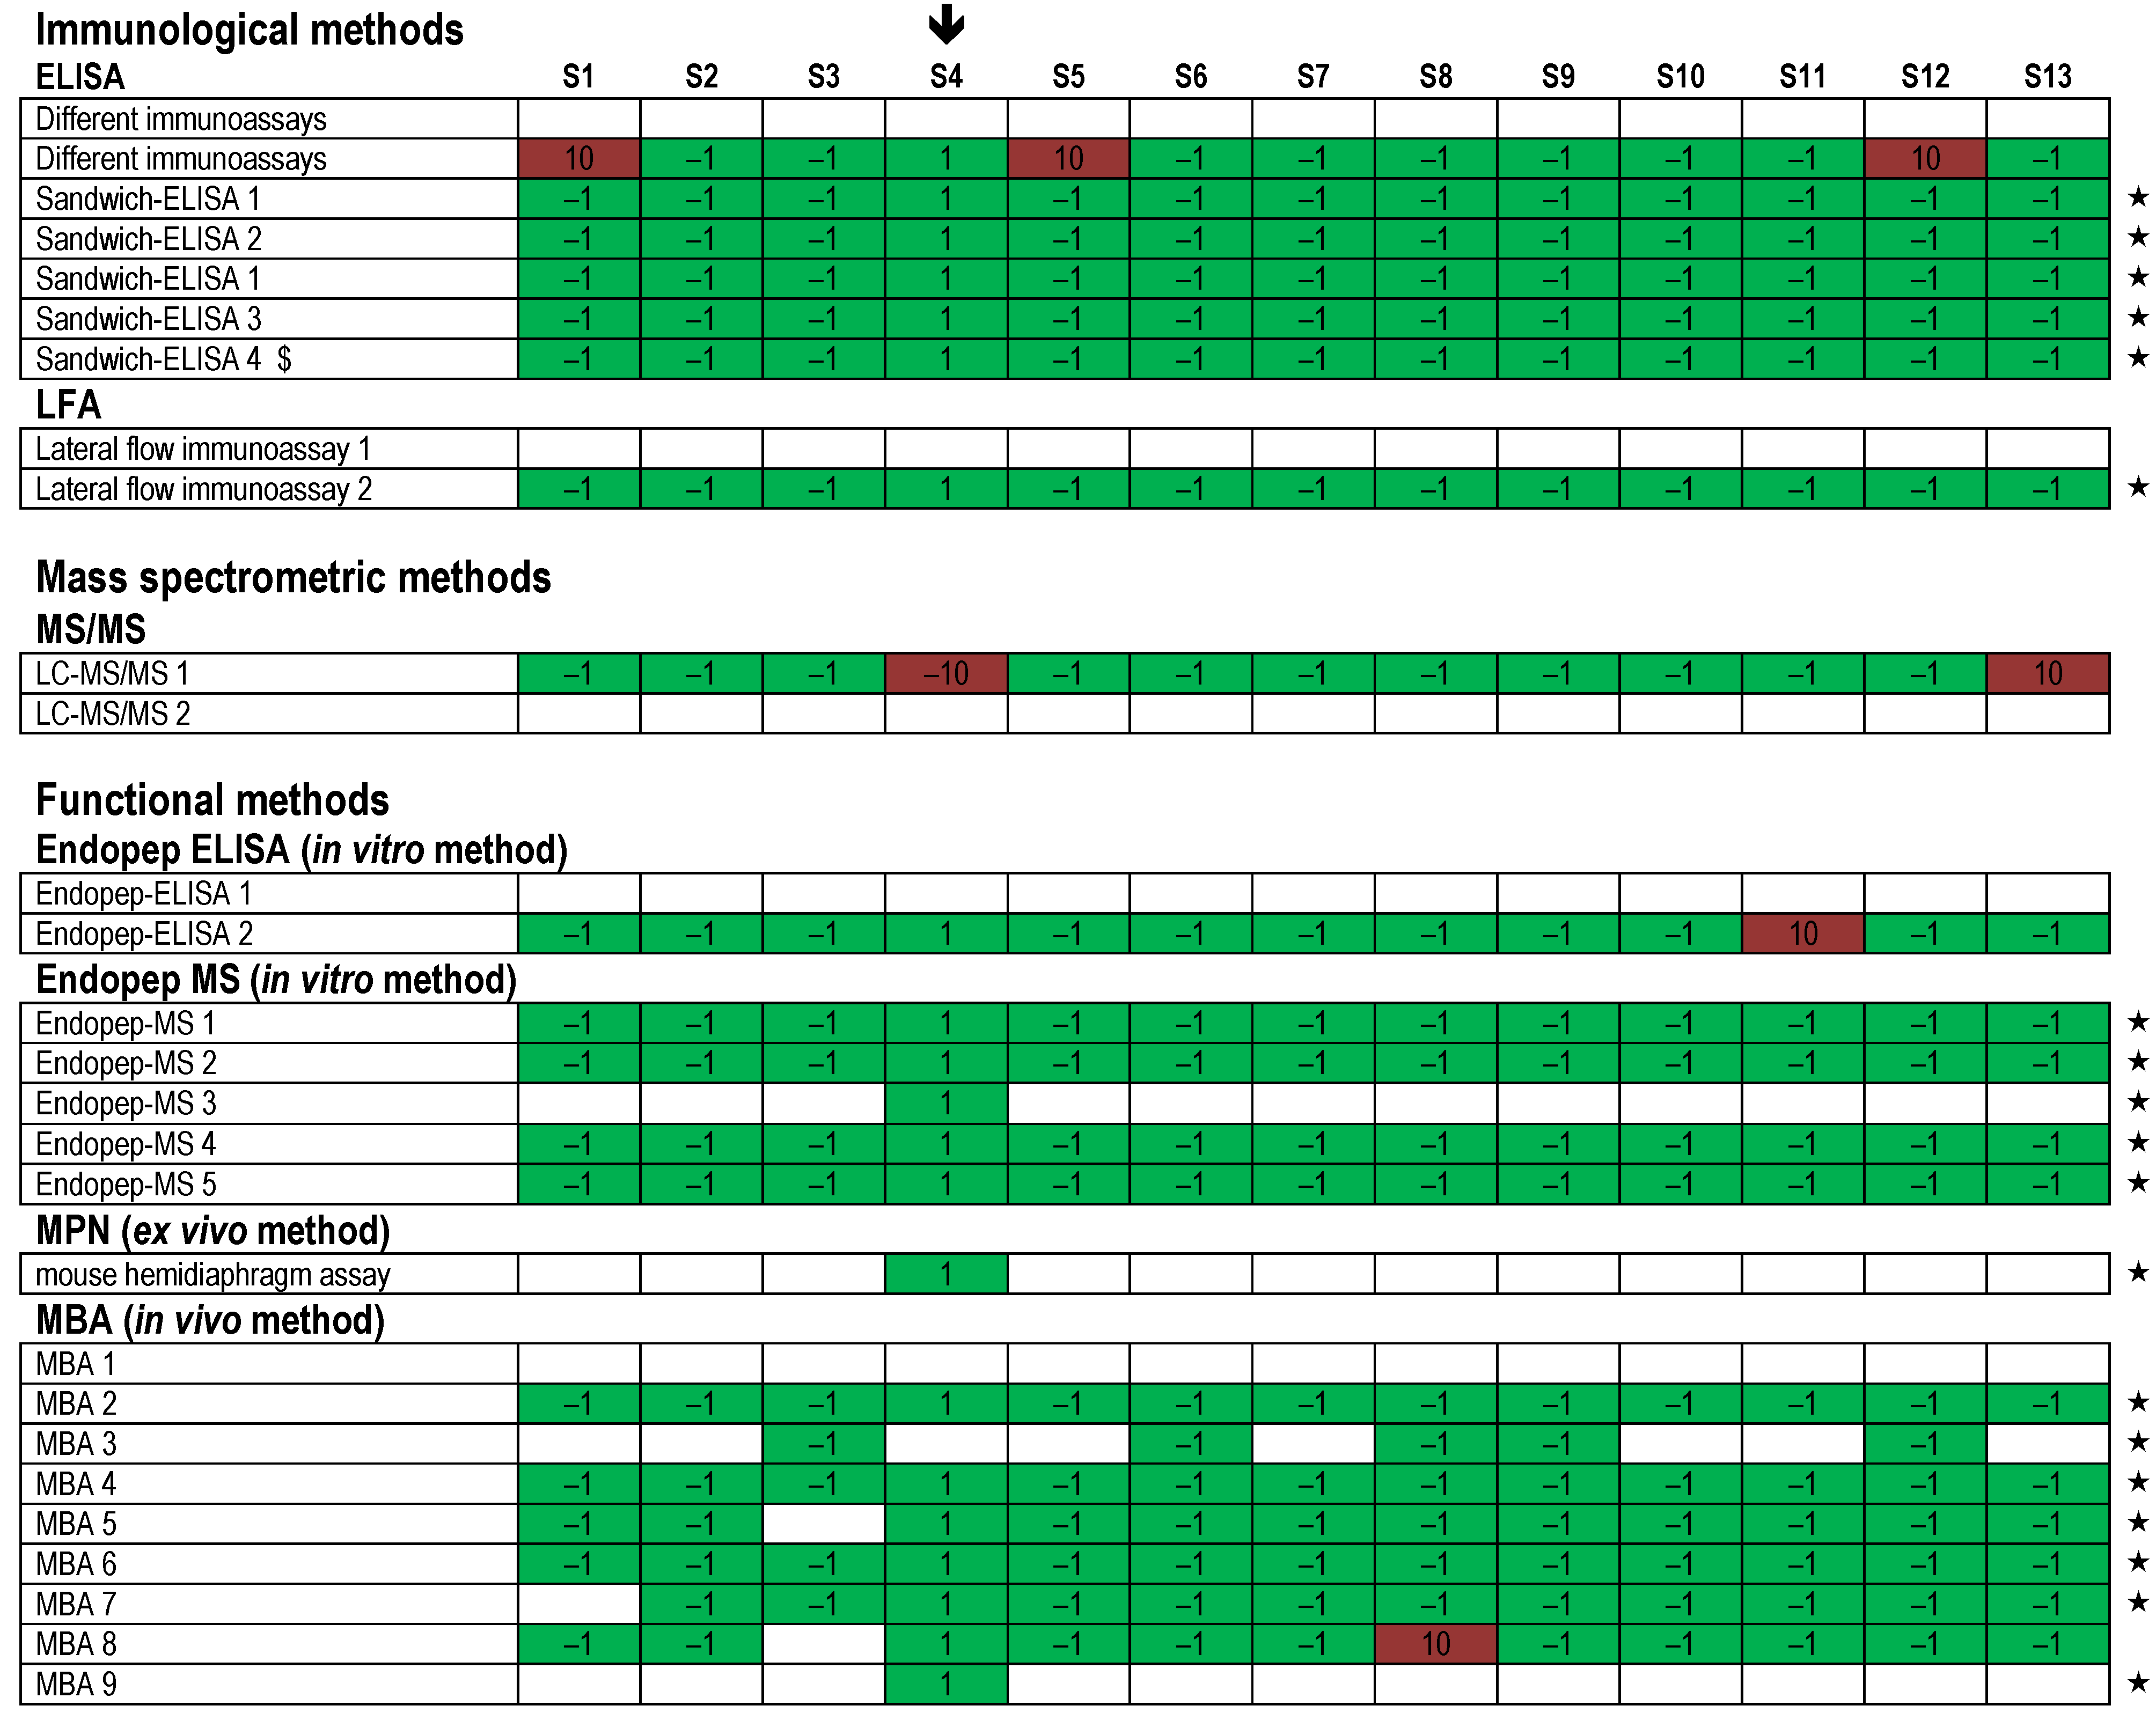
 ). Each row indicates a qualitative result reported after using a particular method; several laboratories reported more than one method. Qualitative results reported by the participants were color-coded as described in Figure 5. Methods marked by an asterisk (★) delivered correct results for the samples analyzed. $, results have been taken from the laboratory’s quantitative reporting since they have, accidentally, not been reported qualitatively.
). Each row indicates a qualitative result reported after using a particular method; several laboratories reported more than one method. Qualitative results reported by the participants were color-coded as described in Figure 5. Methods marked by an asterisk (★) delivered correct results for the samples analyzed. $, results have been taken from the laboratory’s quantitative reporting since they have, accidentally, not been reported qualitatively.
). Each row indicates a qualitative result reported after using a particular method; several laboratories reported more than one method. Qualitative results reported by the participants were color-coded as described in Figure 5. Methods marked by an asterisk (★) delivered correct results for the samples analyzed. $, results have been taken from the laboratory’s quantitative reporting since they have, accidentally, not been reported qualitatively. ). Each row indicates a qualitative result reported after using a particular method; several laboratories reported more than one method. Qualitative results reported by the participants were color-coded as described in Figure 5. Methods marked by an asterisk (★) delivered correct results for the samples analyzed. $, results have been taken from the laboratory’s quantitative reporting since they have, accidentally, not been reported qualitatively.
). Each row indicates a qualitative result reported after using a particular method; several laboratories reported more than one method. Qualitative results reported by the participants were color-coded as described in Figure 5. Methods marked by an asterisk (★) delivered correct results for the samples analyzed. $, results have been taken from the laboratory’s quantitative reporting since they have, accidentally, not been reported qualitatively.
). Each row indicates a qualitative result reported after using a particular method; several laboratories reported more than one method. Qualitative results reported by the participants were color-coded as described in Figure 5. Methods marked by an asterisk (★) delivered correct results for the samples analyzed. $, results have been taken from the laboratory’s quantitative reporting since they have, accidentally, not been reported qualitatively.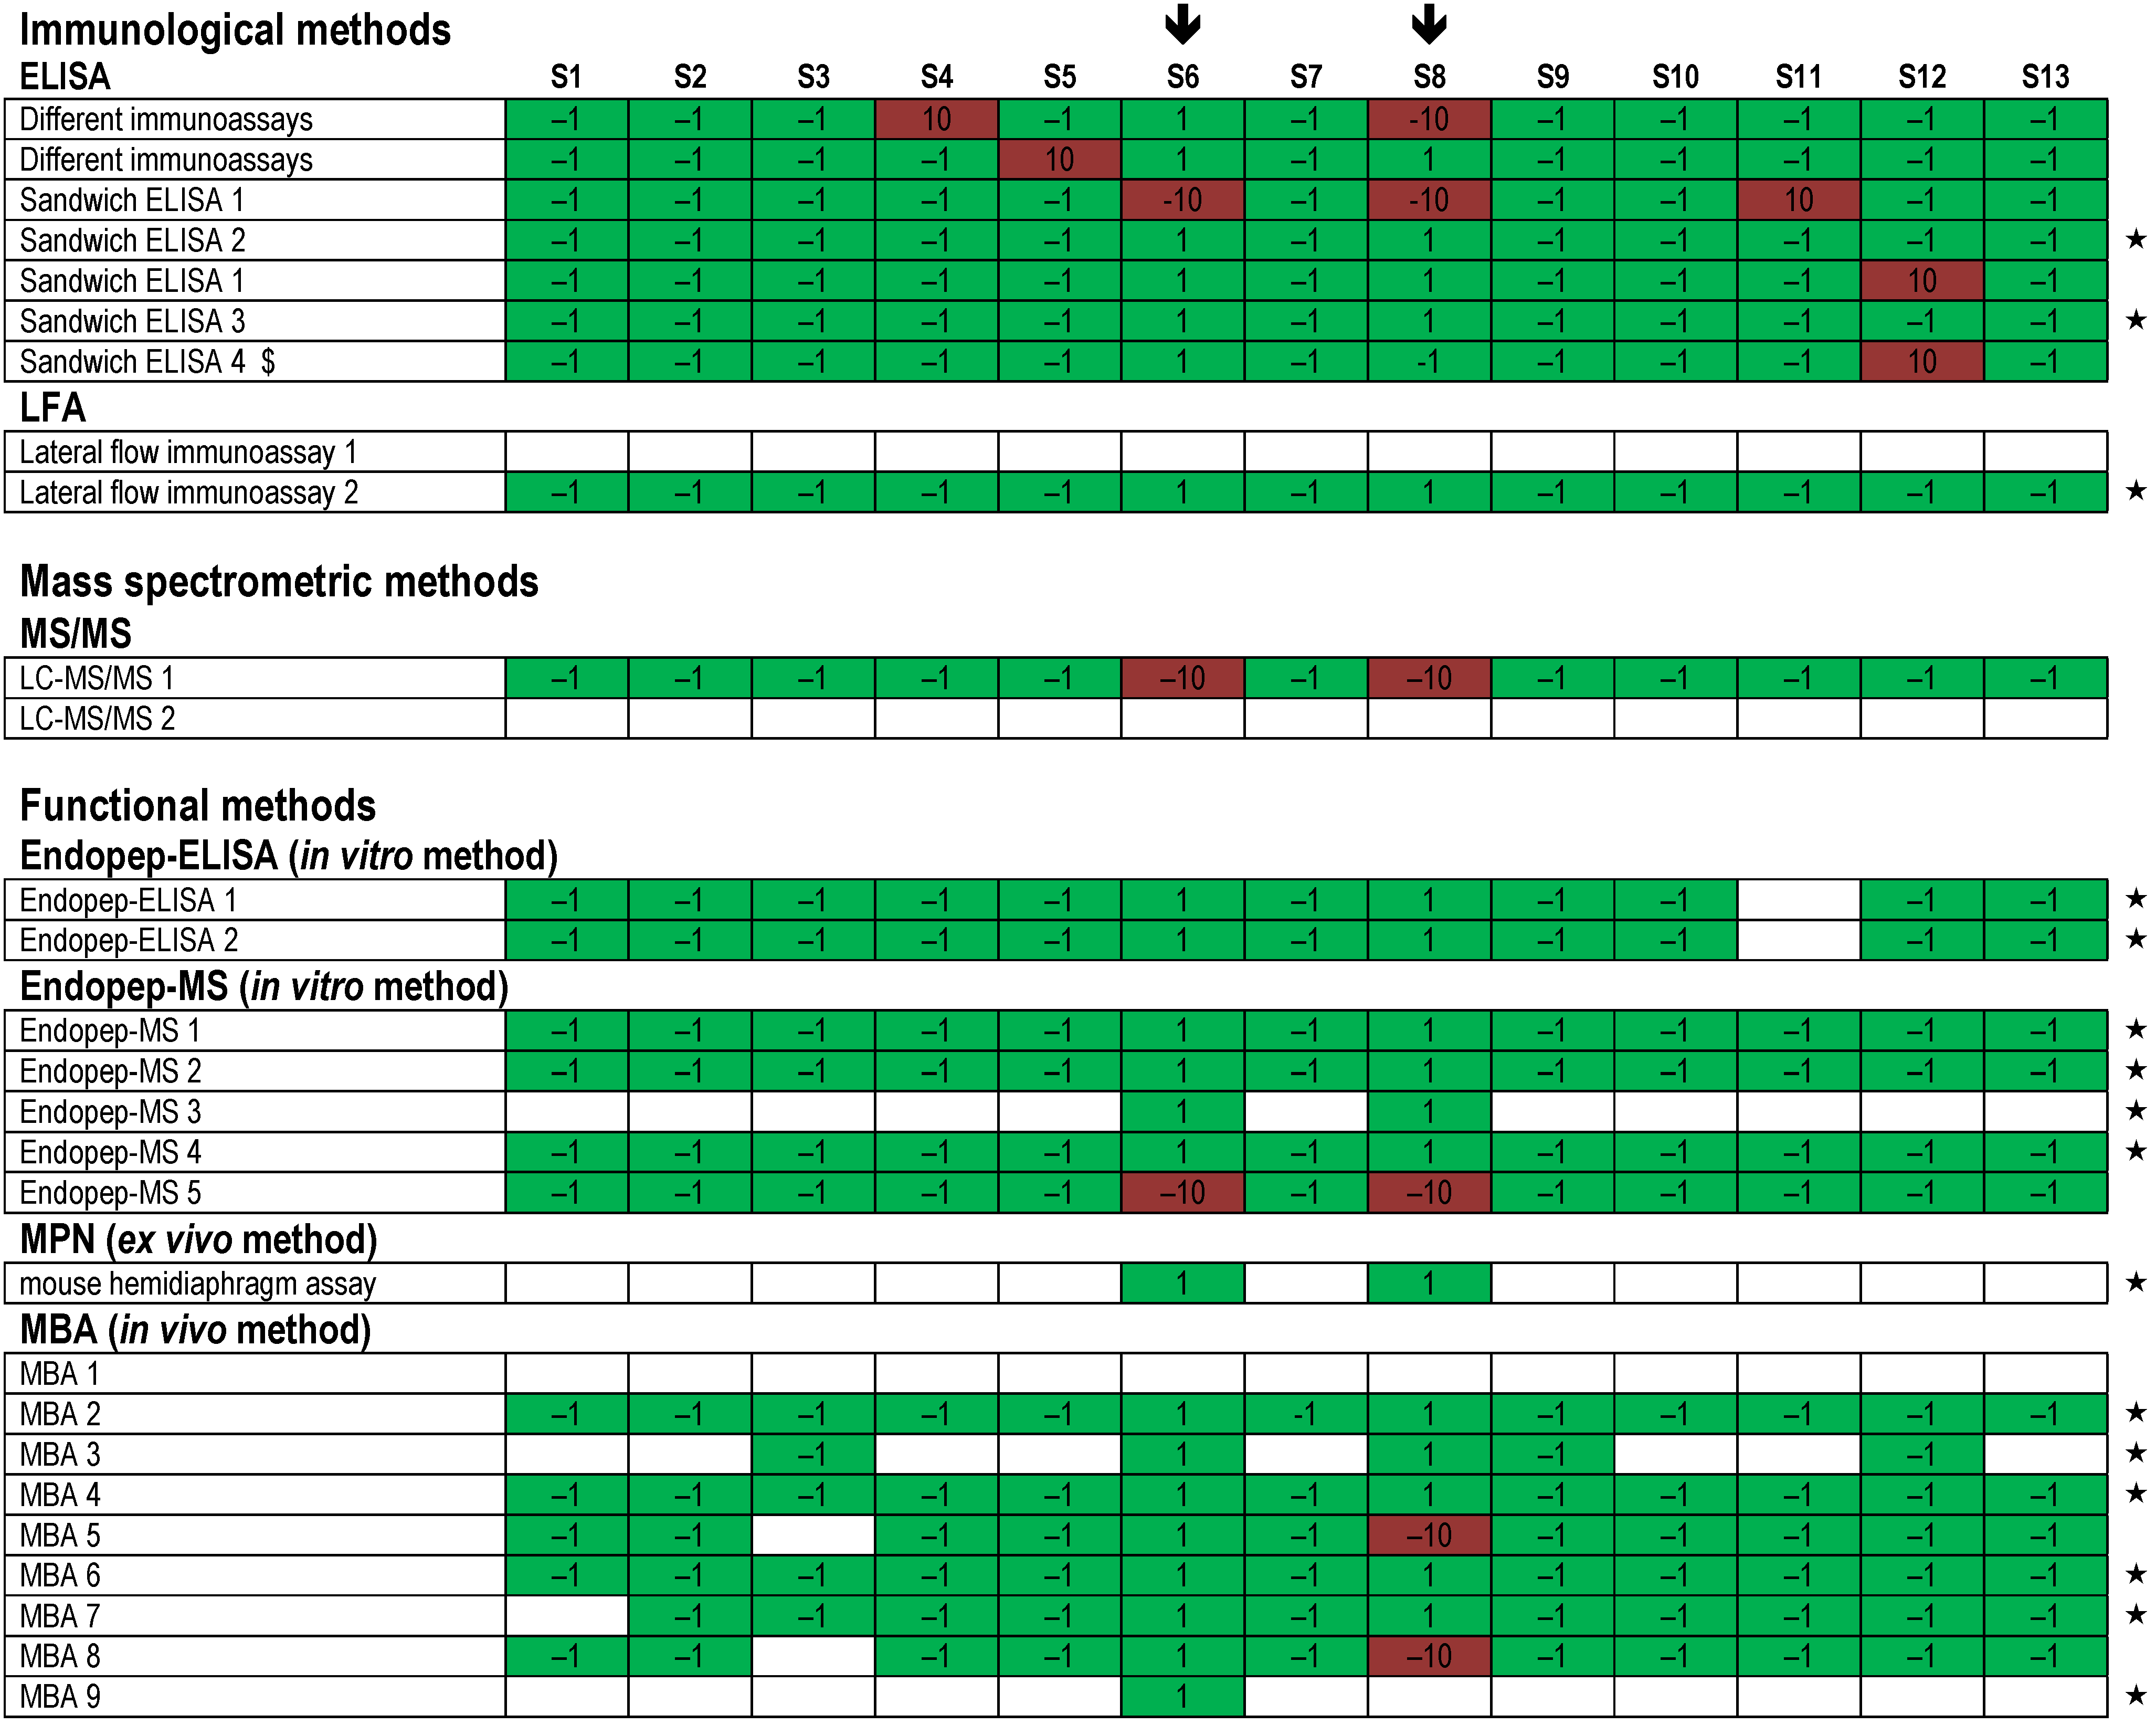 ). Each row indicates a qualitative result reported after using a particular method; several laboratories reported more than one method. Qualitative results reported by the participants were color-coded as described in Figure 5. Methods marked by an asterisk (★) delivered correct results for the samples analyzed. $, results have been taken from the laboratory’s quantitative reporting since they have, accidentally, not been reported qualitatively.
). Each row indicates a qualitative result reported after using a particular method; several laboratories reported more than one method. Qualitative results reported by the participants were color-coded as described in Figure 5. Methods marked by an asterisk (★) delivered correct results for the samples analyzed. $, results have been taken from the laboratory’s quantitative reporting since they have, accidentally, not been reported qualitatively.
). Each row indicates a qualitative result reported after using a particular method; several laboratories reported more than one method. Qualitative results reported by the participants were color-coded as described in Figure 5. Methods marked by an asterisk (★) delivered correct results for the samples analyzed. $, results have been taken from the laboratory’s quantitative reporting since they have, accidentally, not been reported qualitatively.
| Method | Total Number of Results | Number of Laboratories | Correct Results | % | Total % |
|---|---|---|---|---|---|
| ELISA | 312 | 7 | correct positive | 24.4 | 93.3 |
| correct negative | 68.9 | ||||
| LFA | 52 | 2 | correct positive | 38.5 | 90.4 |
| correct negative | 51.9 | ||||
| LC-MS/MS | 55 | 2 | correct positive | 10.9 | 80.0 |
| correct negative | 69.1 | ||||
| Endopep-ELISA | 63 | 2 | correct positive | 34.9 | 93.6 |
| correct negative | 58.7 | ||||
| Endopep-MS | 222 | 5 | correct positive | 27.5 | 97.3 |
| correct negative | 69.8 | ||||
| MPN | 13 | 1 | correct positive | 100.0 | 100.0 |
| correct negative | 0.0 | ||||
| MBA | 330 | 9 | correct positive | 26.1 | 97.6 |
| correct negative | 71.5 |
2.2.2. Quantitative Results of the BoNT Proficiency Test
3. Experimental Section
3.1. Preparation of PT Samples
3.2. Stability and Homogeneity Testing
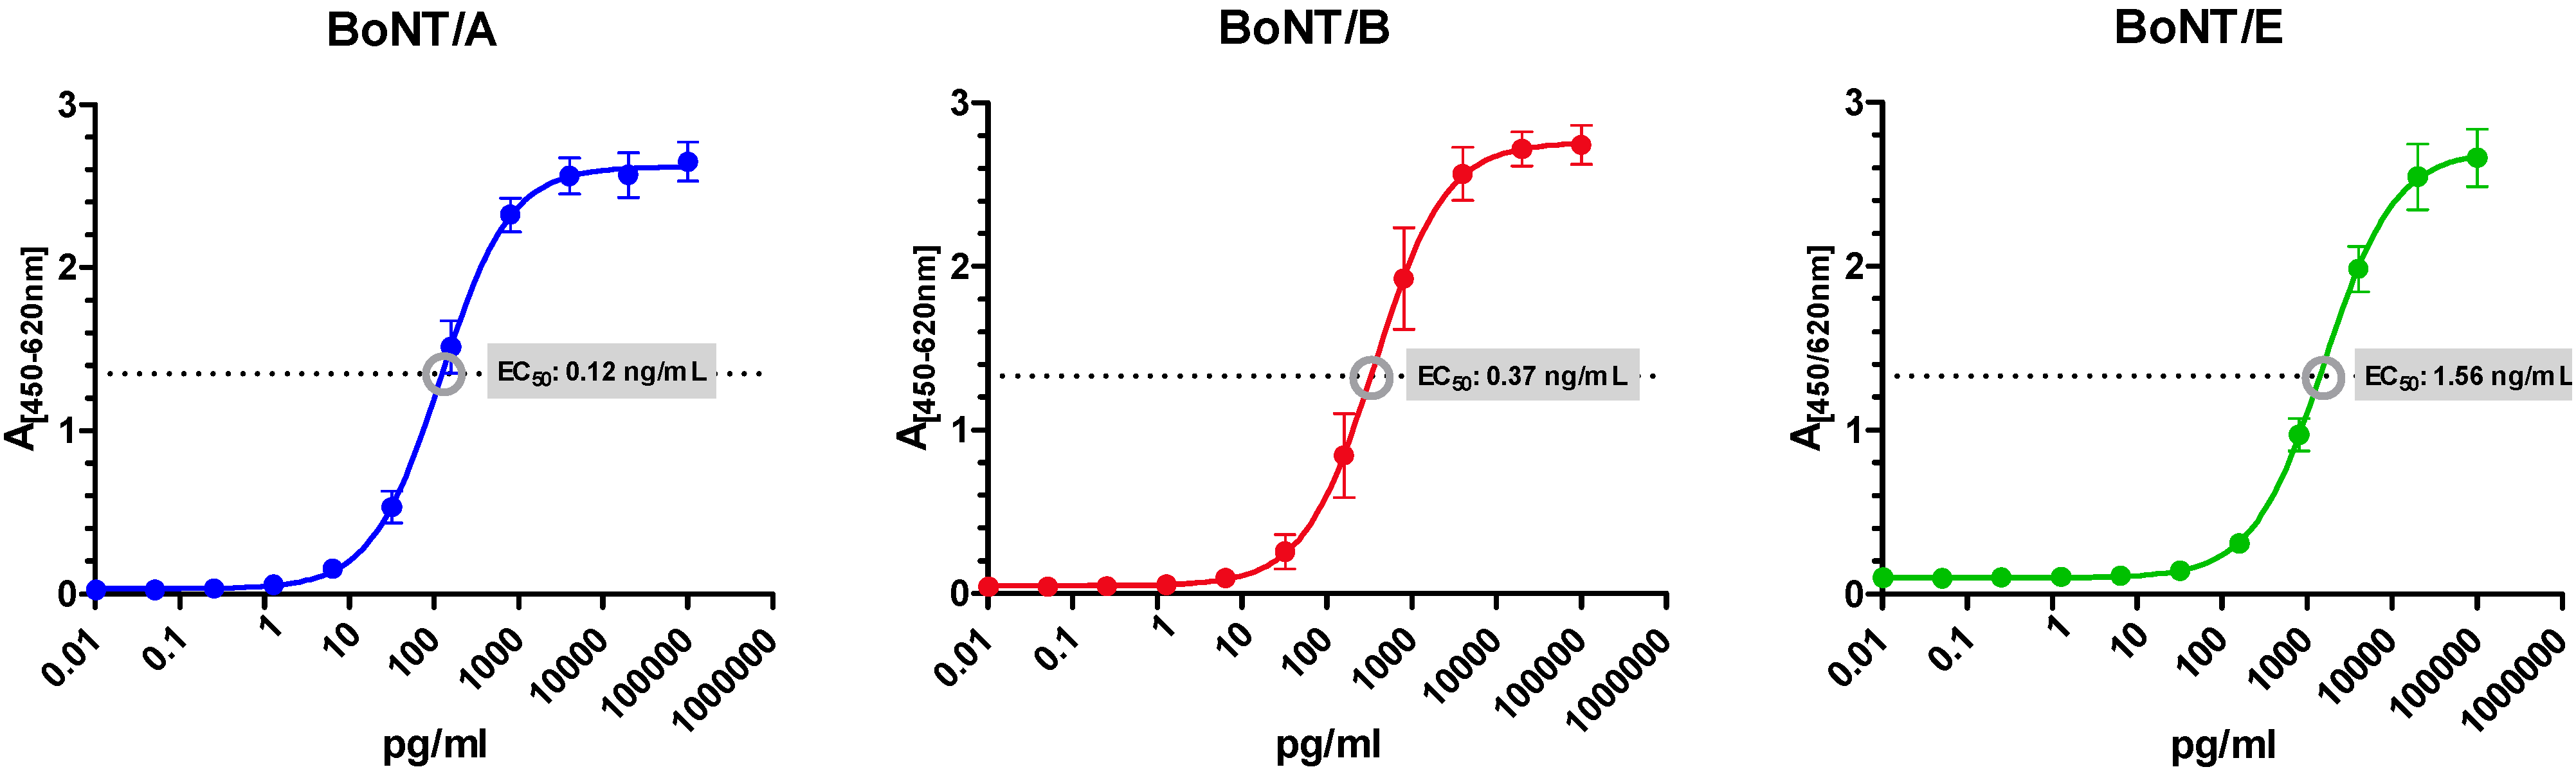
3.3. Amplified Sandwich ELISAs Specific for BoNT/A, B and E
| Antigen | Primary Ab, Name (Specificity) | Description [Ref.] | Secondary Ab, Name (Specificity) | Description [Ref.] |
|---|---|---|---|---|
| BoNT/A | A1688 (HN) | mAb [48,50] | HcA78 (HC) | mAb [82] |
| BoNT/B | B279 (LC) | mAb [48,50] | Botulism antitoxin Behring (LC, HC) | pAb: horse-anti BoNT/A, B, E, F(ab)2 fragments; Novartis, CH |
| BoNT/E | KE97 (LC, HC) | purified pAb from rabbit [65] | E136 (HN) | mAb [65] |
3.4. Statistical Analysis and Data Visualization
4. Conclusions
Acknowledgments
Author Contributions
Conflicts of Interest
References
- Johnson, E.A.; Montecucco, C. Botulism. Handb. Clin. Neurol. 2008, 91, 333–368. [Google Scholar] [PubMed]
- Popoff, M.R.; Bouvet, P. Clostridial toxins. Future Microbiol. 2009, 4, 1021–1064. [Google Scholar] [CrossRef] [PubMed]
- Peck, M.W. Biology and genomic analysis of Clostridium botulinum. Adv. Microb. Physiol. 2009. [Google Scholar] [CrossRef]
- Hill, K.K.; Smith, T.J. Genetic diversity within Clostridium botulinum serotypes, botulinum neurotoxin gene clusters and toxin subtypes. Curr. Top. Microbiol. Immunol. 2013, 364, 1–20. [Google Scholar] [PubMed]
- Kalb, S.R.; Baudys, J.; Rees, J.C.; Smith, T.J.; Smith, L.A.; Helma, C.H.; Hill, K.; Kull, S.; Kirchner, S.; Dorner, M.B.; et al. De novo subtype and strain identification of botulinum neurotoxin type B through toxin proteomics. Anal. Bioanal. Chem. 2012, 403, 215–226. [Google Scholar] [CrossRef] [PubMed]
- Kull, S.; Schulz, K.M.; Strotmeier, J.W.; Kirchner, S.; Schreiber, T.; Bollenbach, A.; Dabrowski, P.W.; Nitsche, A.; Kalb, S.R.; Dorner, M.B.; et al. Isolation and functional characterization of the novel Clostridium botulinum neurotoxin A8 subtype. PLoS ONE 2015. [Google Scholar] [CrossRef] [PubMed]
- Raphael, B.H.; Choudoir, M.J.; Luquez, C.; Fernandez, R.; Maslanka, S.E. Sequence diversity of genes encoding botulinum neurotoxin type F. Appl. Environ. Microbiol. 2010, 76, 4805–4812. [Google Scholar] [CrossRef] [PubMed]
- Raphael, B.H.; Lautenschlager, M.; Kalb, S.R.; de Jong, L.I.; Frace, M.; Lúquez, C.; Barr, J.R.; Fernández, R.A.; Maslanka, S.E. Analysis of a unique Clostridium botulinum strain from the Southern hemisphere producing a novel type E botulinum neurotoxin subtype. BMC Microbiol. 2012. [Google Scholar] [CrossRef] [PubMed]
- Morineaux, V.; Mazuet, C.; Hilaire, D.; Enche, J.; Popoff, M.R. Characterization of botulinum neurotoxin type A subtypes by immunocapture enrichment and liquid chromatography-tandem mass spectrometry. Anal. Bioanal. Chem. 2015, 407, 5559–5570. [Google Scholar] [CrossRef] [PubMed]
- Wangroongsarb, P.; Kohda, T.; Jittaprasartsin, C.; Suthivarakom, K.; Kamthalang, T.; Umeda, K.; Sawanpanyalert, P.; Kozaki, S.; Ikuta, K. Molecular characterization of Clostridium botulinum isolates from foodborne outbreaks in Thailand, 2010. PLoS ONE 2014. [Google Scholar] [CrossRef] [PubMed]
- Umeda, K.; Seto, Y.; Kohda, T.; Mukamoto, M.; Kozaki, S. Genetic characterization of Clostridium botulinum associated with type B infant botulism in Japan. J. Clin. Microbiol. 2009, 47, 2720–2728. [Google Scholar] [CrossRef] [PubMed]
- Moriishi, K.; Koura, M.; Abe, N.; Fujii, N.; Fujinaga, Y.; Inoue, K.; Ogumad, K. Mosaic structures of neurotoxins produced from Clostridium botulinum types C and D organisms. Biochim. Biophys. Acta 1996, 1307, 123–126. [Google Scholar] [CrossRef]
- Maslanka, S.E.; Luquez, C.; Dykes, J.K.; Tepp, W.H.; Pier, C.L.; Pellett, S.; Raphael, B.H.; Kalb, S.R.; Barr, J.R.; Rao, A.; et al. A novel botulinum neurotoxin, previously reported as serotype H, has a hybrid-like structure with regions of similarity to the structures of serotypes A and F and is neutralized with serotype A antitoxin. J. Infect. Dis. 2015. [Google Scholar] [CrossRef] [PubMed]
- Kalb, S.R.; Baudys, J.; Raphael, B.H.; Dykes, J.K.; Luquez, C.; Maslanka, S.E.; Barr, J.R. Functional characterization of botulinum neurotoxin serotype H as a hybrid of known serotypes F and A (BoNT F/A). Anal. Chem. 2015, 87, 3911–3917. [Google Scholar] [CrossRef] [PubMed]
- Gu, S.; Rumpel, S.; Zhou, J.; Strotmeier, J.; Bigalke, H.; Perry, K.; Shoemaker, C.B.; Rummel, A.; Jin, R. Botulinum neurotoxin is shielded by NTNHA in an interlocked complex. Science 2012, 335, 977–981. [Google Scholar] [CrossRef] [PubMed]
- Lee, K.; Gu, S.; Jin, L.; Le, T.T.; Cheng, L.W.; Strotmeier, J.; Kruel, A.M.; Yao, G.; Perry, K.; Rummel, A.; et al. Structure of a bimodular botulinum neurotoxin complex provides insights into its oral toxicity. PLoS Pathog. 2013. [Google Scholar] [CrossRef] [PubMed]
- Benefield, D.A.; Dessain, S.K.; Shine, N.; Ohi, M.D.; Lacy, D.B. Molecular assembly of botulinum neurotoxin progenitor complexes. Proc. Natl. Acad. Sci. USA 2013, 110, 5630–5635. [Google Scholar] [CrossRef] [PubMed]
- Lee, K.; Zhong, X.; Gu, S.; Kruel, A.M.; Dorner, M.B.; Perry, K.; Rummel, A.; Dong, M.; Jin, R. Molecular basis for disruption of E-cadherin adhesion by botulinum neurotoxin A complex. Science 2014, 344, 1405–1410. [Google Scholar] [CrossRef] [PubMed]
- Lam, K.H.; Jin, R. Architecture of the botulinum neurotoxin complex: A molecular machine for protection and delivery. Curr. Opin. Struct. Biol. 2015, 31, 89–95. [Google Scholar] [CrossRef] [PubMed]
- Fujinaga, Y.; Sugawara, Y.; Matsumura, T. Uptake of botulinum neurotoxin in the intestine. Curr. Top. Microbiol. Immunol. 2013, 364, 45–59. [Google Scholar] [PubMed]
- Matsumura, T.; Sugawara, Y.; Yutani, M.; Amatsu, S.; Yagita, H.; Kohda, T.; Fukuoka, S.-I.; Nakamura, Y.; Fukuda, S.; Hase, K.; et al. Botulinum toxin A complex exploits intestinal M cells to enter the host and exert neurotoxicity. Nat. Commun. 2015, 6, 1–10. [Google Scholar] [CrossRef] [PubMed]
- Arnon, S.S.; Schechter, R.; Inglesby, T.V.; Henderson, D.A.; Bartlett, J.G.; Ascher, M.S.; Eitzen, E.; Fine, A.D.; Hauer, J.; Layton, M.; et al. Botulinum toxin as a biological weapon: Medical and public health management. J. Am. Med. Assoc. 2001, 285, 1059–1070. [Google Scholar] [CrossRef]
- Fischer, A.; Montal, M. Crucial role of the disulfide bridge between botulinum neurotoxin light and heavy chains in protease translocation across membranes. J. Biol. Chem. 2007, 282, 29604–29611. [Google Scholar] [CrossRef] [PubMed]
- Südhof, T.C. The molecular machinery of neurotransmitter release (Nobel lecture). Angew. Chem. Int. Ed. Engl. 2014, 53, 12696–12717. [Google Scholar] [CrossRef] [PubMed]
- Pantano, S.; Montecucco, C. The blockade of the neurotransmitter release apparatus by botulinum neurotoxins. Cell. Mol. Life Sci. 2014, 71, 793–811. [Google Scholar] [CrossRef] [PubMed]
- Tighe, A.P.; Schiavo, G. Botulinum neurotoxins: Mechanism of action. Toxicon 2013, 67, 87–93. [Google Scholar] [CrossRef] [PubMed]
- Danzig, R.; Sageman, M.; Leighton, T.; Hough, L.; Yuki, H.; Kotani, R.; Hosford, Z.M. Aum Shinrikyo: Insights into How Terrorists Develop Biological and Chemical Weapons, 2nd ed.; Center for a New American Security: Washington, DC, USA, 2012; p. 72. [Google Scholar]
- Dembek, Z.F.; Smith, L.A.; Rusnak, J.M. Botulinum toxin. In Medical Aspects of Biological Warfare; Dembek, Z.F., Ed.; The Office of The Surgeon General at TMM Publications: Washington, DC, USA, 2007; pp. 337–353. [Google Scholar]
- Bigalke, H. Botulinum toxin: Application, safety, and limitations. Curr. Top. Microbiol. Immunol. 2013, 364, 307–317. [Google Scholar] [PubMed]
- Carruthers, A.; Kane, M.A.; Flynn, T.C.; Huang, P.; Kim, S.D.; Solish, N.; Kaeuper, G. The convergence of medicine and neurotoxins: A focus on botulinum toxin type A and its application in aesthetic medicine—A global, evidence-based botulinum toxin consensus education initiative: Part I: Botulinum toxin in clinical and cosmetic practice. Dermatol. Surg. 2013, 39, 493–509. [Google Scholar] [CrossRef] [PubMed]
- Dorner, M.B.; Schulz, K.M.; Kull, S.; Dorner, B.G. Complexity of botulinum neurotoxins: Challenges for detection technology. Curr. Top. Microbiol. Immunol. 2013, 364, 219–255. [Google Scholar] [PubMed]
- Pellett, S. Progress in cell based assays for botulinum neurotoxin detection. Curr. Top. Microbiol. Immunol. 2013, 364, 257–285. [Google Scholar] [PubMed]
- Bengtson, I. Direct inoculation test for B. botulinus toxin. Public Health Rep. 1921, 36, 1665–1671. [Google Scholar] [CrossRef]
- Burgen, A.S.V.; Dickens, F.; Zatman, L.J. The action of botulinum toxin on the neuro-muscular junction. J. Physiol. 1949, 109, 10–24. [Google Scholar] [CrossRef] [PubMed]
- Bigalke, B.; Rummel, A. Botulinum neurotoxins: Qualitative and quantitative analysis using the mouse phrenic nerve hemidiaphragm assay (MPN). Toxins 2015, 7. [Google Scholar] [CrossRef]
- Simpson, L.L.; Tapp, J.T. Actions of calcium and magnesium on the rate of onset of botulinum toxin paralysis of the rat diaphragm. Int. J. Neuropharmacol. 1967, 6, 485–492. [Google Scholar] [CrossRef]
- Habermann, E.; Dreyer, F.; Bigalke, H. Tetanus toxin blocks the neuromuscular transmission in vitro like botulinum A toxin. Naunyn Schmiedebergs Arch. Pharmacol. 1980, 311, 33–40. [Google Scholar] [CrossRef] [PubMed]
- Boyer, A.E.; Moura, H.; Woolfitt, A.R.; Kalb, S.R.; McWilliams, L.G.; Pavlopoulos, A.; Schmidt, J.G.; Ashley, D.L.; Barr, J.R. From the mouse to the mass spectrometer: Detection and differentiation of the endoproteinase activities of botulinum neurotoxins A–G by mass spectrometry. Anal. Chem. 2005, 77, 3916–3924. [Google Scholar] [CrossRef] [PubMed]
- Jones, R.G.; Ochiai, M.; Liu, Y.; Ekong, T.; Sesardic, D. Development of improved SNAP25 endopeptidase immuno-assays for botulinum type A and E toxins. J. Immunol. Methods 2008, 329, 92–101. [Google Scholar] [CrossRef] [PubMed]
- Hallis, B.; James, B.A.; Shone, C.C. Development of novel assays for botulinum type A and B neurotoxins based on their endopeptidase activities. J. Clin. Microbiol. 1996, 34, 1934–1938. [Google Scholar] [PubMed]
- Bagramyan, K.; Barash, J.R.; Arnon, S.S.; Kalkum, M. Attomolar detection of botulinum toxin type A in complex biological matrices. PLoS ONE 2008. [Google Scholar] [CrossRef] [PubMed]
- Jones, R.G.A.; Marks, J.D. Use of a new functional dual coating (FDC) assay to measure low toxin levels in serum and food samples following an outbreak of human botulism. J. Med. Microbiol. 2013, 62, 828–835. [Google Scholar] [CrossRef] [PubMed]
- Liu, Y.Y.; Rigsby, P.; Sesardic, D.; Marks, J.D.; Jones, R.G. A functional dual-coated (FDC) microtiter plate method to replace the botulinum toxin LD50 test. Anal. Biochem. 2012, 425, 28–35. [Google Scholar] [CrossRef] [PubMed]
- Evans, E.R.; Skipper, P.J.; Shone, C.C. An assay for botulinum toxin types A, B and F that requires both functional binding and catalytic activities within the neurotoxin. J. Appl. Microbiol. 2009, 107, 1384–1391. [Google Scholar] [CrossRef] [PubMed]
- Fernandez-Salas, E.; Wang, J.; Molina, Y.; Nelson, J.B.; Jacky, B.P.; Aoki, K.R. Botulinum neurotoxin serotype A specific cell-based potency assay to replace the mouse bioassay. PLoS ONE 2012. [Google Scholar] [CrossRef] [PubMed]
- Kiris, E.; Kota, K.P.; Burnett, J.C.; Soloveva, V.; Kane, C.D.; Bavari, S. Recent developments in cell-based assays and stem cell technologies for botulinum neurotoxin research and drug discovery. Expert Rev. Mol. Diagn. 2014, 14, 153–168. [Google Scholar] [CrossRef] [PubMed]
- Cheng, L.W.; Stanker, L.H. Detection of botulinum neurotoxin serotypes A and B using a chemiluminescent versus electrochemiluminescent immunoassay in food and serum. J. Agric. Food Chem. 2013, 61, 755–760. [Google Scholar] [CrossRef] [PubMed]
- Pauly, D.; Kirchner, S.; Stoermann, B.; Schreiber, T.; Kaulfuss, S.; Schade, R.; Zbinden, R.; Avondet, M.A.; Dorner, M.B.; Dorner, B.G. Simultaneous quantification of five bacterial and plant toxins from complex matrices using a multiplexed fluorescent magnetic suspension assay. Analyst 2009, 134, 2028–2039. [Google Scholar] [CrossRef] [PubMed]
- Sharma, S.K.; Ferreira, J.L.; Eblen, B.S.; Whiting, R.C. Detection of type A, B, E, and F Clostridium botulinum neurotoxins in foods by using an amplified enzyme-linked immunosorbent assay with digoxigenin-labeled antibodies. Appl. Environ. Microbiol. 2006, 72, 1231–1238. [Google Scholar] [CrossRef] [PubMed]
- Weingart, O.G.; Schreiber, T.; Mascher, C.; Pauly, D.; Dorner, M.B.; Berger, T.F.H.; Egger, C.; Gessler, F.; Loessner, M.J.; Avondet, M.-A.; et al. The case of botulinum toxin in milk: Experimental data. Appl. Environ. Microbiol. 2010, 76, 3293–3300. [Google Scholar] [CrossRef] [PubMed]
- Jenko, K.L.; Zhang, Y.; Kostenko, Y.; Fan, Y.; Garcia-Rodriguez, C.; Lou, J.; Marks, J.D.; Varnum, S.M. Development of an ELISA microarray assay for the sensitive and simultaneous detection of ten biodefense toxins. Analyst 2014, 139, 5093–5102. [Google Scholar] [CrossRef] [PubMed]
- Koh, C.Y.; Schaff, U.Y.; Piccini, M.E.; Stanker, L.H.; Cheng, L.W.; Ravichandran, E.; Singh, B.R.; Sommer, G.J.; Singh, A.K. Centrifugal microfluidic platform for ultrasensitive detection of botulinum toxin. Anal. Chem. 2015, 87, 922–928. [Google Scholar] [CrossRef] [PubMed]
- Lee, J.; Brennan, M.B.; Wilton, R.; Rowland, C.E.; Rozhkova, E.A.; Forrester, S.; Hannah, D.C.; Carlson, J.; Shevchenko, E.V.; Schabacker, D.S.; et al. Fast, Ratiometric FRET from Quantum Dot Conjugated Stabilized Single Chain Variable Fragments for Quantitative Botulinum Neurotoxin Sensing. Nano Lett. 2015, 15, 7161–7167. [Google Scholar] [CrossRef] [PubMed]
- Lévêque, C.; Ferracci, G.; Maulet, Y.; Mazuet, C.; Popoff, M.; Seagar, M.; El Far, O. Direct biosensor detection of botulinum neurotoxin endopeptidase activity in sera from patients with type A botulism. Biosens. Bioelectron. 2014, 57, 207–212. [Google Scholar] [CrossRef] [PubMed]
- Van Oordt, T.; Stevens, G.B.; Vashist, S.K.; Zengerle, R.; von Stetten, F. Rapid and highly sensitive luciferase reporter assay for the automated detection of botulinum toxin in the centrifugal microfluidic LabDisk platform. RSC Adv. 2013, 3, 22046–22052. [Google Scholar] [CrossRef]
- Sesardic, D.; Leung, T.; Gaines Das, R. Role for standards in assays of botulinum toxins: International collaborative study of three preparations of botulinum type A toxin. Biologicals 2003, 31, 265–276. [Google Scholar] [CrossRef] [PubMed]
- Fenicia, L.; Fach, P.; van Rotterdam, B.J.; Anniballi, F.; Segerman, B.; Auricchio, B.; Delibato, E.; Hamidjaja, R.A.; Wielinga, P.R.; Woudstra, C.; et al. Towards an international standard for detection and typing botulinum neurotoxin-producing Clostridia types A, B, E and F in food, feed and environmental samples: A European ring trial study to evaluate a real-time PCR assay. Int. J. Food Microbiol. 2011, 145, 152–157. [Google Scholar] [CrossRef] [PubMed]
- EQuATox. Available online: http://www.equatox.eu/ (accessed on 30 October 2015).
- Weisemann, J.; Krez, N.; Fiebig, U.; Worbs, S.; Skiba, M.; Dorner, M.B.; Bergström, T.; Muñoz, A.; Zegers, I.; Fikri, Y.; et al. Generation and Characterization of Six Recombinant Botulinum Neurotoxins as Reference Material to Serve in an International Proficiency Test. Toxins 2015, 7. [Google Scholar] [CrossRef]
- Thompson, M.; Ellison, S.L.R.; Wood, R. The International Harmonized Protocol for the proficiency testing of analytical chemistry laboratories (IUPAC Technical Report). Pure Appl. Chem. 2006, 78, 145–196. [Google Scholar] [CrossRef]
- International Organization for Standardization. ISO/IEC 17043 Conformity Assessment—General Requirements for Proficiency Testing; ISO: Geneva, Switzerland, 2010. [Google Scholar]
- Rossetto, O.; Pirazzini, M.; Montecucco, C. Botulinum neurotoxins: Genetic, structural and mechanistic insights. Nat Rev Microbiol 2014, 12, 535–549. [Google Scholar] [CrossRef] [PubMed]
- International Organization for Standardization. ISO 5725-5 Accuracy (Trueness and Precision) of Measurement Methods and Results—Part 5: Alternative Methods for the Determination of the Precision of a Standard Measurement Method; ISO: Geneva, Switzerland, 1998. [Google Scholar]
- Sharma, S.K.; Eblen, B.S.; Bull, R.L.; Burr, D.H.; Whiting, R.C. Evaluation of lateral-flow Clostridium botulinum neurotoxin detection kits for food analysis. Appl. Environ. Microbiol. 2005, 71, 3935–3941. [Google Scholar] [CrossRef] [PubMed]
- Simon, S.; Fiebig, U.; Liu, Y.; Tierney, R.; Dano, J.; Worbs, S.; Schreiber, T.; Nevers, M.-C.; Sesardic, D.; Volland, H.; et al. Recommended immunological strategies to screen for botulinum neurotoxin-containing samples. Toxins 2015, 7. [Google Scholar] [CrossRef]
- Kalb, S.R.; Baudys, J.; Wang, D.; Barr, J.R. Recommended mass spectrometry-based strategies to identify botulinum neurotoxin-containing samples. Toxins 2015, 7, 1765–1778. [Google Scholar] [CrossRef] [PubMed]
- McLellan, K.; Das, R.E.; Ekong, T.A.; Sesardic, D. Therapeutic botulinum type A toxin: Factors affecting potency. Toxicon 1996, 34, 975–985. [Google Scholar] [CrossRef]
- Maslanka, S.E.; Lúquez, C.; Raphael, B.H.; Dykes, J.K.; Joseph, L.A. Utility of botulinum toxin ELISA A, B, E, F kits for clinical laboratory investigations of human botulism. Botulinum J. 2011, 2, 72–92. [Google Scholar] [CrossRef]
- International Organization for Standardization. ISO 17025 General Requirements for the Competence of Testing and Calibration Laboratories; ISO: Geneva, Switzerland, 2005. [Google Scholar]
- Whitemarsh, R.C.; Tepp, W.H.; Bradshaw, M.; Lin, G.; Pier, C.L.; Scherf, J.M.; Johnson, E.A.; Pellett, S. Characterization of botulinum neurotoxin A subtypes 1 through 5 by investigation of activities in mice, in neuronal cell cultures, and in vitro. Infect. Immun. 2013, 81, 3894–3902. [Google Scholar] [CrossRef] [PubMed]
- Whitemarsh, R.C.; Tepp, W.H.; Johnson, E.A.; Pellett, S. Persistence of botulinum neurotoxin A subtypes 1-5 in primary rat spinal cord cells. PLoS ONE 2014. [Google Scholar] [CrossRef] [PubMed]
- Strotmeier, J.; Willjes, G.; Binz, T.; Rummel, A. Human synaptotagmin-II is not a high affinity receptor for botulinum neurotoxin B and G: Increased therapeutic dosage and immunogenicity. FEBS Lett. 2012, 586, 310–313. [Google Scholar] [CrossRef] [PubMed]
- Peng, L.; Adler, M.; Demogines, A.; Borrell, A.; Liu, H.; Tao, L.; Tepp, W.H.; Zhang, S.C.; Johnson, E.A.; Sawyer, S.L.; et al. Widespread sequence variations in VAMP1 across vertebrates suggest a potential selective pressure from botulinum neurotoxins. PLoS Pathog. 2014. [Google Scholar] [CrossRef] [PubMed]
- The European Parliament and The Council of The European Union. Directive 2010/63/EU of The European Parliament and of The Council of 22 September 2010 on the protection of animals used for scientific purposes. In Official Journal of the European Union; The European Parliament and The Council of The European Union: Brussel, Belgium, 2010; Volume L 276, pp. 33–79. [Google Scholar]
- Frevert, J. Pharmaceutical, biological, and clinical properties of botulinum neurotoxin type A products. Drugs R D 2015, 15, 217–218. [Google Scholar] [CrossRef] [PubMed]
- Hill, K.K.; Smith, T.J.; Helma, C.H.; Ticknor, L.O.; Foley, B.T.; Svensson, R.T.; Brown, J.L.; Johnson, E.A.; Smith, L.A.; Okinaka, R.T.; et al. Genetic diversity among botulinum neurotoxin-producing clostridial strains. J. Bacteriol. 2007, 189, 818–832. [Google Scholar] [CrossRef] [PubMed]
- Muñoz, A.; Kral, R.; Schimmel, H. Quantification of protein calibrants by amino acid analysis using isotope dilution mass spectrometry. Anal. Biochem. 2011, 408, 124–131. [Google Scholar] [CrossRef] [PubMed]
- R 3.0.2 Frisbee Sailing, The R Foundation for Statistical Computing: Vienna, Austria, 2013.
- Komsta, Ł. Outliers: Tests for Outliers—A Collection of Some Tests Commonly Used for Identifying Outliers, R Package Version 0.14; Available online: https://cran.r-project.org/web/packages/outliers/index.html (accessed on 12 Febuary 2014).
- Koller, M. Robustlmm: Robust Linear Mixed Effects Models. R Package, 1.5. Available online: http://CRAN.R-project.org/package=robustlmm (accessed on 12 Febuary 2014).
- Ellison, S.L.R. MetRology: Support for Metrological Applications, R package version 0.9-16; Available online: http://CRAN.R-project.org/package=metRology (accessed on 12 March 2014).
- Stevens, G.B.; Silver, D.A.; Zgaga-Griesz, A.; Bessler, W.G.; Vashist, S.K.; Patel, P.; Achazi, K.; Strotmeier, J.; Worbs, S.; Dorner, M.B.; et al. Bioluminescence assay for the highly sensitive detection of botulinum neurotoxin A activity. Analyst 2013, 138, 6154–6162. [Google Scholar] [CrossRef] [PubMed]
© 2015 by the authors; licensee MDPI, Basel, Switzerland. This article is an open access article distributed under the terms and conditions of the Creative Commons by Attribution (CC-BY) license (http://creativecommons.org/licenses/by/4.0/).
Share and Cite
Worbs, S.; Fiebig, U.; Zeleny, R.; Schimmel, H.; Rummel, A.; Luginbühl, W.; Dorner, B.G. Qualitative and Quantitative Detection of Botulinum Neurotoxins from Complex Matrices: Results of the First International Proficiency Test. Toxins 2015, 7, 4935-4966. https://doi.org/10.3390/toxins7124857
Worbs S, Fiebig U, Zeleny R, Schimmel H, Rummel A, Luginbühl W, Dorner BG. Qualitative and Quantitative Detection of Botulinum Neurotoxins from Complex Matrices: Results of the First International Proficiency Test. Toxins. 2015; 7(12):4935-4966. https://doi.org/10.3390/toxins7124857
Chicago/Turabian StyleWorbs, Sylvia, Uwe Fiebig, Reinhard Zeleny, Heinz Schimmel, Andreas Rummel, Werner Luginbühl, and Brigitte G. Dorner. 2015. "Qualitative and Quantitative Detection of Botulinum Neurotoxins from Complex Matrices: Results of the First International Proficiency Test" Toxins 7, no. 12: 4935-4966. https://doi.org/10.3390/toxins7124857
APA StyleWorbs, S., Fiebig, U., Zeleny, R., Schimmel, H., Rummel, A., Luginbühl, W., & Dorner, B. G. (2015). Qualitative and Quantitative Detection of Botulinum Neurotoxins from Complex Matrices: Results of the First International Proficiency Test. Toxins, 7(12), 4935-4966. https://doi.org/10.3390/toxins7124857