Mutational Analysis of RIP Type I Dianthin-30 Suggests a Role for Arg24 in Endocytosis


1
Institute of Pharmacy, Freie Universität Berlin, Königin-Luise-Str. 2+4, 14195 Berlin, Germany
2
Institute of Chemistry and Biochemistry, Freie Universität Berlin, Thielallee 63, 14195 Berlin, Germany
*
Author to whom correspondence should be addressed.
Toxins 2024, 16(5), 219; https://doi.org/10.3390/toxins16050219
Submission received: 26 January 2024
/
Revised: 30 April 2024
/
Accepted: 7 May 2024
/
Published: 10 May 2024
(This article belongs to the Special Issue Biological Activities of Ribosome Inactivating Proteins II)
Abstract
:Saponin-mediated endosomal escape is a mechanism that increases the cytotoxicity of type I ribosome-inactivating proteins (type I RIPs). In order to actualize their cytotoxicity, type I RIPs must be released into the cytosol after endocytosis. Without release from the endosomes, type I RIPs are largely degraded and cannot exert their cytotoxic effects. Certain triterpene saponins are able to induce the endosomal escape of these type I RIPs, thus increasing their cytotoxicity. However, the molecular mechanism underlying the endosomal escape enhancement of type I RIPs by triterpene saponins has not been fully elucidated. In this report, we investigate the involvement of the basic amino acid residues of dianthin-30, a type I RIP isolated from the plant Dianthus caryophyllus L., in endosomal escape enhancement using alanine scanning. Therefore, we designed 19 alanine mutants of dianthin-30. Each mutant was combined with SO1861, a triterpene saponin isolated from the roots of Saponaria officinalis L., and subjected to a cytotoxicity screening in Neuro-2A cells. Cytotoxic screening revealed that dianthin-30 mutants with lysine substitutions did not impair the endosomal escape enhancement. There was one particular mutant dianthin, Arg24Ala, that exhibited significantly reduced synergistic cytotoxicity in three mammalian cell lines. However, this reduction was not based on an altered interaction with SO1861. It was, rather, due to the impaired endocytosis of dianthin Arg24Ala into the cells.
Keywords:
ribosome-inactivating proteins; type I RIP; N-glycosylase; triterpene saponins; endosomal escape enhancer; basic amino acid residues; endocytosisKey Contribution: The amino acid residue Arg24 contributes significantly to the endocytosis of dianthin-30.
1. Introduction
Ribosome-inactivating proteins (RIPs) are plant toxins that exhibit characteristic N-glycosylase activity (EC 3.2.2.22). RIPs inhibit protein synthesis by releasing a particular adenine residue from 28S ribosomal RNA (at position 4324, related to rats) and thus provoke cell death [1,2]. They are divided into two main types. Type II RIPs are polypeptide proteins with two domains, consisting of an enzymatic A domain that exerts N-glycosylase activity and a B domain. The B domain exhibits lectin-like properties that mediate binding to terminal N-acetylgalactosamine or galactose residues on the cell surface [3]. Therefore, they regulate uptake into the cell. The best-known type II RIP is ricin, a dimeric protein isolated from the seeds of Ricinus communis L. (Euphorbiaceae), whose uptake and transport in the cell has been studied extensively: the ricin B domain, with its lectin-like properties, enables binding to the cell surface and subsequent receptor-mediated endocytosis into the cell [3]. Consequently, dimeric ricin is transported to the endoplasmic reticulum (ER) by retrograde transport via the Golgi apparatus. At the ER, the two domains dissociate by reducing the disulfide bond [4]. The ricin A domain is then translocated to the cytosol, where it is able to exert its characteristic N-glycosylase activity [5,6,7].
Type I RIPs consist of a single peptide chain (A domain) that exerts enzymatic activity in the same manner as type II RIPs. They are differentiated by the absence of a cell-binding B domain [8]. Consequently, type I and type II RIPs are transported through the cell via differing routes [9]. The uptake mechanism of type I RIPs has so far been less extensively characterized [10]. Different endocytosis mechanisms for type I RIPs, like LDL receptor-mediated endocytosis for saporin (a type I RIP isolated from Saponaria officinalis L.), have been described [11,12,13,14]. After endocytosis, type I RIPs accumulate in late endosomes and lysosomes where, for the most part, they are degraded [13,15,16,17]. They escape lysosomal degradation only to a very low degree, resulting in rather low cytotoxicity [9,18,19].
The co-application of triterpene saponins, synthesized in the same plants as type I RIPs, significantly increases the cytotoxicity of type I RIPs, as well as the cytotoxicity of type I RIPs conjugated to antibodies, so-called targeted toxins [17,20,21,22]. SO1861, a bisdesmosidic triterpene saponin isolated from the roots of Saponaria officinalis L., is one of the cytotoxicity-enhancing saponins for type I RIPs [21].
Co-localization studies have revealed that enhanced cytotoxicity is caused by saponin-mediated endosomal escape from late endosomes/lysosomes [16,17,21]. Membrane-permeabilizing effects at applied concentrations could be excluded [23]. Weng et al. and Bachran et al. reported that the acidic pH of late endosomes/lysosomes is mandatory for endosomal escape enhancement [17,24]. In addition, surface plasmon resonance spectroscopy (SPR) has indicated a direct interaction of triterpene saponins and type I RIPs. The PH-dependent binding of SO1861 and SA1641, a saponin isolated from Gypsophila paniculata L., to Hissaporin, a type I RIP from the seeds of Saponaria officinalis L., can be demonstrated by SPR [17,25].
Type I RIPs have high potential in the development of targeted toxin-based anti-cancer therapy. Up to the present, however, not a single drug candidate of this type has been approved by a drug agency [26,27]. On the one hand, there have been major medical issues, including immunogenicity and vascular leak syndrome, reported in clinical studies [28,29,30]. On the other hand, the therapeutical use is limited by restricted endosomal escape, which means that high doses would have to be used to achieve an effect. However, high doses are also associated with clinically adverse effects [26]. Thus, insights into the molecular mechanism underlying saponin-triggered endosomal escape may present a valuable contribution toward bringing to fruition the targeted toxin approach for cancer treatment.
To date, little is known about the molecular interaction mechanism underlying endosomal escape enhancement. This is the first study to characterize the involvement of basic amino acid residues in the endosomal escape enhancement induced by triterpene saponins and in the endocytosis of type I RIPs. Therefore, the type I RIP dianthin-30 (~30 kDa) and the triterpene saponin SO1861 were selected for this study. Dianthin-30, located in different tissues of the plant Dianthus caryophyllus L. (Caryophyllaceae), is a very well-characterized plant protein that exhibits N-glycosylase activity (EC 3.2.2.22) [31,32,33]. The recombinant bacterial expression of dianthin-30 was first realized by Legname et al. [34,35]. The triterpene saponin SO1861, isolated from the roots of Saponaria officinalis L. (Caryophyllaceae), whose complete structure has been identified, has proven to be very efficient in enhancing endosomal escape [21,36].
In the present work, we illustrate that the alanine substitution of single lysine residues, as well as of multiple (up to three) lysine residues, had no effect on the synergistic cytotoxicity of dianthin and SO1861. The alanine substitution of arginine at position 24, however, reduced synergistic cytotoxicity. Experiments were conducted on three cell lines in order to exclude a cell-line-specific effect. By investigating high toxin concentrations without adding SO1861, we could demonstrate that the reduction in synergistic cytotoxicity was not caused by a decreased interaction between dianthin and SO1861. An endocytosis assay revealed that Arg24 contributes to the endocytosis of dianthin.
2. Results
2.1. Expression and Purification of Hisdianthin and Its Mutants
We examined all lysine residues of Hisdianthin (6xHis-tag dianthin-30) except for Lys138, Lys211 and Lys248. Lys138 and Lys211 are present in active sites and involved in enzymatic activity, while Lys248 electrostatically stabilizes the active site [37]. Additionally, Arg24 was included in the mutational analysis, as Di Maro et al. found that arginine at position 24 is highly conserved in type I and type II RIPs by comparing various RIP sequences [38]. To study the role of the basic residues, lysine and arginine were substituted with alanine. Alanine substitution comes along with no hydrogen bonding; no sterical hindrance; or no insertion of a hydrophobic side chain [39]. Consequently, the side chain is replaced without affecting the conformation of the main chain [40]. A total of 19 Hisdianthin mutants were generated: Lys50Ala, Lys92Ala, Lys113Ala, Lys126Ala, Lys129Ala, Lys156Ala, Lys157Ala, Lys162Ala, Lys190Ala, Lys195Ala, Lys201Ala, Lys221Ala, Lys227Ala, Lys235Ala, Lys240Ala, Lys254Ala, Lys50/92Ala, Lys50/92/126Ala and Arg24Ala. While the pET11d vectors containing the Lys195Ala, Lys227Ala and Arg24Ala mutations were created by site-directed mutagenesis (see Supplementary Figure S1), the remaining vectors were synthesized externally (BioCat, Heidelberg, Germany). The mutants of Hisdianthin were mainly expressed in NiCo21(DE3) E. coli cells. The expression of some mutants (Lys156Ala, Lys157Ala, Lys235Ala, Lys240Ala and Lys50/92/126Ala) was not possible in NiCo21(DE3) but could be achieved in BL21(DE3)pLysS E. coli. The recombinant proteins were purified in small batches by Ni-NTA affinity chromatography using rapid centrifugation-based purification. Hisdianthin and Hisdianthin Arg24Ala were additionally prepared in larger batches by combining manual Ni-NTA and cation exchange chromatography.
SDS-PAGE analysis of recombinantly expressed and purified Hisdianthin mutants revealed, for all mutants, a main band at approximately the same height as the reference Hisdianthin (Figure 1). The main bands could, therefore, be assigned to the target proteins. In addition to the target protein band, the purified protein fractions of Hisdianthin mutants Lys129Ala, Lys157Ala, Lys221Ala, Lys227Ala, Lys235Ala, Lys240Ala, Lys254Ala and Arg24Ala showed further weak protein bands that corresponded to E. coli contaminations [41].
Due to the high number of proteins to be expressed, entirely pure elution fractions were not used at this point. Hisdianthin mutants that would show a difference from native Hisdianthin in cytotoxic screening should be re-expressed and purified to homogeneity. In the end, this occurred only for Hisdianthin Arg24Ala.
In addition to SDS-PAGE analysis, Hisdianthin and Hisdianthin Arg24Ala obtained by cation exchange chromatography were analyzed using trypsin and AspN in-gel digestion (see Supplementary Figure S2). A comparison of tryptic peptide mass fingerprints allowed us to confirm that the target protein (Hisdianthin Arg24Ala) was derived from Hisdianthin. To confirm the correct substitution of alanine, the AspN peptide mass fingerprint was evaluated. The peptide at position 21–28 permitted us to differentiate between Hisdianthin and Hisdianthin Arg24Ala. The corresponding peptide of Hisdianthin (DQIRNNVR.D) had a mass of 1013.5 Da, while the corresponding peptide of Hisdianthin Arg24Ala (DQIANNVR.D) shifted by −85 Da to 928.5 Da (see Supplementary Figure S2). The observed mass difference of −85 Da corresponded exactly to the exchange of arginine (156 Da) to alanine (71 Da).
2.2. Binding of SO1861 to Hisdianthin by Native Mass Spectrometry
The binding of RIPs and triterpene saponins has, so far, only been demonstrated by SPR for Hissaporin and the triterpene saponins SO1861 and SA1641 [17,25]. In order to be able to carry out the mutational analysis of Hisdianthin and to investigate the interaction between SO1861 and Hisdianthin, we first had to prove that the binding of SO1861 also occurs with Hisdianthin. To circumvent the drawbacks of SPR measurements of surface-active compounds (unspecific binding to the sensor surface) such as triterpene saponins, native mass spectrometry (MS) was chosen, which detects binding in the gas phase under non-denaturing conditions [42,43]. The native MS measurement of Hisdianthin without SO1861 showed a typical spectrum for a folded protein, indicated by a low charge state and a narrow charge state distribution ranging from 10+ to 12+ (Figure 2). Using spectral deconvolution, an experimental mass of 29,595 Da was determined for Hisdianthin. The same mass was confirmed when Hisdianthin was measured under denaturing MS conditions (see Supplementary Figure S3). For binding studies, Hisdianthin was analyzed by native MS in the presence of increasing concentrations of SO1861 (3×, 5× and 10× molar excess) were analyzed by native MS (Figure 2). Additional signals at 31,459 Da (+1864 Da) were detected in a concentration-dependent manner that indicated the weak binding of SO1861 to Hisdianthin in a 1:1 stoichiometry (theoretical MW of SO1861: 1862.9 Da). In addition, no binding or multiple binding could be detected at SO1861 concentrations below 30 µM.
2.3. Enzymatic Activities and Cytotoxic Screening of Hisdianthin Mutants
An oligonucleotide-based N-glycosylase activity assay was used to evaluate the effect of the substitution of different basic residues with alanine on the enzymatic activity of Hisdianthin [44]. To this end, an artificial oligonucleotide 5′-A30-3′ substrate was incubated with native Hisdianthin (reference) and Hisdianthin mutants, and the released adenine was quantified by TLC chromatography. The adenine release of native Hisdianthin was set as the reference value, and the adenine releases of Hisdianthin mutants were related to it. As shown in Figure 3, all Hisdianthin mutants were able to release adenine from A30. The single alanine substitutions at positions 50, 113, 157, 221 and 227 caused a significant loss in N-glycosylase activity compared with native Hisdianthin. The N-glycosylase activity of Hisdianthin mutants with multiple alanine substitutions was likewise strongly reduced.
To determine the effect that the alanine substitutions have on the interaction between Hisdianthin and SO1861, the cytotoxicity of Hisdianthin mutants in the presence of SO1861 (Hisdianthin mutant + SO1861) was evaluated. To monitor changes in cytotoxicity, a cytotoxic screening was performed with the lowest Hisdianthin concentration (1 nM) that, in combination with SO1861, still showed full cytotoxicity. In contrast to the native MS measurements, an SO1861 concentration of 1 µg/mL (corresponding to 537 nM) was used for the cytotoxicity experiments. Applicable SO1861 concentrations are limited by the cytotoxic effect of triterpene saponins. For SO1861, cytotoxicity was detected in Neuro-2A cells at concentrations of 7.5 µg/mL (corresponding to 4 µM) and above [45]. Previous studies have shown that SO1861 concentrations of 1 or 2 µg/mL are sufficient to enable efficient endosomal escape [16,46].
Alanine substitutions affecting the molecular interaction between Hisdianthin and SO1861 would consequently escape less from the endosomes and, therefore, reduce cytotoxicity. As shown in Figure 4, only 1 of 19 alanine substitutions showed reduced synergistic cytotoxicity. Hisdianthin Arg24Ala was the only mutant that behaved differently from the native Hisdianthin and was, therefore, the only Hisdianthin mutant subjected to further characterizing experiments.
2.4. Cytotoxic Characterization of Hisdianthin Arg24Ala
As confluence data for the Hisdianthin Arg24Ala in Neuro-2A cells (Figure 4) suggested a reduction in synergistic cytotoxicity compared with native Hisdianthin, the significance of reduced cytotoxicity and cell line specificity was investigated. To exclude that the reduction in cytotoxicity was caused by a Neuro-2A-cell-line-specific effect, Hisdianthin Arg24Ala (±SO1861) was also tested in A2058 and HCT116 cells. Cytotoxicity was measured by means of cell viability. As shown in Figure 5, the synergistic cytotoxicity of 0.1 nM, as well as 1 nM Hisdianthin Arg24Ala, was significantly reduced in all cell lines studied.
To determine whether the loss of cytotoxicity observed in Hisdianthin Arg24Ala was due to a reduced interaction with SO1861, its cytotoxicity was measured at high concentrations with and without the addition of SO1861. Hisdianthin escapes lysosomal degradation in very small amounts through a mechanism that has not been elucidated completely. High toxin concentrations allow us to measure the cytotoxic effect of RIPs, even without the addition of triterpene saponins. The higher the RIP concentrations, the higher the amount of protein that is able to reach the cytosol and exert its cytotoxic effect [13,18]. As shown in Figure 6A, while Hisdianthin was cytotoxic at concentrations above 100 nM, even without the addition of SO1861, the insertion of the Arg24Ala mutation caused a complete loss of cytotoxicity. Also, at high concentrations, with the addition of SO1861, the cytotoxicity of Hisdianthin Arg24Ala stayed slightly reduced compared with native Hisdianthin (Figure 6B). The synergistic cytotoxicity of Hisdianthin Arg24Ala (+SO1861) at lower concentrations (0.1 nM, 1 nM and 10 nM) was significantly reduced or absent compared with native Hisdianthin. At the same time, the cytotoxicity of Hisdianthin Arg24Ala at higher concentrations (100 nM and 1000 nM) without the addition of SO1861 (–SO1861) was also reduced. Consequently, the reduced cytotoxicity could not be caused by decreased interactions with SO1861. Reduced cytotoxicity due to decreased N-glycosylase activity could also be excluded, as the enzyme activity of Hisdianthin Arg24Ala and Hisdianthin did not differ significantly (Figure 3). Since the reduced cytotoxicity of Hisdianthin Arg24Ala could be attributed neither to a decreased interaction with SO1861 nor to a loss of enzyme activity, it was hypothesized that it was caused by the reduced endocytosis of Hisdianthin Arg24Ala.
2.5. Characterization of Labeled Proteins—Hisdianthin-CF568 and Hisdianthin Arg24Ala-CF568
In order to test the hypothesis that the Arg24Ala mutation affects the endocytosis of Hisdianthin, an endocytosis assay was performed. For this purpose, Hisdianthin and Hisdianthin Arg24Ala were labeled with CF®568, a red fluorescence label. Consequently, labeled Hisdianthin and Hisdianthin Arg24Ala were characterized (Figure 7).
Hisdianthin and Hisdianthin Arg24Ala reacted completely to Hisdianthin-CF568 and Hisdianthin Arg24Ala-CF568 (Figure 7A, lanes IV and V). Each labeled product resulted in only one band mass in a range of about 30–33 kDa, which was slightly diffuse, caused by different labeling degrees. By measuring the absorption at 280 nm and 562 nm, the degree of labeling (DOL) was determined as 2.1 for Hisdianthin-CF568 and 2.4 for Hisdianthin Arg24Ala-CF568. An additional MALDI-TOF analysis confirmed the purity of the labeled proteins and could identify the range of the DOL, which was between 2 and 6 for Hisdianthin-CF568 and between 1 and 6 for Hisdianthin Arg24Ala-CF568 (see Supplementary Figure S4). As shown in Figure 7B, the fluorescence intensity of Hisdianthin-CF568 and Hisdianthin Arg24Ala-CF568 differed neither at 100 nM nor at 1000 nM. Thus, the slightly varying DOL had no effect on fluorescence intensity. The CF®568-labeled proteins Hisdianthin and Hisdianthin Arg24Ala completely lost their oligonucleotide N-glycosylase activity (Figure 7C). In addition, the cytotoxicity assay revealed that Hisdianthin Arg24Ala-CF568 (+SO1861) did not show any cytotoxic effect in the concentration range studied from 0.1 nM to 100 nM. Hisdianthin-CF568 (+SO1861) remained cytotoxic only at 10 nM (see Supplementary Figure S5).
2.6. Endocytosis of Hisdianthin-CF568 and Hisdianthin Arg24Ala-CF568
Flow cytometry was used to quantify the endocytosis of fluorescence-labeled Hisdianthin and Hisdianthin Arg24Ala into Neuro-2A cells. Therefore, cells were incubated with a labeled protein over a time course of 24 h and evaluated by flow cytometry via the peak height of the PE channel. The extent of the endocytosis of the labeled protein was proportional to the peak height of the fluorescence signal. At time 0 h, no endocytosis had occurred. The fluorescence intensity at this time point corresponded to the intrinsic fluorescence of the cells. As shown in Figure 8, during the first two hours, the extent of the endocytosis of Hisdianthin-CF568 and Hisdianthin Arg24Ala-CF568 was essentially identical. After 6 h, Hisdianthin Arg24Ala-CF568 was endocytosed to a significantly higher proportion than Hisdianthin-CF568, whereas, after 16 h, the endocytosis of Hisdianthin-CF568 exceeded that of Hisdianthin Arg24Ala-CF568. After 24 h, the uptake of Hisdianthin-CF568 into the cell remained significantly higher than that of Hisdianthin Arg24Ala-CF568. This experiment confirms the hypothesis that the reduced synergistic cytotoxicity of Hisdianthin Arg24Ala was due to lower endocytosis compared with native Hisdianthin. Arginine at position 24 thus seems to play an important role in the endocytosis of Hisdianthin.
3. Discussion
Synergistic cytotoxicity between type I RIPs and triterpene saponins was first demonstrated by Hebestreit and Melzig in 2003 for agrostin and agrostemmasaponins, both isolated from the seeds of Agrostemma githago L. [20]. In recent years, it has also been shown that the cytotoxicity of other type I RIPs, such as dianthin-30 and saporin-S6, as well as various targeted toxins, is also enhanced by triterpene saponins [16,17]. The enhanced cytotoxicity is due to an endosomal release of type I RIPs mediated by saponins [22,47].
This study was undertaken in order to investigate the exact molecular mechanism of this process. In order to be effective, triterpene saponins must fulfill specific structural requirements; the presence of a glucuronic acid at position C-3 is one of these [23,48,49,50]. At the same time, acidic pH in late endosomes (pH 5.0–5.5) and lysosomes (pH 4.5–5.0) plays an important role in endosomal escape enhancement [17,24,51].
This study focuses on Hisdianthin, a very well-characterized type I RIP, and SO1861 [21,32]. Considering the theoretical isoelectric point (IEP) of Hisdianthin at 9.48, the protein or much more its basic residues are positively charged under the above-mentioned acidic pH conditions, whereas the glucuronic acid of SO1861 is negatively charged. In previous studies, the binding of triterpene saponins to type I RIPs showed pH-dependency, with the strongest binding at pH 5, which is in accordance with the importance of acidic pH in endosomes and lysosomes [17,25]. Based on these findings, we assumed that basic amino acids can interact with the glucuronic acid of SO1861. The aim was to study all lysine residues that were surface-accessible and not localized in the active site. Residues involved in rRNA N-glycosylase activity were excluded from the analysis. The adenine-releasing activity of Hissaporin in the presence of SA1641 did not show any significant reduction in activity, indicating that triterpene saponins do not bind to the active center [52].
A total of 19 Hisdianthin mutants were generated: 1 arginine mutant, 15 single lysine mutants, 1 double lysine mutant and 1 triple lysine mutant. In addition to the single substitutions, we decided to include double and triple substitutions to investigate the effect of the IEP of Hisdianthin on its interaction with SO1861. Single lysine substitutions led to a reduction in the theoretic IEP, from 9.48 to 9.42, whereas double and triple lysine substitutions reduced the theoretic IEP to 9.35 and 9.26, respectively [53].
As mentioned earlier, Weng et al. investigated the binding of type I RIPs and triterpene saponins using the example of Hissaporin and SO1861/SA1641 with SPR [17,25]. So far, binding data for other type I RIPs and triterpene saponins are not available. We performed native mass spectrometry in order to demonstrate the binding of SO1861 to Hisdianthin. The confirmation of binding between Hisdianthin and SO1861 was critical for the subsequent mutational analysis.
As shown in Figure 2, with increasing concentrations of SO1861, an additional small binding signal was detected. Since only one binding signal occurred, a 1:1 stoichiometry can be assumed. The experiment was performed with molar excesses of 3×, 5× and 10× SO1861. The SO1861 concentrations used for native MS measurements (Figure 2) differed from the concentrations used during cell culture experiments (Figure 4, Figure 5 and Figure 6). The binding signal could only be detected at an SO1861 concentration greater than 30 µM, which indicates low-affinity binding between Hisdianthin and SO1861. Accordingly, the SO1861 concentration of 1 µg/mL (corresponding to 537 nM) was unsuitable for native MS measurements. Equally, SO1861 concentrations of 7.5 µg/mL (corresponding to 4 µM) or more impair cell viability, even without combination with type I RIPs [45]. Therefore, SO1861 concentrations in cell culture experiments to study the synergistic cytotoxicity of saponins and type I RIPs are limited by their own cytotoxicity. An SO1861 concentration of 1 µg/mL was chosen, as this concentration was shown to be as efficient in enhancing endosomal escape as 2 µg/mL [16,46].
While Weng et al. reported the binding of SO1861 and SA1641 to Hissaporin using SPR, we could prove the binding of SO1861 to Hisdianthin by native MS. Thus, the binding of SO1861 to two distinct type I RIPs, Hissaporin and Hisdianthin, using two strongly differing methods (SPR and native MS), has been demonstrated. Both methods have weaknesses. In SPR, ligands can bind unspecifically to the sensor surface, which can be very pronounced for surface-active molecules such as SO1861, and the immobilization on the sensor surface can cause changes in native protein conformation [42]. In native MS, high ligand concentrations can also cause unspecific binding, which usually appears as multiple binding. For SO1861, no multiple binding could be detected. The results reported by Weng et al. and our results suggest that triterpene saponins bind to type I RIPs [17,25].
This is the first study reporting a mutational analysis of Hisdianthin. So far, the mutational data for type I RIPs with similar sequences have only been available for Hissaporin, but these studies mainly focused on active-site residues [54,55,56]. No data are available regarding how the substitution of lysine with alanine at specific positions affects N-glycosylase activity and cytotoxicity, with the exception of the mutation Arg24Ala, which was studied using the example of Hissaporin. Hissaporin shares 79.8% sequence identity with Hisdianthin. This level of sequence homology is comparatively high and allows for robust inferences from one protein to the other [32]. In addition, the main catalytic residues, Tyr73, Glu177 and Arg180 (dianthin-30 numbering), which are highly conserved in the RIP plant toxin family (applicable to type I and type II RIPs), have the same localization as Arg24 in Hisdianthin, as well as in Hissaporin [37,57].
Alanine substitution at position 24 did not affect Hissaporin’s enzymatic activity or its protein synthesis inhibitory activity. In this case, N-glycosylase activity was determined by measuring the release of an Endo fragment from the 28S rRNA of rabbit reticulocyte lysate and protein synthesis inhibition using an in vitro translational assay [55]. The release of the Endo fragment from rabbit reticulocyte lysate performed by Bagga et al. more accurately mimics the cellular processes than the adenine-releasing assay [44,55]. Since Hissaporin and Hisdianthin are strongly consistent in their sequence (79.8% sequence identity) and no change in adenine-releasing activity was observed for Hisdianthin Arg24Ala, it can be assumed that the substitution of the residue Arg24 by alanine should have the same effect on the protein synthesis inhibitory activity of Hisdianthin, as demonstrated for Hissaporin Arg24Ala by Bagga et al. [55].
As shown in Figure 3 and Figure 4, adenine-releasing activity is not correlated with the extent of cytotoxicity. The insertion of the alanine substitution at positions 50, 113, 157, 221, 227, 50/92 and 50/92/126 significantly reduced their N-glycosylase activity, but their synergistic cytotoxicity was not affected. Even though the lysines at these positions are not involved in the enzymatic reaction mechanism of Hisdianthin, their N-glycosylase activity was reduced [37]. The reduction was probably due to a global destabilizing effect that the insertion of alanine substitutions may have on the protein structure [58,59].
Cytotoxic screening was used to study the interaction between Hisdianthin mutants and SO1861. Reduced interaction between the Hisdianthin mutant and SO1861 would mean less endosomal escape and, consequently, a reduction in synergistic cytotoxicity. As previously mentioned, the SO1861 concentration (1 µg/mL) and the protein concentration (1 nM) were optimized in order to determine the smallest change in synergistic cytotoxicity caused by the mutation.
None of the lysine mutants showed any reduction in synergistic cytotoxicity. The studied lysine residues thus had no effect on the interaction with SO1861 and were not involved in the molecular mechanism of endosomal escape enhancement. Furthermore, the reduction in the IEP from 9.48 to 9.26 had no effect on the interaction between Hisdianthin and SO1861. Hebestreit et al. supposed Schiff base formation between the aldehyde function of the aglycone and specific amino acids like lysines [60]. Böttger et al. already questioned this hypothesis, as they tested saponins with aldehyde function and could not detect any enhanced endosomal release [23]. Our data also contradict the theory of Schiff base formation with lysines as the mechanism. None of the tested lysine mutants impacted the synergistic cytotoxicity.
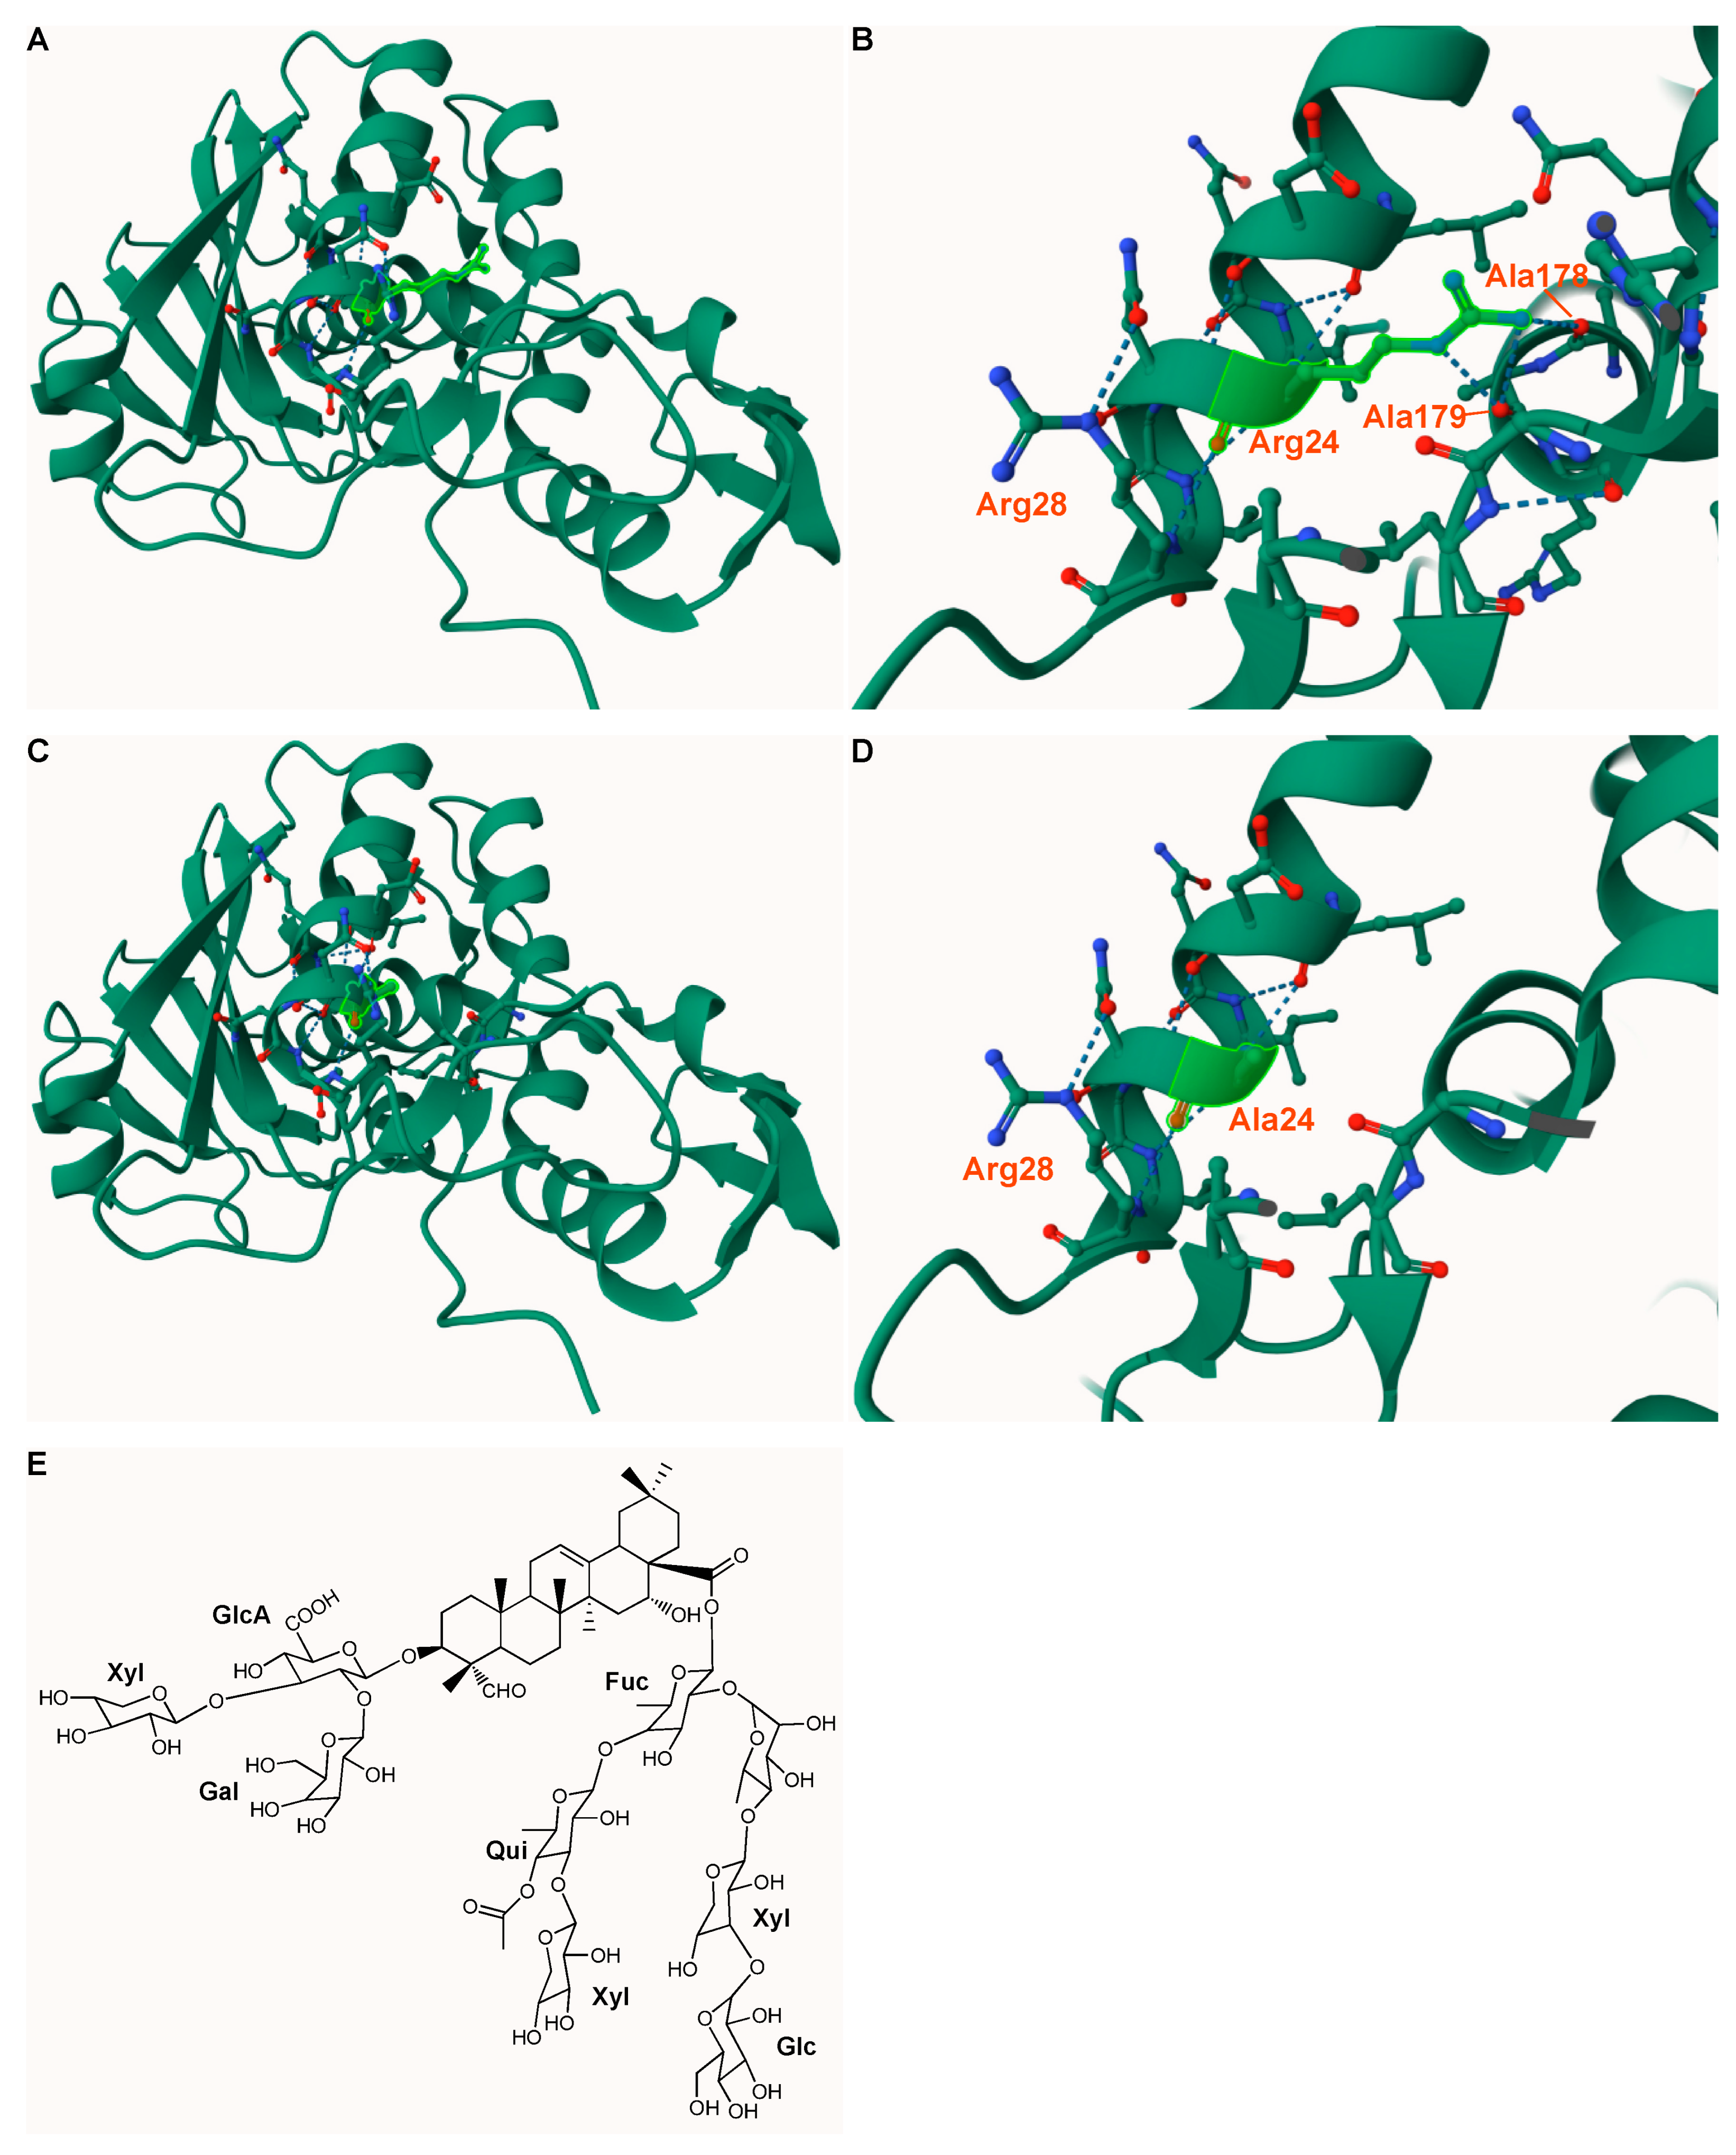
Hisdianthin Arg24Ala was the only Hisdianthin mutant whose synergistic cytotoxicity was altered by the insertion of the mutation (Figure 4). This appears to be a general rather than cell-type-specific phenomenon since it was similarly observed in three different cell lines. Arg24 would be a suitable candidate as an interaction partner with SO1861. As shown in Figure 9, the amino acid is surface-accessible and is surrounded by hydrophilic and hydrophobic residues, matching the amphiphilic structure of SO1861 [61].
To confirm that the reduced combinatorial cytotoxicity is based on the lower interaction between Hisdianthin Arg24Ala and SO1861, Hisdianthin Arg24Ala was studied at high protein concentrations, allowing us to investigate cytotoxicity without the addition of SO1861 [32,62]. Since the cytotoxicity of Hisdianthin and Hisdianthin Arg24Ala varied even without the addition of SO1861, the reduced synergistic cytotoxicity could not be due to a reduced interaction with SO1861. As also shown for Hissaporin Arg24Ala, the insertion of Arg24Ala in Hisdianthin had no impact on its N-glycosylase activity [55]. Consequently, the reduced cytotoxicity could only have been caused by a lower toxin concentration in the cytosol. This decreased concentration, however, is not due to a reduced endosomal release but to a reduced uptake into the cell by endocytosis.
Figure 9.
Protein structure of Hisdianthin and its mutant Hisdianthin Arg24Ala and structure of SO1861. (A–D) Homology model of Hisdianthin and Hisdianthin Arg24Ala using Phyre2 and Mol* Viewer [63,64]. The high-resolution structure of dianthin-30 served as template (1.4 Å; PDB ID 1RL0) [65]. The homology models indicate confidence and coverage levels of 100%. (A,B) Tertiary structure of Hisdianthin. The residue Arg24 (highlighted in light green) is surface-accessible and interacts via hydrogen bonds with the residues Arg28, Ala179 and Ala178. (C,D) Tertiary structure of Hisdianthin Arg24Ala. After inserting an alanine at position 24, the hydrogen bonds with Ala178 and Ala179 no longer exist. Ala24 now interacts only with Arg28. (E) Structure of the bisdesmosidic triterpene saponin SO1861 [36].
The fluorescent labeling of type I RIPs has been described for Hisdianthin, Hissaporin and a saporin-based immunotoxin [11,15,17,47,66]. None of these authors have reported DOL or effects on N-glycosylase activity. No information on the number of bound fluorescent molecules to type I RIPs is available to evaluate our DOL data. Labeled Hissaporin remained fully cytotoxic [11]. The determined DOL of Hisdianthin-CF568 and Hisdianthin Arg24Ala-CF568, each 2.1 and 2.4, respectively, deviated slightly from the manufacturer’s recommendations, which were 1.0–1.2. The unspecific binding of CF®568 to the primary amines of lysine residues caused a loss of N-glycosylase activity and cytotoxicity at low toxin concentrations. To avoid unspecific binding, a more selective labeling technique could be performed. Thiol-reactive reagents would be more selective, as there is only one cysteine in Hisdianthin. The unique cysteine of Hisdianthin, however, is not surface-accessible and, therefore, not suitable for thiol labeling [61,67].
The uniformity of the DOL of Hisdianthin-CF568 and Hisdianthin Arg24Ala-CF568 could be confirmed with both SDS-PAGE and MS (Figure 7 and Figure S4). The fluorescence intensity of both proteins was also the same. Assuming that both proteins were labeled with CF568 at the same lysine residues, Hisdianthin-CF568 and Hisdianthin Arg24Ala-CF568 fulfilled all criteria for comparing their endocytosis. In addition, there was no lysine residue in the vicinity of Arg24, which, by binding to CF®568, would sterically hinder the accessibility of the arginine. Within 24 h, more Hisdianthin-CF568 accumulated in the cells than Hisdianthin Arg24Ala-CF568 (Figure 8). Under the assumptions made, our data suggest that Arg24 may make a functional contribution to the endocytosis of Hisdianthin. Considering the tertiary structure of Hisdianthin (Figure 9), the position of Arg24 allows it to be accessed from the surface and makes it conducive to endocytosis.
Arginine at position 24 is not only preserved in dianthin-30 but also in saporin-S6, as previously shown [55]. In addition, the alignment of dianthin-30 with common type I and type II RIPs indicates that Arg24 is also conserved in sapovaccarin-S1, gelonin, gypsophilin-S, agrostin, bouganin, abrin A chain and ricin A chain [34,46,68,69,70,71,72,73]. Thus, Arg24 is even found in type I RIPs like agrostin, which have an amino acid sequence that is unusual for the latter ones. Moreover, Arg24 is even preserved in type II RIPs, whose endocytosis mechanism is demonstrably different from that of type I RIPs [9]. The presence of arginine at the same position suggests that the role of Arg24 in the endocytosis of dianthin-30 is also transferable to other type I RIPs. However, it remains questionable whether Arg24 has the same function during endocytosis in type I and type II RIPs.
4. Conclusions
Nineteen Hisdianthin mutants were analyzed for their interactions with SO1861 on the basis of their synergistic cytotoxicity. None of the Hisdianthin mutants studied affected the endosomal escape enhancement induced by triterpene saponins. According to our findings, lysine residues and Arg24 are not involved in the interaction between Hisdianthin and SO1861. The reduced synergistic cytotoxicity of Hisdianthin Arg24Ala could be attributed to a lower extent of endocytosis. It took 20 years to elucidate parts of the endosomal escape enhancement mechanism. This study was also unable to unveil the complete mechanism underlying the enhancement of endosomal escape. However, it succeeded in defining a number of residues that are clearly not involved in this mechanism.
5. Materials and Methods
5.1. Construction of RIP-Mutants
The nucleotide sequence of dianthin-30 tagged with an N-terminal 6x polyhistidine-tag (referred to as Hisdianthin) was present in a pET11d vector [16]. The 6114-base pair pET11d-Hisdianthin vector was used as a template to mutate the codons for basic amino acid residues Lys195, Lys227 and Arg24 to that for alanine via site-directed mutagenesis. The mutations were inserted using the Q5® Site-Directed Mutagenesis Kit (New England Biolabs, Ipswich, MA, USA) following the manufacturer’s instructions. DNA primers containing the mutations Lys195Ala, Lys227Ala and Arg24Ala were designed according to NEBaseChanger® (New England Biolabs, Ipswich, MA, USA; Table 1). After performing PCR, products were visualized by agarose gel electrophoresis, as described elsewhere [74]. Plasmid preparations (Monarch® Plasmid Miniprep Kit, New England Biolabs, Ipswich, MA, USA) of the resulting mutated vectors and subsequent Sanger DNA sequencing (LGC Genomics, Berlin, Germany) confirmed all mutations. The remaining pET11d-Hisdianthin mutants, Lys50Ala, Lys92Ala, Lys113Ala, Lys126Ala, Lys129Ala, Lys156Ala, Lys157Ala, Lys162Ala, Lys190Ala, Lys201Ala, Lys221Ala, Lys235Ala, Lys240Ala Lys254Ala, Lys50/92Ala and Lys50/92/126Ala, were synthesized by BioCat (Heidelberg, Germany).
5.2. Expression and Purification of Recombinant Proteins
Hisdianthin and its mutants Lys50Ala, Lys92Ala, Lys113Ala, Lys126Ala, Lys129Ala, Lys162Ala, Lys190Ala, Lys195Ala, Lys201Ala, Lys221Ala, Lys227Ala, Lys254Ala, Lys50/92Ala and Arg24Ala were recombinantly expressed in E. coli NiCo21(DE3) (New England Biolabs, Ipswich, MA, USA). Lys156Ala, Lys157Ala, Lys235Ala, Lys240Ala and Lys50/92/126Ala could not be expressed in NiCo21(DE3). Instead, the BL21(DE3)pLysS strain was used for their expression (Merck Millipore, Burlington, MA, USA). The protein expression followed a protocol described elsewhere [62]. All Hisdianthin mutants were purified in a small batch by Ni-nitrilotriacetic acid affinity chromatography (Ni-NTA) using the Amicon® Pro Affinity Concentration Ni-NTA Kit (Merck Millipore, Burlington, MA, USA) rapid centrifugal-based purification method. In the last step, the elution buffer was exchanged for DPBS via ultrafiltration. Hisdianthin and Hisdianthin Arg24Ala were additionally purified in a larger batch by combining manual Ni-NTA chromatography and cation exchange chromatography, thus affording pure proteins. Ni-NTA was carried out as described in [62]. Eluted fractions containing the target protein (visualized by SDS-PAGE) were pooled; dialyzed against 50 mM MES Puffer (pH 5.6); and applied to a HiTrap SP XL column connected to an ÄKTATM start system (GE Healthcare, Chicago, IL, USA). Proteins were eluted with 100 mM, 200 mM, 300 mM and 400 mM of NaCl in 50 mM of MES Puffer (pH 5.6). Buffer exchange and protein concentration of fractions containing the target protein (visualized by SDS-PAGE) were carried out by ultrafiltration (Amicon®Ultra 15, 10 K, Merck Millipore, Burlington, MA, USA).
5.3. SDS-PAGE and Protein Quantification
Then, 12.5% SDS-polyacrylamide gels were used for SDS-PAGE using the Lämmli method [75]. Protein bands were stained with Coomassie Brillant Blue G250, as described elsewhere [76]. Protein concentrations were determined either by using a bicinchoninic acid assay (Pierce BCA Protein Assay Kit, Thermo Scientific, Rockford, IL, USA) optimized for NanoDrop One (Thermo Scientific, Rockford, IL, USA) or by measuring the absorbance at 280 nm (NanoDrop One, Thermo Scientific, Rockford, IL, USA).
5.4. Adenine-Releasing Assay
The N-glycosylase activity of different samples was quantified with the adenine-releasing assay. The assay was carried out as described elsewhere [44]. Type I RIPs are able to release adenine from an artificial DNA oligonucleotide 5′-A30-3′ (A30) substrate. The assay is based on the quantification of the aforementioned cleaved adenine from the A30 substrate. Therefore, a 169 nM RIP sample was mixed with 21.4 µM of A30 substrate (Metabion International AG, Planegg/Steinkirchen, Germany) and filled up to 50 µL with assay buffer (50 mM of sodium acetate; 100 mM of KCl; pH 5). The mixtures were incubated overnight at 37 °C (for a total of 16.5 h, slightly deviating from the publication). Samples (each 10 µL) were applied to a TLC 0.25 mm pre-coated silica gel 60 glass plate with fluorescent indicator, UV254 (Macherey-Nagel, Düren, Germany), and developed by acetonitrile/water/ammonia (32%) (18:1.6:0.6). Released adenine was determined by TLC densitometry at 260 nm using TLC Scanner 4 (CAMAG, Berlin, Germany).
5.5. Cell Culture
Neuro-2A cells (DMSZ ACC 148)—mouse neuroblasts with neuronal and amoeboid stem cell morphology isolated from brain tissue—were cultivated in low-glucose (1.0 g/L) Dulbecco’s Modified Eagle Medium (Lonza, Walkersville, MD, USA) supplemented with 10% FBS (Bio&SELL, Feucht/Nürnberg, Germany); 2 mM of alanyl-L-glutamine (UltraGlutamineTM I Supplement, Lonza, Walkersville, MD, USA); and 1% non-essential amino acids (Sigma-Aldrich, St. Louis, USA). HCT116 cells (ATCC® CCL-247TM), a human colon cancer cell line, were cultured in McCoy’s 5A Medium (Life Technologies, Carlsbad, CA, USA) supplemented with 10% FBS and 2 mM of glutamine. A2058 cells (ATCC® CRL-11147 TM), a human amelanotic melanoma cell line, were cultivated in high-glucose (4.5 g/L) Dulbecco’s Modified Eagle Medium (Lonza, Walkersville, MD, USA) supplemented with 10% FBS, 2 mM of glutamine and 1% non-essential amino acids. Cells were grown in humidified incubators at 5% CO2 and 37 °C.
5.6. Cytotoxic Screening of Hisdianthin Mutants
The cytotoxic screening of Hisdianthin mutants was monitored by label-free live-cell imaging using the CytoSMART Omni system (CytoSMART Technologies B.V., Eindhoven, the Netherlands). Neuro-2A cells (4000 cells/well) were seeded in 96-well plates containing 100 µL of medium per well. After 24 h, 55 µL of medium was removed and replaced by 55 µL of fresh medium containing 1 nM (final concentration) of Hisdianthin mutants either supplemented with 1 µg/mL of SO1861 or without supplementation of SO1861 (each in three wells). Control cells were treated with 1 nM of Hisdianthin ± 1 µg/mL of SO1861 and PBS ± 1 µg/mL of SO1861 (each in three wells). Cells were incubated for a further 48 h. Image analysis was performed using the CytoSMART 33.3 image analysis software package.
5.7. Cytotoxicity of Hisdianthin Arg24Ala in Three Different Cell Lines
The cell viability of Hisdianthin Arg24Ala was determined in three cell lines: Neuro-2A, HCT116 and A2058 cells. Neuro-2A (4000 cells/well), HCT116 (5000 cells/well) and A2058 (5000 cells/well) were seeded in 96-well plates containing 100 µL of medium per well. After 24 h, 55 µL of medium was replaced by 55 µL of fresh medium supplemented with 0.1 nM and 1 nM of Hisdianthin Arg24Ala ± 1 µg/mL of SO1861 (final concentrations, each in triplicate). Control cells were treated with 0.1 nM and 1 nM of Hisdianthin ± 1 µg/mL of SO1861 and PBS ± 1 µg/mL of SO1861 (each in three wells). After adding the samples, cells were incubated for a further 48 h. In addition to the confluence live-cell imaging of the CytoSMART Omni system, the cytotoxicity was evaluated by the MTT endpoint assay [77]. Complete medium was removed from the cells. In total, 100 µL of MTT (Carl Roth, Karlsruhe, Germany) solution (0.5 mg/mL in culture medium) was added to each well. The 96-well plate was incubated at 37 °C for 2 h. To solubilize the formazan product, MTT solution was replaced by 100 µL/well DMSO and further incubated for 30 min. Absorbance was measured at 560 nm (reference wavelength: 620 nm) using the Infinite 200 Microplate Reader (Tecan, Männedorf, Switzerland).
5.8. Cytotoxicity of Hisdianthin Arg24Ala at High Concentrations
Similar to the cytotoxic screening (5.6), Neuro-2A cells (4000 cells/well) were seeded in 96-well plates containing 100 µL of medium per well. After 24 h, the medium was removed and replaced by 55 µL of fresh medium containing Hisdianthin Arg24Ala ranging from 10 to 1000 nM, either supplemented with 1 µg/mL of SO1861 or without supplementation of SO1861 (final concentrations, each in three wells). Control cells were treated with 10–1000 nM of Hisdianthin ± 1 µg/mL of SO1861 and PBS ± 1 µg/mL of SO1861 (each in triplicate). Evaluation was carried out as described in Section 5.7.
5.9. Fluorescence Labeling
Hisdianthin and Hisdianthin Arg24Ala (each with a final concentration of 1.5 mg/mL) were labeled with CF®568 NHS-ester (10 mM in DMSO; Sigma-Aldrich, St. Louis, MO, USA) according to the manufacturer’s instructions. A dye:protein ratio of 15:1 was chosen. The labeling reaction was purified by ultrafiltration against PBS (Amicon® Ultra-0.5 centrifugal filters, 10 kDa; Merck Millipore, Burlington, VT, USA). Protein concentration and degree of labeling (DOL) of labeled Hisdianthin and Hisdianthin Arg24Ala (Hisdianthin-CF568 and Hisdianthin Arg24Ala-CF568) were determined by measuring absorbances at 280 and 562 nm (Biospectrometer® Basic, Eppendorf, Hamburg, Germany). Fluorescence intensity of labeled proteins was determined at 560/10 nm (excitation) and 595/35 nm (emission) (Infinite 200, Tecan, Männedorf, Switzerland).
5.10. Cytotoxicity of Hisdianthin-CF568 and Hisdianthin Arg24Ala-CF568
To investigate the impact of the fluorescence label CF®568 on Hisdianthin’s and Hisdianthin Arg24Ala’s cytotoxicity, 4000 Neuro-2A cells/well were seeded into a 96-well plate containing 100 µL of medium per well. The concentrations used were adapted to the endocytosis assay. After 24 h of incubation, the medium was replaced by 55 µL of fresh medium containing Hisdianthin and Hisdianthin Arg24Ala ranging from 0.1 to 100 nM, either supplemented with 1 µg/mL of SO1861 or without supplementation of SO1861 (final concentrations, each in three wells). Control cells were treated with PBS ± 1 µg/mL of SO1861 (each in triplicate). Evaluation was carried out as described in Section 5.7.
5.11. Endocytosis Assay
Neuro-2A cells were seeded in 96-well plates and grown for 24 h. To monitor time-dependent endocytosis after 0 h, 2 h, 6 h, 16 h and 24 h, samples were added consecutively in reverse order to the cells. Then, 24 h, 32 h, 42 h, 46 h and 48 h after seeding, corresponding to 24 h, 16 h, 6 h, 2 h and 0 h of incubation with fluorescence-labeled protein, respectively, each 55 µL cell culture medium was removed and replaced by 55 μL of fresh medium containing either Hisdianthin-CF568 or Hisdianthin Arg24Ala-CF568 at a final concentration of 100 nM (each in triplicate). Then, 48 h after seeding, the incubation was stopped, and cell culture medium containing non-endocytosed labeled protein was removed. Subsequently, adherent cells were trypsinated (150 μL/well) for 10 min at 37 °C, homogenized and analyzed by flow cytometry (CytoFLEX, Beckman Coulter, Brea, CA, USA). For each sample, at least 10,000 cells were measured, and at least 5000 single cells were included in the analysis. Debris and doublets were excluded from analysis.
5.12. Protein Mass Spectrometry
Protein and peptide samples were analyzed by matrix-assisted laser desorption time-of-flight mass spectrometry (MALDI-TOF-MS). Peptides were measured with an Ultraflex II TOF/TOF instrument (Bruker Daltonics, Bremen, Germany) equipped with a 200 Hz solid-state Smart beamTM laser, while the labeled protein was measured on a Bruker UltrafleXtreme instrument. Data were analyzed using the FlexAnalysis 2.4 software provided with the instruments. Samples were applied via the dried-droplet technique. Peptides were generated by trypsin or AspN in-gel digestion following a protocol described elsewhere [78]. The mass fingerprints of the generated peptides were recorded in positive reflector mode (RP_PepMix) over a m/z range of 600–4000. α-cyano-4-hydroxycinnamic acid was used as matrix. Intact labeled proteins were measured on sinapinic acid as matrix in positive linear mode over a m/z range of 5000–55,000.
For native MS measurements, Hisdianthin was buffer-exchanged by dialysis into 50 mM of ammonium acetate buffer, pH 6.24. A stock solution of SO1861 (537 µM, in water) was first diluted to 1:2 with 100 mM of ammonium acetate to reach 50 mM of ammonium acetate and was then adjusted with 50 mM of ammonium acetate to a final concentration of 200 µM of SO1861. The diluted stock solution was mixed with Hisdianthin to obtain final concentrations of 10 µM of Hisdianthin and 30 µM, 50 µM or 100 µM of SO1861. For the measurement under denaturing conditions, a 5 µM dilution of Hisdianthin in 0.1% formic acid in acetonitrile:water (1:1) was used. The native MS measurements were performed on a Q Exactive HF mass spectrometer using direct injection with an offline nanoESI source head on the NanoFlex ion source (Thermo Scientific). The intact protein mode was activated, and the trapping gas pressure was set to 0.2 (available with Biopharma option). All spectra were recorded for at least 30 s in the profile mode with positive polarity using the following settings: scan range, 300 to 4000 m/z (500 to 2000 m/z for denaturing conditions); resolution, 15,000; microscans, 5; AGC target, 3e6; maximum inject time, 200 ms; spray voltage, 2.2 kV; capillary temperature, 175 °C; S-lens RF level, 60; in-source decay (ISD), 100 eV. The software tool UniDec 6.0.3 was used for data processing and spectral deconvolution using the default settings with the following modifications: charge range, 5–20 (27–35 for denaturing conditions); mass range, 29–32 kDa; sample mass, every 1 Da [79].
5.13. Statistical Analysis
All experiments were conducted in duplicate or in triplicate and were repeated three times independently. The obtained data were analyzed using RStudio (RStudio Team (2020); RStudio: Integrated Development Environment for R. RStudio, PBC, Boston, MA, USA) All data were first tested for normal distribution using the Shapiro–Wilk test. Outliers of normally distributed data were identified using Grubbs’ test and excluded from the analysis. Statistical significance of normally distributed data was determined using Student’s t-test. Non-normally distributed data were tested for significance using the Wilcoxon–Mann–Whitney U test. All values are presented as arithmetic means ± standard deviation.
Supplementary Materials
The following supporting information can be downloaded at https://www.mdpi.com/article/10.3390/toxins16050219/s1: Figure S1. PCR products of side-directed mutagenesis of pET11d-Hisdianthin; Figure S2. MALDI mass spectra allowing the identification of Hisdianthin Arg24Ala; Figure S3. ESI-MS spectrum of Hisdianthin measured under denaturing conditions (0.1 % formic acid in acetonitrile/water (1:1)); Figure S4. MALDI mass spectra of the labeling reaction of Hisdianthin and Hisdianthin Arg24Ala with the fluorescent dye CF®568; Figure S5. Cytotoxicity of Hisdianthin-CF568 and Hisdianthin Arg24Ala-CF568.
Author Contributions
L.S. designed and performed experiments, analyzed data and wrote the main manuscript. C.W. and B.K. designed and performed the mass spectrometry experiments, analyzed data, wrote parts of the manuscript and read and edited the manuscript; A.W. designed the research and read and edited the manuscript. All authors have read and agreed to the published version of the manuscript.
Funding
This research was funded by Deutsche Forschungsgemeinschaft (DFG), grant number 422686308. We acknowledge support from the Open Access Publication Fund of the Freie Universität Berlin.
Data Availability Statement
The raw data supporting the conclusions of this article will be made available by the authors on request.
Acknowledgments
For mass spectrometry (C.W. and B.K.), we would like to acknowledge the assistance of the Core Facility BioSupraMol, supported by the Deutsche Forschungsgemeinschaft (DFG).
Conflicts of Interest
The authors declare no conflicts of interest.
References
- Endo, Y.; Tsurugi, K. RNA N-glycosidase activity of ricin A-chain. Mechanism of action of the toxic lectin ricin on eukaryotic ribosomes. J. Biol. Chem. 1987, 262, 8128–8130. [Google Scholar] [CrossRef] [PubMed]
- Endo, Y.; Mitsui, K.; Motizuki, M.; Tsurugi, K. The mechanism of action of ricin and related toxic lectins on eukaryotic ribosomes. The site and the characteristics of the modification in 28 S ribosomal RNA caused by the toxins. J. Biol. Chem. 1987, 262, 5908–5912. [Google Scholar] [CrossRef] [PubMed]
- Olsnes, S.; Pihl, A. Different biological properties of the two constituent peptide chains of ricin, a toxic protein inhibiting protein synthesis. Biochemistry 1973, 12, 3121–3126. [Google Scholar] [CrossRef] [PubMed]
- Guyette, J.L.; Serrano, A.; Huhn Iii, G.R.; Taylor, M.; Malkom, P.; Curtis, D.; Teter, K. Reduction is sufficient for the disassembly of ricin and Shiga toxin 1 but not Escherichia coli heat-labile enterotoxin. Infect. Immun. 2023, 91, e0033223. [Google Scholar] [CrossRef] [PubMed]
- Timar, J.; McIntosh, D.P.; Henry, R.; Cumber, A.J.; Parnell, G.D.; Davies, A.J. The effect of ricin B chain on the intracellular trafficking of an A chain immunotoxin. Br. J. Cancer 1991, 64, 655–662. [Google Scholar] [CrossRef] [PubMed]
- Sandvig, K.; Grimmer, S.; Lauvrak, S.U.; Torgersen, M.L.; Skretting, G.; van Deurs, B.; Iversen, T.G. Pathways followed by ricin and Shiga toxin into cells. Histochem. Cell Biol. 2002, 117, 131–141. [Google Scholar] [CrossRef] [PubMed]
- Rapak, A.; Falnes, P.O.; Olsnes, S. Retrograde transport of mutant ricin to the endoplasmic reticulum with subsequent translocation to cytosol. Proc. Natl. Acad. Sci. USA 1997, 94, 3783–3788. [Google Scholar] [CrossRef]
- Barbieri, L.; Battelli, M.G.; Stirpe, F. Ribosome-inactivating proteins from plants. Biochim. Biophys. Acta 1993, 1154, 237–282. [Google Scholar] [CrossRef]
- Vago, R.; Marsden, C.J.; Lord, J.M.; Ippoliti, R.; Flavell, D.J.; Flavell, S.U.; Ceriotti, A.; Fabbrini, M.S. Saporin and ricin A chain follow different intracellular routes to enter the cytosol of intoxicated cells. FEBS J. 2005, 272, 4983–4995. [Google Scholar] [CrossRef]
- Bolognesi, A.; Bortolotti, M.; Maiello, S.; Battelli, M.G.; Polito, L. Ribosome-Inactivating Proteins from Plants: A Historical Overview. Molecules 2016, 21, 1627. [Google Scholar] [CrossRef]
- Weng, A.; Bachran, C.; Fuchs, H.; Melzig, M.F. Soapwort saponins trigger clathrin-mediated endocytosis of saporin, a type I ribosome-inactivating protein. Chem. Biol. Interact. 2008, 176, 204–211. [Google Scholar] [CrossRef] [PubMed]
- Goldmacher, V.S.; Tinnel, N.L.; Nelson, B.C. Evidence that pinocytosis in lymphoid cells has a low capacity. J. Cell Biol. 1986, 102, 1312–1319. [Google Scholar] [CrossRef] [PubMed]
- Bolognesi, A.; Polito, L.; Scicchitano, V.; Orrico, C.; Pasquinelli, G.; Musiani, S.; Santi, S.; Riccio, M.; Bortolotti, M.; Battelli, M.G. Endocytosis and intracellular localisation of type 1 ribosome-inactivating protein saporin-s6. J. Biol. Regul. Homeost. Agents 2012, 26, 97–109. [Google Scholar] [PubMed]
- Cavallaro, U.; Nykjaer, A.; Nielsen, M.; Soria, M.R. Alpha 2-macroglobulin receptor mediates binding and cytotoxicity of plant ribosome-inactivating proteins. Eur. J. Biochem. 1995, 232, 165–171. [Google Scholar] [CrossRef] [PubMed]
- Gilabert-Oriol, R.; Furness, S.G.B.; Stringer, B.W.; Weng, A.; Fuchs, H.; Day, B.W.; Kourakis, A.; Boyd, A.W.; Hare, D.L.; Thakur, M.; et al. Dianthin-30 or gelonin versus monomethyl auristatin E, each configured with an anti-calcitonin receptor antibody, are differentially potent in vitro in high-grade glioma cell lines derived from glioblastoma. Cancer Immunol. Immunother. 2017, 66, 1217–1228. [Google Scholar] [CrossRef]
- Gilabert-Oriol, R.; Weng, A.; Trautner, A.; Weise, C.; Schmid, D.; Bhargava, C.; Niesler, N.; Wookey, P.J.; Fuchs, H.; Thakur, M. Combinatorial approach to increase efficacy of Cetuximab, Panitumumab and Trastuzumab by dianthin conjugation and co-application of SO1861. Biochem. Pharmacol. 2015, 97, 247–255. [Google Scholar] [CrossRef] [PubMed]
- Weng, A.; Thakur, M.; von Mallinckrodt, B.; Beceren-Braun, F.; Gilabert-Oriol, R.; Wiesner, B.; Eichhorst, J.; Bottger, S.; Melzig, M.F.; Fuchs, H. Saponins modulate the intracellular trafficking of protein toxins. J. Control Release 2012, 164, 74–86. [Google Scholar] [CrossRef] [PubMed]
- Fuchs, H.; Niesler, N.; Trautner, A.; Sama, S.; Jerz, G.; Panjideh, H.; Weng, A. Glycosylated Triterpenoids as Endosomal Escape Enhancers in Targeted Tumor Therapies. Biomedicines 2017, 5, 14. [Google Scholar] [CrossRef]
- Sandvig, K.; van Deurs, B. Delivery into cells: Lessons learned from plant and bacterial toxins. Gene Ther. 2005, 12, 865–872. [Google Scholar] [CrossRef]
- Hebestreit, P.; Melzig, M.F. Cytotoxic activity of the seeds from Agrostemma githago var. githago. Planta Med. 2003, 69, 921–925. [Google Scholar] [CrossRef]
- Thakur, M.; Weng, A.; Pieper, A.; Mergel, K.; von Mallinckrodt, B.; Gilabert-Oriol, R.; Gorick, C.; Wiesner, B.; Eichhorst, J.; Melzig, M.F.; et al. Macromolecular interactions of triterpenoids and targeted toxins: Role of saponins charge. Int. J. Biol. Macromol. 2013, 61, 285–294. [Google Scholar] [CrossRef] [PubMed]
- Weng, A.; Bachran, C.; Fuchs, H.; Krause, E.; Stephanowitz, H.; Melzig, M.F. Enhancement of saporin cytotoxicity by Gypsophila saponins--more than stimulation of endocytosis. Chem. Biol. Interact. 2009, 181, 424–429. [Google Scholar] [CrossRef] [PubMed]
- Böttger, S.; Westhof, E.; Siems, K.; Melzig, M.F. Structure-activity relationships of saponins enhancing the cytotoxicity of ribosome-inactivating proteins type I (RIP-I). Toxicon 2013, 73, 144–150. [Google Scholar] [CrossRef] [PubMed]
- Bachran, D.; Schneider, S.; Bachran, C.; Weng, A.; Melzig, M.F.; Fuchs, H. The endocytic uptake pathways of targeted toxins are influenced by synergistically acting Gypsophila saponins. Mol. Pharm. 2011, 8, 2262–2272. [Google Scholar] [CrossRef] [PubMed]
- Weng, A.; Thakur, M.; Beceren-Braun, F.; Bachran, D.; Bachran, C.; Riese, S.B.; Jenett-Siems, K.; Gilabert-Oriol, R.; Melzig, M.F.; Fuchs, H. The toxin component of targeted anti-tumor toxins determines their efficacy increase by saponins. Mol. Oncol. 2012, 6, 323–332. [Google Scholar] [CrossRef] [PubMed]
- Fuchs, H.; Weng, A.; Gilabert-Oriol, R. Augmenting the Efficacy of Immunotoxins and Other Targeted Protein Toxins by Endosomal Escape Enhancers. Toxins 2016, 8, 200. [Google Scholar] [CrossRef] [PubMed]
- Flavell, D.J.; Flavell, S.U. Plant-Derived Type I Ribosome Inactivating Protein-Based Targeted Toxins: A Review of the Clinical Experience. Toxins 2022, 14, 563. [Google Scholar] [CrossRef] [PubMed]
- Giansanti, F.; Flavell, D.J.; Angelucci, F.; Fabbrini, M.S.; Ippoliti, R. Strategies to Improve the Clinical Utility of Saporin-Based Targeted Toxins. Toxins 2018, 10, 82. [Google Scholar] [CrossRef] [PubMed]
- Polito, L.; Djemil, A.; Bortolotti, M. Plant Toxin-Based Immunotoxins for Cancer Therapy: A Short Overview. Biomedicines 2016, 4, 12. [Google Scholar] [CrossRef]
- Ferreras, J.M.; Citores, L.; Iglesias, R.; Jimenez, P.; Girbes, T. Use of ribosome-inactivating proteins from Sambucus for the construction of immunotoxins and conjugates for cancer therapy. Toxins 2011, 3, 420–441. [Google Scholar] [CrossRef]
- Reisbig, R.R.; Bruland, O. Dianthin 30 and 32 from Dianthus caryophyllus: Two inhibitors of plant protein synthesis and their tissue distribution. Arch. Biochem. Biophys. 1983, 224, 700–706. [Google Scholar] [CrossRef]
- Fuchs, H. Dianthin and Its Potential in Targeted Tumor Therapies. Toxins 2019, 11, 592. [Google Scholar] [CrossRef] [PubMed]
- Stirpe, F.; Williams, D.G.; Onyon, L.J.; Legg, R.F.; Stevens, W.A. Dianthins, ribosome-damaging proteins with anti-viral properties from Dianthus caryophyllus L. (carnation). Biochem. J. 1981, 195, 399–405. [Google Scholar] [CrossRef]
- Legname, G.; Bellosta, P.; Gromo, G.; Modena, D.; Keen, J.N.; Roberts, L.M.; Lord, J.M. Nucleotide sequence of cDNA coding for dianthin 30, a ribosome inactivating protein from Dianthus caryophyllus. Biochim. Biophys. Acta 1991, 1090, 119–122. [Google Scholar] [CrossRef] [PubMed]
- Legname, G.; Fossati, G.; Monzini, N.; Gromo, G.; Marcucci, F.; Mascagni, P.; Modena, D. Heterologous expression, purification, activity and conformational studies of different forms of dianthin 30. Biomed. Pept. Proteins Nucleic Acids 1995, 1, 61–68. [Google Scholar] [PubMed]
- Sama, S.; Jerz, G.; Schmieder, P.; Woith, E.; Melzig, M.F.; Weng, A. Sapofectosid—Ensuring non-toxic and effective DNA and RNA delivery. Int. J. Pharm. 2017, 534, 195–205. [Google Scholar] [CrossRef] [PubMed]
- Kurinov, I.V.; Rajamohan, F.; Uckun, F.M. High resolution X-ray structure and potent anti-HIV activity of recombinant dianthin antiviral protein. Arzneimittelforschung 2004, 54, 692–702. [Google Scholar] [CrossRef] [PubMed]
- Di Maro, A.; Citores, L.; Russo, R.; Iglesias, R.; Ferreras, J.M. Sequence comparison and phylogenetic analysis by the Maximum Likelihood method of ribosome-inactivating proteins from angiosperms. Plant Mol. Biol. 2014, 85, 575–588. [Google Scholar] [CrossRef] [PubMed]
- Wells, J.A. Systematic mutational analyses of protein-protein interfaces. Methods Enzymol. 1991, 202, 390–411. [Google Scholar] [CrossRef]
- Cunningham, B.C.; Wells, J.A. High-resolution epitope mapping of hGH-receptor interactions by alanine-scanning mutagenesis. Science 1989, 244, 1081–1085. [Google Scholar] [CrossRef]
- Bolanos-Garcia, V.M.; Davies, O.R. Structural analysis and classification of native proteins from E. coli commonly co-purified by immobilised metal affinity chromatography. Biochim. Biophys. Acta 2006, 1760, 1304–1313. [Google Scholar] [CrossRef] [PubMed]
- Helmerhorst, E.; Chandler, D.J.; Nussio, M.; Mamotte, C.D. Real-time and Label-free Bio-sensing of Molecular Interactions by Surface Plasmon Resonance: A Laboratory Medicine Perspective. Clin. Biochem. Rev. 2012, 33, 161–173. [Google Scholar]
- Tamara, S.; den Boer, M.A.; Heck, A.J.R. High-Resolution Native Mass Spectrometry. Chem. Rev. 2022, 122, 7269–7326. [Google Scholar] [CrossRef] [PubMed]
- Weng, A. A novel adenine-releasing assay for ribosome-inactivating proteins. J. Chromatogr. B Analyt Technol. Biomed. Life Sci. 2018, 1072, 300–304. [Google Scholar] [CrossRef]
- Sama, S. Investigation of Saponins as Novel Transfection Enhancer; Free University Berlin: Berlin, Germany, 2018. [Google Scholar]
- Weise, C.; Schrot, A.; Wuerger, L.T.D.; Adolf, J.; Gilabert-Oriol, R.; Sama, S.; Melzig, M.F.; Weng, A. An unusual type I ribosome-inactivating protein from Agrostemma githago L. Sci. Rep. 2020, 10, 15377. [Google Scholar] [CrossRef] [PubMed]
- Gilabert-Oriol, R.; Thakur, M.; von Mallinckrodt, B.; Bhargava, C.; Wiesner, B.; Eichhorst, J.; Melzig, M.F.; Fuchs, H.; Weng, A. Reporter assay for endo/lysosomal escape of toxin-based therapeutics. Toxins 2014, 6, 1644–1666. [Google Scholar] [CrossRef]
- Bachran, C.; Sutherland, M.; Heisler, I.; Hebestreit, P.; Melzig, M.F.; Fuchs, H. The saponin-mediated enhanced uptake of targeted saporin-based drugs is strongly dependent on the saponin structure. Exp. Biol. Med. 2006, 231, 412–420. [Google Scholar] [CrossRef] [PubMed]
- Melzig, M.F.; Hebestreit, P.; Gaidi, G.; Lacaille-Dubois, M.A. Structure-activity-relationship of saponins to enhance toxic effects of agrostin. Planta Med. 2005, 71, 1088–1090. [Google Scholar] [CrossRef]
- Sama, S.; Jerz, G.; Thakur, M.; Melzig, M.F.; Weng, A. Structure-Activity Relationship of Transfection-Modulating Saponins—A Pursuit for the Optimal Gene Trafficker. Planta Med. 2019, 85, 513–518. [Google Scholar] [CrossRef]
- Scott, C.C.; Gruenberg, J. Ion flux and the function of endosomes and lysosomes: pH is just the start: The flux of ions across endosomal membranes influences endosome function not only through regulation of the luminal pH. Bioessays 2011, 33, 103–110. [Google Scholar] [CrossRef]
- Gilabert-Oriol, R.; Thakur, M.; Haussmann, K.; Niesler, N.; Bhargava, C.; Gorick, C.; Fuchs, H.; Weng, A. Saponins from Saponaria officinalis L. Augment the Efficacy of a Rituximab-Immunotoxin. Planta Med. 2016, 82, 1525–1531. [Google Scholar] [CrossRef] [PubMed]
- Wilkins, M.R.; Gasteiger, E.; Bairoch, A.; Sanchez, J.C.; Williams, K.L.; Appel, R.D.; Hochstrasser, D.F. Protein identification and analysis tools in the ExPASy server. Methods Mol. Biol. 1999, 112, 531–552. [Google Scholar] [CrossRef] [PubMed]
- Pittaluga, E.; Poma, A.; Tucci, A.; Spano, L. Expression and characterisation in E. coli of mutant forms of saporin. J. Biotechnol. 2005, 117, 263–266. [Google Scholar] [CrossRef] [PubMed]
- Bagga, S.; Seth, D.; Batra, J.K. The cytotoxic activity of ribosome-inactivating protein saporin-6 is attributed to its rRNA N-glycosidase and internucleosomal DNA fragmentation activities. J. Biol. Chem. 2003, 278, 4813–4820. [Google Scholar] [CrossRef] [PubMed]
- Ghosh, P.; Batra, J.K. The differential catalytic activity of ribosome-inactivating proteins saporin 5 and 6 is due to a single substitution at position 162. Biochem. J. 2006, 400, 99–104. [Google Scholar] [CrossRef] [PubMed]
- Maras, B.; Ippoliti, R.; De Luca, E.; Lendaro, E.; Bellelli, A.; Barra, D.; Bossa, F.; Brunori, M. The amino acid sequence of a ribosome-inactivating protein from Saponaria officinalis seeds. Biochem. Int. 1990, 21, 831–838. [Google Scholar] [PubMed]
- Laimer, J.; Hiebl-Flach, J.; Lengauer, D.; Lackner, P. MAESTROweb: A web server for structure-based protein stability prediction. Bioinformatics 2016, 32, 1414–1416. [Google Scholar] [CrossRef] [PubMed]
- Laimer, J.; Hofer, H.; Fritz, M.; Wegenkittl, S.; Lackner, P. MAESTRO--multi agent stability prediction upon point mutations. BMC Bioinform. 2015, 16, 116. [Google Scholar] [CrossRef] [PubMed]
- Hebestreit, P.; Weng, A.; Bachran, C.; Fuchs, H.; Melzig, M.F. Enhancement of cytotoxicity of lectins by Saponinum album. Toxicon 2006, 47, 330–335. [Google Scholar] [CrossRef]
- Hoie, M.H.; Kiehl, E.N.; Petersen, B.; Nielsen, M.; Winther, O.; Nielsen, H.; Hallgren, J.; Marcatili, P. NetSurfP-3.0: Accurate and fast prediction of protein structural features by protein language models and deep learning. Nucleic Acids Res. 2022, 50, W510–W515. [Google Scholar] [CrossRef]
- Bhargava, C.; Durkop, H.; Zhao, X.; Weng, A.; Melzig, M.F.; Fuchs, H. Targeted dianthin is a powerful toxin to treat pancreatic carcinoma when applied in combination with the glycosylated triterpene SO1861. Mol. Oncol. 2017, 11, 1527–1543. [Google Scholar] [CrossRef] [PubMed]
- Sehnal, D.; Bittrich, S.; Deshpande, M.; Svobodova, R.; Berka, K.; Bazgier, V.; Velankar, S.; Burley, S.K.; Koca, J.; Rose, A.S. Mol* Viewer: Modern web app for 3D visualization and analysis of large biomolecular structures. Nucleic Acids Res. 2021, 49, W431–W437. [Google Scholar] [CrossRef]
- Kelley, L.A.; Mezulis, S.; Yates, C.M.; Wass, M.N.; Sternberg, M.J. The Phyre2 web portal for protein modeling, prediction and analysis. Nat. Protoc. 2015, 10, 845–858. [Google Scholar] [CrossRef] [PubMed]
- Fermani, S.; Falini, G.; Ripamonti, A.; Polito, L.; Stirpe, F.; Bolognesi, A. The 1.4 anstroms structure of dianthin 30 indicates a role of surface potential at the active site of type 1 ribosome inactivating proteins. J. Struct. Biol. 2005, 149, 204–212. [Google Scholar] [CrossRef]
- Wensley, H.J.; Johnston, D.A.; Smith, W.S.; Holmes, S.E.; Flavell, S.U.; Flavell, D.J. A Flow Cytometric Method to Quantify the Endosomal Escape of a Protein Toxin to the Cytosol of Target Cells. Pharm. Res. 2019, 37, 16. [Google Scholar] [CrossRef] [PubMed]
- Edelmann, M.R.; Hauri, S. Functional in vitro assessment of modified antibodies: Impact of label on protein properties. PLoS ONE 2021, 16, e0257342. [Google Scholar] [CrossRef] [PubMed]
- Kokorin, A.; Weise, C.; Sama, S.; Weng, A. A new type 1 ribosome-inactivating protein from the seeds of Gypsophila elegans M.Bieb. Phytochemistry 2019, 157, 121–127. [Google Scholar] [CrossRef] [PubMed]
- Li, H.G.; Huang, P.L.; Zhang, D.; Sun, Y.; Chen, H.C.; Zhang, J.; Huang, P.L.; Kong, X.P.; Lee-Huang, S. A new activity of anti-HIV and anti-tumor protein GAP31: DNA adenosine glycosidase--structural and modeling insight into its functions. Biochem. Biophys. Res. Commun. 2010, 391, 340–345. [Google Scholar] [CrossRef] [PubMed]
- Rutenber, E.; Katzin, B.J.; Ernst, S.; Collins, E.J.; Mlsna, D.; Ready, M.P.; Robertus, J.D. Crystallographic refinement of ricin to 2.5 A. Proteins 1991, 10, 240–250. [Google Scholar] [CrossRef]
- Schlaak, L.; Weise, C.; Kuropka, B.; Weng, A. Sapovaccarin-S1 and -S2, Two Type I RIP Isoforms from the Seeds of Saponaria vaccaria L. Toxins 2022, 14, 449. [Google Scholar] [CrossRef]
- Tahirov, T.H.; Lu, T.H.; Liaw, Y.C.; Chen, Y.L.; Lin, J.Y. Crystal structure of abrin-a at 2.14 A. J. Mol. Biol. 1995, 250, 354–367. [Google Scholar] [CrossRef] [PubMed]
- Fermani, S.; Tosi, G.; Farini, V.; Polito, L.; Falini, G.; Ripamonti, A.; Barbieri, L.; Chambery, A.; Bolognesi, A. Structure/function studies on two type 1 ribosome inactivating proteins: Bouganin and lychnin. J. Struct. Biol. 2009, 168, 278–287. [Google Scholar] [CrossRef]
- Armstrong, J.A.; Schulz, J.R. Agarose gel electrophoresis. Curr. Protoc. Essent. Lab. Tech. 2015, 10, 7.2.1–7.2.22. [Google Scholar] [CrossRef]
- Laemmli, U.K. Cleavage of structural proteins during the assembly of the head of bacteriophage T4. Nature 1970, 227, 680–685. [Google Scholar] [CrossRef] [PubMed]
- Neuhoff, V.; Arold, N.; Taube, D.; Erhardt, W. Improved staining of proteins in polyacrylamide gels including isoelectric focusing gels with clear background at nanogram sensitivity using Coomassie Brillant Blue G-250 and R-250. Electrophoresis 1988, 9, 255–262. [Google Scholar] [CrossRef] [PubMed]
- Mosmann, T. Rapid colorimetric assay for cellular growth and survival: Application to proliferation and cytotoxicity assays. J. Immunol. Methods 1983, 65, 55–63. [Google Scholar] [CrossRef] [PubMed]
- Shevchenko, A.; Wilm, M.; Vorm, O.; Mann, M. Mass spectrometric sequencing of proteins silver-stained polyacrylamide gels. Anal. Chem. 1996, 68, 850–858. [Google Scholar] [CrossRef]
- Marty, M.T.; Baldwin, A.J.; Marklund, E.G.; Hochberg, G.K.; Benesch, J.L.; Robinson, C.V. Bayesian deconvolution of mass and ion mobility spectra: From binary interactions to polydisperse ensembles. Anal. Chem. 2015, 87, 4370–4376. [Google Scholar] [CrossRef]
Figure 1.
SDS-PAGE (12.5%, Coomassie Brillant Blue stain) analysis of Hisdianthin and Hisdianthin mutants. The purified protein fractions obtained after rapid centrifugation-based Ni-NTA purification are visualized. In total, 0.6 µg of protein was applied to each pocket. Protein marker (M, in kDa) and the reference protein Hisdianthin have the same position in each gel.
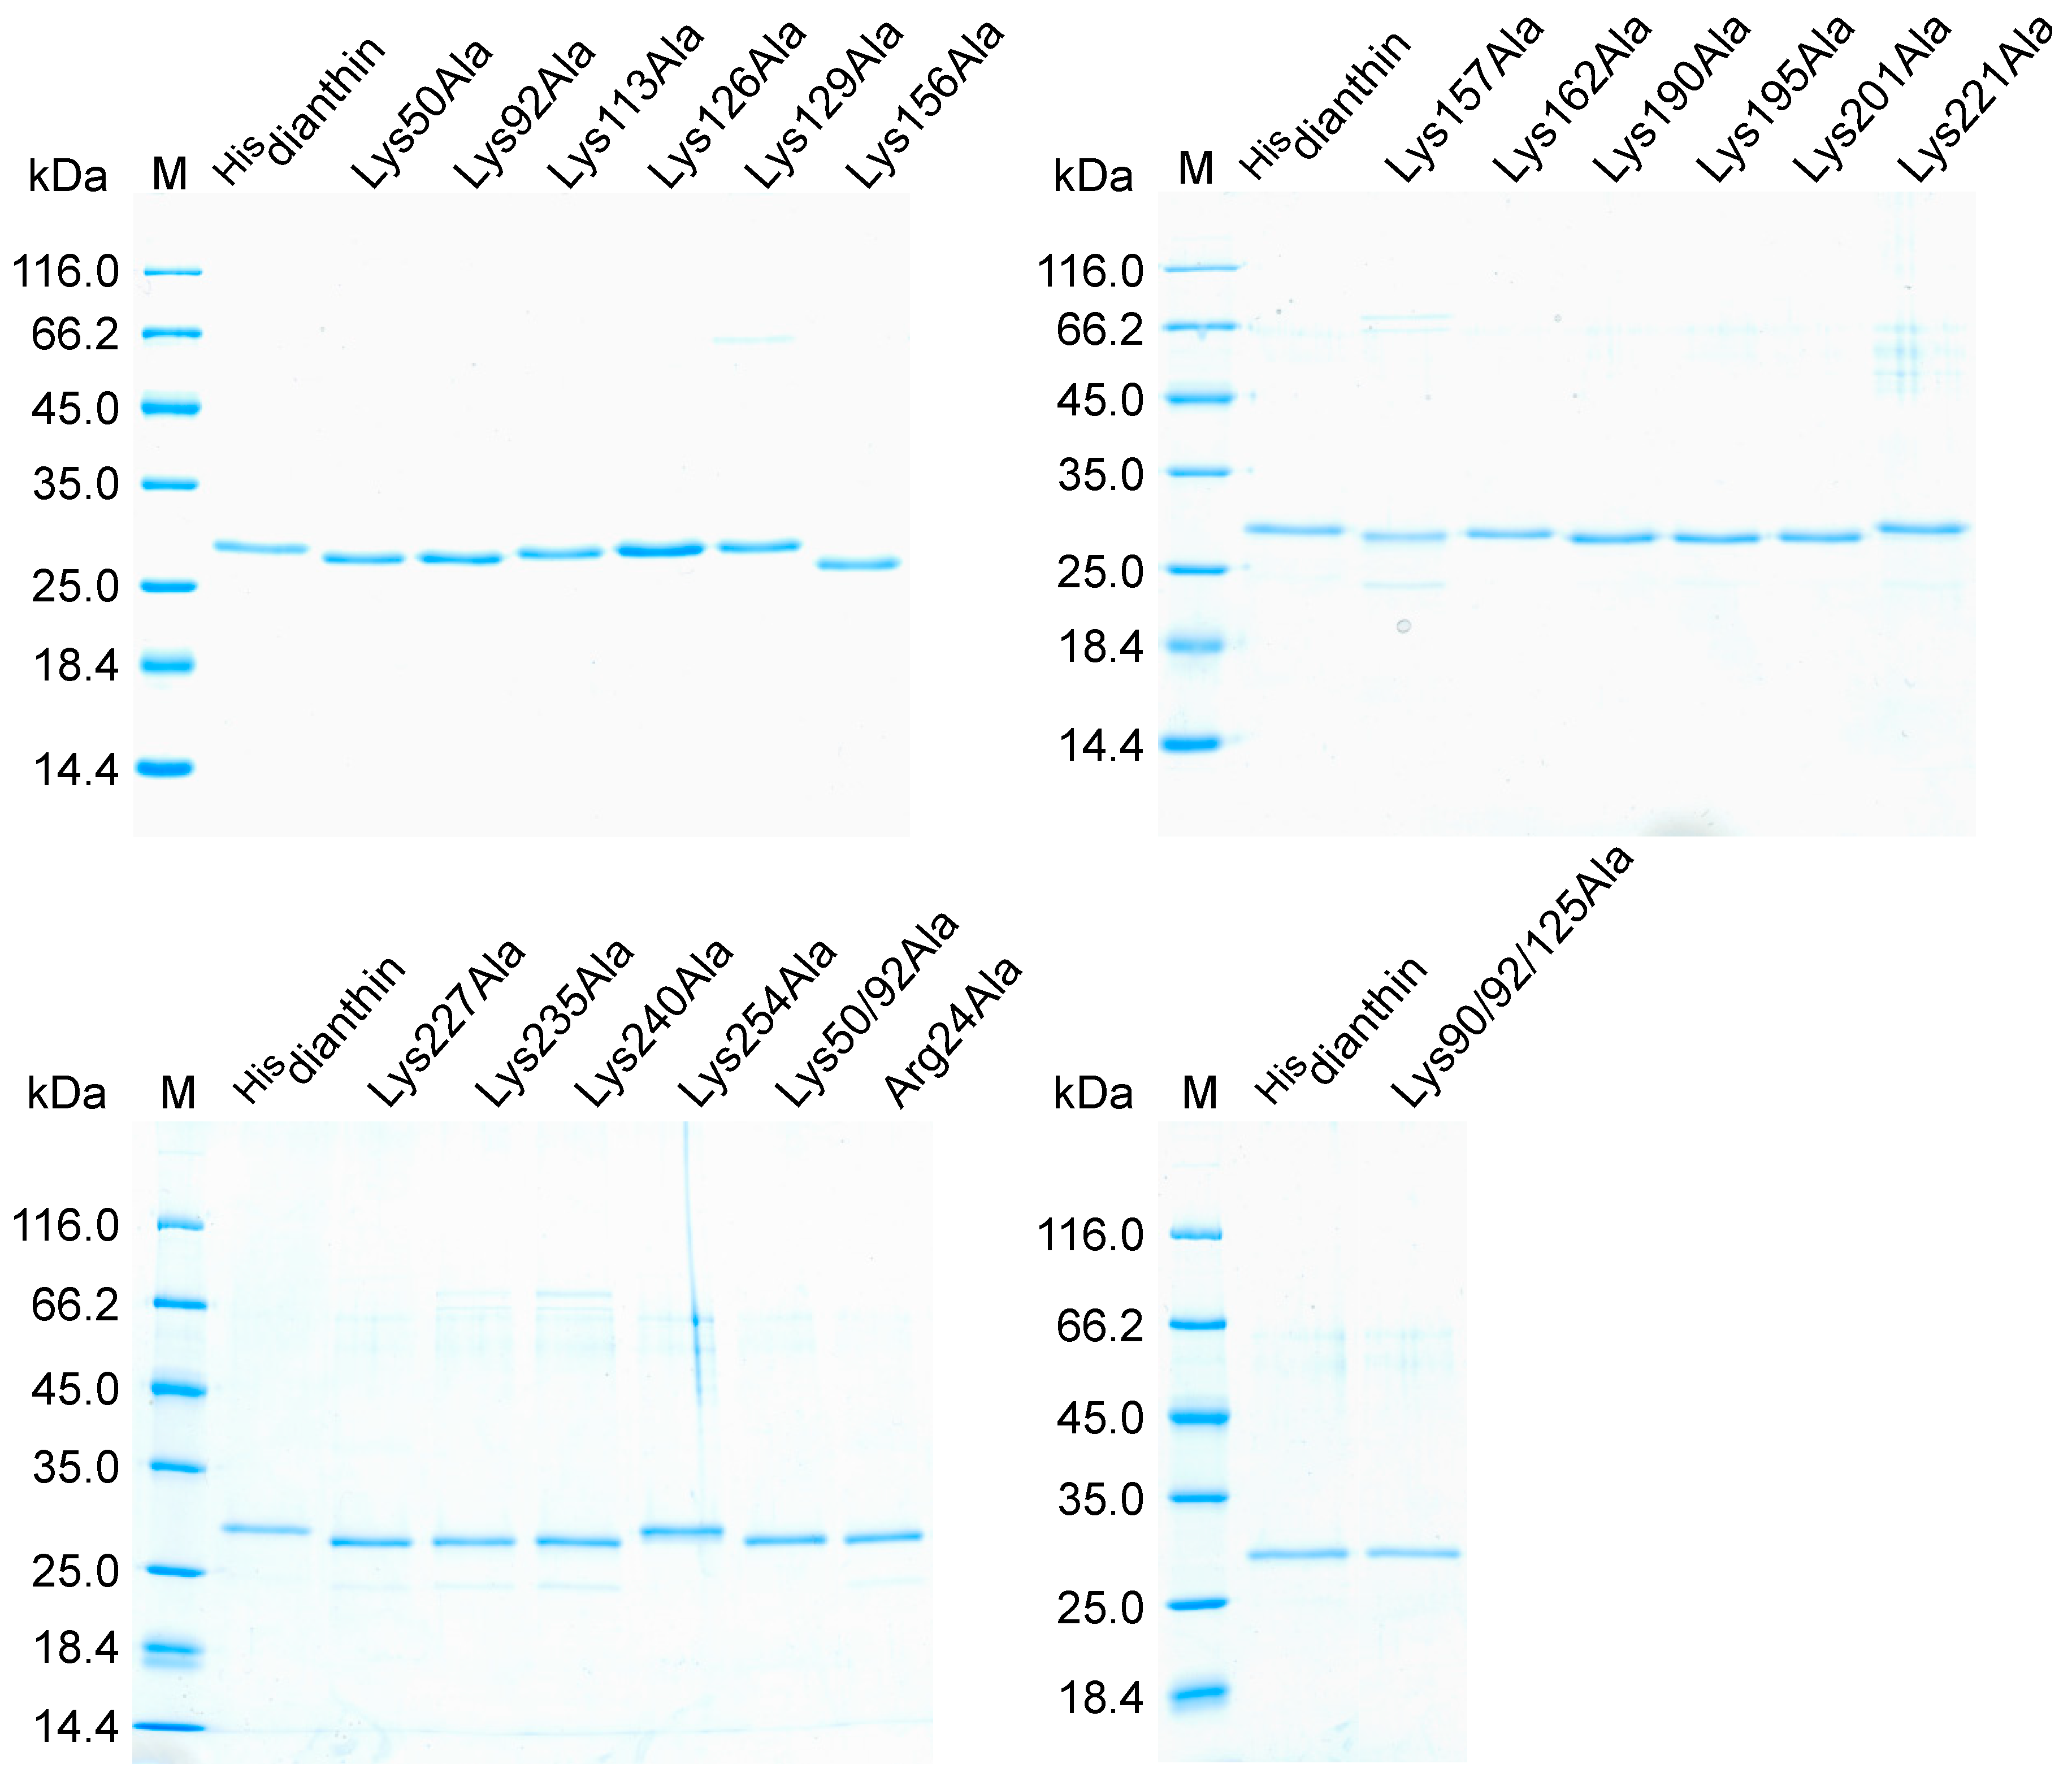
Figure 2.
Native MS analysis to study the binding of SO1861 to Hisdianthin. Samples were dissolved in 50 mM of ammonium acetate buffer (pH 6.24), and spectra were recorded with a constant protein concentration (Hisdianthin, 10 µM) and an increasing ligand concentration of SO1861 (0 to 100 µM) from top to bottom. Raw spectra are shown on the left, and corresponding deconvoluted spectra showing the experimental average protein masses are shown on the right. With the addition of SO1861, weak additional signals (highlighted by red arrows) indicate the binding of SO1861 to Hisdianthin in a 1:1 stoichiometry.

Figure 3.
N-glycosylase activity of Hisdianthin mutants in comparison with native Hisdianthin. The adenine-releasing assay was performed with a protein concentration of 169 nM and 21.4 µM of A30 substrate overnight at 37 °C. The activities of Hisdianthin mutants were calculated as percentages related to the activity of Hisdianthin. Lysine substitution at positions 50, 113, 157, 221 and 227 and combined alanine substitutions at positions 50/92 and 50/92/126 significantly reduced the N-glycosylase activity. Values represent the means ± standard deviation of three independent measurements; n = 3 (significance: * p ≤ 0.05; ** p ≤ 0.01; Mann–Whitney U test).
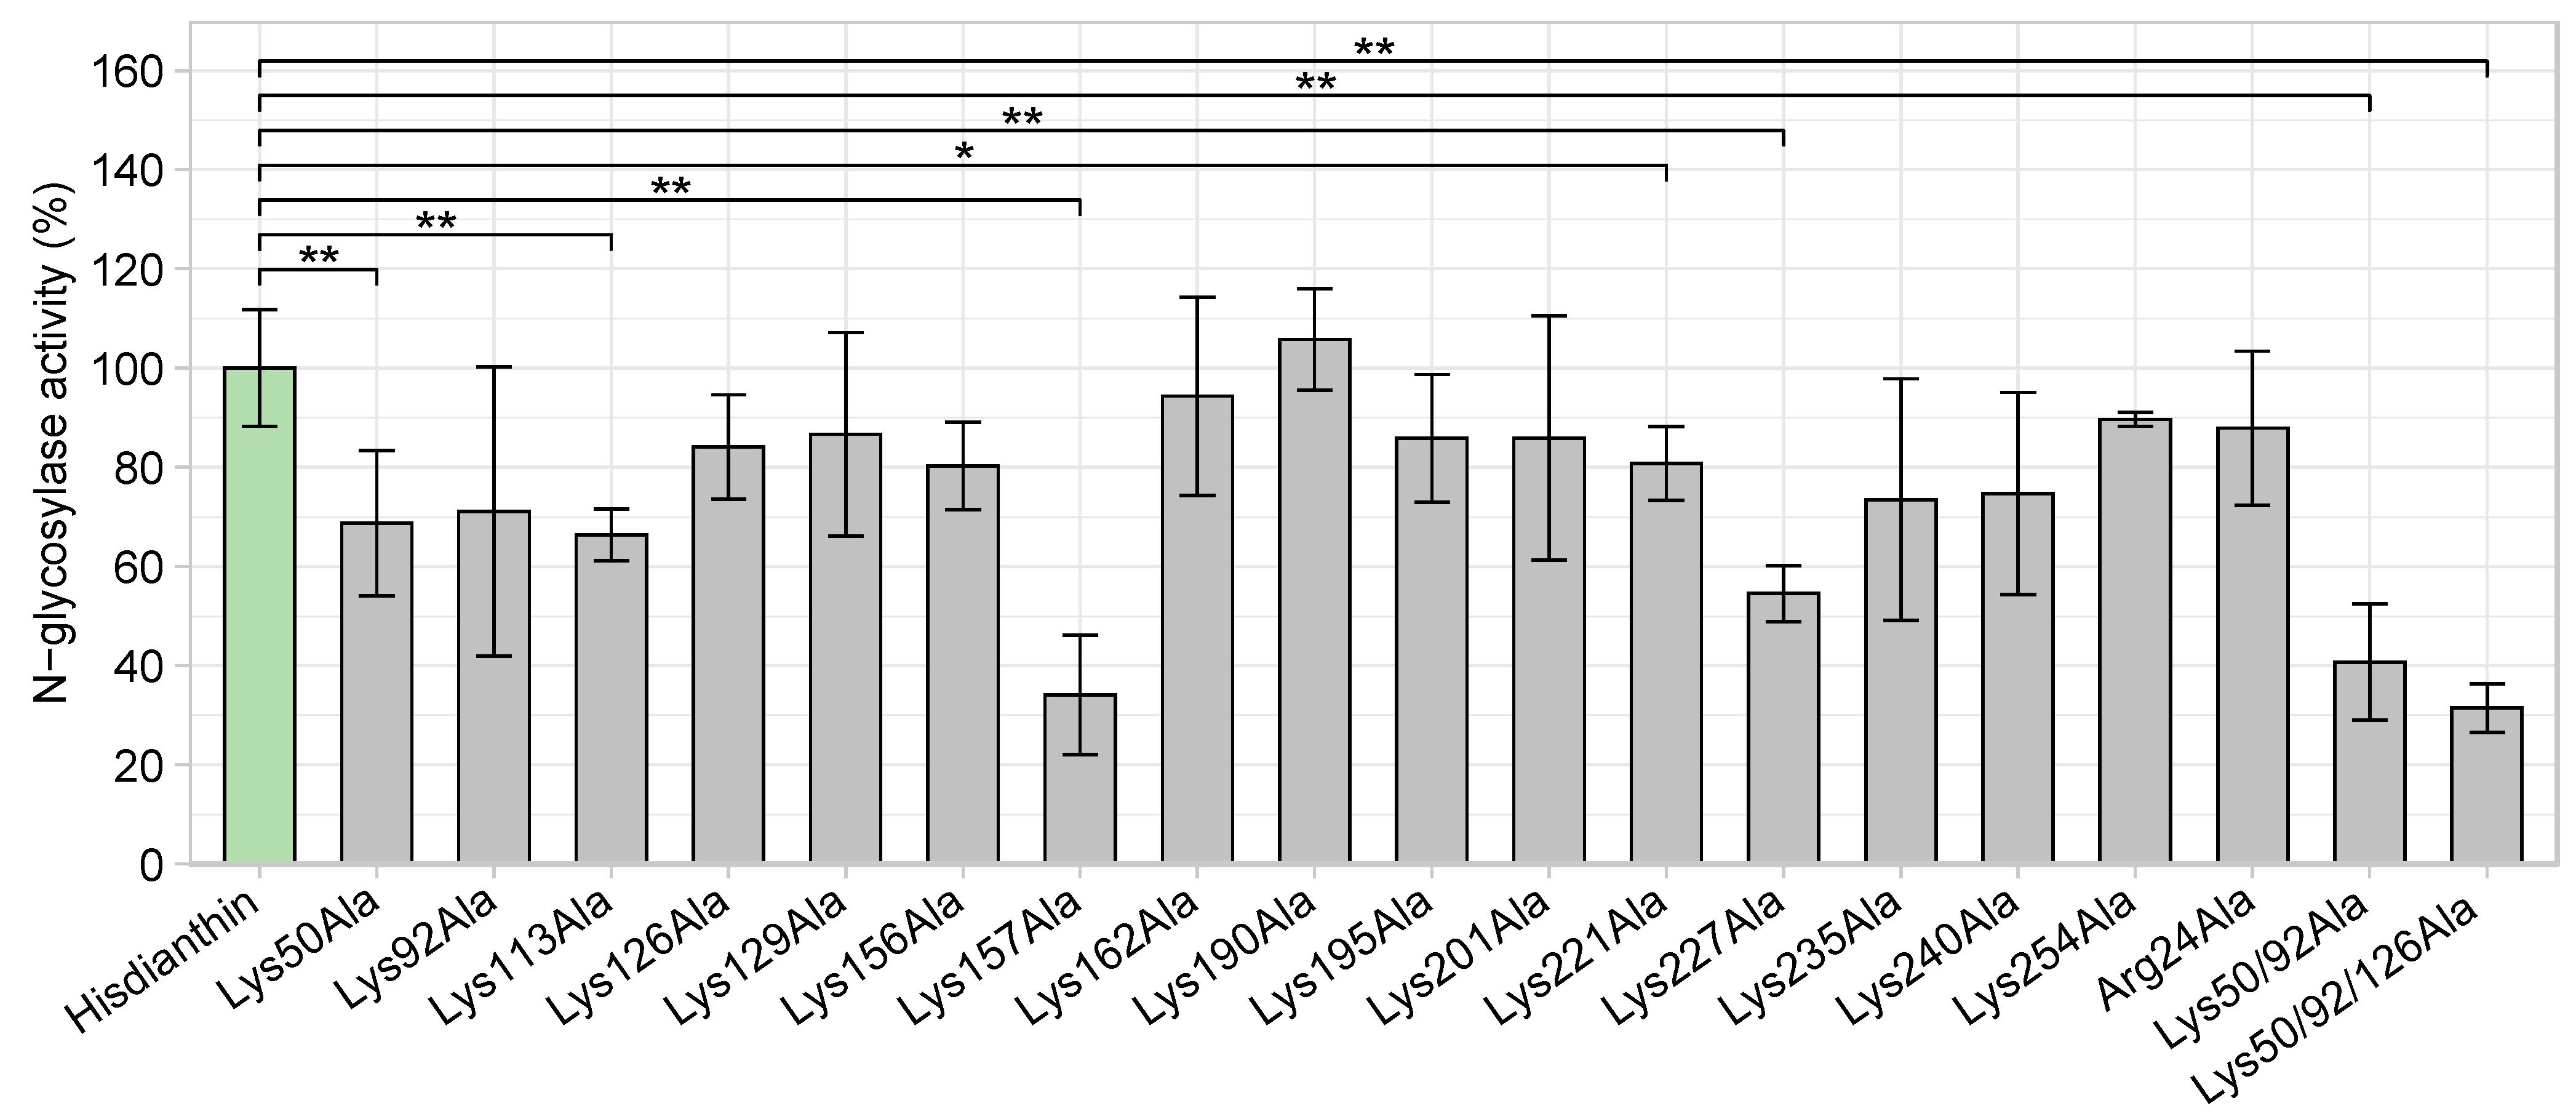
Figure 4.
Cytotoxic screening of Hisdianthin mutants in Neuro-2A cells. (A) Hisdianthin mutants Lys50Ala to Lys129Ala. (B) Hisdianthin mutants Lys156Ala to Lys190Ala. (C) Hisdianthin mutants Lys195Ala to Lys235Ala. (D) Hisdianthin mutants Lys240Ala to Arg24Ala. Cytotoxicity is represented using cell growth data. The cell confluence is shown as normalized cell index, which was calculated by dividing the cell confluence at each time point by the cell confluence at the reference time point of 25 h (time point after sample addition). In total, cell confluence was recorded over 72 h using the live-cell imaging CytoSMART Omni system. Then, 24 h after seeding the cells, 1 nM of Hisdianthin mutant either with the addition of 1 µg/mL of SO1861 or without the addition of SO1861 (1 nM Hisdianthin mutant ± 1 µg/mL SO1861) was added and incubated for 48 h. Control cells were treated the same way. As a positive control, 1 nM of native Hisdianthin ± 1 µg/mL SO1861 was used, and as a negative control, PBS ± 1 µg/mL SO1861 was used. Samples without the addition of SO1861 should have no effect on cell growth. The addition of SO1861 should reveal the cytotoxic effect of the Hisdianthin mutants and the Hisdianthin control. The samples without the addition of SO1861 are shown as solid lines, while the samples with the addition of SO1861 are shown as dashed lines. Data are shown as means of three independent measurements, each in triplicate (n = 3). For clarity, the standard deviation is not shown.
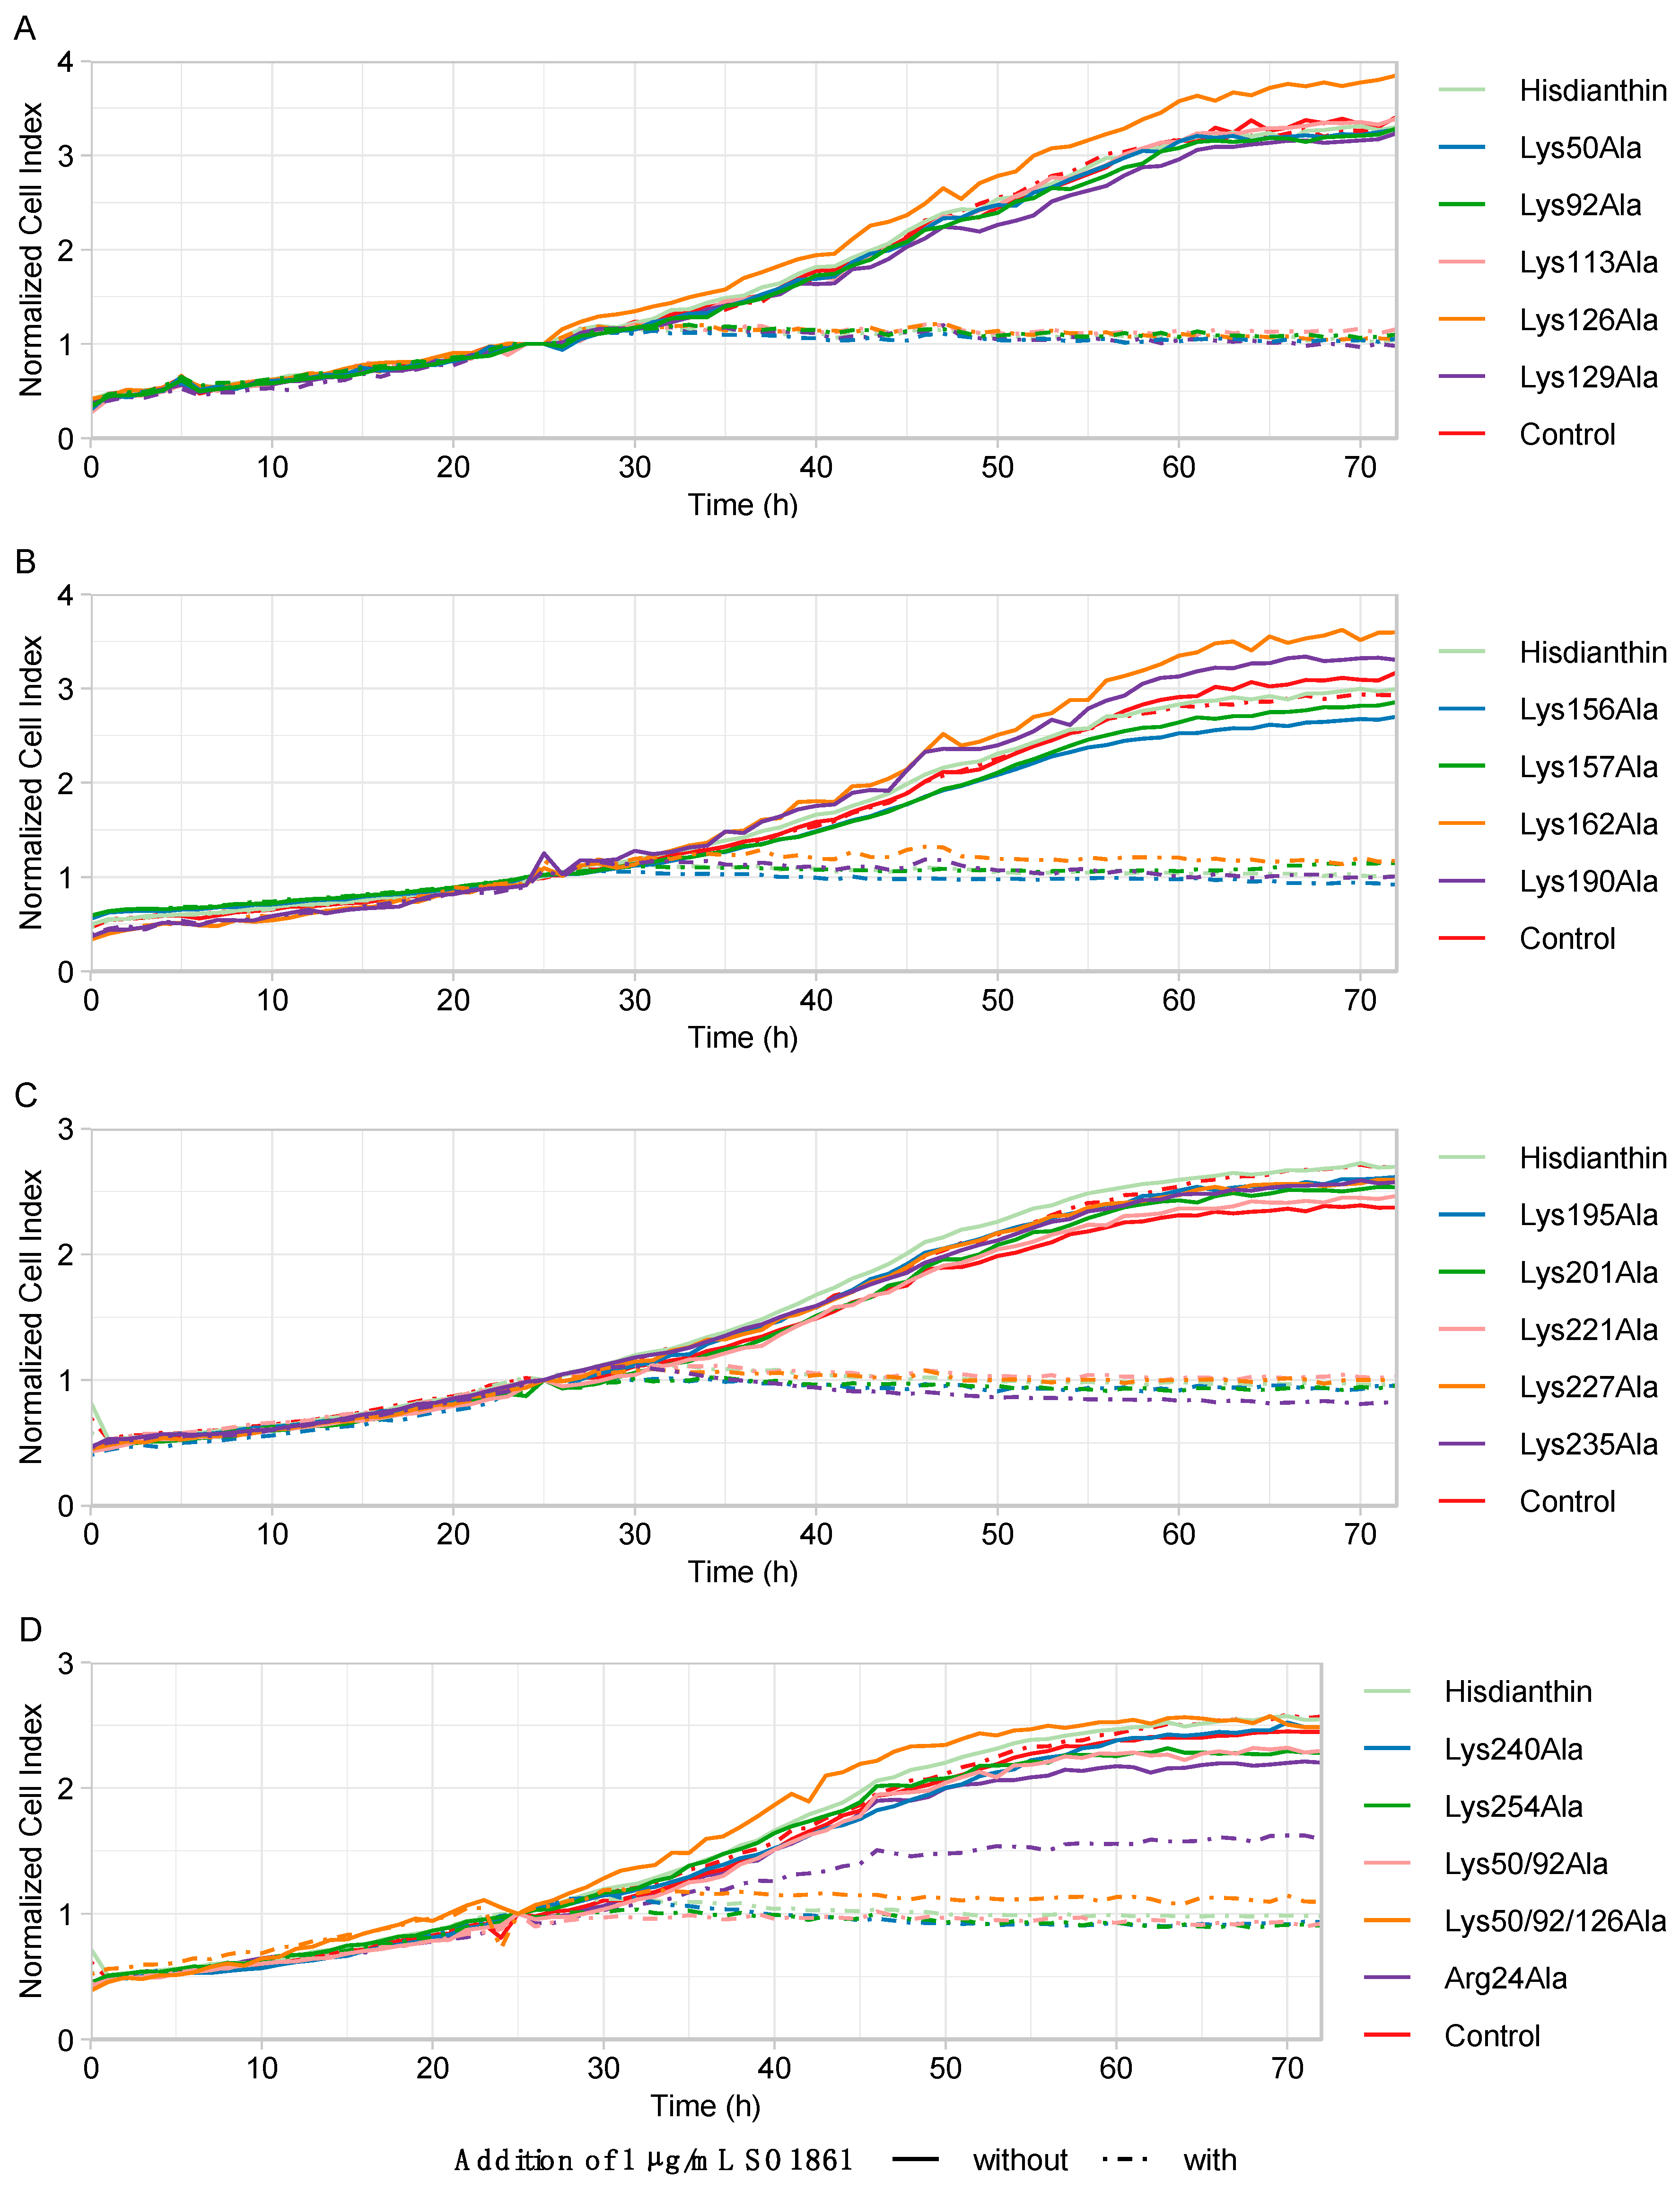
Figure 5.
Cytotoxicity of Hisdianthin Arg24Ala in three cell lines. A2058 cells (A), HCT116 cells (B), and Neuro-2A cells (C) were incubated with 0.1 nM and 1 nM of Hisdianthin and Hisdianthin Arg24Ala ± 1 µg/mL of SO1861 for 48 h, respectively. Control cells were equivalently treated with PBS ± 1 µg/mL of SO1861. After 48 h of incubation, an MTT assay was performed. The presented cell viability was calculated relative to the control cells. The Arg24Ala mutation caused significantly reduced synergistic cytotoxicity (+SO1861) in all cell lines compared with native Hisdianthin. Data are shown as means ± standard deviation of three independent measurements, each in triplicate; n = 3 (Significance: **** p ≤ 0.0001, Student’s t-test).

Figure 6.
Cytotoxicity of high concentrations of Hisdianthin Arg24Ala. Neuro-2A cells were incubated with either 10 nM, 100 nM or 1000 nM Hisdianthin and Hisdianthin Arg24Ala without the addition of SO1861 (A) and with the addition of 1 µg/mL of SO1861 (B) for 48 h. Control cells were treated equivalently with PBS ± 1 µg/mL of SO1861. At the end of incubation, an MTT assay was performed. (A) Without the addition of SO1861, Hisdianthin Arg24Ala was not cytotoxic even at high concentrations, whereas native Hisdianthin showed cytotoxicity above a concentration of 100 nM, even without the addition of SO1861. The cytotoxicity of the native and mutant forms differed significantly above a concentration of 100 nM. Data are shown as means ± standard deviation of three independent measurements, each in triplicate; n = 3 (significance: ** p ≤ 0.01; **** p ≤ 0.0001; Student’s t-test). (B) the addition of SO1861 caused an increase in cytotoxicity in both forms. The cytotoxicity differences in both forms were significant at 10 nM and at 1000 nM. Data are shown as means ± standard deviation of three independent measurements, each in triplicate; n = 3 (significance: * p ≤ 0.05; ** p ≤ 0.01; Mann–Whitney U test).
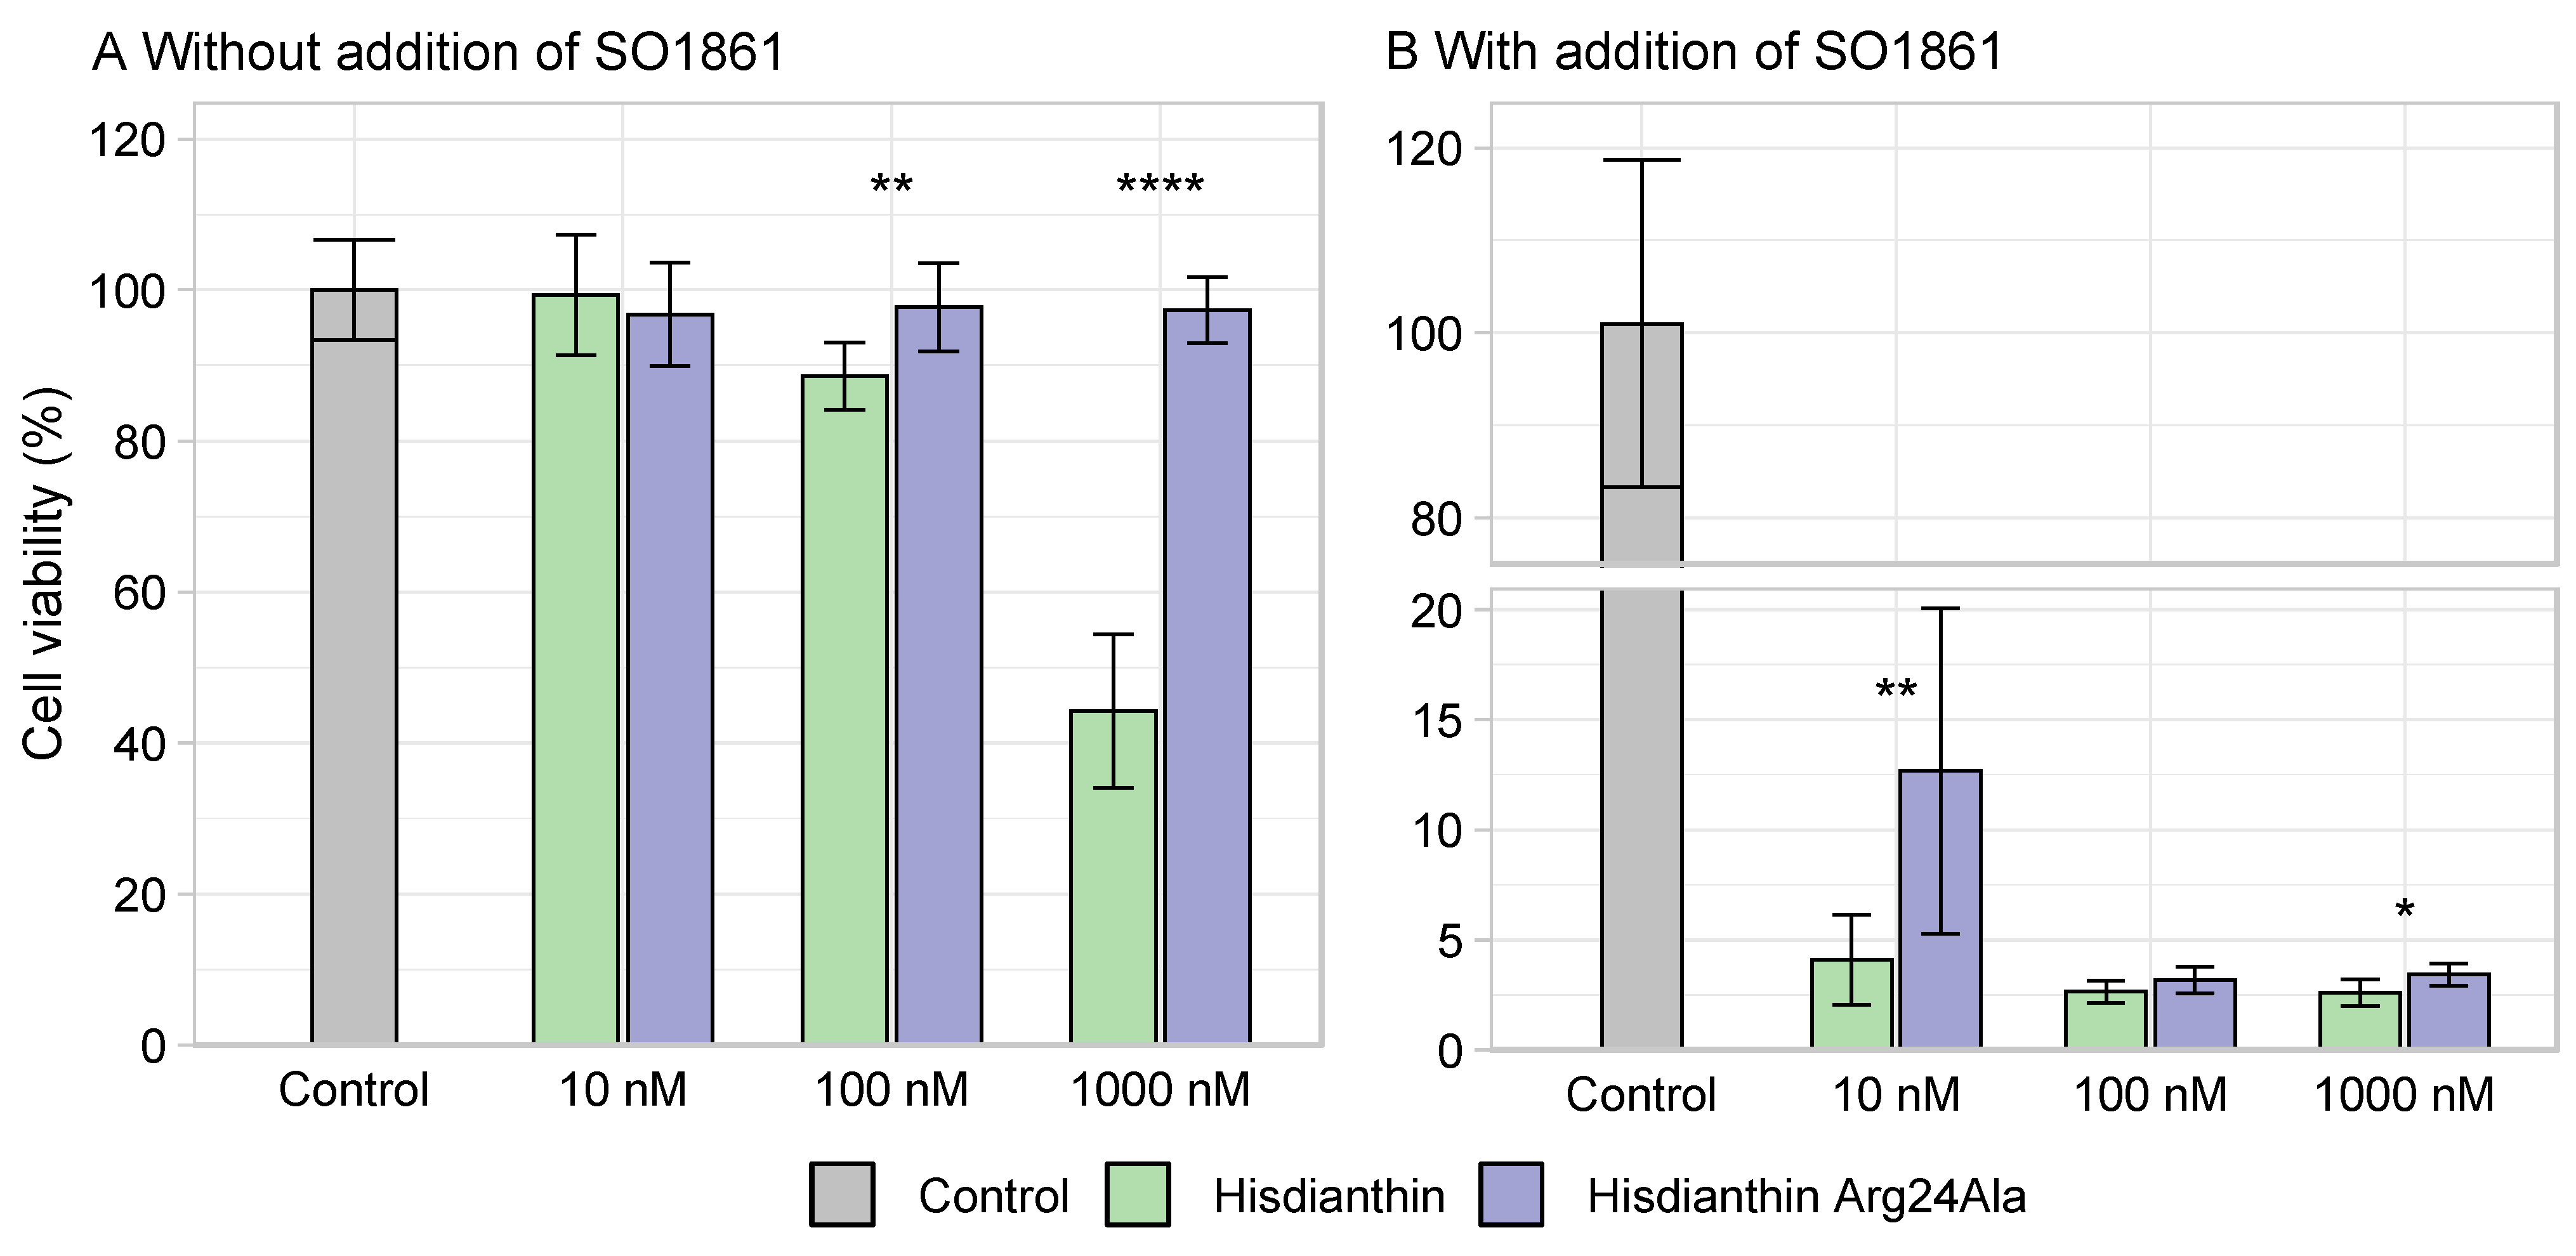
Figure 7.
Characterization of Hisdianthin-CF568 and Hisdianthin Arg24Ala-CF568. (A) SDS-PAGE (12.5%, Coomassie Brillant Blue stain) of the labeling reaction of Hisdianthin und Hisdianthin Arg24Ala with CF®568 resulted in clean labeling products (each one a diffuse band at 30–33 kDa). Equivalent section: Left side is shown under daylight and right side at 366 nm. Lane I: Protein marker (in kDa). Lane II: Hisdianthin (2.0 µg). Lane III: Hisdianthin Arg24Ala (2.0 µg). Lane IV: Hisdianthin-CF568 (2.3 µg). Lane V: Hisdianthin Arg24Ala-CF568 (2.3 µg). (B) Fluorescence intensity of Hisdianthin-CF568 and Hisdianthin Arg24Ala-CF568 at 560/10 nm (excitation wavelength) and 595/35 nm (emission wavelength). No significant difference in intensity was measured at 100 nM or at 1000 nM of Hisdianthin-CF568 and Hisdianthin Arg24Ala-CF568. PBS was measured as a control. Data are shown as means ± standard deviation of three independent measurements, each in triplicate; n = 3 (significance: Mann–Whitney U test). (C) N-glycosylase activity of Hisdianthin-CF568 and Hisdianthin Arg24Ala-CF568. The adenine-releasing assay was performed with a protein concentration of 169 nM and 21.4 µM of A30 substrate at 37 °C overnight. Labeling with fluorescent dye CF®568 resulted in complete loss of activity in Hisdianthin-CF568 and Hisdianthin Arg24Ala-CF568. The means ± standard deviation of three independent measurements are shown; n = 3 (significance: ** p ≤ 0.01; Student’s t-test).
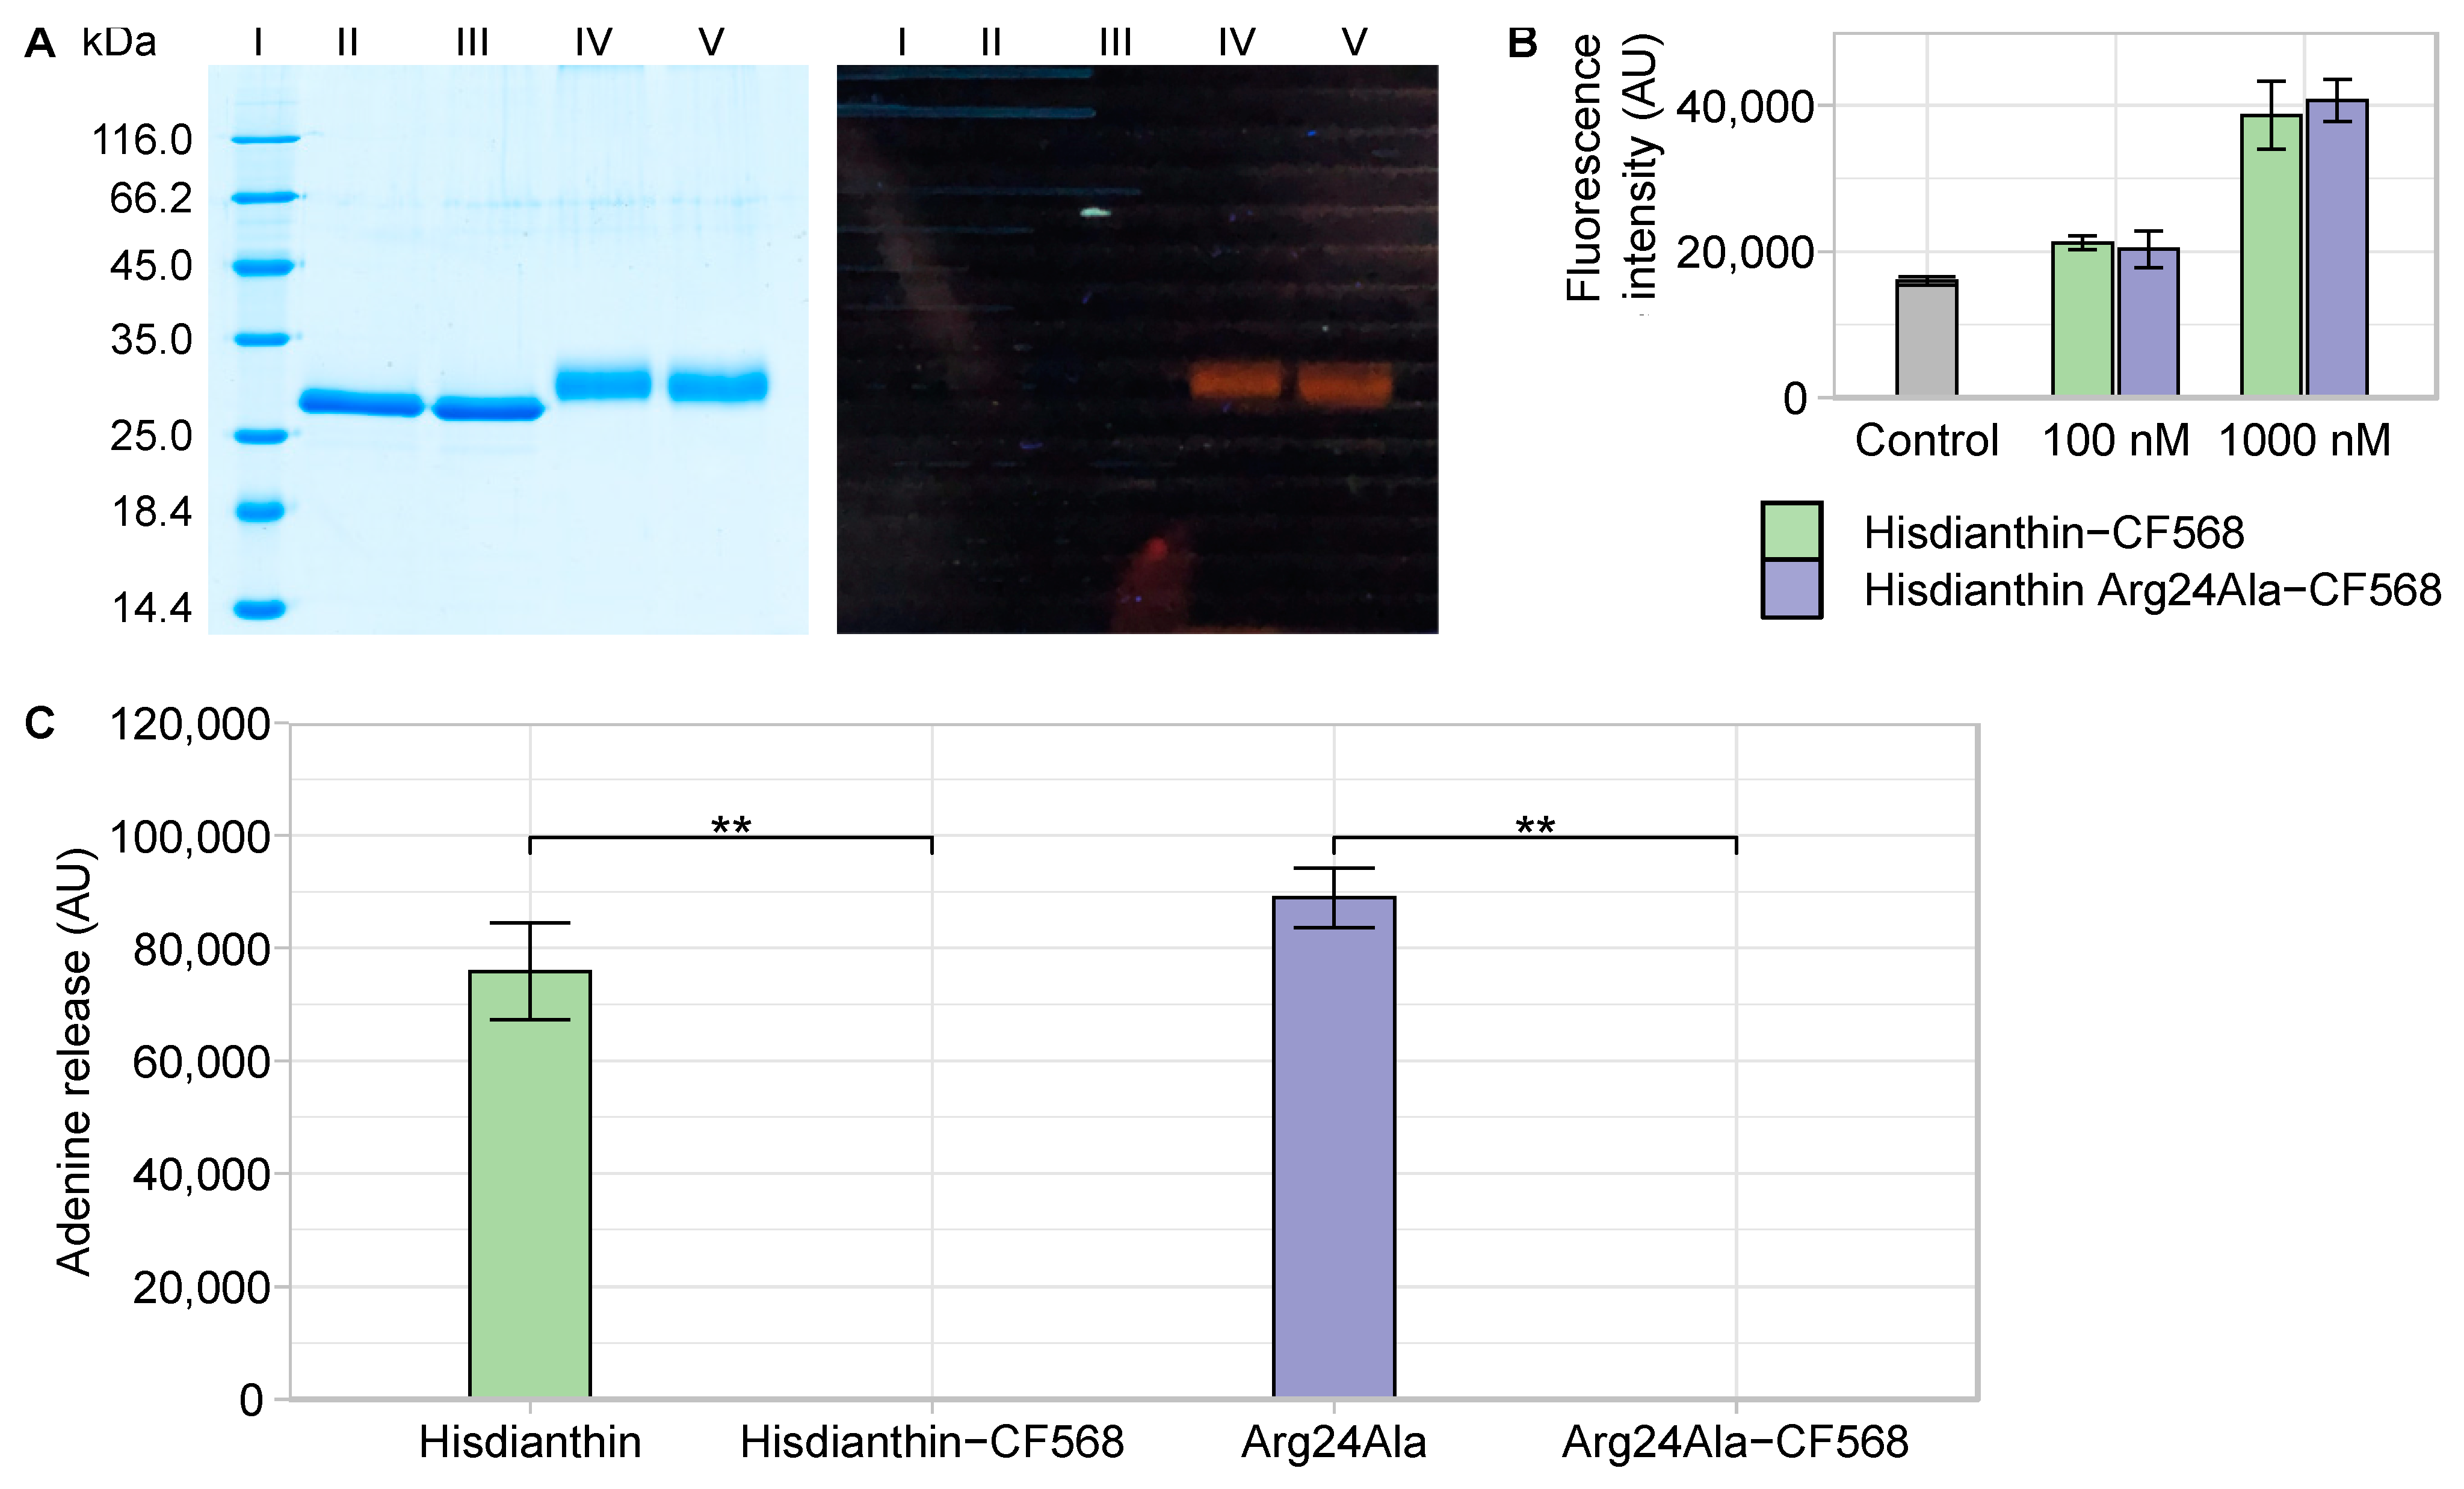
Figure 8.
Endocytosis of Hisdianthin-CF568 and Hisdianthin Arg24Ala-CF568. Neuro-2A cells were incubated for 0, 2, 6, 16 and 24 h with 100 nM of Hisdianthin-CF568 and Hisdianthin Arg24Ala-CF568. After incubation with a labeled protein, the cell culture medium was removed, and cells were analyzed by flow cytometry using the peak height of the PE channel. Endocytosis was measured by means of fluorescence intensity increase. After 6 h, Hisdianthin-CF568 and Hisdianthin Arg24Ala-CF568 differed significantly in their endocytosis, where, first, Hisdianthin Arg24Ala-CF568 and, after 16 h, Hisdianthin-CF568 were more endocytosed. At least 10,000 cells per sample were measured. Only single cells were included in the analysis; doublets and debris were excluded. The means ± standard deviation of three independent measurements are shown; n = 3 (significance: * p ≤ 0.05; ** p ≤ 0.01; **** p ≤ 0.0001; Student’s t-test).


Table 1.
Primers used for site-directed mutagenesis of Hisdianthin. Underlined bases represent the mutated nucleotides that cause the exchange of arginine to alanine or lysine to alanine at the protein level. Primer sequences and their annealing temperatures (Ta) were generated with NEBaseChanger® (New England Biolabs, Ipswich, MA, USA). Primers were synthesized by Metabion (Planegg/Steinkirchen, Germany).
| Mutation | Sequence | Ta (°C) |
|---|---|---|
| Arg24Ala | forward 5′-GGA TCA AAT CGC AAA CAA TGT GAG G-3′ | 56 |
| reverse 5′-AGA AAA GAT GAG TAT TGA CTC-3′ | ||
| Lys125Ala | forward 5′-CTT GGT TAC CGC GAA CTT CCC AAA C-3′ | 58 |
| reverse 5′-TTC TGT ATG TAC CTA AAT CG-3′ | ||
| Lys227Ala | forward 5′-CGT GTT TAA TGC AGA TTA TGA TTT CGG G-3′ | 59 |
| reverse 5′-AGA AAA GAT GAG TAT TGA CTC-3′ |
Disclaimer/Publisher’s Note: The statements, opinions and data contained in all publications are solely those of the individual author(s) and contributor(s) and not of MDPI and/or the editor(s). MDPI and/or the editor(s) disclaim responsibility for any injury to people or property resulting from any ideas, methods, instructions or products referred to in the content. |
© 2024 by the authors. Licensee MDPI, Basel, Switzerland. This article is an open access article distributed under the terms and conditions of the Creative Commons Attribution (CC BY) license (https://creativecommons.org/licenses/by/4.0/).
Share and Cite
MDPI and ACS Style
Schlaak, L.; Weise, C.; Kuropka, B.; Weng, A. Mutational Analysis of RIP Type I Dianthin-30 Suggests a Role for Arg24 in Endocytosis. Toxins 2024, 16, 219. https://doi.org/10.3390/toxins16050219
AMA Style
Schlaak L, Weise C, Kuropka B, Weng A. Mutational Analysis of RIP Type I Dianthin-30 Suggests a Role for Arg24 in Endocytosis. Toxins. 2024; 16(5):219. https://doi.org/10.3390/toxins16050219
Chicago/Turabian StyleSchlaak, Louisa, Christoph Weise, Benno Kuropka, and Alexander Weng. 2024. "Mutational Analysis of RIP Type I Dianthin-30 Suggests a Role for Arg24 in Endocytosis" Toxins 16, no. 5: 219. https://doi.org/10.3390/toxins16050219
Note that from the first issue of 2016, this journal uses article numbers instead of page numbers. See further details here.