Article

Fumonisin B1 Inhibits Cell Proliferation and Decreases Barrier Function of Swine Umbilical Vein Endothelial Cells

Provincial Key Laboratory of Protein Engineering in Animal Vaccines, College of Veterinary Medicine, Hunan Agricultural University, Changsha 410128, China
*
Authors to whom correspondence should be addressed.
Both authors contributed equally to this article.
Toxins 2021, 13(12), 863; https://doi.org/10.3390/toxins13120863
Submission received: 7 November 2021 / Revised: 25 November 2021 / Accepted: 29 November 2021 / Published: 3 December 2021

Abstract

:
The fumonisins are a group of common mycotoxins found around the world that mainly contaminate maize. As environmental toxins, they pose a threat to human and animal health. Fumonisin B1 (FB1) is the most widely distributed and the most toxic. FB1 can cause pulmonary edema in pigs. However, the current toxicity mechanism of fumonisins is still in the exploratory stage, which may be related to sphingolipid metabolism. Our study is designed to investigate the effect of FB1 on the cell proliferation and barrier function of swine umbilical vein endothelial cells (SUVECs). We show that FB1 can inhibit the cell viability of SUVECs. FB1 prevents cells from entering the S phase from the G1 phase by regulating the expression of the cell cycle-related genes cyclin B1, cyclin D1, cyclin E1, Cdc25c, and the cyclin-dependent kinase-4 (CDK-4). This results in an inhibition of cell proliferation. In addition, FB1 can also change the cell morphology, increase paracellular permeability, destroy tight junctions and the cytoskeleton, and reduce the expression of tight junction-related genes claudin 1, occludin, and ZO-1. This indicates that FB1 can cause cell barrier dysfunction of SUVECs and promote the weakening or even destruction of the connections between endothelial cells. In turn, this leads to increased blood vessel permeability and promotes exudation. Our findings suggest that FB1 induces toxicity in SUVECs by affecting cell proliferation and disrupting the barrier function.
Key Contribution: This study demonstrated for the first time that FB1 inhibited the cell proliferation and reduced barrier function of swine umbilical vein endothelial cells, which provided insights into the mechanism of FB1 toxicity.

1. Introduction

Fumonisins are the primary mycotoxins produced by Fusarium spp. [1]. These molecules are diesters of propane-1,2,3-tricarboxylic acid with similar long-chain aminopolyol backbones [2]. FB1 is considered toxicologically the most hazardous as it constitutes the majority of naturally occurring fumonisins in food and feed [3]. Fumonisins can cause human esophageal cancer, equine leukoencephalomalacia, hepatotoxicity in mammals, atherosclerosis in primates, and other diseases or conditions [4,5,6,7]. Pulmonary edema was demonstrated to consistently develop 4–7 days after starting to feed FB1 to pigs [8,9,10]. The accumulation of membrane material was found in pulmonary intravascular macrophages of pigs with pulmonary edema where the primary site was identified as pulmonary capillary endothelial cells [11]. In addition, edema fluid appeared around blood vessels when fumonisins caused pulmonary edema in pigs [12].
Cell proliferation is a fundamental characteristic of living organisms, which requires the accumulation of intracellular biomass. Accordingly, cell metabolism is essential for a replicative cell division [13]. And toxins may cause the termination of the cell cycle by disrupting metabolism. Cells, the cornerstone of life, reproduce themselves by progressing through a series of events that is referred to as the cell cycle. This is a complex process common to cell growth and proliferation, which involves the regulation of DNA damage repair and steps like those that take place in cancer [14]. The steps are regulated by several families of molecules, namely cyclin, cyclin-dependent kinase (CDKs) and substrate proteins, CDK inhibitor (CKI), and tumor suppressor gene p53 [15,16]. These families of molecules and genes achieve the remarkable tasks of cell cycle transitions and checkpoint.
Endothelial cells connect to each other to form a cell layer that covers the surface of blood vessels to form a barrier. The special connections between adjacent cells ensure that these cellular barriers are not only stable and tight, but remain permeable. Endothelial cells utilize two types of specialized junctional complexes to mediate cell-cell interactions: tight junctions (TJs) and adhesion junctions (AJs) [17]. Tight junctions are intermingled with adhesion junctions along the cleft. Together with the cytoskeleton, they form an endothelial barrier to the endothelial cells [18]. Tight junctions consist mainly of transmembrane proteins (occludin, claudin and JAM) and cytoplasmic proteins (ZO-1, ZO-2, ZO-3) [19]. The ability of cells to maintain and change morphology, and to generate, transmit, and respond to mechanical signals depends on the cytoskeleton, a network structure of filamentous polymers and regulatory proteins in eukaryotic cells. These physiological processes are mediated by three types of cytoskeletal filament: actin, microtubules, and intermediate filaments [20]. When the dynamic equilibrium between these filaments is broken, it may lead to the rearrangement of the cytoskeleton. This affects the normal structure and function of the cell, which thus destroys cell junctions [21]. Many reports support the idea that tight junctions, adhesion junctions, and the cytoskeleton are interconnected, and that they constitute the cell barrier. In this way, the changes in tight junctions and adhesion junctions are related to the structure of the cytoskeleton.
The structural integrity of vascular endothelial cells is the basis of their normal function. We speculate that the main reasons of fumonisin induced pulmonary edema is closely related to the changes of vascular endothelial cells. However, there are very few reports on the mechanism of FB1-induced pulmonary edema in pigs [11]. Swine umbilical vein endothelial cells (SUVECs) are commonly used as an in vitro model for studying features of vascular disease. In the present study, we focused on investigating the effects of Fumonisin B1 on proliferation and barrier function of swine umbilical vein endothelial cells.

2. Results

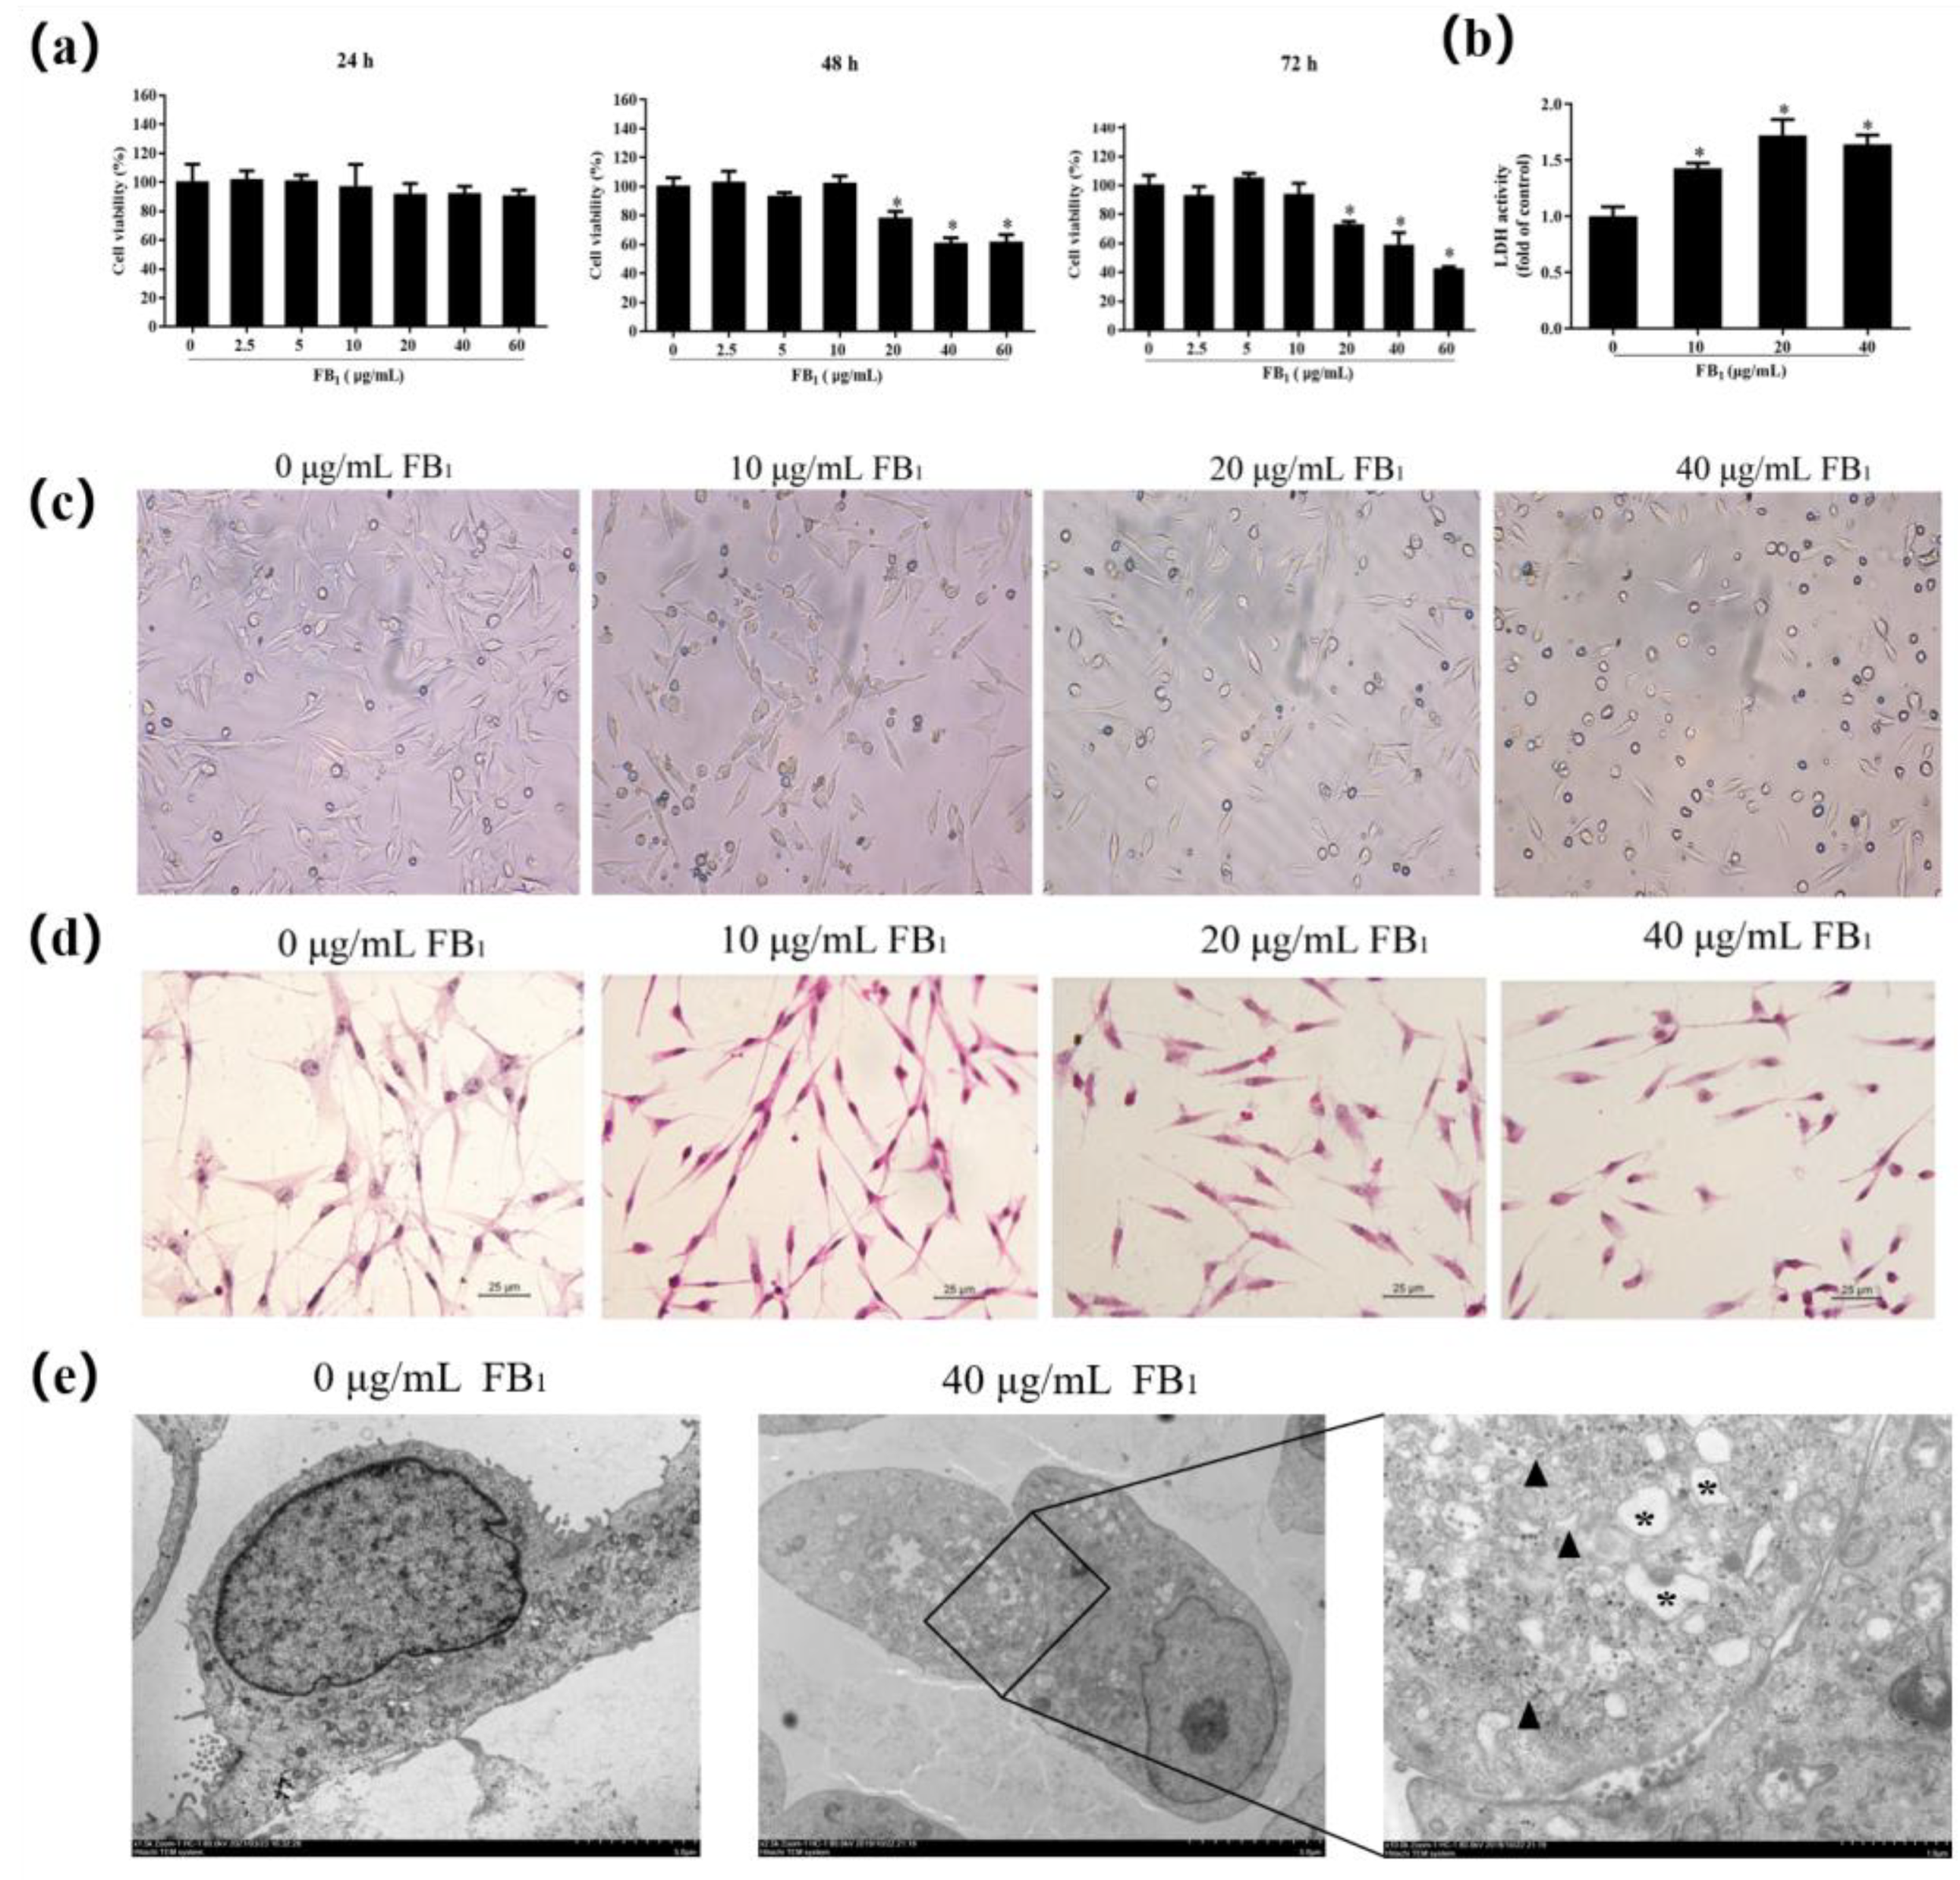
2.1. FB1 Reduces Cell Viability and Causes Cell Damage

MTT assays were performed after exposure of FB1 for 24, 48, and 72 h to evaluate the viability of SUVECs (Figure 1a). Exposure to 20, 40, and 60 μg/mL FB1 for 48 h and 72 h significantly reduced cell viability (p < 0.05). FB1 concentrations of 10, 20, and 40 μg/mL were subsequently investigated for 48 h. The LDH content in the FB1 treatment group increased significantly in a dose-dependent manner compared with the control group (Figure 1b, p < 0.05), and the increase was concentration dependent. This indicates that FB1 can reduce cell viability and increase the activity of LDH in the cell supernatant of SUVECs.
After FB1 treatment for 48 h, the experimental set of cells shriveled, and the intercellular junctions decreased significantly. The cells became round and clearly shriveled, and many cells died (Figure 1c). This was particularly apparent at a concentration of 40 μg/mL FB1. The connections between cells at 40 μg/mL FB1 were faintly visible (Figure 1d). FB1 therefore affects the cell morphology of SUVECs and causes cell shrinkage. Next, we evaluated whether exposure of FB1 could affect cell damage in SUVECs using TEM. The dilatation of the endoplasmic reticulum and the observed mitochondrial swelling were significantly increased in the FB1-treated groups (Figure 1e). Collectively, these data suggest that exposure of FB1 causes damage to SUVECs.

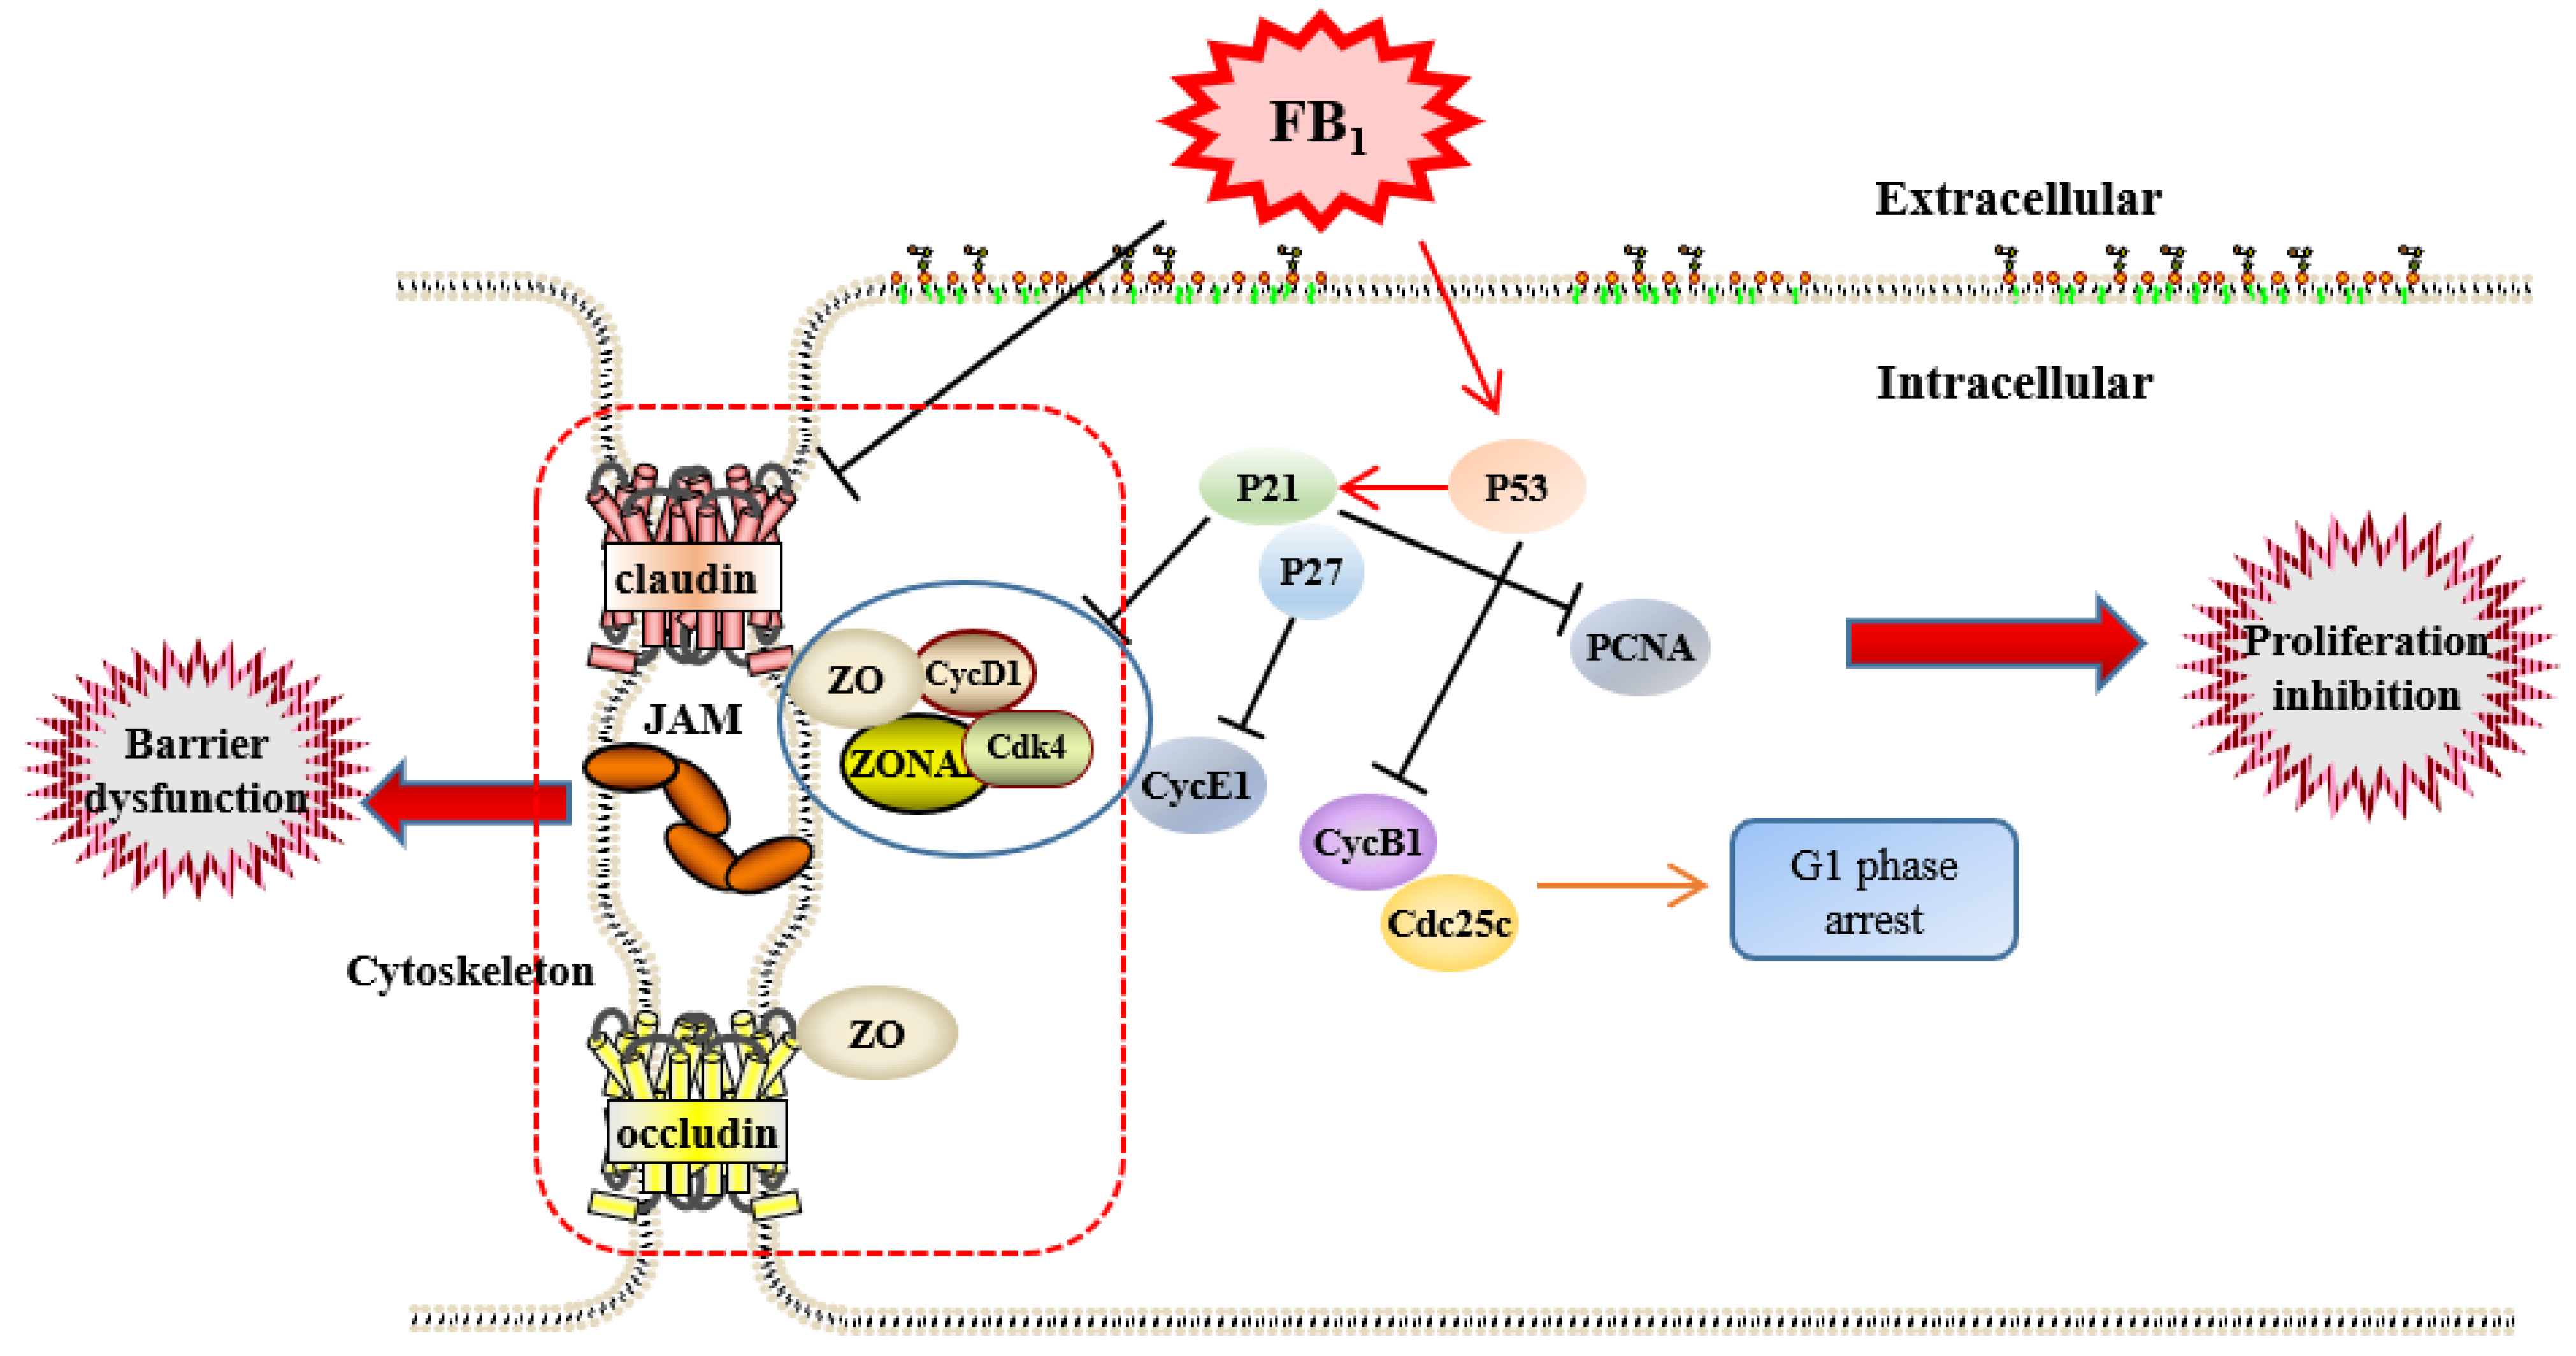
2.2. FB1 Inhibits Proliferation of SUVECs by Blocking the Cell Cycle

After 48 h of FB1 exposure, the proportion of cells in the G1 phase in the 40 μg/mL group was significantly increased. The proportion of cells in the S phase was downregulated, while the proportion of cells in the G2 phase did not change (Figure 2a). The cell proliferation index decreased as the concentration of FB1 increased in the FB1 treatment group: in the 40 μg/mL FB1 treatment group, the cell proliferation index decreased from (51.06 ± 8.232)% to (33.34 ± 8.38)%. The proportion of late apoptosis was significantly increased (Figure 2b). FB1 therefore blocks the progression of the cell cycle from the G1 phase to the S phase.
The previously described experiments demonstrated that FB1 inhibited cell proliferation. Next, the expression of PCNA was detected. The expression of PCNA was significantly downregulated (Figure 2c,d, p < 0.05). We detected the related genes cyclin D1, cyclin E1, and CDK-4 that regulate the G1 and S phases of the cell cycle to corroborate the effect of FB1 on the progression of the cell cycle from the G1 phase to S phase (Figure 2d,e). FB1 clearly reduced the relative expression level of cyclin D1 and cyclin E1 mRNA. In addition, CDK-4 mRNA expression was decreased at 40 μg/mL of FB1. This shows that FB1 inhibits the relevant regulatory genes in the G1 and S phases, thereby blocking the progression of cell proliferation from the G1 phase to the S phase. Next, we tested the expression of cyclin B1 and Cdc25c, the regulators of the cell M phase (Figure 2c,d). FB1 inhibited the expression of cyclin B1 and Cdc25c. Therefore, FB1 inhibits the expression of Cdc25c and cyclin B1 related to the regulation of the M phase.
The cyclin-dependent kinase inhibitors p21 and p27 were examined to further investigate the role of FB1 on the cell cycle. The expression of p21 was upregulated (Figure 2c,e), and FB1 increased the mRNA level of p27 in a dose-dependent manner (Figure 2e). p53 is a tumor suppressor gene and is involved in the cell cycle process. As expected, FB1 also increased the expression of p53 (Figure 2c,e). This result indicated that FB1 promotes cyclin-dependent kinase inhibitor expression, thereby inhibiting cell proliferation.

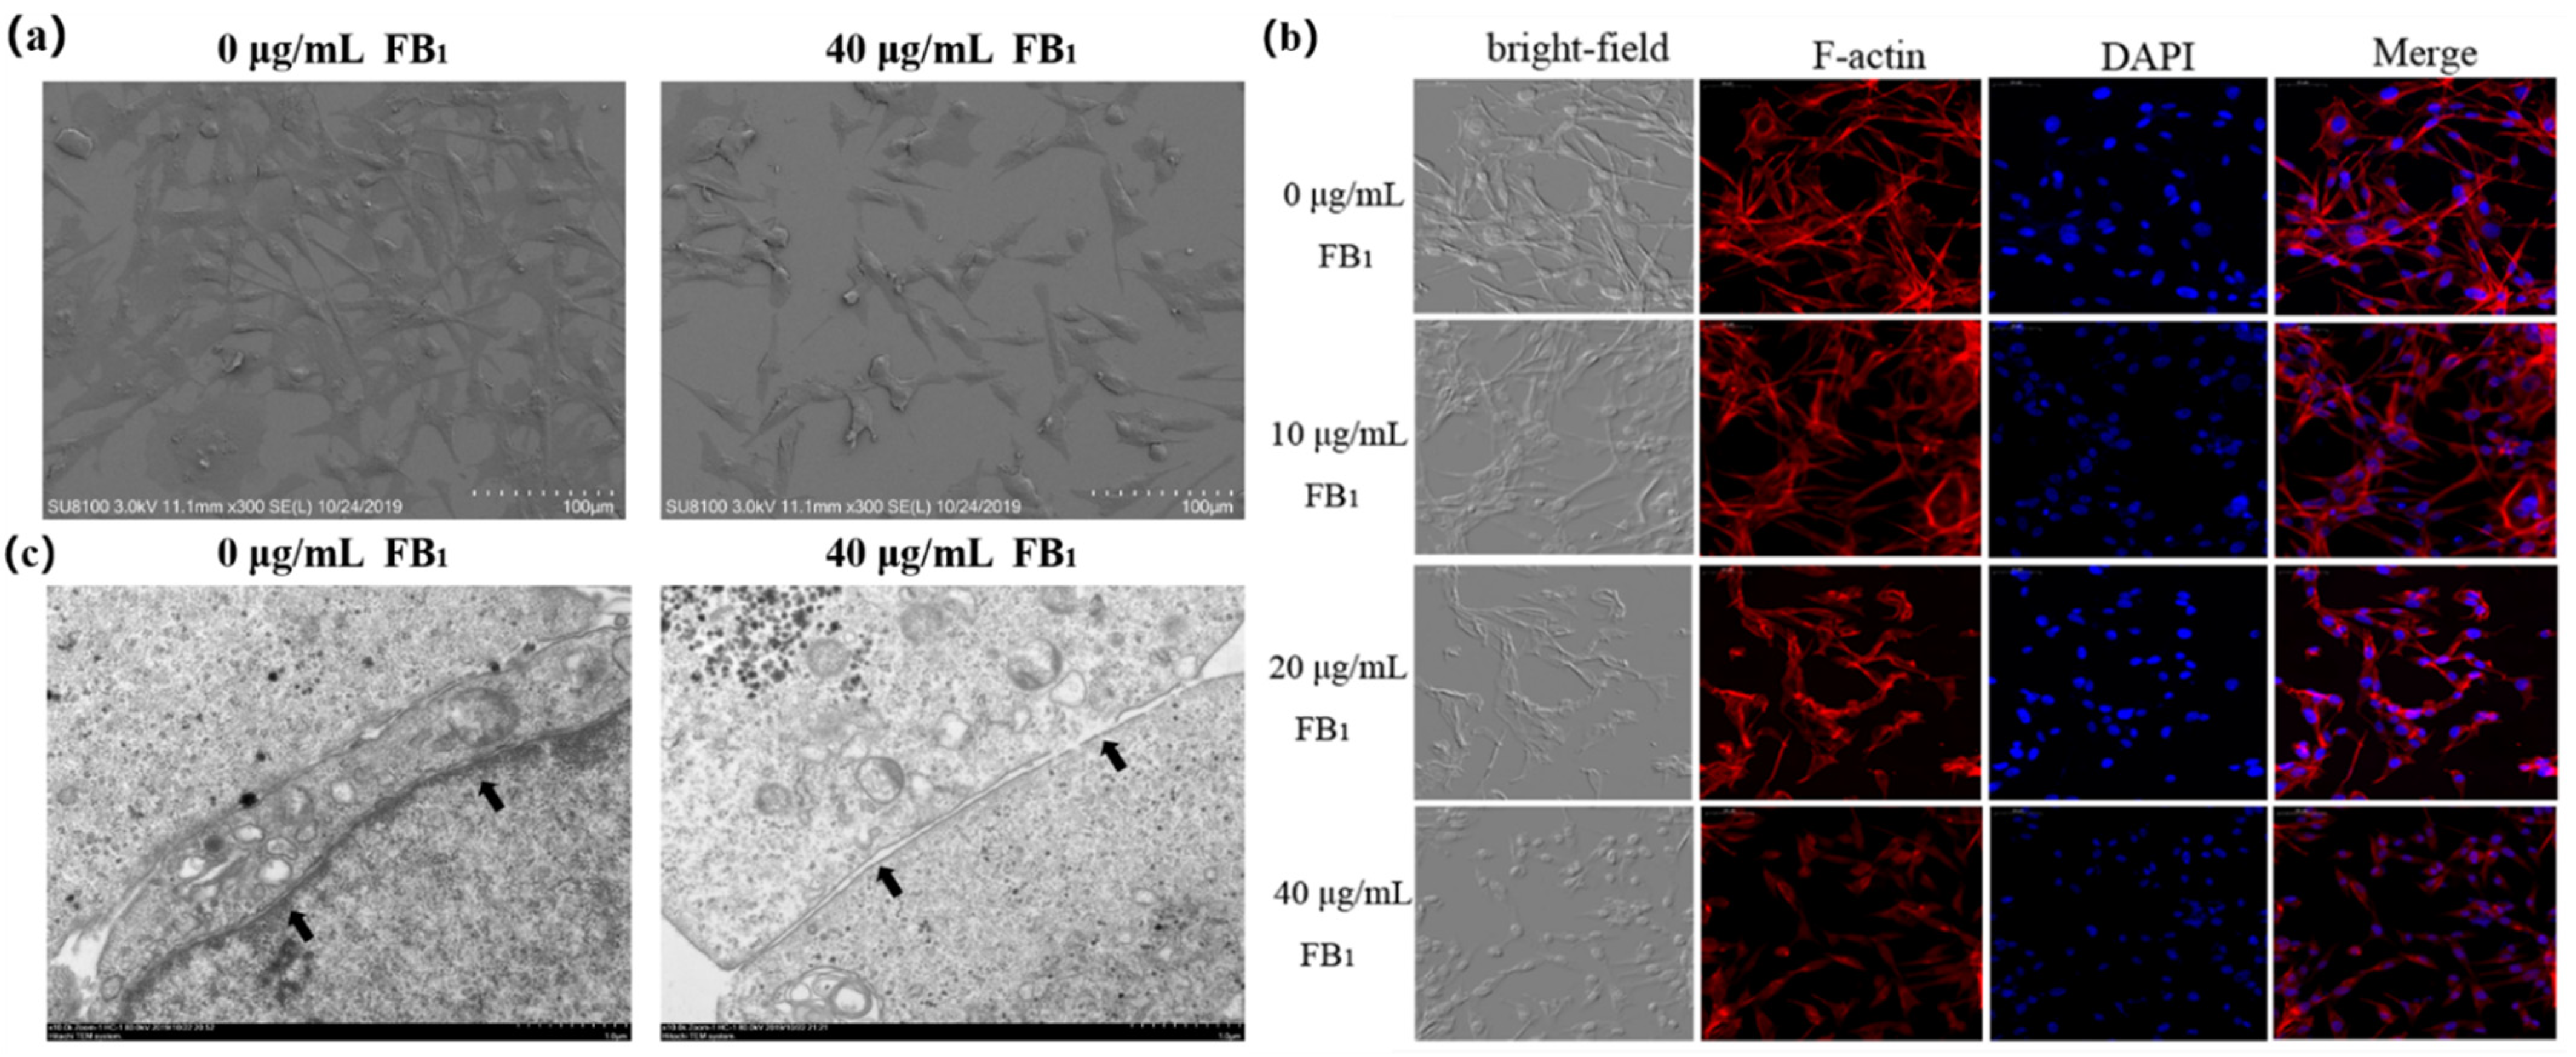
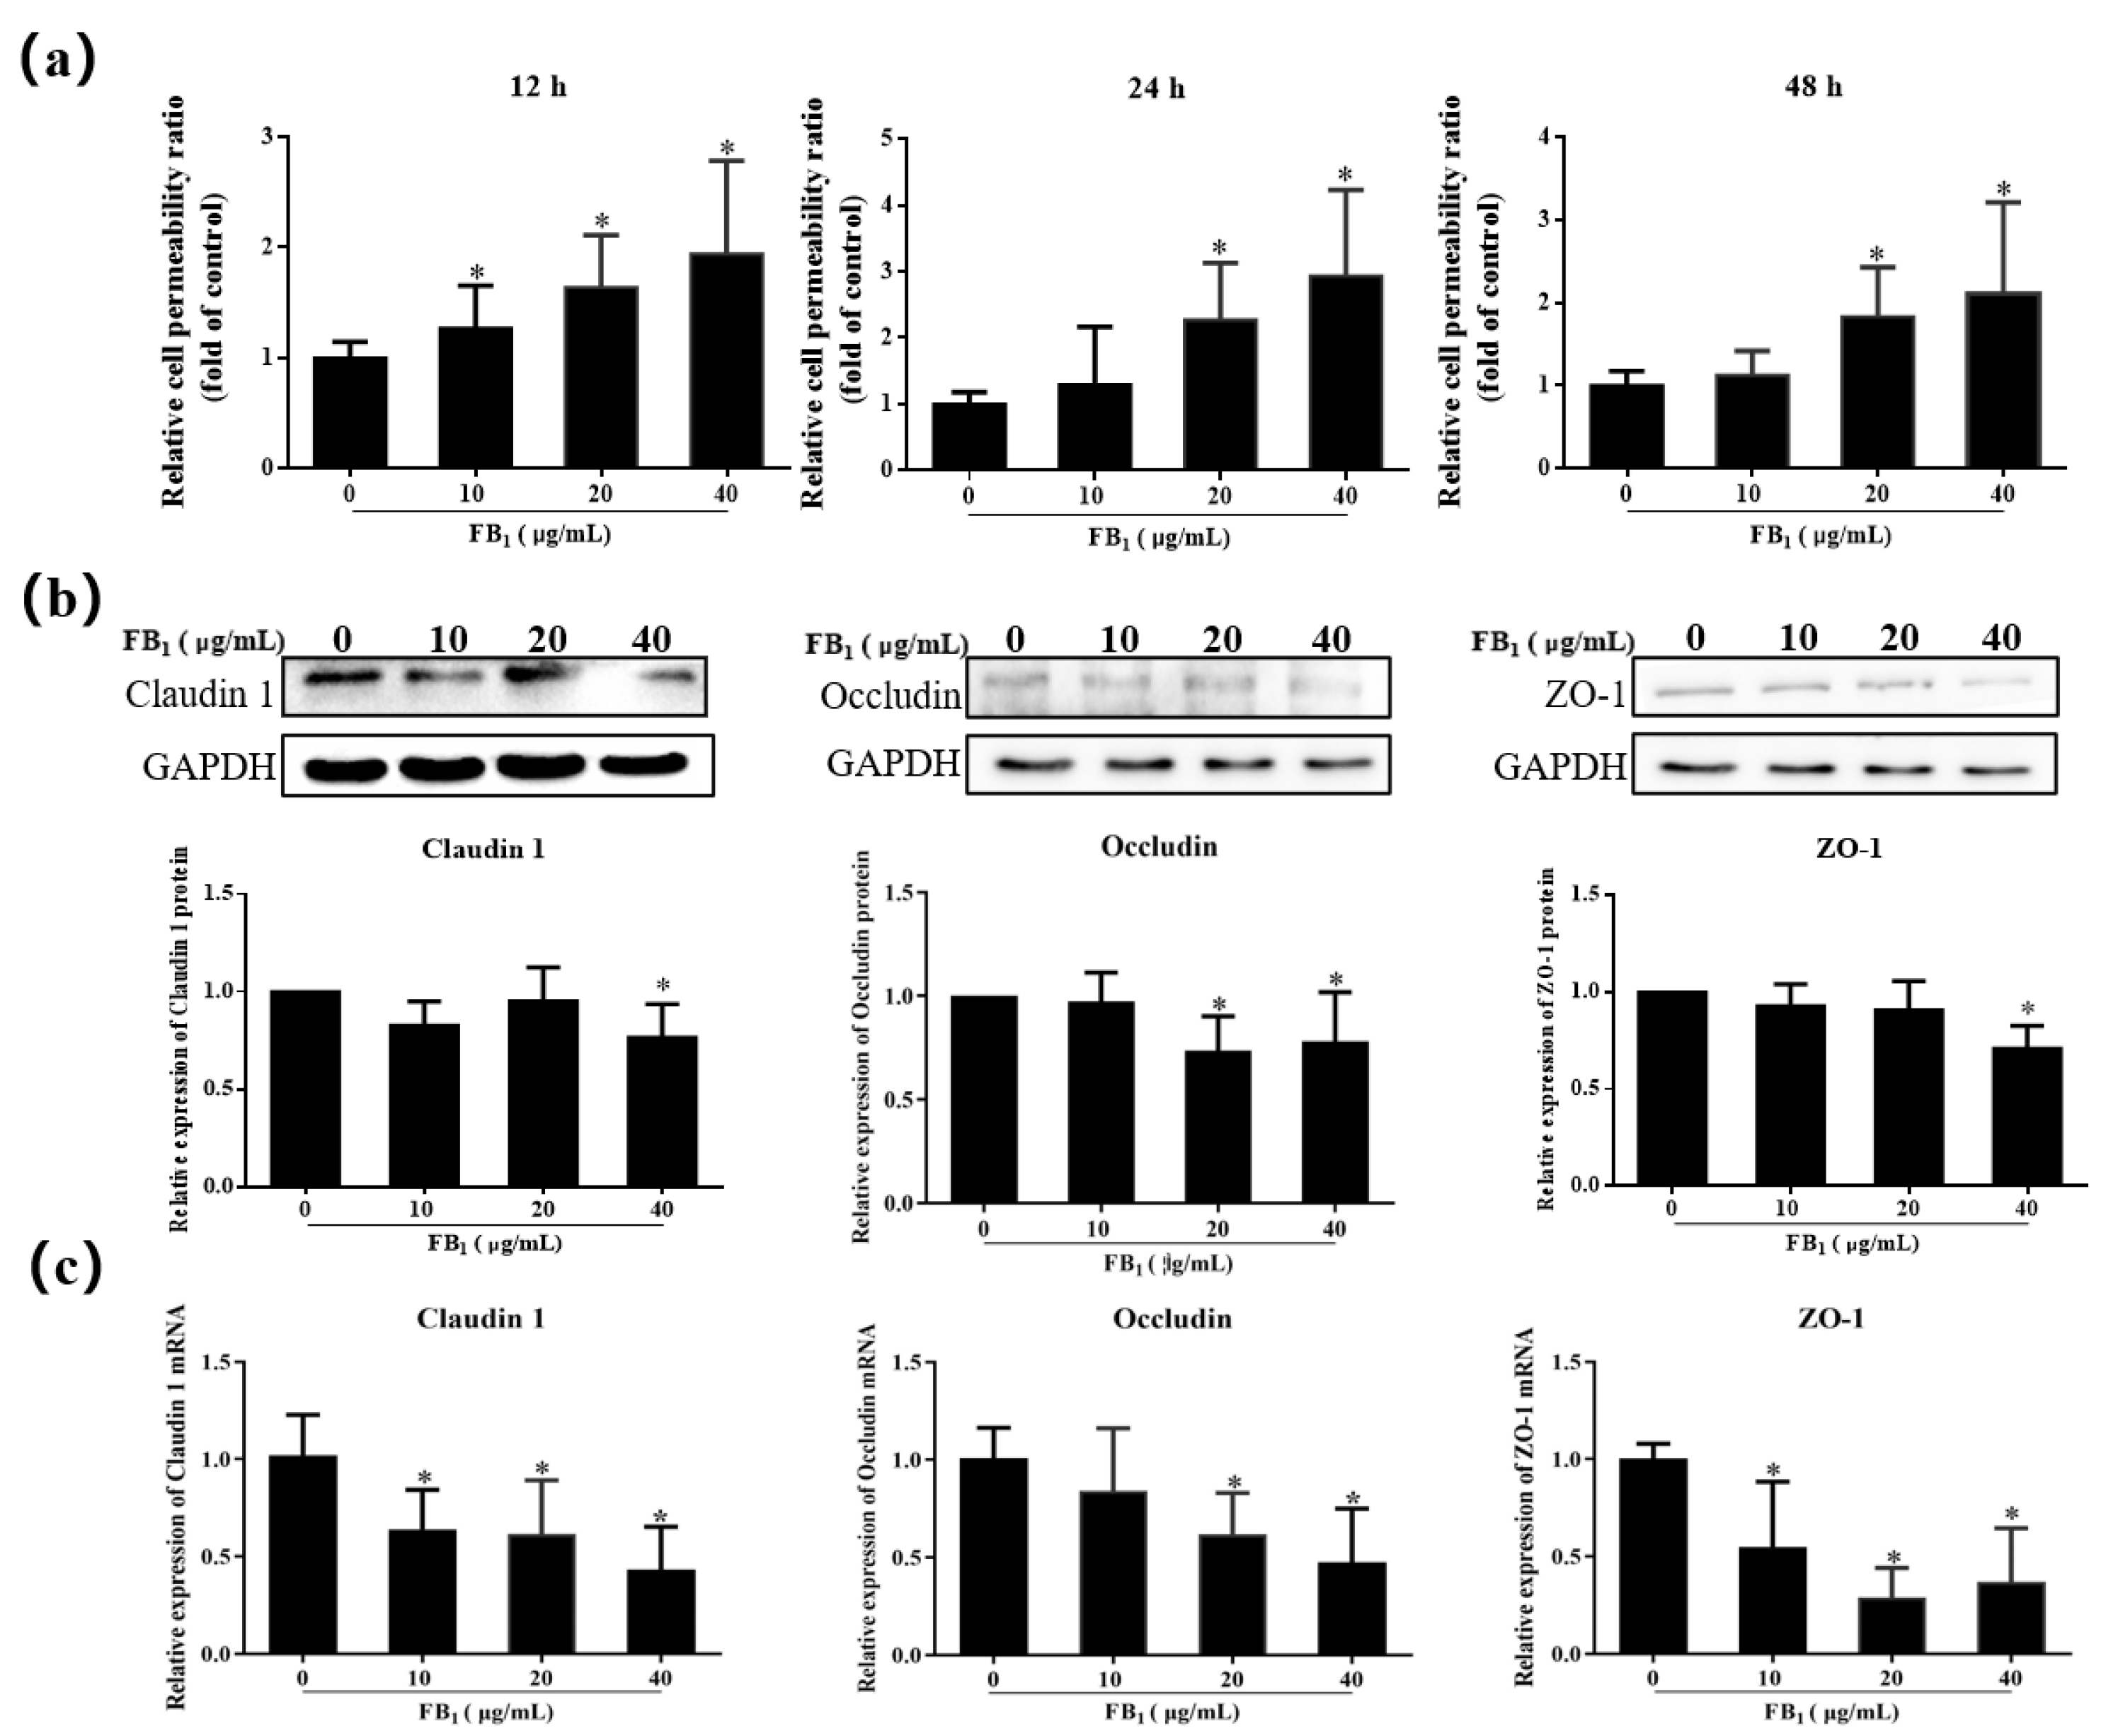
2.3. FB1 Destroys the Tight Junctions of SUVECs

In the FB1 treatment group, the cells clearly shrank, exhibited a small and elliptical morphology, the filopodia of the cells were significantly reduced or even broken, and the cell surface became smooth (Figure 3a). FB1 can therefore change the basic morphology of cells, causing changes in the structure of cell membranes and the junction. Cells were treated with phalloidin to further explore the functional effects of FB1 on the barrier function, and the cell microfilament skeleton was observed (Figure 3b). The microfilaments were arranged in an orderly manner in the control group, while an abnormal cytoskeleton system was found in the FB1-treated group. In the 10 μg/mL group, the arrangement of the microfilament was disordered although there was no significant reduction in the number of cells. In high concentration groups, the cell microfilament skeleton was disorganized. In the 40 μg/mL-treated group, it was significantly reduced. FB1 can therefore cause abnormalities in the cytoskeleton system of SUVECs, leading to disordered arrangement and distribution of microfilament skeletons. After FB1 treatment, the tight junctions between the cells were destroyed (Figure 3c). These observations indicated that FB1 can break the tight junctions of cells.

2.4. FB1 Increases the Cell Paracellular Permeability of SUVECs

SUVECs were exposed to FB1 for 12, 24, and 48 h. The paracellular permeability increased in the FB1 treatment group compared with the control group (Figure 4a), which indicated that FB1 can increase the paracellular permeability of SUVECs.
Therefore, the relative expression of the cell tight junction-related genes claudin1, occludin, and ZO-1 were further tested to further explore the action of FB1 on paracellular permeability (Figure 4b,c). When the concentration of FB1 was 40 μg/mL, the protein expression of claudin 1 and ZO-1 decreased significantly, and mRNA expression had a notable decrease in the FB1 treatment group (p < 0.05). In addition, the expression of occludin in the 20–40 μg/mL group decreased significantly (p < 0.05). FB1 treatment for 48 h can therefore inhibit the expression of the tight junction proteins claudin 1, occludin, and ZO-1 in SUVECs.

3. Discussion

FB1 is a highly toxic low molecular weight fusarium mycotoxin. [22]. It has species-specific toxicity that threatens the health of humans and animals [23]. Pulmonary edema is a unique pathological change due to the action of FB1 in pigs [24]. In this experiment, we found that FB1 caused cell proliferation inhibition and barrier dysfunction in SUVECs, which provides new insights into the toxic mechanism of FB1 in porcine pulmonary edema.
This study explored the effects of different concentrations of FB1 on SUVECs cells. The inhibitory effect of FB1 on the cell activity of SUVECs was time- and dose-dependent. Previously, Zhao and coworkers found that cell viability decreased for human umbilical vein endothelial cells when they were treated with 50 μM/L FB1 for 24 h and 48 h [25]. In our previous study, FB1 also had an inhibitory effect on the cell viability of porcine hip artery endothelial cells when the concentration reached 50 μg/mL [26]. Morphological observations can further prove that FB1 inhibits cell viability. LDH is a cytoplasmic enzyme that exists in all cells. When the cell membrane is damaged, LDH is rapidly released into the supernatant, which can impact cell proliferation, apoptosis, and other biological characteristics [27,28]. In our experiment, the LDH activity in the cell culture supernatant increased. We observed the dilatation of endoplasmic reticulum and mitochondrial swelling using TEM. These findings indicate that FB1 caused damage to the SUVECs.
We speculate that FB1 can affect cell viability due to the cell cycle being blocked, which results in cells being unable to replicate, divide, and proliferate normally. The cell cycle can be divided into the pre-DNA replication phase (G1 phase), DNA replication phase (S phase), late DNA replication phase (G2 phase), mitotic phase (M phase), and stationary phase (G0 phase) [29,30]. Cell cycle detection by flow cytometry showed that G1 phase cells accounted for a notable increase in the proportion of total cells, while the number of S phase cells decreased. Therefore, FB1 may interrupt proliferation by blocking cells in the transition from the G1 phase to the S phase. In addition, many reports in the literature support this. Bouhet et al. [31] found that FB1 blocked the proliferation of intestinal porcine epithelial cell line-1 (IPEC-1) in the G0/G1 phase in a concentration-dependent manner. Our results are consistent with these findings. They demonstrate that FB1 can inhibit cell proliferation, mainly by inhibiting the progression of the cell cycle from the G0/G1 phase to the S phase. PCNA plays a critical role in the initiation of DNA replication and replication-associated processes and is a good indicator of the state of cell proliferation [32,33]. In our study, the mRNA and protein expression levels of PCNA were significantly down-regulated, which proves that FB1 inhibited cell proliferation.
The cell cycle is a complex process, which includes cyclin interaction [34]. Cyclin D is expressed in the early G1 phase. It simultaneously forms a cell cycle kinase complex with CDK4 and CDK6 and becomes the promoter of the cell cycle [35]. In this study, the mRNA expression of Cyclin D1 and CDK4 was significantly down-regulated in the FB1 treatment group. The expression of the cyclin E gene, which regulates the transition of the cell cycle from the G1 to S phase, was also significantly decreased. Cdc25c, an important cell division regulatory protein, is one of the key factors that controls the progression of the cell cycle into the M phase [36,37], cyclin B also participates in regulating M phase progression. We found that the mRNA and protein expression levels of Cdc25c and cyclin B1 decreased significantly, which was consistent with the previous flow cytometry results. This further shows that the arrest of the cell cycle by FB1 occurs during the progression from the G1 phase to the S phase. Ciacci-zanella and coworkers [38] determined that FB1 blocked cell-cycle progression in CV-1 cells, and the expression of cyclin E, Cdc2, CDK2, CDK3, and CDK4 in cells after FB1 exposure was significantly inhibited. Our experimental results are consistent with these findings. CDK inhibitors P21 and P27 can promote cell cycle arrest in response to a variety of stimuli and prevent the replication of damaged DNA [39,40,41]. p53 can up-regulate the expression of p21 and, subsequently, p21 protein binds to cyclins E/Cdk2 and D/Cdk4, which leads to cell cycle G1 arrest [42]. p53 can also bind to other p53 target genes, such as Cdc25 [43] to block the cell cycle in the G2/M phase. Western-blot and qRT-PCR test results confirmed that p21, p27, and p53 were significantly up-regulated. The study also found that the decrease of CDK-4 and cyclin caused by FB1 may be related to the expression of p21 and p27. It remains to be explored whether there are other ways to down-regulate its expression such as post-transcriptional control of non-coding RNA regulation or methylation and ubiquitination-mediated protein degradation.
The cytoskeleton refers to the protein fiber network structure in eukaryotic cells. It helps to maintain cell shape and bear external forces. When cells are attacked, the function of the cytoskeleton is destroyed, and microfilaments and microtubules play an important role in this process [44]. The inhibition of the proliferation of vascular smooth muscle cells (VCMC) is associated with a rapid rearrangement of cytoskeleton [45]. Baltierra-Uribe and coworkers [46] found that when endothelial cells are damaged by mycobacterial infection, the actin filaments are lost, and multiple actin focal points appear in the infected cells. Qin and colleagues [47] also reported that when tight junctions are injured, the cytoskeleton arrangement is disordered and even broken. In our current study, we found that FB1 can cause damage to vascular endothelial cells and affect the cytoskeleton, which leads to the destruction of the tight junctions, further induce the enhancement of vascular permeability and the exudation of intravascular substances.
Vascular endothelial cells and their junctional complexes are the main basis for the structure and function of the vascular barrier. The connections between endothelial cells, which are closely related to vascular permeability, include tight junctions and adhesion junctions [48]. Tight junctions play a vital role in maintaining the morphology of endothelial cells, the integrity of the barrier function, cell polarity, and cell-to-cell transport [49]. Adhesive junctions adhere to adjacent cells by connecting their actin cytoskeleton, while tight junctions seal the paracellular space between overlapping endothelial cells [50]. Damage to cells’ tight junctions can lead to cells where the lateral gap expands. We demonstrated that FB1 expanded the paracellular space of SUVECs, which results in increased paracellular permeability. We explored whether FB1 could damage the tight junction of SUVECs based on these results. Claudins, occludin, and ZO-1 are commonly occurring proteins that play a very important role in maintaining cell morphology and forming barriers to prevent the invasion of foreign pathogenic factors [51,52]. In our study, FB1 inhibited gene and protein expression. TEM showed that the connections between cells in the FB1 treatment group were damaged. This phenomenon may arise as FB1 changes the connection between cells and destroys tight junction structure between cells. Similarly, studies have shown that a long exposure of FB1 can significantly change the barrier function [31], and cause the downregulation of claudin gene expression in intestinal cells [53]. It has also been reported that 10–50 μg/mL FB1 disrupts the barrier function of IPEC-J2 after 48 h, which results in the destruction of cell tight junctions, and decline of the expression of claudin 1, occludin, and ZO-1 [54]. Zhang and colleagues [55] showed that variation in HUVEC cell permeability down-regulates the expression of ZO-1 and changes the ultrastructure of tight junctions, which leads to a significant increase in the intercellular space. In summary, FB1 can destroy the tight junction of vascular endothelial cells.

4. Conclusions

Our study with SUVECs cultured in vitro reveals that the vascular toxicity of FB1 is related to triggers SUVECs damage, inhibits cell proliferation by arresting the cell cycle in G1 phase, destroys tight junctions and cytoskeleton (Figure 5). These findings provide insight into our understanding of the toxicity mechanism of FB1, and may facilitate its potential application for the treatment of swine pulmonary edema.

5. Materials and Methods

5.1. Cell and Cell Culture

SUVECs were bought from Shanghai Zishi Bio-Technology Co., Ltd (Shanghai, China). The cell morphology of SUVEC is polygonal or long fusiform with relatively uniform size. The cells were cultured in Dulbecco’s modified eagle medium (DMEM, Thermo, Fisher Scientific Co., Ltd. Shanghai, China) which contained 10% fetal calf serum (FBS, Gibco) and 1% penicillin-streptomycin (Procell Life Science &Technology Co., Ltd. Beijing, China) at 37 °C in a cell incubator containing 5% carbon dioxide.

5.2. Cell Viability Assay

MTT (3-(4,5-dimethylthiazol-2-yl)-2,5-diphenyltetrazolium bromide) assay was used to measure the cell viability of SUVECs. FB1 (≥98%, Sigma-Aldrich, St. Louis, MO, USA) was dissolved in dimethyl sulphoxide (DMSO) to make a concentration of 20 mg/mL. Exponentially growing cells were seeded into 96-well culture plates. Different concentrations of FB1 (0, 2.5, 5,10, 20, 40, 60 μg/mL) were added and samples were incubated for 24, 48, and 72 h. Cells were cultured for a further 4 h after replacing the FB1 with 110 μL thiazolyl blue (MTT) (CWBIO, Beijing, China). Finally, the MTT solution was discarded and 150 μL DMSO (CWBIO) was added. The absorbance was measured at 490 nm using an enzyme-labeled method in a spectrophotometer. The activity of each group of cells was calculated according to the formula: cell viability (%) = (A test − A blank)/(A control − A blank) × 100%.

5.3. LDH Cytotoxicity Assay

SUVECs were grown to a cell density of about 1 × 10⁶ in the 6-well plate. At this time, the medium was replaced with 2 mL FB1 solution (0, 10, 20, 40 μg/mL). The cell culture supernatant was collected from the centrifuge tube and culture for a further 48 h. After further centrifugation, the lactate dehydrogenase activity detection kit (Solarbio, Beijing, China) was used to measure the activity of the supernatant.

5.4. HE Staining

Attached the cell culture coverslip to the bottom of the 24-well plate. Slowly dropped the cell suspension of 500 μL to the cell crawler, and placed it in CO2 incubator to wait for cell density cultured to 50–60% or so. Cultivated with FB1 solution (0, 10, 20, 40 μg/mL) for 48 h. The coverslip was taken for fixation, hematoxylin staining, differentiation, eosin staining, dehydration, transparency, mounting. The changes in nucleus and cytostyte are observed under a microscope.

5.5. Flow Cytometric Analysis

After 24 h of treatment with FB1 (0, 10, 20, 40 μg/mL), cells were suspended with ice-cold phosphate buffered saline (PBS) after centrifugation. 500 μL propidium iodide solution (Genview, Beijing, China) was added and the sample was incubated in the dark for 30 min. The cell cycle was detected with a flow cytometer. The cell proliferation index was calculated according to the data obtained from the flow cytometer test: Cell proliferation index (%) = ((G2/M + S)/(G0/G1 + S + G2/M)) ∗ 100%.

5.6. qRT-PCR Assay

The total RNA of SUVECs was extracted using the TransZol Up reagent (TransGen Biotech, Beijing, China) and cDNA was synthesized using the one-step reverse transcription kit (TransGen Biotech). Real-time quantitative polymerase chain reaction (qRT-PCR) was performed using the Bio-Rad Laboratories CFX Connect™ Real-Time PCR Detection System and calculated by the 2ΔΔct method. The primer sequences were constructed by Sangon Biotech (Shanghai) Co., Ltd., and are shown in Table 1. Glyceraldehyde-3-phosphate dehydrogenase (GADPH) were used as reference gene.

5.7. Western Blot

Cells were rinsed twice in ice-cold PBS. The RIPA buffer (Solarbio), protease inhibitor mixture (Solarbio), and protein phosphatase inhibitor (Solarbio) were subsequently added to the extract protein. Supernatants were used to quantify the protein concentration via the Bradford protein kit (Tiandz, Beijing, China). Proteins were separated by sodium dodecyl sulfate—polyacrylamide gel electrophoresis (SDS-PAGE) at 80 V for 40 min and 120 V for 50 min, and subsequently electrotransferred to polyvinylidene fluoride (PVDF) membranes at 200 mA for 80 min. Membranes were incubated with primary antibody P21 (Proteintech, Wuhan, China), P53 (Bioss, Beijing, China), PCNA (Bioss), p-Cyclin B1 (Bioss), Claudin1 (Bioss), Occludin (Bioss), ZO-1 (Bioss), Cdc25c (CST, Boston, MA, USA), and GAPDH (Servicebio, Wuhan, China) overnight at 4 °C. After incubation with corresponding secondary antibodies, the protein band densities were quantified using Bio-Rad ChemiDoc™ XRS and Image Lab™ Software.

5.8. Scanning Electron Microscopy (SEM)

FB1-treated sterilized coverslips were rinsed with PBS and the samples fixed in 2 mL 2.5% glutaraldehyde for 2 h. Next, samples were fixed for 1–2 h at room temperature with PBS, which included 1% osmium tetroxide. Afterwards, the coverslips were dehydrated in a series of graded ethanol concentrations, mounted with double-sided tape, and platinum-coated in a sputter coater for about 30 s. For visualization, the electron micrographs were taken and analyzed under a scanning electron microscope.

5.9. Transmission Electron Microscopy (TEM)

FB1-treated cells were rinsed with PBS and fixed in 2 mL 2.5% glutaraldehyde for 2 h at 4 °C. The fixed cells were scraped and pelleted in agarose. Next, the samples were fixed for 1–2 h at 20 °C with PBS, which included 1% osmium tetroxide. Afterwards, the samples were dehydrated in a series of graded ethanol concentrations. Cells were embedded using 812 embedding resin, and stained en bloc with uranyl acetate and lead citrate. Samples were viewed with a transmission electron microscope, and images were captured for analysis.

5.10. Paracellular Permeability Testing

SUVECs with DMEM were seeded in the upper chambers of transwell inserts. The lower chambers contained 600 μL DMEM with 10% FBS. After the cells were cultured, the fluids in the upper and lower chambers were replaced with FB1 (0, 10, 20, 40 μg/mL), and treated for 24, 48, and 72 h. Fluorescein isothiocyanate (FITC)-dextran (5 mg/mL) was added in the upper chamber and 600 μL PBS was added in the lower chamber. The lower chamber liquid was collected and the absorbance was measured. Paracellular permeability was calculated as follows: Paracellular permeability = FITC-dextran concentration in the lower chamber/the average FITC-dextran concentration of the control group.

5.11. Phalloidin Staining

SUVECs were treated with FB1 (0, 10, 20, 40 μg/mL) for 24 h and fixed in 4% polyformaldehyde for 30 min. The 50–100 μL permeabilization wash buffer was added, and samples were incubated for 10 min at room temperature followed by incubation with 50–100 μL phalloidin (Servicebio) for another 2 h. After incubation with 4′,6-diamidino-2-phenylindole (DAPI) stain solution (Servicebio) for 10 min, antifade mounting medium (Servicebio) was prepared to mount the coverslips. Finally, the cell culture coverslips were placed under an inverted fluorescence microscope to observe and capture the images.

5.12. Statistical Analysis

All data were expressed as mean ± standard deviation (SD) and resolved by one-way analysis of variance and independent sample t-test to analyze the differences between groups using Graphpad Prism 6.01. All experiments were repeated at least three times. p < 0.05 was considered significant (data marked with the *).

Author Contributions

H.L., J.S. and Q.Y. designed the research; Q.Y., Q.L., Y.F. and T.W. performed the research, analyzed and interpreted the data; Q.L. wrote the paper; J.S., Y.Z., L.Y. and H.L. revised the paper. All authors have read and agreed to the published version of the manuscript.

Funding

This work was supported by the Scientific Research Project of Hunan Provincial Education Department (19A229), Hunan Provincial Key Laboratory of Protein Engineering in Animal Vaccines (2017TP1014).

Institutional Review Board Statement

Not applicable.

Informed Consent Statement

Not applicable.

Data Availability Statement

Not applicable.

Conflicts of Interest

The authors declare there is no conflict of interest.

References

  1. Scott, P.M. Fumonisins. Int. J. Food Microbiol. 1993, 18, 257–270. [Google Scholar] [CrossRef]
  2. Zeng, H.Y.; Li, C.Y.; Yao, N. Fumonisin B1: A Tool for Exploring the Multiple Functions of Sphingolipids in Plants. Front. Plant Sci. 2020, 11, 600458. [Google Scholar] [CrossRef] [PubMed]
  3. Sheik Abdul, N.; Marnewick, J.L. Fumonisin B (1)—induced mitochondrial toxicity and hepatoprotective potential of rooibos: An update. J. Appl. Toxicol. 2020, 40, 1602–1613. [Google Scholar] [CrossRef] [PubMed]
  4. Domijan, A.M. Fumonisin B (1): A neurotoxic mycotoxin. Arh. Za Hig. Rada I Toksikol. 2012, 63, 531–544. [Google Scholar] [CrossRef] [PubMed] [Green Version]
  5. Riedel, S.; Abel, S.; Swanevelder, S.; Gelderblom, W.C. Induction of an altered lipid phenotype by two cancer promoting treatments in rat liver. Food Chem. Toxicol. Int. J. Publ. Br. Ind. Biol. Res. Assoc. 2015, 78, 96–104. [Google Scholar] [CrossRef] [PubMed]
  6. Burger, H.M.; Abel, S.; Gelderblom, W.C.A. Modulation of key lipid raft constituents in primary rat hepatocytes by fumonisin B (1)—Implications for cancer promotion in the liver. Food Chem. Toxicol. Int. J. Publ. Br. Ind. Biol. Res. Assoc. 2018, 115, 34–41. [Google Scholar] [CrossRef]
  7. Abdul, N.S.; Chuturgoon, A.A. Fumonisin B (1) regulates LDL receptor and ABCA1 expression in an LXR dependent mechanism in liver (HepG2) cells. Toxicon Off. J. Int. Soc. Toxinol. 2021, 190, 58–64. [Google Scholar] [CrossRef]
  8. Harrison, L.R.; Colvin, B.M.; Greene, J.T.; Newman, L.E.; Cole, J.R. Pulmonary edema and hydrothorax in swine produced by fumonisin B1, a toxic metabolite of Fusarium moniliforme. J. Vet. Diagn. Investig. Off. Publ. Am. Assoc. Vet. Lab. Diagn. Inc. 1990, 2, 217–221. [Google Scholar] [CrossRef] [PubMed] [Green Version]
  9. Haschek, W.M.; Motelin, G.; Ness, D.K.; Harlin, K.S.; Hall, W.F.; Vesonder, R.F.; Peterson, R.E.; Beasley, V.R. Characterization of fumonisin toxicity in orally and intravenously dosed swine. Mycopathologia 1992, 117, 83–96. [Google Scholar] [CrossRef]
  10. Colvin, B.M.; Cooley, A.J.; Beaver, R.W. Fumonisin toxicosis in swine: Clinical and pathologic findings. J. Vet. Diagn. Investig. Off. Publ. Am. Assoc. Vet. Lab. Diagn. Inc. 1993, 5, 232–241. [Google Scholar] [CrossRef] [PubMed]
  11. Haschek, W.M.; Gumprecht, L.A.; Smith, G.; Tumbleson, M.E.; Constable, P.D. Fumonisin toxicosis in swine: An overview of porcine pulmonary edema and current perspectives. Environ. Health Perspect. 2001, 109, 251–257. [Google Scholar] [CrossRef] [PubMed]
  12. Gumprecht, L.A.; Beasley, V.R.; Weigel, R.M.; Parker, H.M.; Tumbleson, M.E.; Bacon, C.W.; Meredith, F.I.; Haschek, W.M. Development of fumonisin-induced hepatotoxicity and pulmonary edema in orally dosed swine: Morphological and biochemical alterations. Toxicol. Pathol. 1998, 26, 777–788. [Google Scholar] [CrossRef]
  13. Zhu, J.; Thompson, C.B. Metabolic regulation of cell growth and proliferation. Nat. Rev. Mol. Cell Biol. 2019, 20, 436–450. [Google Scholar] [CrossRef] [PubMed]
  14. Poon, R.Y. Cell Cycle Control: A System of Interlinking Oscillators. Methods Mol. Biol. 2016, 1342, 3–19. [Google Scholar] [CrossRef] [PubMed]
  15. Gali-Muhtasib, H.; Bakkar, N. Modulating cell cycle: Current applications and prospects for future drug development. Curr. Cancer Drug Targets 2002, 2, 309–336. [Google Scholar] [CrossRef]
  16. Wang, Z.; Wang, Y.; Wang, S.; Meng, X.; Song, F.; Huo, W.; Zhang, S.; Chang, J.; Li, J.; Zheng, B.; et al. Coxsackievirus A6 Induces Cell Cycle Arrest in G0/G1 Phase for Viral Production. Front. Cell. Infect. Microbiol. 2018, 8, 279. [Google Scholar] [CrossRef] [PubMed] [Green Version]
  17. Harris, E.S.; Nelson, W.J. VE-cadherin: At the front, center, and sides of endothelial cell organization and function. Curr. Opin. Cell Biol. 2010, 22, 651–658. [Google Scholar] [CrossRef] [PubMed] [Green Version]
  18. Dejana, E. Endothelial cell-cell junctions: Happy together. Nat. Reviews. Mol. Cell Biol. 2004, 5, 261–270. [Google Scholar] [CrossRef]
  19. Radhakrishna, H.; Al-Awar, O.; Khachikian, Z.; Donaldson, J.G. ARF6 requirement for Rac ruffling suggests a role for membrane trafficking in cortical actin rearrangements. J. Cell Sci. 1999, 112, 855–866. [Google Scholar] [CrossRef]
  20. Hohmann, T.; Dehghani, F. The Cytoskeleton-A Complex Interacting Meshwork. Cells 2019, 8, 362. [Google Scholar] [CrossRef] [PubMed] [Green Version]
  21. Friedl, P.; Mayor, R. Tuning Collective Cell Migration by Cell-Cell Junction Regulation. Cold Spring Harb. Perspect. Biol. 2017, 9, a029199. [Google Scholar] [CrossRef] [Green Version]
  22. Yu, S.; Jia, B.; Liu, N.; Yu, D.; Wu, A. Evaluation of the Individual and Combined Toxicity of Fumonisin Mycotoxins in Human Gastric Epithelial Cells. Int. J. Mol. Sci. 2020, 21, 5917. [Google Scholar] [CrossRef]
  23. Arumugam, T.; Ghazi, T.; Chuturgoon, A. Fumonisin B (1) Epigenetically Regulates PTEN Expression and Modulates DNA Damage Checkpoint Regulation in HepG2 Liver Cells. Toxins 2020, 12, 625. [Google Scholar] [CrossRef] [PubMed]
  24. Gumprecht, L.A.; Smith, G.W.; Constable, P.C.; Haschek, W.M. Species and organ specificity of fumonisin-induced endothelial alterations: Potential role in porcine pulmonary edema. Toxicology 2001, 160, 71–79. [Google Scholar] [CrossRef]
  25. Zhao, X.; Wang, Y.; Liu, J.L.; Zhang, J.H.; Zhang, S.C.; Ouyang, Y.; Huang, J.T.; Peng, X.Y.; Zeng, Z.; Hu, Z.Q. Fumonisin B1 Affects the Biophysical Properties, Migration and Cytoskeletal Structure of Human Umbilical Vein Endothelial Cells. Cell Biochem. Biophys. 2020, 78, 375–382. [Google Scholar] [CrossRef] [PubMed]
  26. Yuan, Q.; Jiang, Y.; Fan, Y.; Ma, Y.; Lei, H.; Su, J. Fumonisin B (1) Induces Oxidative Stress and Breaks Barrier Functions in Pig Iliac Endothelium Cells. Toxins 2019, 11, 387. [Google Scholar] [CrossRef] [Green Version]
  27. Kumar, P.; Nagarajan, A.; Uchil, P.D. Analysis of Cell Viability by the Lactate Dehydrogenase Assay. Cold Spring Harb. Protoc. 2018, 2018, pdb-prot095497. [Google Scholar] [CrossRef] [PubMed]
  28. Kaja, S.; Payne, A.J.; Naumchuk, Y.; Koulen, P. Quantification of Lactate Dehydrogenase for Cell Viability Testing Using Cell Lines and Primary Cultured Astrocytes. Curr. Protoc. Toxicol. 2017, 72, 2–26. [Google Scholar] [CrossRef] [PubMed] [Green Version]
  29. Bertoli, C.; Skotheim, J.M.; de Bruin, R.A. Control of cell cycle transcription during G1 and S phases. Nat. Rev. Mol. Cell Biol. 2013, 14, 518–528. [Google Scholar] [CrossRef] [Green Version]
  30. Dalton, S. Linking the Cell Cycle to Cell Fate Decisions. Trends Cell Biol. 2015, 25, 592–600. [Google Scholar] [CrossRef] [PubMed] [Green Version]
  31. Bouhet, S.; Hourcade, E.; Loiseau, N.; Fikry, A.; Martinez, S.; Roselli, M.; Galtier, P.; Mengheri, E.; Oswald, I.P. The mycotoxin fumonisin B1 alters the proliferation and the barrier function of porcine intestinal epithelial cells. Toxicol. Sci. Off. J. Soc. Toxicol. 2004, 77, 165–171. [Google Scholar] [CrossRef] [PubMed] [Green Version]
  32. Choe, K.N.; Moldovan, G.L. Forging Ahead through Darkness: PCNA, Still the Principal Conductor at the Replication Fork. Mol. Cell 2017, 65, 380–392. [Google Scholar] [CrossRef] [PubMed] [Green Version]
  33. Boehm, E.M.; Gildenberg, M.S.; Washington, M.T. The Many Roles of PCNA in Eukaryotic DNA Replication. Enzymes 2016, 39, 231–254. [Google Scholar] [CrossRef] [PubMed] [Green Version]
  34. Gao, S.W.; Liu, F. Novel insights into cell cycle regulation of cell fate determination. J. Zhejiang Univ. Sci. B 2019, 20, 467–475. [Google Scholar] [CrossRef] [PubMed]
  35. Kozar, K.; Sicinski, P. Cell cycle progression without cyclin D-CDK4 and cyclin D-CDK6 complexes. Cell Cycle 2005, 4, 388–391. [Google Scholar] [CrossRef] [PubMed] [Green Version]
  36. Liu, K.; Zheng, M.; Lu, R.; Du, J.; Zhao, Q.; Li, Z.; Li, Y.; Zhang, S. The role of CDC25C in cell cycle regulation and clinical cancer therapy: A systematic review. Cancer Cell Int. 2020, 20, 213. [Google Scholar] [CrossRef]
  37. Giono, L.E.; Resnick-Silverman, L.; Carvajal, L.A.; St Clair, S.; Manfredi, J.J. Mdm2 promotes Cdc25C protein degradation and delays cell cycle progression through the G2/M phase. Oncogene 2017, 36, 6762–6773. [Google Scholar] [CrossRef] [Green Version]
  38. Ciacci-Zanella, J.R.; Merrill, A.H., Jr.; Wang, E.; Jones, C. Characterization of cell-cycle arrest by fumonisin B1 in CV-1 cells. Food Chem. Toxicol. Int. J. Publ. Br. Ind. Biol. Res. Assoc. 1998, 36, 791–804. [Google Scholar] [CrossRef]
  39. Karimian, A.; Ahmadi, Y.; Yousefi, B. Multiple functions of p21 in cell cycle, apoptosis and transcriptional regulation after DNA damage. DNA Repair 2016, 42, 63–71. [Google Scholar] [CrossRef]
  40. Abbastabar, M.; Kheyrollah, M.; Azizian, K.; Bagherlou, N.; Tehrani, S.S.; Maniati, M.; Karimian, A. Multiple functions of p27 in cell cycle, apoptosis, epigenetic modification and transcriptional regulation for the control of cell growth: A double-edged sword protein. DNA Repair 2018, 69, 63–72. [Google Scholar] [CrossRef]
  41. Butler, J.E.; Spear, B.T. Normal intestinal epithelial cell differentiation in the absence of p21 and p27: New insights from old knock-out mice. Cancer Biol. Ther. 2008, 7, 880–881. [Google Scholar] [CrossRef] [PubMed] [Green Version]
  42. Harper, J.W.; Adami, G.R.; Wei, N.; Keyomarsi, K.; Elledge, S.J. The p21 Cdk-interacting protein Cip1 is a potent inhibitor of G1 cyclin-dependent kinases. Cell 1993, 75, 805–816. [Google Scholar] [CrossRef]
  43. St Clair, S.; Giono, L.; Varmeh-Ziaie, S.; Resnick-Silverman, L.; Liu, W.J.; Padi, A.; Dastidar, J.; DaCosta, A.; Mattia, M.; Manfredi, J.J. DNA damage-induced downregulation of Cdc25C is mediated by p53 via two independent mechanisms: One involves direct binding to the cdc25C promoter. Mol. Cell 2004, 16, 725–736. [Google Scholar] [CrossRef]
  44. Haglund, C.M.; Welch, M.D. Pathogens and polymers: Microbe-host interactions illuminate the cytoskeleton. J. Cell Biol. 2011, 195, 7–17. [Google Scholar] [CrossRef] [Green Version]
  45. Pozo, M.; Izquierdo, M.C.; de Nicolás, R.; Egido, J.; Ortiz, A.; González-Cabrero, J. Gliotoxin inhibits neointimal hyperplasia after vascular injury in rats. J. Vasc. Res. 2009, 46, 278–289. [Google Scholar] [CrossRef] [PubMed]
  46. Baltierra-Uribe, S.L.; García-Vásquez Mde, J.; Castrejón-Jiménez, N.S.; Estrella-Piñón, M.P.; Luna-Herrera, J.; García-Pérez, B.E. Mycobacteria entry and trafficking into endothelial cells. Can. J. Microbiol. 2014, 60, 569–577. [Google Scholar] [CrossRef] [PubMed]
  47. Qin, H.; Zhang, Z.; Hang, X.; Jiang, Y.L. plantarum prevents enteroinvasive Escherichia coli-induced tight junction proteins changes in intestinal epithelial cells. BMC Microbiol. 2009, 9, 63. [Google Scholar] [CrossRef] [PubMed] [Green Version]
  48. Zihni, C.; Mills, C.; Matter, K.; Balda, M.S. Tight junctions: From simple barriers to multifunctional molecular gates. Nat. Reviews Mol. Cell Biol. 2016, 17, 564–580. [Google Scholar] [CrossRef] [PubMed]
  49. Wang, Y.; Zhang, J.; Yi, X.J.; Yu, F.S. Activation of ERK1/2 MAP kinase pathway induces tight junction disruption in human corneal epithelial cells. Exp. Eye Res. 2004, 78, 125–136. [Google Scholar] [CrossRef] [PubMed]
  50. Wolburg, H.; Lippoldt, A. Tight junctions of the blood-brain barrier: Development, composition and regulation. Vasc. Pharmacol. 2002, 38, 323–337. [Google Scholar] [CrossRef]
  51. Yu, L.C.; Wang, J.T.; Wei, S.C.; Ni, Y.H. Host-microbial interactions and regulation of intestinal epithelial barrier function: From physiology to pathology. World J. Gastrointest. Pathophysiol. 2012, 3, 27–43. [Google Scholar] [CrossRef] [PubMed]
  52. Kim, S.; Kim, G.H. Roles of claudin-2, ZO-1 and occludin in leaky HK-2 cells. PLoS ONE 2017, 12, e0189221. [Google Scholar] [CrossRef] [Green Version]
  53. Romero, A.; Ares, I.; Ramos, E.; Castellano, V.; Martínez, M.; Martínez-Larrañaga, M.R.; Anadón, A.; Martínez, M.A. Mycotoxins modify the barrier function of Caco-2 cells through differential gene expression of specific claudin isoforms: Protective effect of illite mineral clay. Toxicology 2016, 353–354, 21–33. [Google Scholar] [CrossRef] [PubMed]
  54. Chen, Z.; Chen, H.; Li, X.; Yuan, Q.; Su, J.; Yang, L.; Ning, L.; Lei, H. Fumonisin B (1) damages the barrier functions of porcine intestinal epithelial cells in vitro. J. Biochem. Mol. Toxicol. 2019, 33, e22397. [Google Scholar] [CrossRef]
  55. Zhang, Y.; Han, Y.; Zhao, Y.; Lv, Y.; Hu, Y.; Tan, Y.; Bi, X.; Yu, B.; Kou, J. DT-13 Ameliorates TNF-α-Induced Vascular Endothelial Hyperpermeability via Non-Muscle Myosin IIA and the Src/PI3K/Akt Signaling Pathway. Front. Immunol. 2017, 8, 925. [Google Scholar] [CrossRef] [PubMed] [Green Version]
Figure 1. FB1 reduces cell viability and changes cell morphology. (a) Cell viability was measured after FB1 exposure for 24, 48, and 72 h; (b) Effect of different concentrations of FB1 for 48 h on LDH activity in the supernatant of SUVECs; (c) The cell morphology of FB1-treated groups under light microscopy (×200); (d) HE staining of cell morphology (×400); (e) Representative TEM images showing the cell damage to SUVECs; the endoplasmic reticulum (black arrowheads) and mitochondrial swelling (black asterisk) were observed. The data were expressed as mean ± SD. * p < 0.05.
Toxins 13 00863 g001
Figure 2. FB1 blocks the cell cycle from the G1 phase to the S phase, thereby affecting cell proliferation. (a) Flow detection diagram of cell cycle of SUVECs treated with FB1 for 48 h; (b) Flow detection diagram of late apoptosis of SUVECs treated with FB1 for 48 h; (c) The effect of FB1 on the protein expression of PCNA, cyclin B1, Cdc25c, p21, and p53; (d) The effect of FB1 on the mRNA expression of PCNA, cyclin B1, cyclin D1, and cyclin E1; (e) The effect of FB1 on the mRNA expression of CDK-4, p21, p27, and p53. The data were expressed as mean ± SD. * p < 0.05.
Toxins 13 00863 g002
Figure 3. FB1 destroys the tight junctions of SUVECs. (a) Representative SEM images showing the ultrastructure of SUVECs (×300); (b) Representative phalloidin images showing microfilament skeleton of SUVECs (×200); (c) Representative TEM images showing the cell connection of SUVECs (×10,000); the destruction of tight junctions (black arrowheads) was observed. The data was expressed as mean ± SD.
Toxins 13 00863 g003
Figure 4. FB1 increases the cell membrane permeability of SUVECs. (a) Histogram of relative cell paracellular permeability in FB1-treated cells for 12, 24, and 48 h; (b) The effect of FB1 on the protein expression of claudin 1, occludin, and ZO-1; (c) The effect of FB1 on the mRNA expression of claudin 1, occludin, and ZO-1. The data were expressed as mean ± SD. * p < 0.05.
Toxins 13 00863 g004
Figure 5. Fumonisin B1 inhibits cell proliferation and decreases barrier function of swine umbilical vein endothelial cells.
Toxins 13 00863 g005
Table 1. Primer sequences of genes for qRT-PCR.
GenesPrimer SequencesGenebank No
p21F: 5′-ACCCCTTCCCCATACCC-3′
R: 5′-TTCCTAACACCCATGAAACTG-3′
XM_013977858.2
p27F:5′-GTCCCTTTCAGTGAGAACCG ATAC-3′
R: 5′-TTGCTGCCACATAACGGAATCAT-3′
NM_214316.1
p53F: 5′-CTGCTTCCTGAAAACAACC-3′
R: 5′-AAGGGACAAAGGACGACA-3′
NM_213824.3
PCNAF: 5′-GTGATTCCACCACCATGTTC-3′
R: 5′-TGAGACGACTCCATGCTCTG-3′
NM_001291925.1
Cyclin B1F: 5′-AACTGCTCTTGGAGACATCGGT-3′
R: 5′-TGGTTCAGGCTCCAGTTCAGG-3′
NM_001170768.1
Cyclin D1F: 5′-GCGAGGAACAGAAGTGCG-3′
R: 5′-TGGAGTTGTCGGTGTAGATGC-3′
XM_021082686.1
Cyclin E1F: 5′-CTCGCCACTGCCTATACTGA-3′
R: 5′-GGTGCCGCTGCATAAGGT-3′
XM_005653265.2
CDK-4F: 5′-GCGGAGATTGGTGTTGGTG-3′
R: 5′-CATTGGGGACTCTTACGCTCTT-3′
NM_001123097.1
Claudin 1F: 5′- GCAGCAGCTTCTTGCTTCTC-3′
R: 5′-CTGGCATTGACTGGGGTCAT-3′
NM_001244539.1
OccludinF: 5′-ATCAACAAAGGCAACTCT -3′
R: 5′-GCAGCAGCCATGTACTCT -3′
XM_005672525.3
ZO-1F: 5′-GAGTTTGATATGGGCGTT -3′
R: 5′-GTGGGAGGATGCTGTTGT -3′
XM_021098896.1
GAPDHF: 5′-ACAGGGTGGTGGACCTCATG -3′
R: 5′-GGGTCTGGGATGGAAACTGG -3′
XM_021091114.1
Publisher’s Note: MDPI stays neutral with regard to jurisdictional claims in published maps and institutional affiliations.

