Change of Amino Acid Residues in Idiotypic Nanobodies Enhanced the Sensitivity of Competitive Enzyme Immunoassay for Mycotoxin Ochratoxin A in Cereals


Abstract
:1. Introduction
2. Results and Discussion
2.1. Bio-Panning
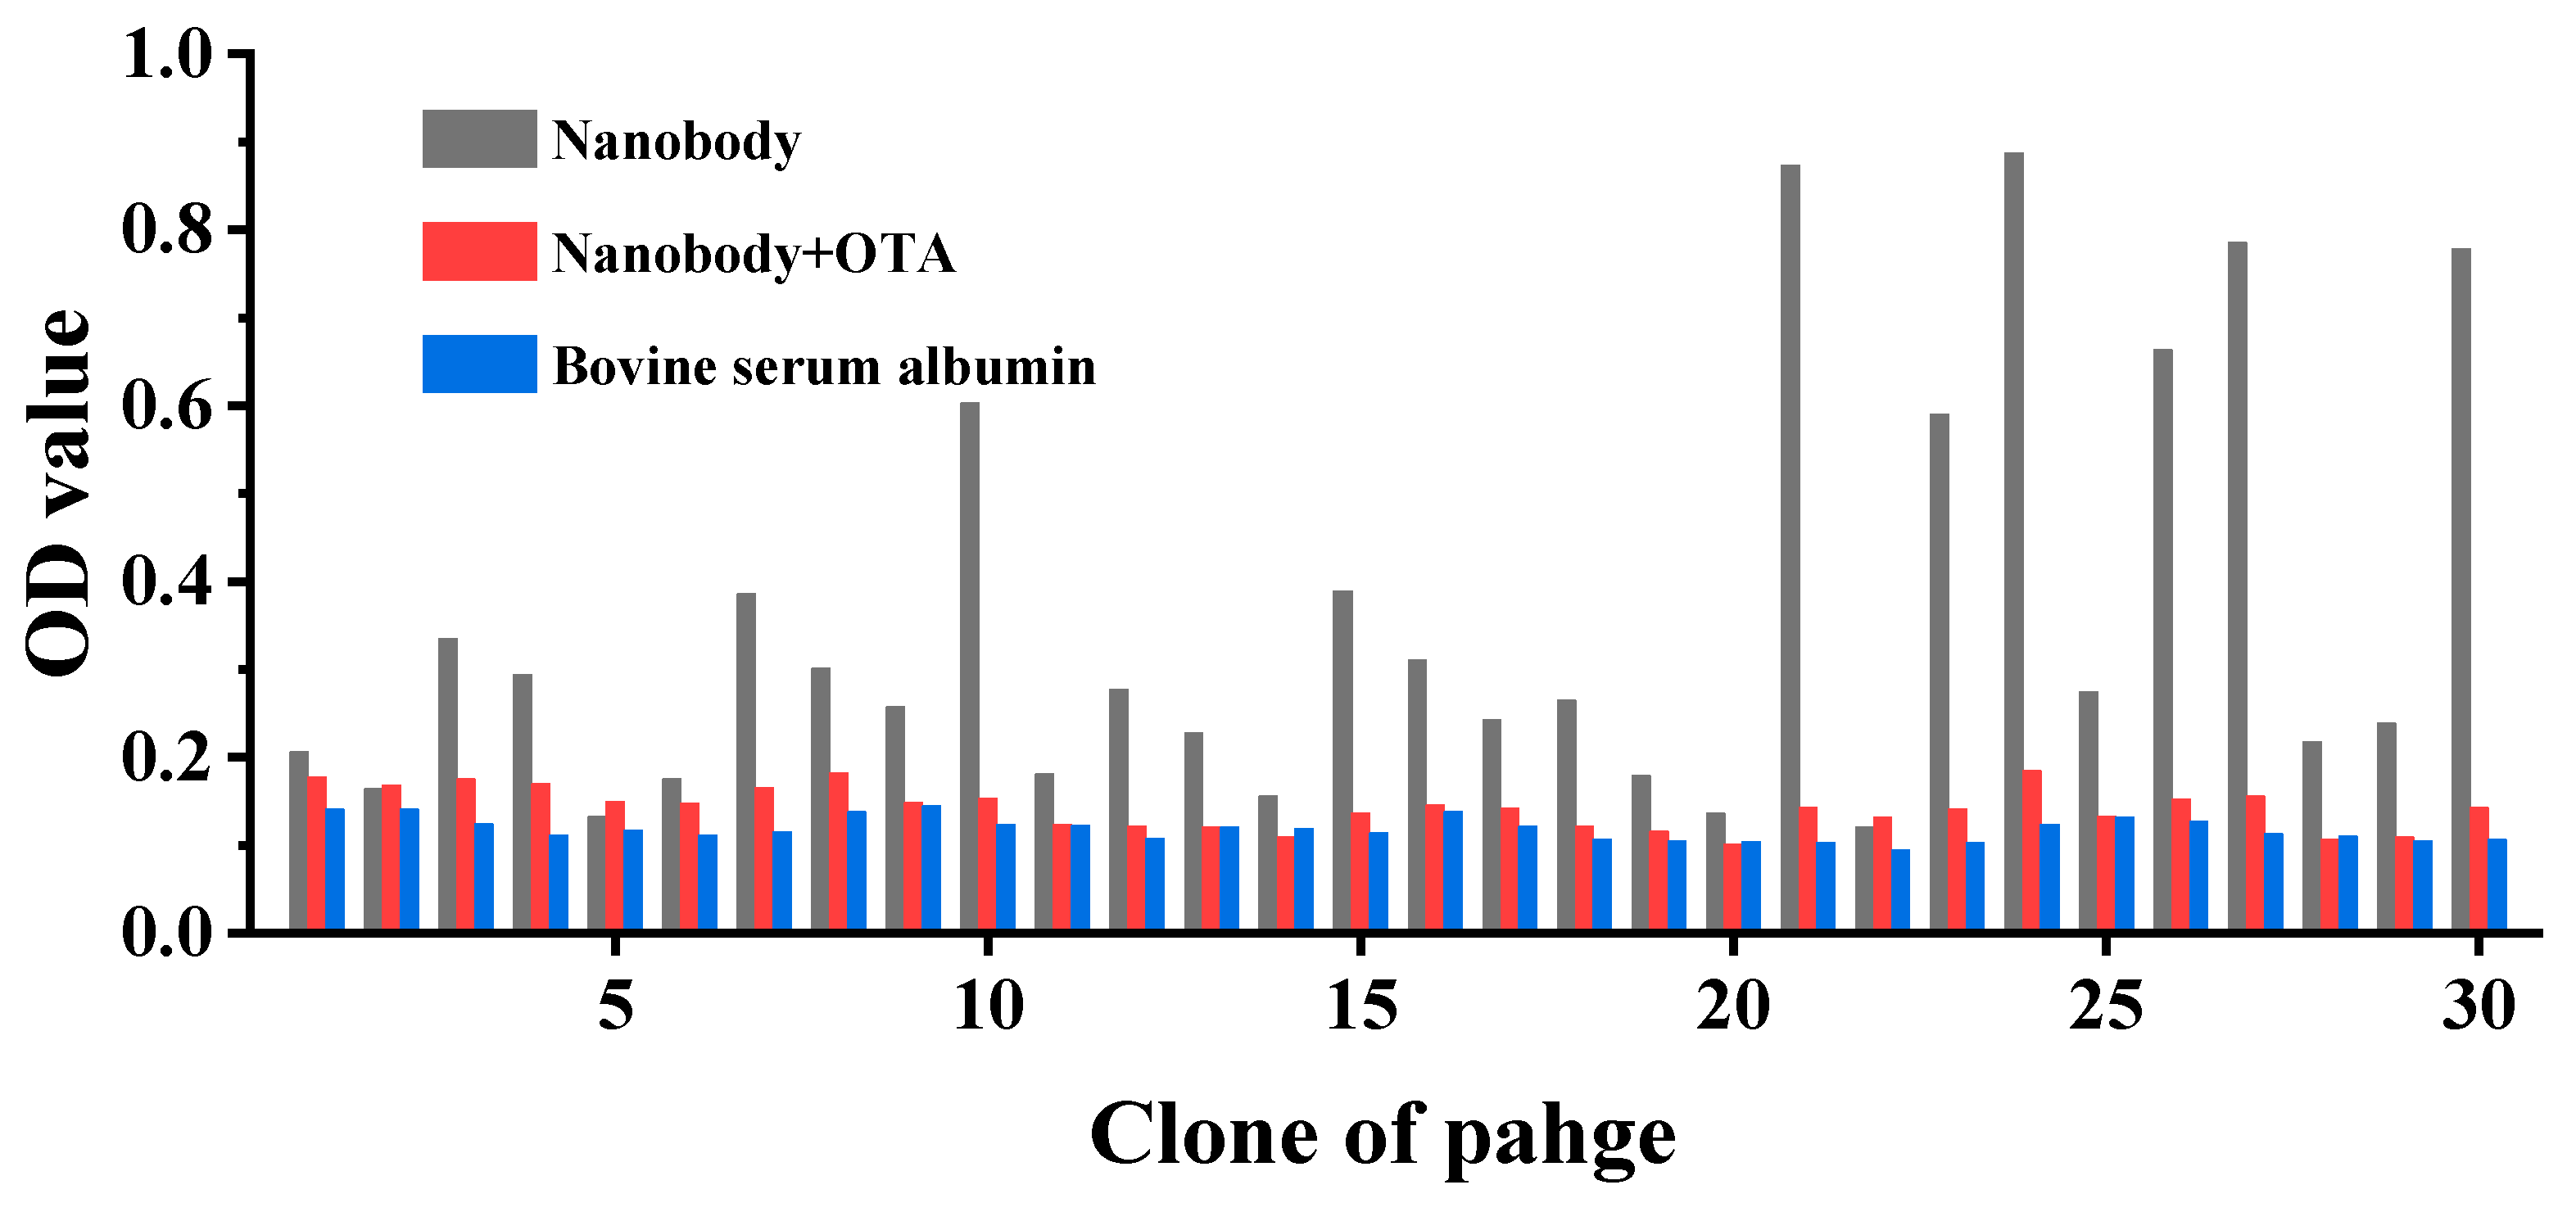
2.2. Identification of Positive Clone
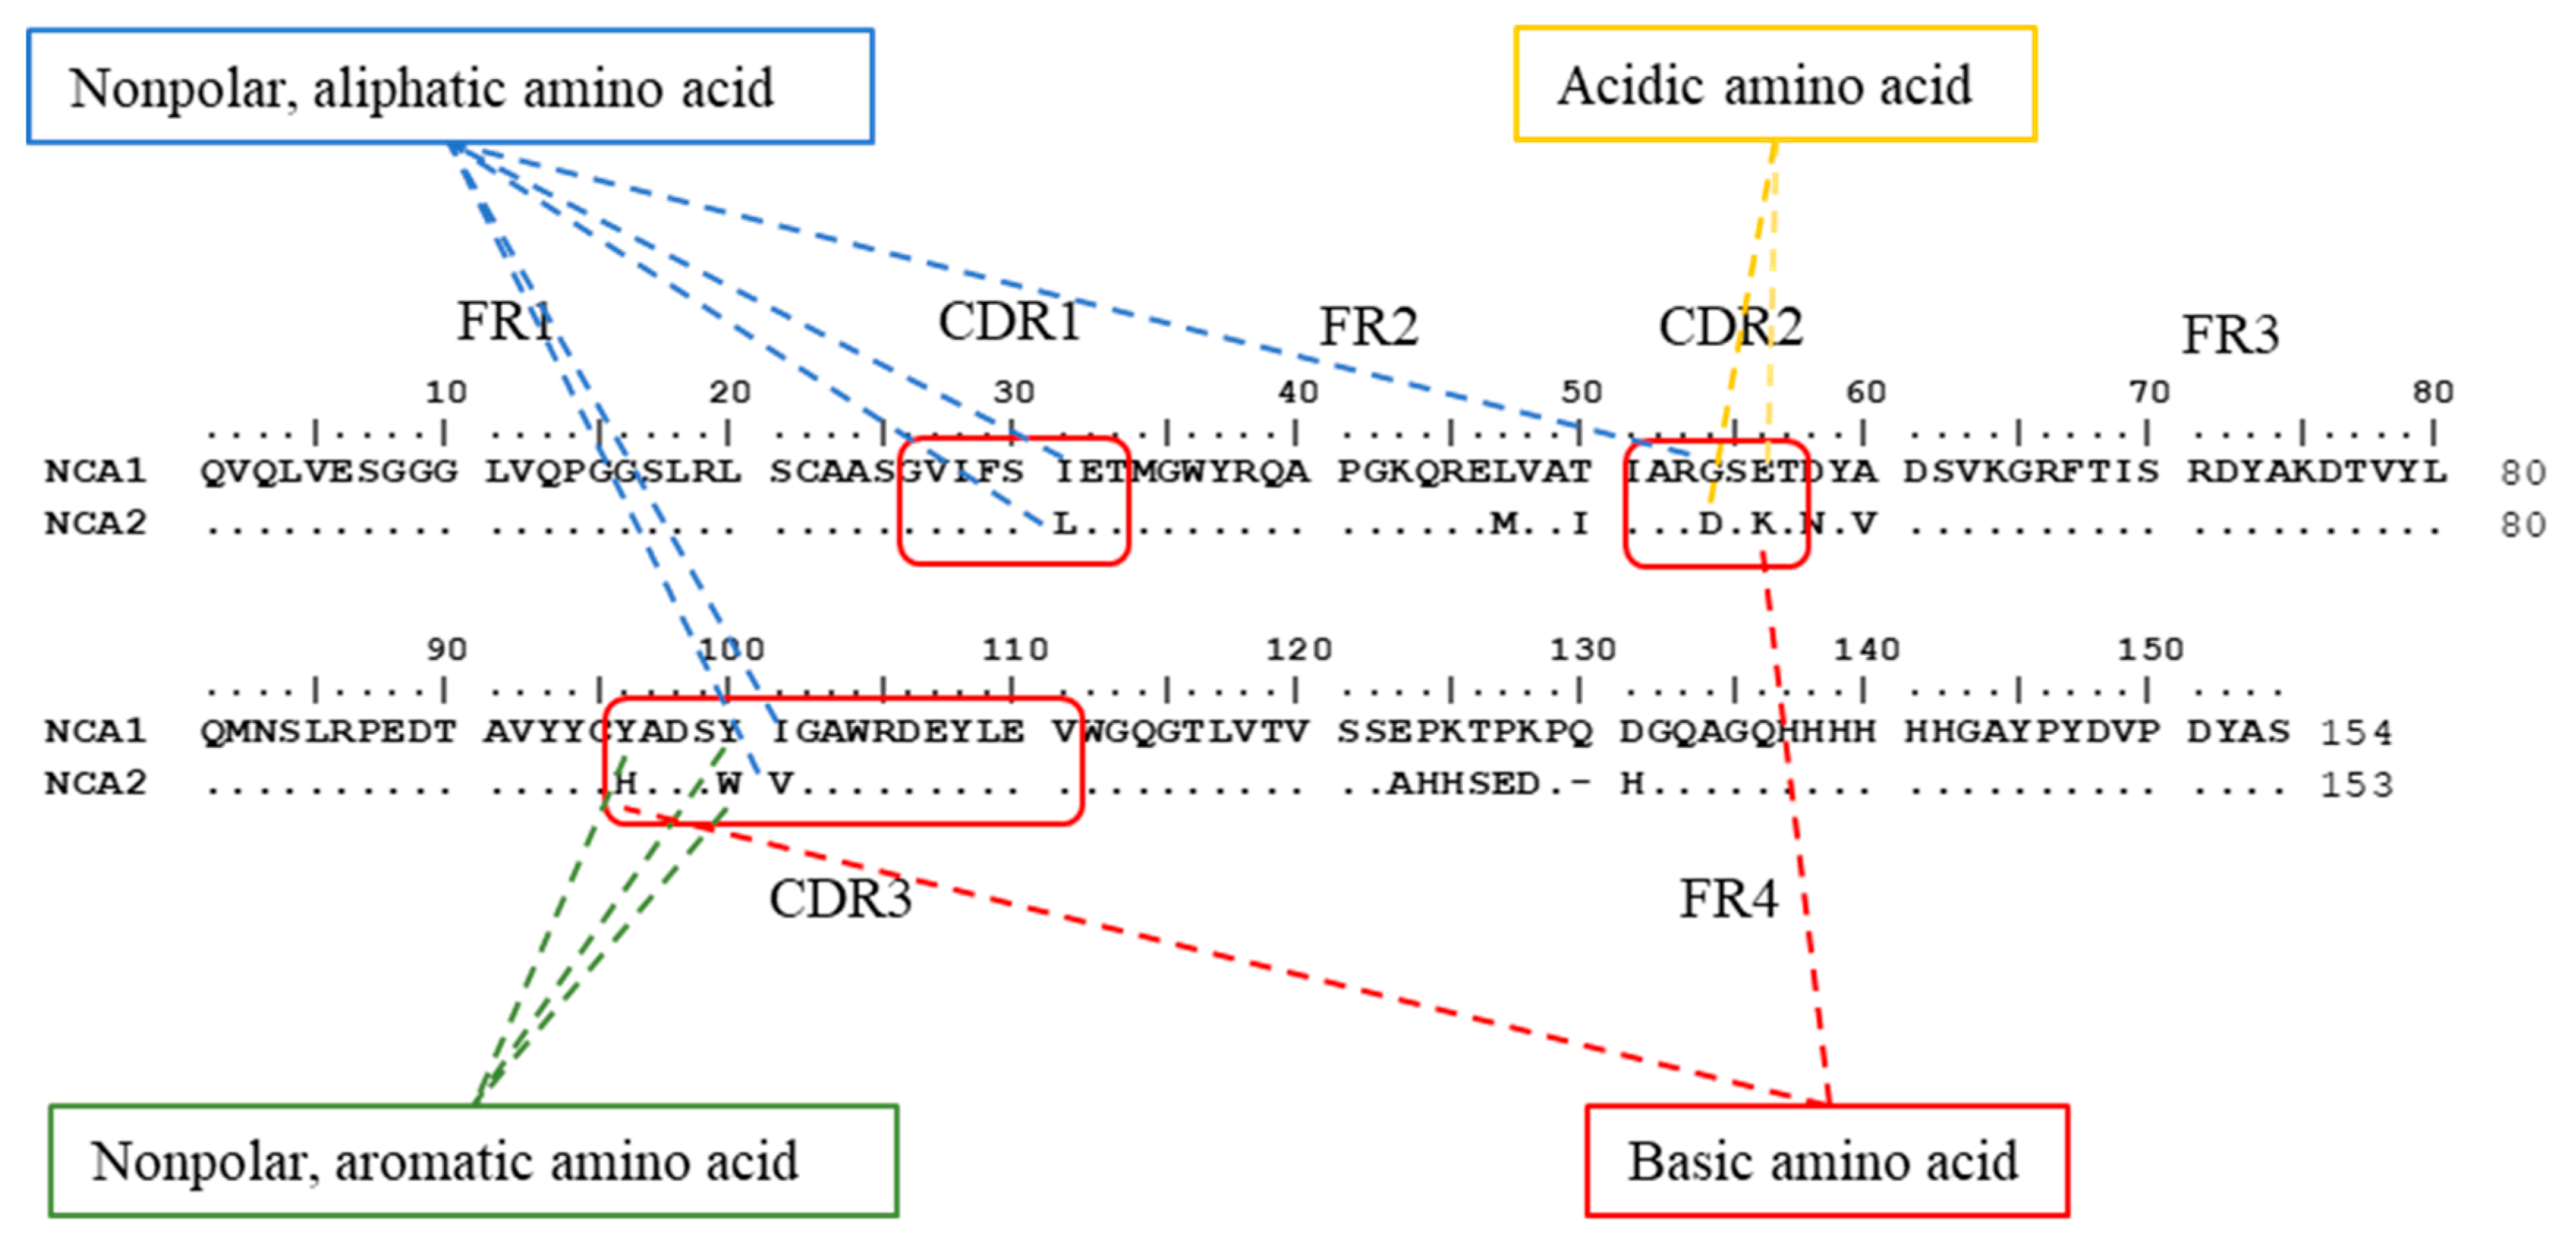
2.3. Comparison of NCAs
2.3.1. Comparison of Prime Structure and Spatial Structure
2.3.2. Comparison of Affinity and Sensitivity
2.4. Evaluation of NCA2-Based Antigen Substitute ELISA Method
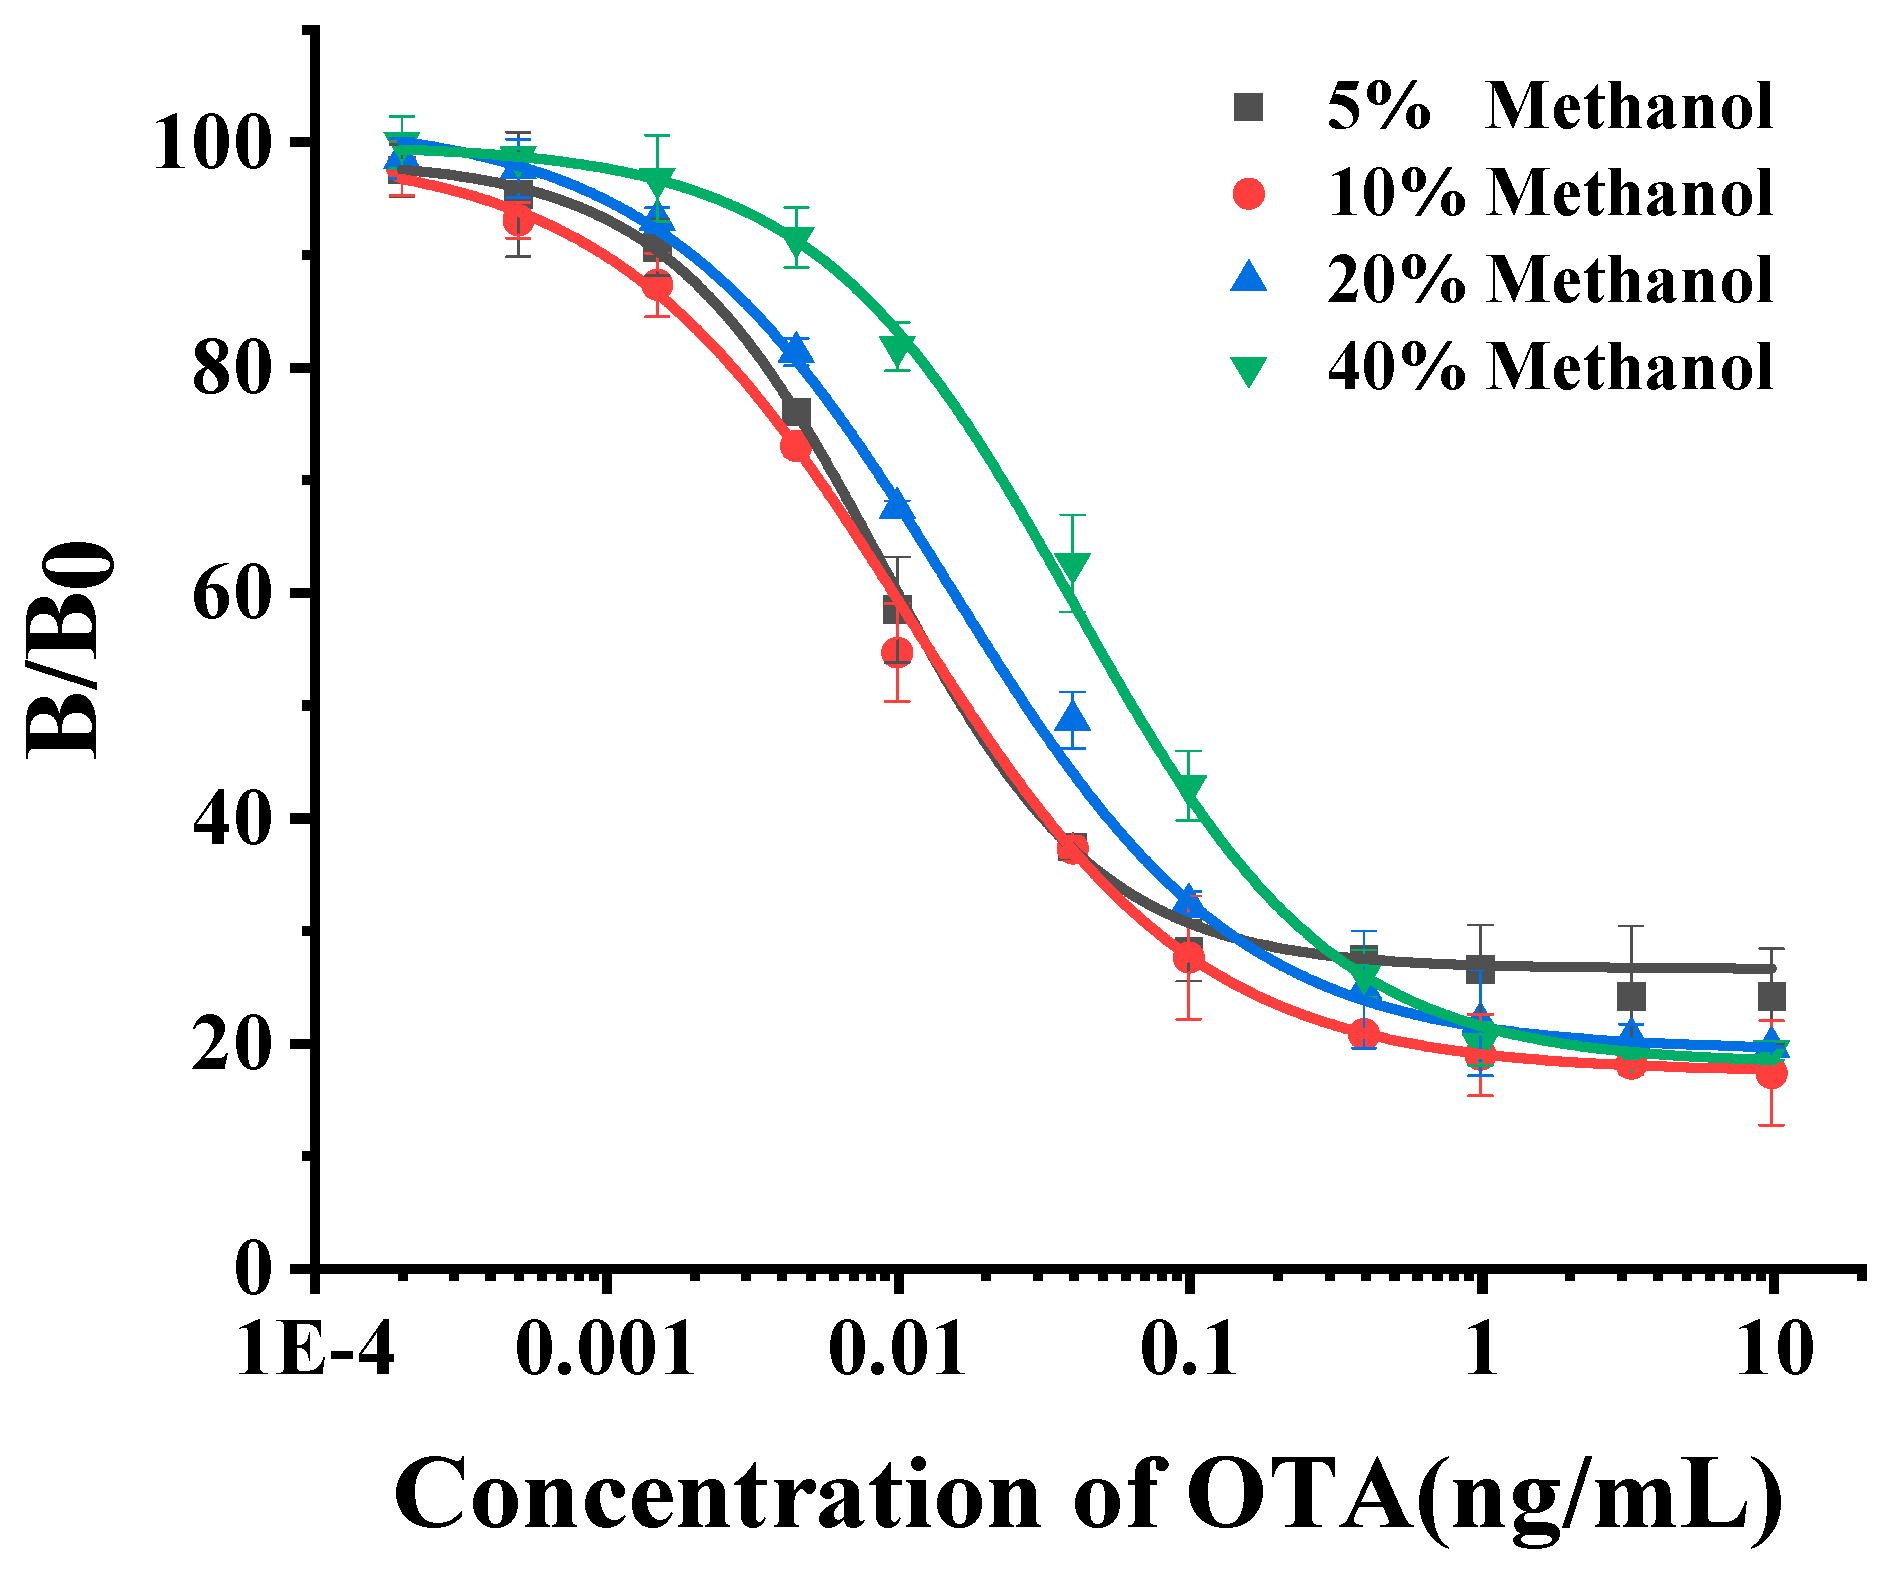
2.4.1. Evaluation of Methanol Effect
2.4.2. Standard Curve
2.4.3. Evaluation of Matrix Effect
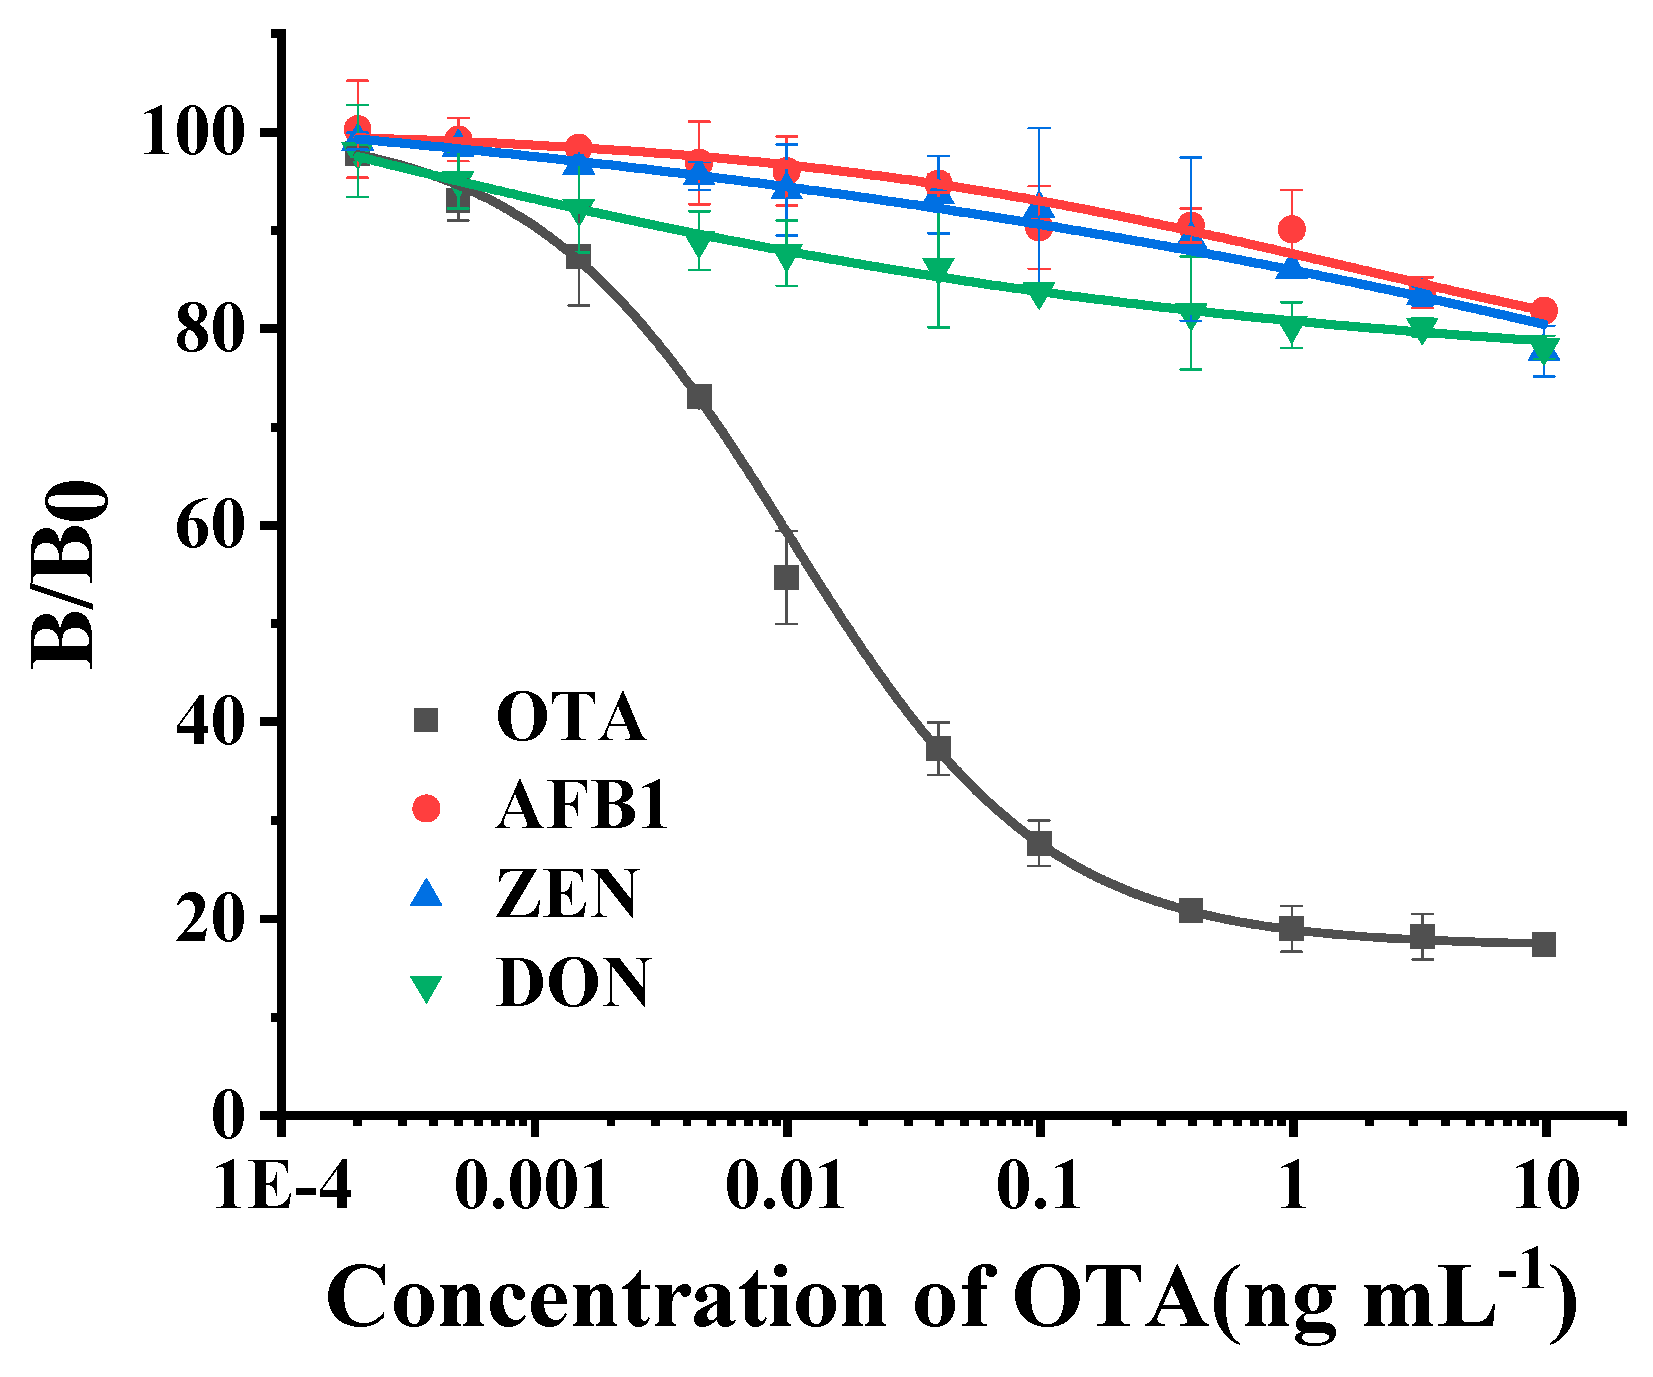
2.4.4. Evaluation of Cross-Reactivity
2.4.5. Evaluation of Recovery
3. Conclusions
4. Materials and Methods
4.1. Materials and Reagents
4.2. Safety
4.3. Alpaca Immunization
4.4. Phage-Displayed Library Construction
4.5. Bio-Panning
4.6. Identification of Positive Clone
4.7. Expression and Purification of Nanobody
4.8. Comparison of NCAs
4.8.1. Comparison of Prime Structure and Spatial Structure
4.8.2. Comparison of Affinity and Sensitivity
4.9. Evaluation of the NCA-Based Eco-Friendly ELISA
4.9.1. Evaluation of Methanol Effect
4.9.2. Evaluation of Matrix Effect
4.9.3. Standard Curve
4.9.4. Evaluation of Cross-Reactivity
4.9.5. Evaluation of Recovery
4.10. Sample Preparation
Supplementary Materials
Author Contributions
Funding
Conflicts of Interest
References
- Zhang, D.; Li, P.; Liu, W.; Zhao, L.; Zhang, Q.; Zhang, W.; Ding, X.; Wang, J. Development of a detector-free semiquantitative immunochromatographic assay with major aflatoxins as target analytes. Sens. Actuators B Chem. 2013, 185, 432–443. [Google Scholar] [CrossRef]
- Zhu, Y.; Liu, C.-L.; Xie, Z.-J.; Liu, L.-Q.; Peng, C.-F.; Xue, F. Botryoid-shaped nanoparticles-enhanced ELISA for ochratoxin A. Food Agric. Immunol. 2016, 28, 1–11. [Google Scholar] [CrossRef] [Green Version]
- Jiang, H.; Li, X.; Xiong, Y.; Pei, K.; Nie, L.; Xiong, Y. Silver Nanoparticle-Based Fluorescence-Quenching Lateral Flow Immunoassay for Sensitive Detection of Ochratoxin A in Grape Juice and Wine. Toxins 2017, 9, 83. [Google Scholar] [CrossRef] [Green Version]
- Tang, Z.; Liu, X.; Wang, Y.; Chen, Q.; Hammock, B.D.; Xu, Y. Nanobody-based fluorescence resonance energy transfer immunoassay for noncompetitive and simultaneous detection of ochratoxin a and ochratoxin B. Environ. Pollut. 2019, 251, 238–245. [Google Scholar] [CrossRef]
- Wang, Y.; Li, P.; Majkova, Z.; Bever, C.R.S.; Kim, H.J.; Zhang, Q.; Dechant, J.E.; Gee, S.J.; Hammock, B.D. Isolation of Alpaca Anti-Ldiotypic Heavy-Chain Single-Domain Antibody for the Aflatoxin Immunoassay. Anal. Chem. 2013, 85, 8298–8303. [Google Scholar] [CrossRef] [PubMed] [Green Version]
- Hsu, K.; Chu, F.S. Anti-idiotype and anti-anti-idiotype antibodies generated from polyclonal antibodies against aflatoxin b1. Food Agric. Immunol. 1995, 7, 139–151. [Google Scholar] [CrossRef]
- Guan, D.; Li, P.; Cui, Y.; Zhang, Q.; Zhang, W. A competitive immunoassay with a surrogate calibrator curve for aflatoxin M1 in milk. Anal. Chim. Acta 2011, 703, 64–69. [Google Scholar] [CrossRef]
- Nogami, K.; Soeda, T.; Matsumoto, T.; Kawabe, Y.; Kitazawa, T.; Shima, M. Routine measurements of factor VIII activity and inhibitor titer in the presence of emicizumab utilizing anti-idiotype monoclonal antibodies. J. Thromb. Haemost. 2018, 16, 1383–1390. [Google Scholar] [CrossRef] [Green Version]
- Schumacher, D.; Helma, J.; Schneider, A.F.L.; Leonhardt, H.; Hackenberger, C.P.R. Nanobodies: Chemical Functionalization Strategies and Intracellular Applications. Angew. Chem. Int. Ed. 2018, 57, 2314–2333. [Google Scholar] [CrossRef]
- De Meyer, T.; Muyldermans, S.; Depicker, A. Nanobody-based products as research and diagnostic tools. Trends Biotechnol. 2014, 32, 263–270. [Google Scholar] [CrossRef]
- Bernedo-Navarro, R.A.; Romão, E.; Yano, T.; Pinto, J.; De Greve, H.; Sterckx, Y.G.-J.; Muyldermans, S. Structural Basis for the Specific Neutralization of Stx2a with a Camelid Single Domain Antibody Fragment. Toxins 2018, 10, 108. [Google Scholar] [CrossRef] [Green Version]
- Könning, D.; Zielonka, S.; Grzeschik, J.; Empting, M.; Valldorf, B.; Krah, S.; Schröter, C.; Sellmann, C.; Hock, B.; Kolmar, H. Camelid and shark single domain antibodies: Structural features and therapeutic potential. Curr. Opin. Struct. Boil. 2017, 45, 10–16. [Google Scholar] [CrossRef] [PubMed]
- Harmsen, M.M.; Ruuls, R.C.; Nijman, I.; Niewold, T.; Frenken, L.; De Geus, B. Llama heavy-chain V regions consist of at least four distinct subfamilies revealing novel sequence features. Mol. Immunol. 2000, 37, 579–590. [Google Scholar] [CrossRef]
- E Conrath, K.; Wernery, U.; Muyldermans, S.; Nguyen, V.K. Emergence and evolution of functional heavy-chain antibodies in Camelidae. Dev. Comp. Immunol. 2003, 27, 87–103. [Google Scholar] [CrossRef]
- Heussner, A.; Bingle, L.E.H. Comparative Ochratoxin Toxicity: A Review of the Available Data. Toxins 2015, 7, 4253–4282. [Google Scholar] [CrossRef] [Green Version]
- Tao, Y.; Xie, S.; Xu, F.; Liu, A.; Wang, Y.; Chen, N.; Pan, Y.; Huang, L.; Peng, D.; Wang, X.; et al. Ochratoxin A: Toxicity, oxidative stress and metabolism. Food Chem. Toxicol. 2018, 112, 320–331. [Google Scholar] [CrossRef]
- Markaki, P.; Delpont-Binet, C.; Grosso, F.; Dragacci, S. Determination of Ochratoxin A in Red Wine and Vinegar by Immunoaffinity High-Pressure Liquid Chromatography. J. Food Prot. 2001, 64, 533–537. [Google Scholar] [CrossRef]
- Zaied, C.; Abid, S.; Zorgui, L.; Bouaziz, C.; Chouchane, S.; Jomaa, M.; Bacha, H. Natural occurrence of ochratoxin A in Tunisian cereals. Food Control. 2009, 20, 218–222. [Google Scholar] [CrossRef]
- Bostan, H.B.; Danesh, N.M.; Karimi, G.R.; Ramezani, M.; Shaegh, S.A.M.; Youssefi, K.; Charbgoo, F.; Abnous, K.; Taghdisi, S.M. Ultrasensitive detection of ochratoxin A using aptasensors. Biosens. Bioelectron. 2017, 98, 168–179. [Google Scholar] [CrossRef]
- Huertas-Pérez, J.F.; Arroyo-Manzanares, N.; García-Campaña, A.; Gámiz-Gracia, L. Solid Phase Extraction as Sample Treatment for the Determination of Ochratoxin A in Foods: A Review. Crit. Rev. Food Sci. Nutr. 2016, 57, 3405–3420. [Google Scholar] [CrossRef]
- Vukelic, M.; Šoštarić, B.; Belicza, M. Pathomorphology of Balkan endemic nephropathy. Food Chem. Toxicol. 1992, 30, 193–200. [Google Scholar] [CrossRef]
- Gekle, M.; Silbernagl, S. Mechanism of ochratoxin A-induced reduction of glomerular filtration rate in rats. J. Pharmacol. Exp. Ther. 1993, 267, 316–321. [Google Scholar] [PubMed]
- Grosso, F.; Saıd, S.; Mabrouk, I.; Fremy, J.; Castegnaro, M.; Jemmali, M.; Dragacci, S. New data on the occurrence of ochratoxin A in human sera from patients affected or not by renal diseases in Tunisia. Food Chem. Toxicol. 2003, 41, 1133–1140. [Google Scholar] [CrossRef]
- Lock, E.A.; Hard, G.C. Chemically induced renal tubule tumors in the laboratory rat and mouse: Review of the NCI/NTP database and categorization of renal carcinogens based on mechanistic information. Crit. Rev. Toxicol. 2004, 34, 211–299. [Google Scholar] [CrossRef] [PubMed]
- Rutigliano, L.; Valentini, L.; Martino, N.A.; Pizzi, F.; Zanghi’, A.; Dell’Aquila, M.E.; Minervini, F. Ochratoxin A at low concentrations inhibits in vitro growth of canine umbilical cord matrix mesenchymal stem cells through oxidative chromatin and DNA damage. Reprod. Toxicol. 2015, 57, 121–129. [Google Scholar] [CrossRef]
- Malir, F.; Ostrý, V.; Pfohl-Leszkowicz, A.; Malir, J.; Toman, J. Ochratoxin A: 50 Years of Research. Toxins 2016, 8, 191. [Google Scholar] [CrossRef] [Green Version]
- Fan, K.; Jiang, B.; Guan, Z.; He, J.; Yang, N.; Xie, N.; Nie, G.; Xie, C.; Yan, X. Fenobody: A Ferritin-Displayed Nanobody with High Apparent Affinity and Half-Life Extension. Anal. Chem. 2018, 90, 5671–5677. [Google Scholar] [CrossRef]
- Li, X.; Li, P.; Zhang, Q.; Zhang, Z.; Li, R.; Zhang, W.; Ding, X.; Chen, X.; Tang, X. A Sensitive Immunoaffinity Column-Linked Indirect Competitive ELISA for Ochratoxin A in Cereal and Oil Products Based on a New Monoclonal Antibody. Food Anal. Methods 2013, 6, 1433–1440. [Google Scholar] [CrossRef]
- Liu, X.; Tang, Z.; Duan, Z.; He, Z.; Shu, M.; Wang, X.; Gee, S.J.; Hammock, B.D.; Xu, Y. Nanobody-based enzyme immunoassay for ochratoxin A in cereal with high resistance to matrix interference. Talanta 2017, 164, 154–158. [Google Scholar] [CrossRef] [Green Version]
- Sun, Z.; Lv, J.; Liu, X.; Tang, Z.; Wang, X.; Xu, Y.; Hammock, B.D. Development of a Nanobody-AviTag Fusion Protein and Its Application in a Streptavidin–Biotin-Amplified Enzyme-Linked Immunosorbent Assay for Ochratoxin A in Cereal. Anal. Chem. 2018, 90, 10628–10634. [Google Scholar] [CrossRef]
- Yao, J.; Xing, G.-X.; Han, J.; Sun, Y.; Wang, F.; Deng, R.; Hu, X.; Zhang, G. Novel fluoroimmunoassays for detecting ochratoxin A using CdTe quantum dots. J. Biophotonics 2016, 10, 657–663. [Google Scholar] [CrossRef] [PubMed]
- He, T.; Wang, Y.; Li, P.; Zhang, Q.; Lei, J.; Zhang, Z.; Ding, X.; Zhou, H.; Zhang, W. Nanobody-Based Enzyme Immunoassay for Aflatoxin in Agro-Products with High Tolerance to Cosolvent Methanol. Anal. Chem. 2014, 86, 8873–8880. [Google Scholar] [CrossRef] [PubMed]
- Beatty, J.; Beatty, B.G.; Vlahos, W.G. Measurement of monoclonal antibody affinity by non-competitive enzyme immunoassay. J. Immunol. Methods 1987, 100, 173–179. [Google Scholar] [CrossRef]
- Ren, X.; Zhang, Q.; Wu, W.; Yan, T.; Tang, X.; Zhang, W.; Yu, L.; Li, P. Anti-idiotypic nanobody-phage display-mediated real-time immuno-PCR for sensitive, simultaneous and quantitative detection of total aflatoxins and zearalenone in grains. Food Chem. 2019, 297, 124912. [Google Scholar] [CrossRef]


| Name | Structure a | Affinity Constant (L mol−1) | IC50 (ng mL−1) |
|---|---|---|---|
| NCA1 | 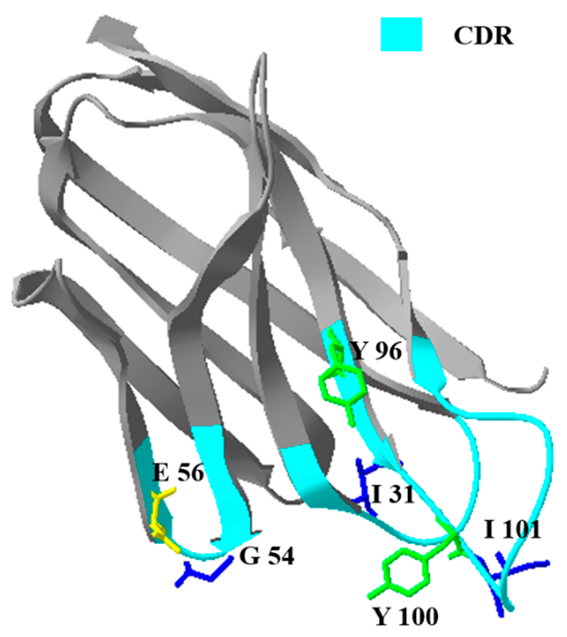 | 1.20 × 10⁸ | 0.052 |
| NCA2 |  | 5.36 × 10⁸ | 0.015 |
| Assay Methods | Assay Target | IC50 (ng mL−1) | Reference |
|---|---|---|---|
| A sensitive immunoaffinity column-linked ELISA | OTA 1 | 0.058 | [28] |
| Botryoid-shaped Au/Ag nanoparticles enhanced ELISA | OTA | 0.05 | [2] |
| Nanobody-based ELISA | OTA | 0.64 | [29] |
| Nanobody-AviTag fusion protein-based biotin-streptavidin-amplified ELISA | OTA | 0.14 | [30] |
| CdTe quantum dots based direct and indirect competitive fluorescence-linked immunosorbent assays | OTA | 0.63 and 0.234 | [31] |
| Current method | OTA | 0.017 |
| Name | Spiked (μg kg−1) | Measured + SD 1 (μg kg−1) | Average Recovery (%) | RSD 2 (%) |
|---|---|---|---|---|
| intra assay (n = 3) 3 | ||||
| Corn | 50 | 57.4 ± 4.8 | 114.8 | 8.4 |
| 20 | 17.1 ± 0.9 | 85.3 | 5.3 | |
| 10 | 8.0 ± 0.4 | 80.0 | 5.0 | |
| Rice | 50 | 49.3 ± 6.0 | 98.6 | 12.2 |
| 20 | 16.6 ± 0.3 | 83.0 | 1.8 | |
| 10 | 9.6 ± 0.8 | 96.0 | 8.3 | |
| Wheat | 50 | 52.9 ± 5.4 | 105.8 | 10.2 |
| 20 | 17.7 ± 0.6 | 88.5 | 3.4 | |
| 10 | 9.5 ± 0.4 | 95.0 | 4.2 | |
| inter-assay (n = 5) 4 | ||||
| Wheat | 50 | 51.3 ± 6.3 | 102.6 | 12.3 |
| 20 | 17.9 ± 0.8 | 89.5 | 4.5 | |
| 10 | 9.6 ± 0.3 | 96.0 | 3.1 | |
© 2020 by the authors. Licensee MDPI, Basel, Switzerland. This article is an open access article distributed under the terms and conditions of the Creative Commons Attribution (CC BY) license (http://creativecommons.org/licenses/by/4.0/).
Share and Cite
Zhang, C.; Zhang, W.; Tang, X.; Zhang, Q.; Zhang, W.; Li, P. Change of Amino Acid Residues in Idiotypic Nanobodies Enhanced the Sensitivity of Competitive Enzyme Immunoassay for Mycotoxin Ochratoxin A in Cereals. Toxins 2020, 12, 273. https://doi.org/10.3390/toxins12040273
Zhang C, Zhang W, Tang X, Zhang Q, Zhang W, Li P. Change of Amino Acid Residues in Idiotypic Nanobodies Enhanced the Sensitivity of Competitive Enzyme Immunoassay for Mycotoxin Ochratoxin A in Cereals. Toxins. 2020; 12(4):273. https://doi.org/10.3390/toxins12040273
Chicago/Turabian StyleZhang, Caixia, Weiqi Zhang, Xiaoqian Tang, Qi Zhang, Wen Zhang, and Peiwu Li. 2020. "Change of Amino Acid Residues in Idiotypic Nanobodies Enhanced the Sensitivity of Competitive Enzyme Immunoassay for Mycotoxin Ochratoxin A in Cereals" Toxins 12, no. 4: 273. https://doi.org/10.3390/toxins12040273
APA StyleZhang, C., Zhang, W., Tang, X., Zhang, Q., Zhang, W., & Li, P. (2020). Change of Amino Acid Residues in Idiotypic Nanobodies Enhanced the Sensitivity of Competitive Enzyme Immunoassay for Mycotoxin Ochratoxin A in Cereals. Toxins, 12(4), 273. https://doi.org/10.3390/toxins12040273