Article

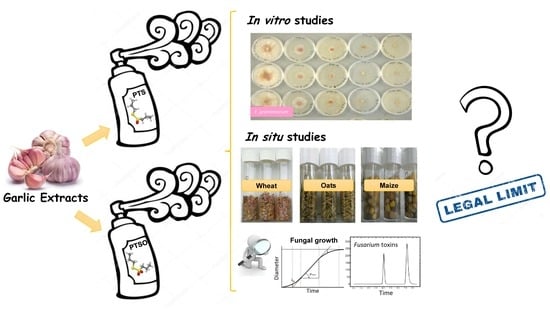
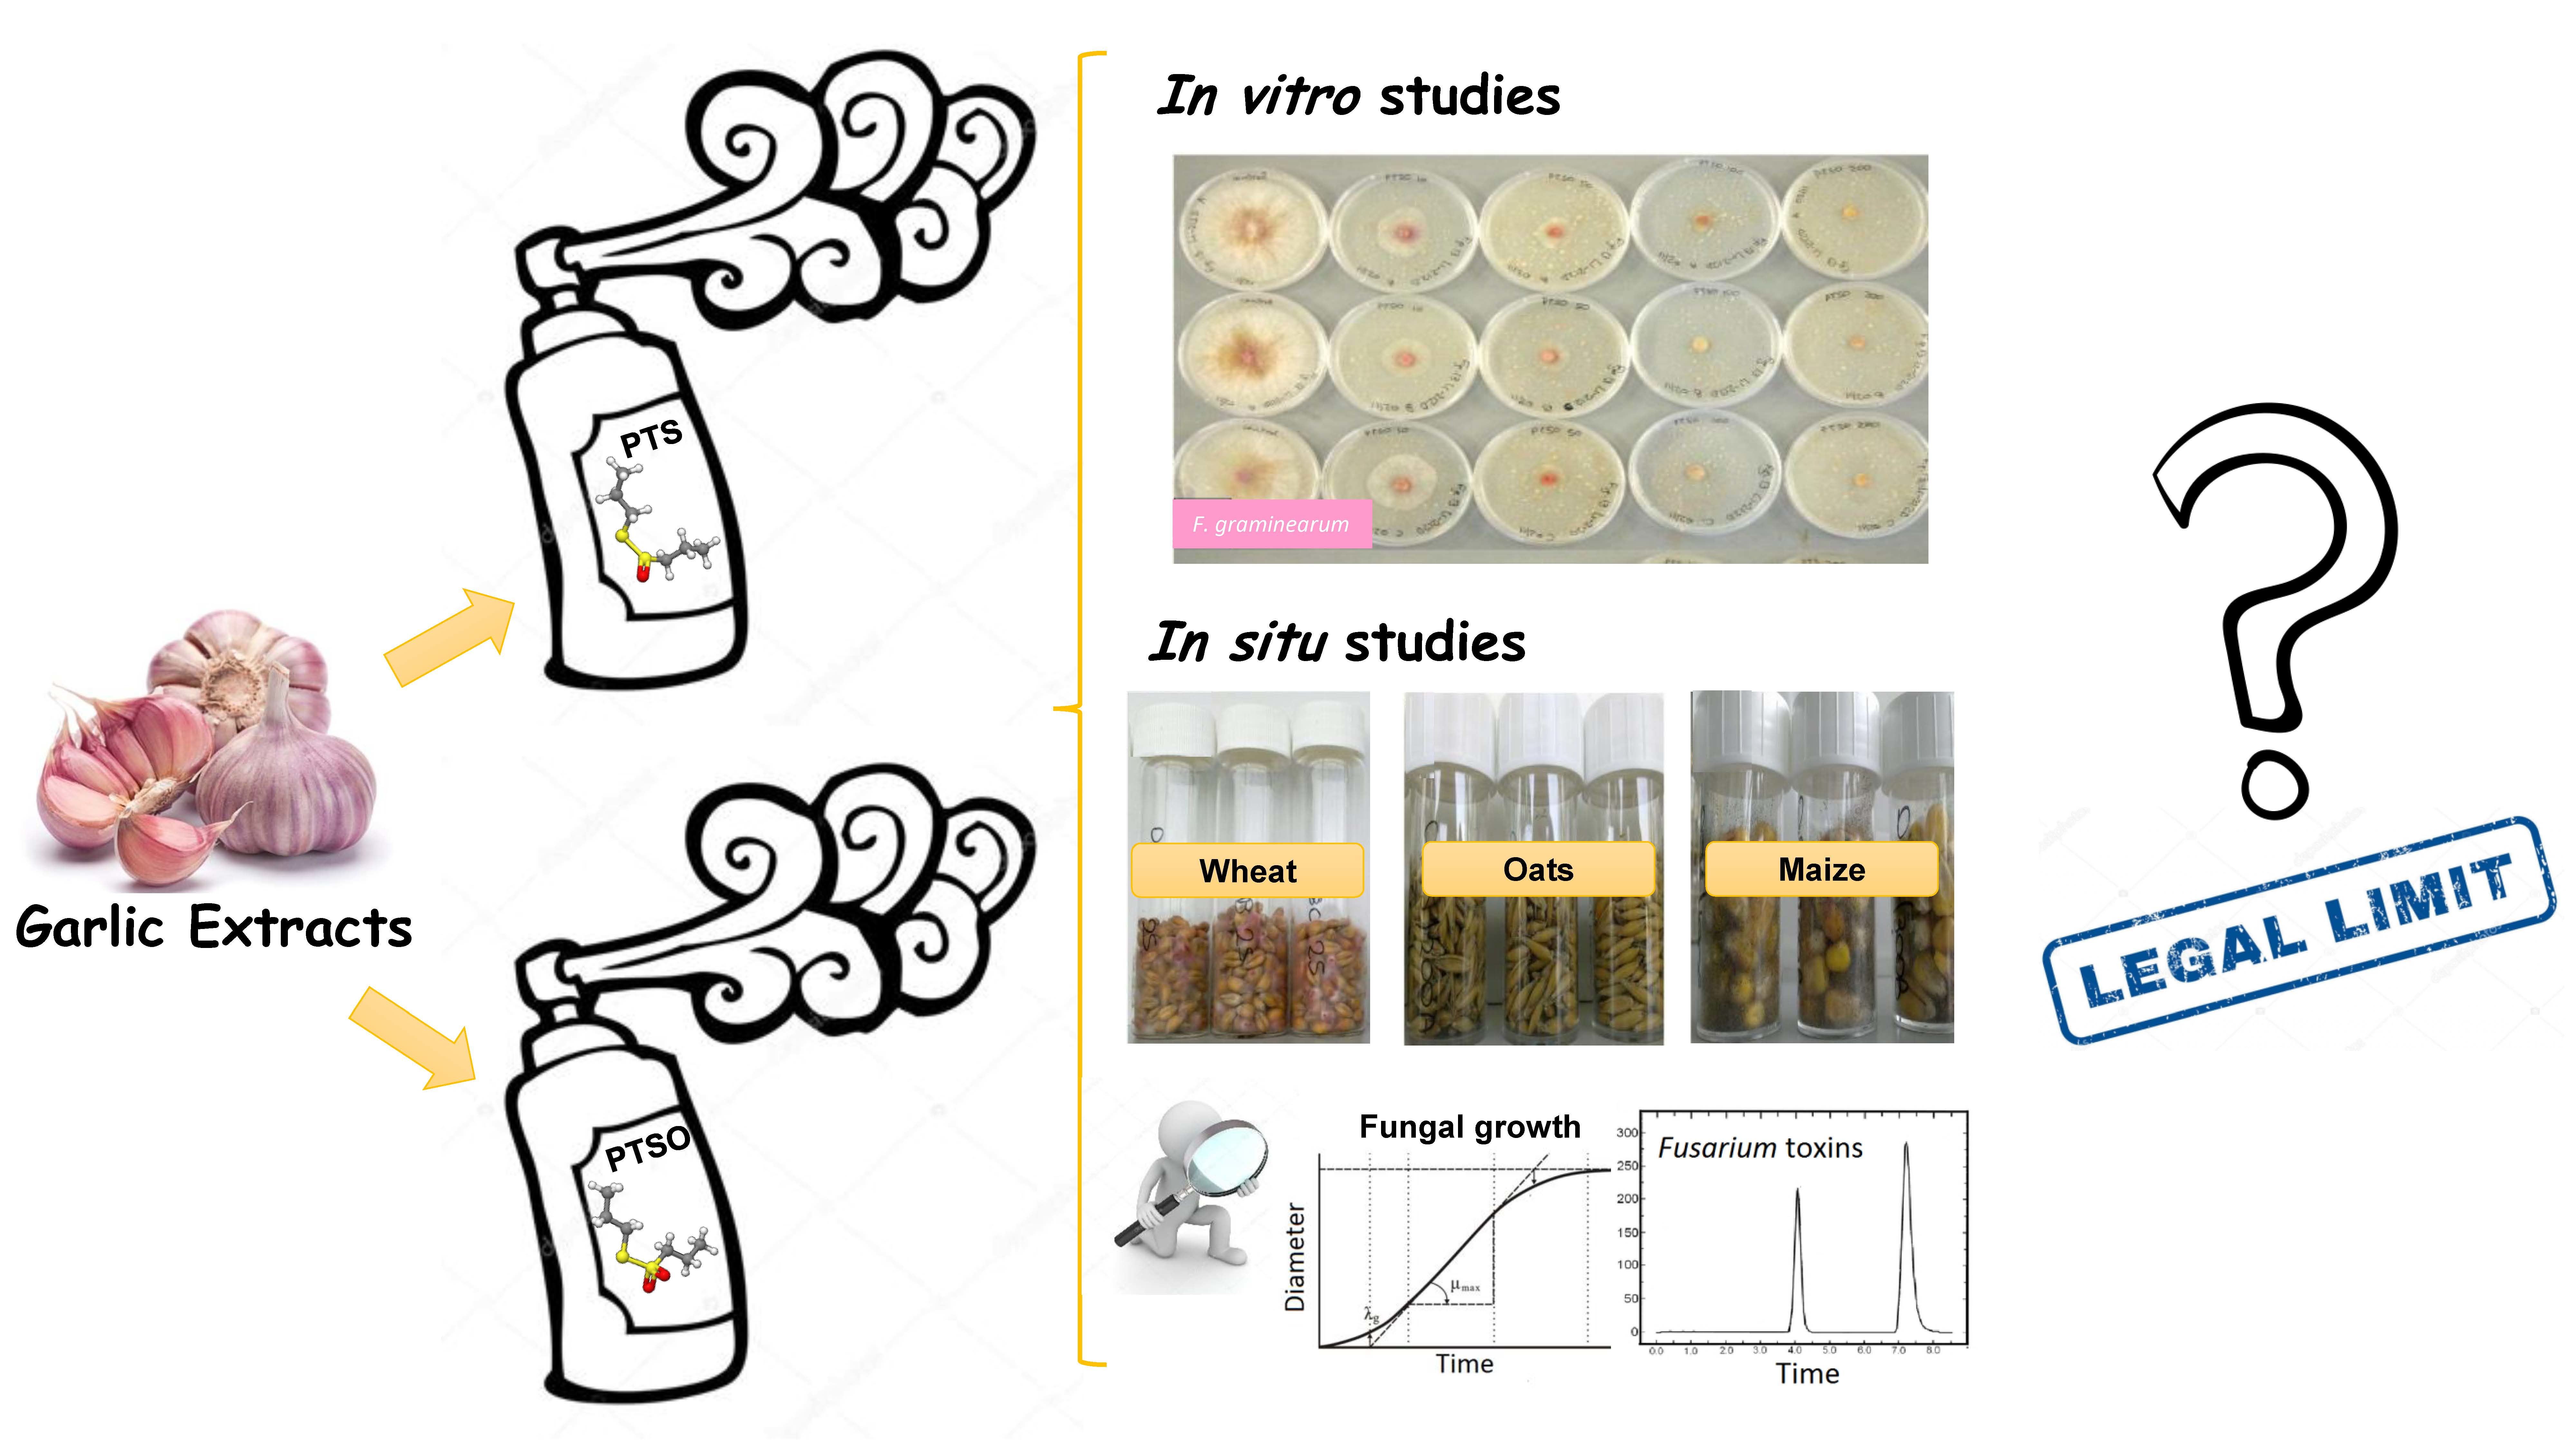
Influence of Two Garlic-Derived Compounds, Propyl Propane Thiosulfonate (PTS) and Propyl Propane Thiosulfinate (PTSO), on Growth and Mycotoxin Production by Fusarium Species In Vitro and in Stored Cereals

1
Applied Mycology Group, Environment and AgriFood Theme, Cranfield University, Cranfield MK43 0AL, UK
2
Institute of Bioanalytics and Agro-Metabolomics, Department of Agrobiotechnology (IFA-Tulln), University of Natural Resources and Life Sciences, Vienna, Konrad Lorenzstr. 20, A-3430 Tulln, Austria
*
Author to whom correspondence should be addressed.
Present address: Centre for Agriculture, Food and Environmental Management (CAFEM) School of Life and Medical Sciences, University of Hertfordshire College Lane, Hatfield, Hertfordshire AL10 9AB, UK.
Toxins 2019, 11(9), 495; https://doi.org/10.3390/toxins11090495
Submission received: 29 July 2019 / Revised: 18 August 2019 / Accepted: 24 August 2019 / Published: 27 August 2019
(This article belongs to the Special Issue Novel Approaches to Minimising Mycotoxin Contamination)

Abstract

:
Two garlic-derived compounds, Propyl Propane Thiosulfonate (PTS) and Propyl Propane Thiosulfinate (PTSO), were examined for their efficacy against mycotoxigenic Fusarium species (F. graminearum, F. langsethiae, F. verticillioides). The objectives were to assess the inhibitory effect of these compounds on growth and mycotoxin production in vitro, and in situ in artificially inoculated wheat, oats and maize with one isolate of each respectively, at different water activity (aw) conditions when stored for up to 20 days at 25 °C. In vitro, 200 ppm of either PTS or PTSO reduced fungal growth by 50–100% and mycotoxin production by >90% depending on species, mycotoxin and aw conditions on milled wheat, oats and maize respectively. PTS was generally more effective than PTSO. Deoxynivalenol (DON) and zearalenone (ZEN) were decreased by 50% with 80 ppm PTSO. One-hundred ppm of PTS reduced DON and ZEN production in wheat stored at 0.93 aw for 20 days, although contamination was still above the legislative limits. Contrasting effects on T-2/HT-2 toxin contamination of oats was found depending on aw, with PTS stimulating production under marginal conditions (0.93 aw), but at 0.95 aw effective control was achieved with 100 ppm. Treatment of stored maize inoculated with F. verticilliodies resulted in a stimulation of total fumonsins in most treatments. The potential use of such compounds for mycotoxin control in stored commodities is discussed.
Key Contribution: PTSO was more effective than PTS in inhibiting Fusaria in vitro. In vitro efficacy for control of growth/mycotoxin production was influenced by water activity. In situ efficacy by these garlic-derived compounds was less effective as in in vitro studies. At times, lower doses triggered mycotoxin production in situ.

Graphical Abstract

1. Introduction

There has been interest in the use of essential oils (EOs) and extracts derived from plants to control food spoilage microorganisms, especially mycotoxigenic moulds, as an alternative to traditional preservatives based on aliphatic acids [1]. However, an important aspect to consider when utilizing natural plant extracts for control of mycotoxigenic spoilage fungi is whether they are classed as food grade. In addition, many studies have studied effects on germination and growth of spoilage mycotoxigenic fungi, while neglecting impacts on mycotoxin production, especially in situ.
Onion and garlic, both members of the Allium family, have received attention as extracts from these two plant species have been found to have significant antimicrobial properties [1]. Their antifungal efficacy has been studied despite the relative instability of some of their compounds or their strong odour. Yin and Tsao [2] found garlic, out of seven Allium plants, to be the most effective against three Aspergillus species. Some inter-species differences in efficacy were previously noted, with higher concentrations of plant extracts required for control of Aspergillus flavus and Aspergillus fumigatus than Aspergillus niger. Yoshida et al. [3] suggested that the antifungal activity of garlic was due to the compounds allicin and ajoene. Benkeblia [4] observed growth inhibition of A. niger and Penicillium cyclopium by red onion and garlic EOs, while higher concentrations (200–500 mL/L) of green and yellow onion EOs were required for control the fungal pathogen Fusarium oxysporum. Singh and Singh [5] studied the effect of Allium sativum extracts and other plant extracts on the growth of A. flavus and aflatoxin production, but only in liquid cultures. Addition of the extract at the beginning of the incubation period showed 85% inhibition in mycelial biomass and complete inhibition of aflatoxin production. However, a later addition only gave marginal control of toxin biosynthesis. Liquid culture systems are relatively artificial as the aim should be to try and develop intervention strategies to control mycotoxigenic fungi under similar conditions found in different agrifood commodities or under simulated nutritional conditions relevant to where the target control measures are going to be instituted.
In the last decade, some compounds have been extracted from Allium sativus and been successfully utilised as antimicrobial preservatives in a number of products, especially in cheese production and as a fruit coating. The two extracted compounds being used are propyl propane thiosulfonate (PTS) an organosulphate, and propyl propane thiosulfinate (PTSO). Formulations of these compounds are now commercially available as Proallium, especially as a coating for extension of fruit shelf-life. While they are considered effective anti-microbials, very little detailed information is available on the efficacy of these compounds against mycotoxigenic fungi, either in vitro or in situ.
Previous studies to compare some EOs and antioxidants to control P. verrucosum and ochratoxin A (OTA) production showed that of those tested only resveratrol was effective at controlling populations of the mycotoxigenic species and inhibiting OTA production in stored wheat grain under different storage conditions [6]. Environmental factors were also shown to have a significant influence on the relative control achieved. In addition, this study showed that sometimes under sub-optimal concentrations of these compounds, some stimulation of toxin production occurred despite growth being significantly reduced. This has been suggested to be due to a combination of water and physiological stress caused by the antifungal agent itself which may stimulate secondary metabolite production as a defence response [7,8,9,10].
Some very early studies suggested thiosulfinates had potential applications as anti-microbials, although very focused on their use in post-harvest grain preservation [11]. Some extracts of garlic and onion have been shown to have promising efficacy against Aspergillus and Penicillium species and in some cases mycotoxin production. However, very limited information is available on the efficacy of such EOs on Fusarium species. In addition, such compounds have rarely been assessed on naturally contaminated grains where a range of different species may be encountered.
The objectives of this study were to study the effect of two garlic-derived compounds (PTS, PTSO) for the control of (a) fungal growth and (b) mycotoxin production by Fusarium graminearum (Deoxynivalenol, Zearalenone; wheat), F. langsethiae (T-2/HT-2 toxins; oats) and F. verticilioides (Fumonisins; maize) for the first time. Experiments were initially conducted in vitro for a preliminary assessment of these two compounds to determine the effective concentrations for control of growth and mycotoxin production. Subsequently, in situ experiments were carried out with inoculation of wheat, oats and maize with the relevant mycotoxigenic species and treatment with each of these two compounds based on in vitro results and stored at 25 °C under different moisture content conditions for up to 20 days to examine effects on mycotoxin production.

2. Results

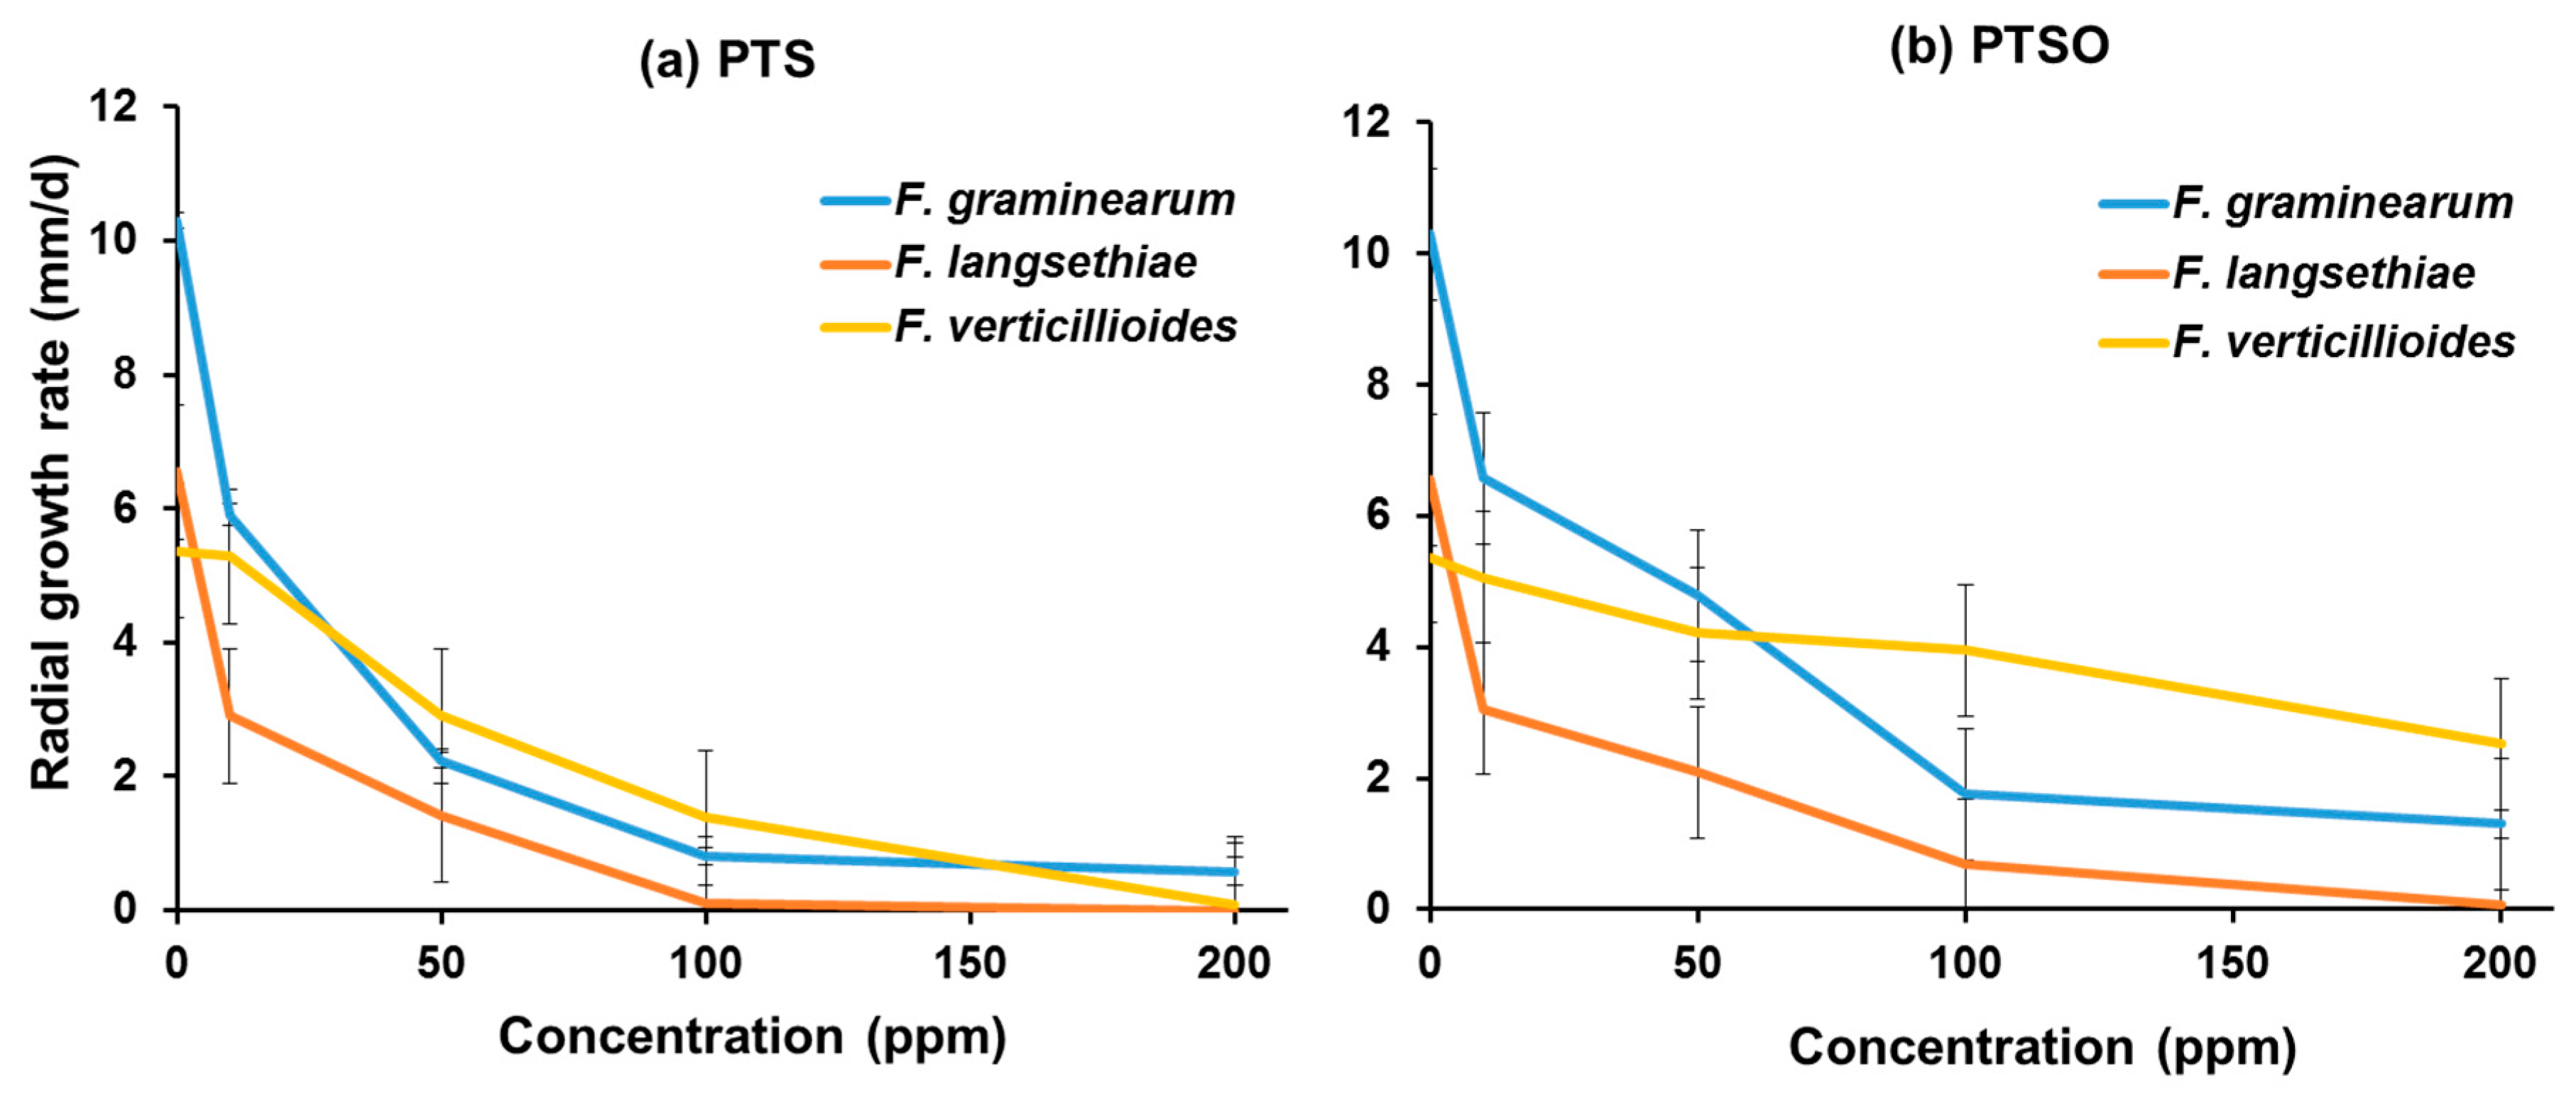
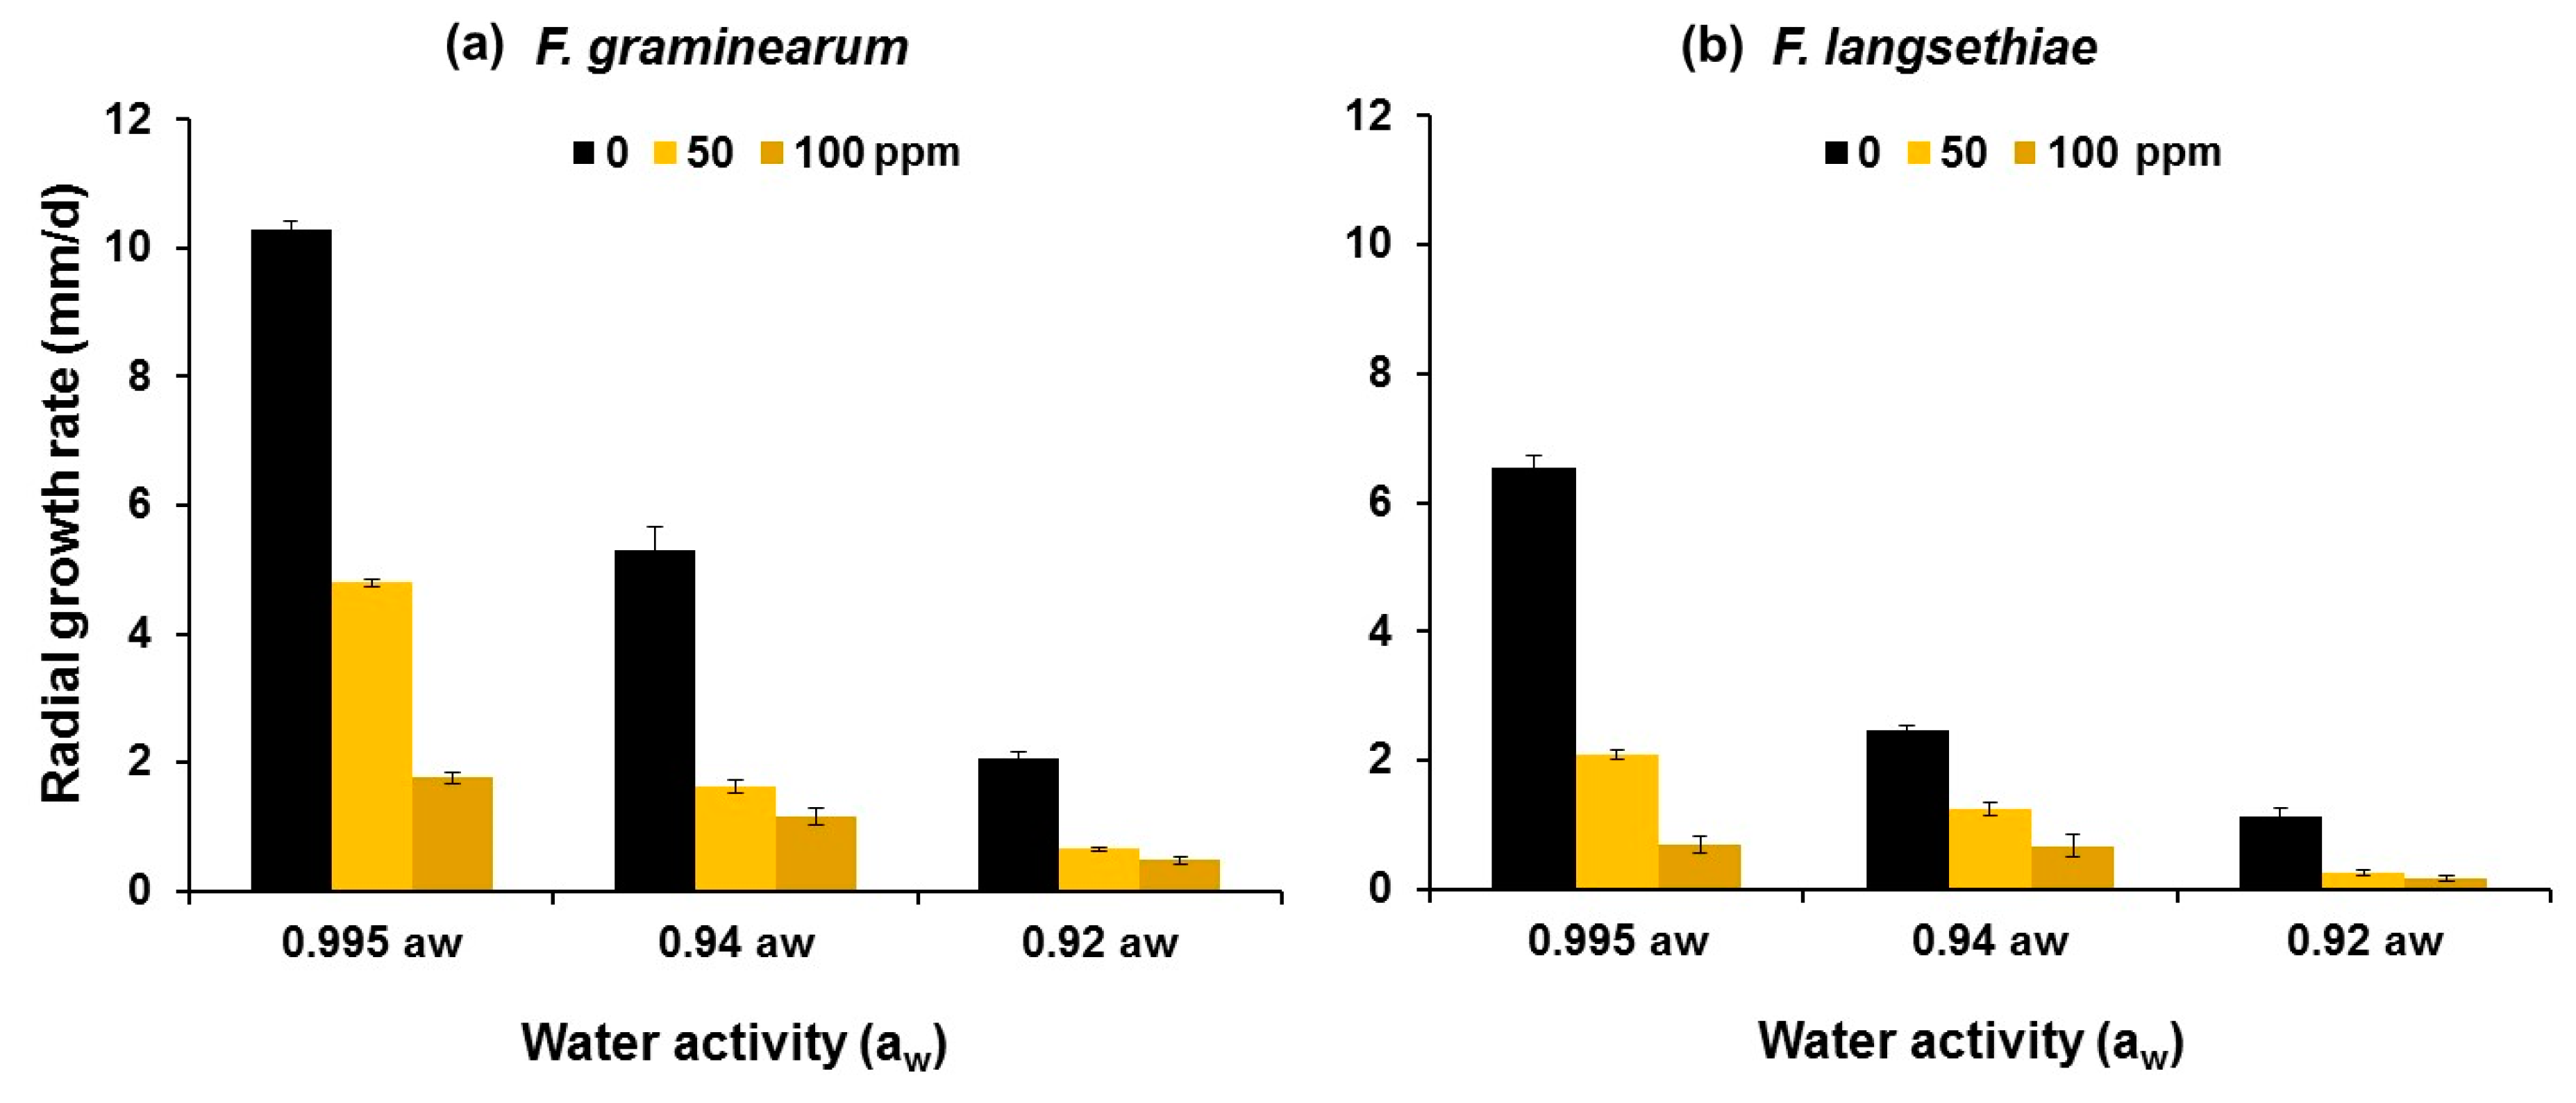
2.1. In Vitro Efficacy of PTS and PTSO Garlic-Derived Compounds against Fungal Growth

Figure 1 shows the effect of 0–200 ppm PTS and PTSO on the in vitro radial growth rates of F. graminearum, F. verticillioides and F. langsethiae. Both PTS and PTSO had very good inhibitory effects on the growth of the isolate of each of these species studied and this increased with concentration. Complete inhibition of the growth of F. langsethiae was observed with 100 ppm PTS and of F. verticillioides with 200 ppm. Growth of F. graminearum was significantly inhibited, although complete inhibition was not achieved in the range of concentrations examined. Two hundred ppm PTSO completely inhibited the growth of F. langsethiae and was very effective against F. graminearum and F. verticillioides. PTS was always more effective than PTSO when applied at the same concentration against the same fungal species. Table 1 shows the concentration necessary for effective dose (ED) 50 and 90% control of growth of the three Fusarium species.
The statistical analyses (ANOVA) showed that the effect of PTS and PTSO concentration was highly significant on the growth of the isolate of each Fusarium species, with significant intra-isolate differences for growth rate in the presence of the either of these two compounds.
Additional studies were carried out to assess the efficacy of the two compounds at different water activity (aw) levels on growth of the three Fusarium species. Figure 2 shows an example of the effect of 0–100 ppm PTSO on the growth of F. graminearum and F. langsethiae on wheat agar media modified to three different aw levels. The radial growth of both isolates of the two species was significantly inhibited as the PTSO concentration was increased and water stress was imposed (0.94, 0.92 aw), when compared to the unmodified control medium. The maximum percentage (%) inhibition was observed at the highest PTSO concentration and 0.995 aw (~83% for F. graminearum and ~90% for F. langsethiae). ANOVA showed that the effects of either PTS or PTSO concentration, aw and fungal species were highly significant on the log-transformed radial growth rate data, while the effects of the interactions between these factors were not significant.
Table 2 summarises the effective dose (ED50) concentrations of PTSO only for the isolates of F. graminearum, F. langsethiae and F. verticillioides used in this study grown on wheat agar media modified to different aw levels and 25 °C. Overall, lower concentrations of each compound were required for 50% inhibition of growth of the isolate of F. langsethiae than for the isolates of the other two Fusarium species.

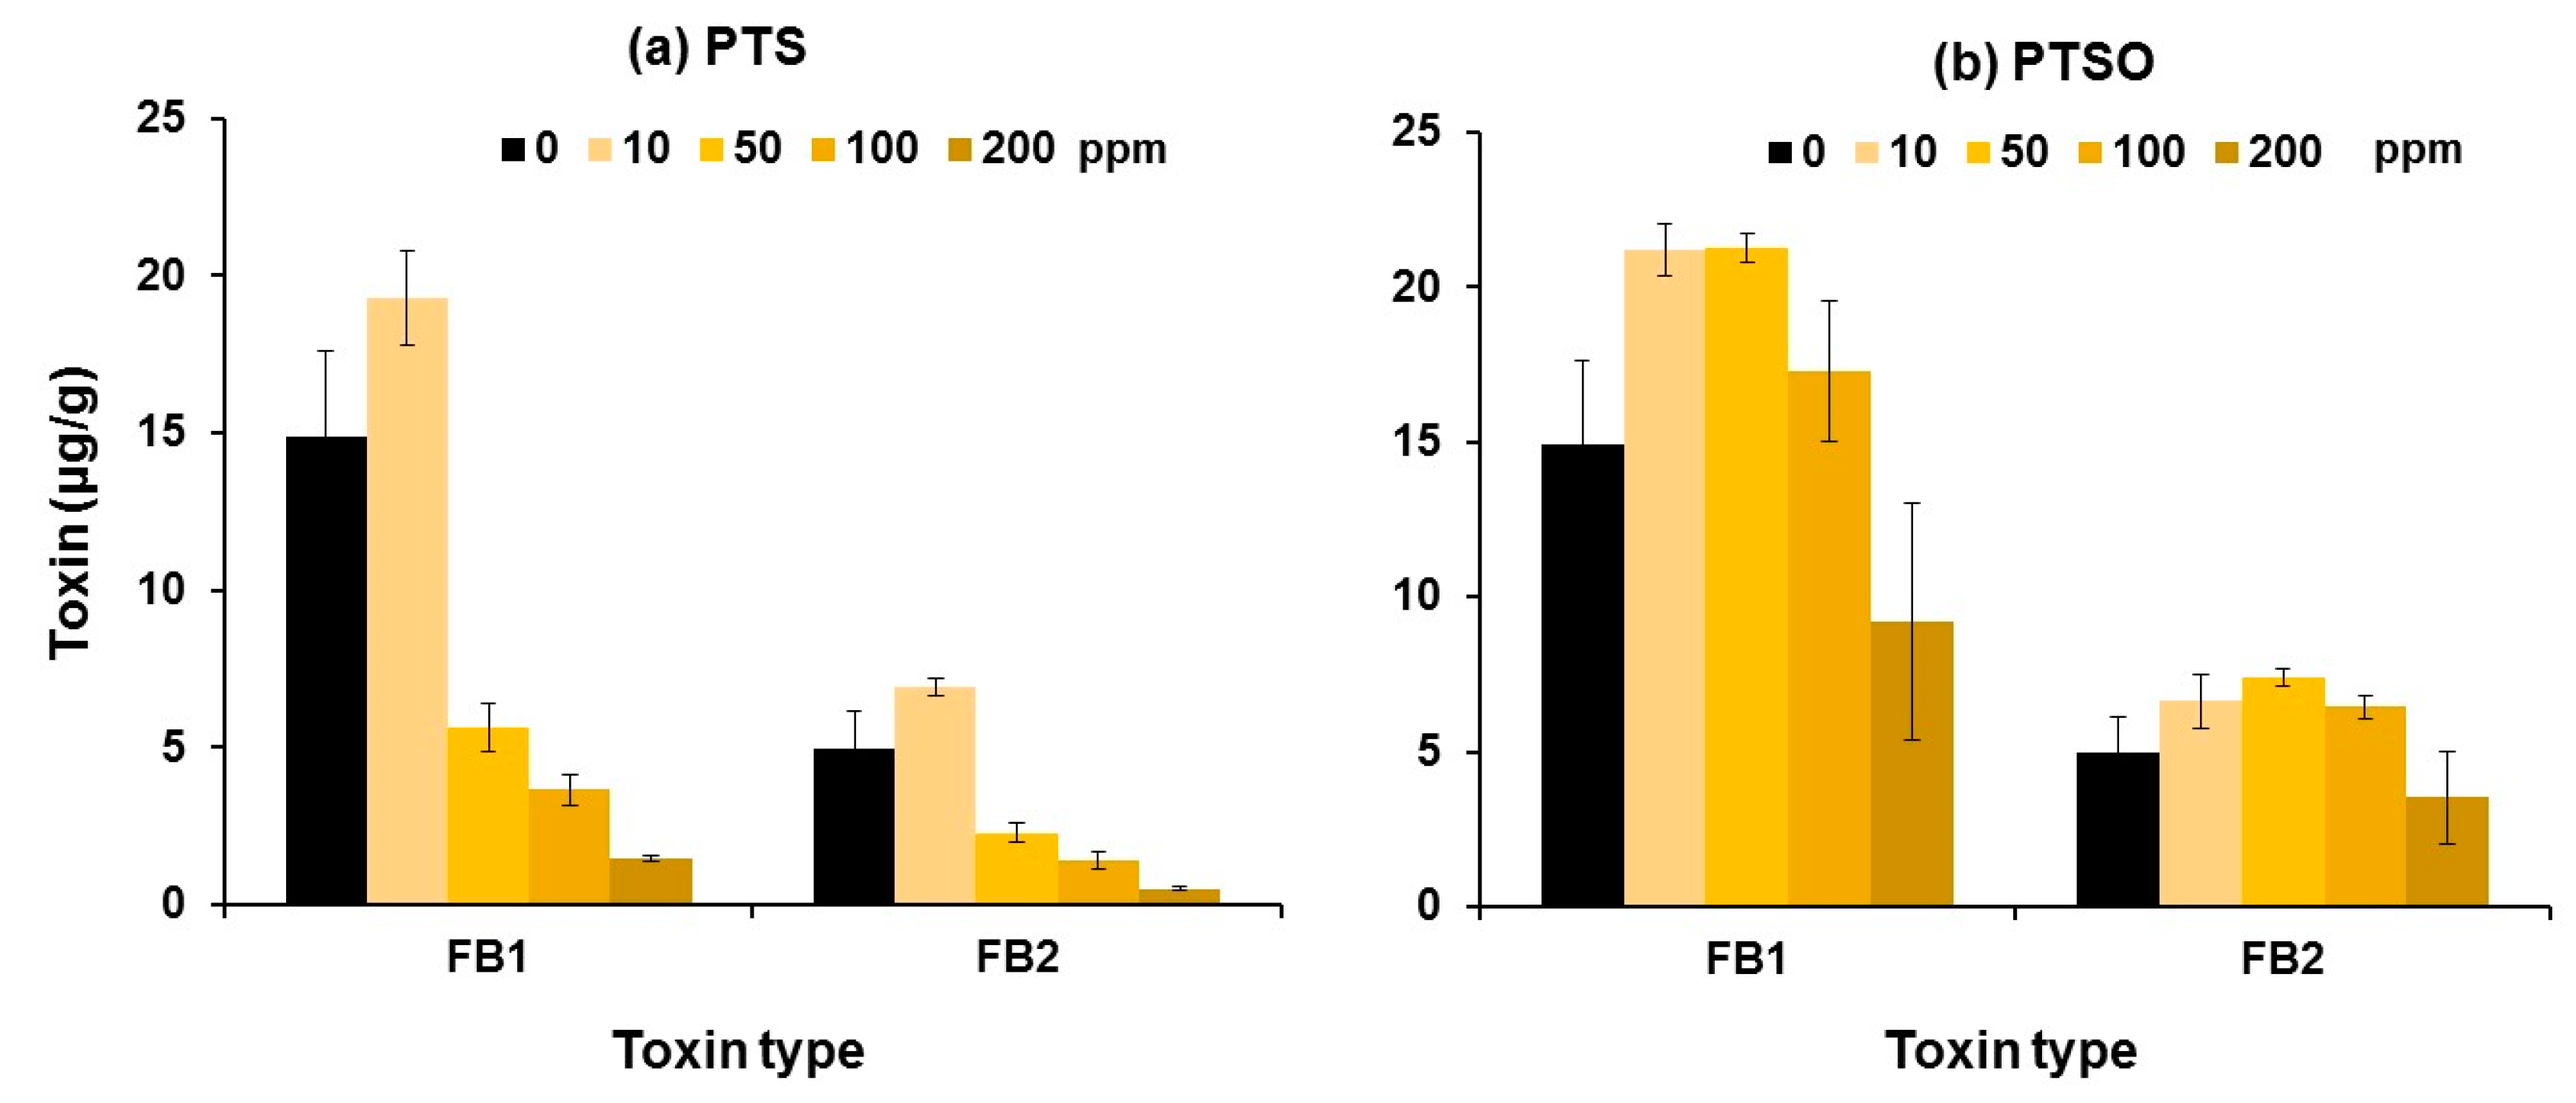
2.2. Effects of the Compounds on In Vitro Mycotoxin Inhibition

Figure 3 shows the effect of different concentrations of PTS and PTSO on fumonisins B1 and B2 (FB1 and FB2) production by the isolate of F. verticillioides on wheat-based medium at 25 °C. Two-hundred ppm of PTS inhibited FB1 and FB2 toxins by up to 90%. For PTSO, the production of both toxins was slightly stimulated with up to 100 ppm. However, the production of the two fumonisins was inhibited with 200 ppm. ANOVA showed that the effect of PTS concentration was highly significant on the log-transformed data of both FB1 and FB2. For PTSO concentration, analyses showed that there was a significant effect on FB1 production by the isolate of F. verticillioides in vitro but it was not significant for the production of FB2 (see Supplementary Table S1).
The production of deoxynivalenol (DON) by F. graminearum in response to exposure to either of these compounds was reduced when compared to the untreated control (Supplementary Figure S1). DON production was below the limit of detection in the 200 ppm PTS treatments. However, DON production in the 250 ppm PTSO was ~4 times more than in the control. ANOVA showed that the concentration of PTS significantly affected DON production. PTSO had no significant effect on in vitro DON production by F. graminearum.
There was a decrease in T-2 production by F. langsethiae as the PTS concentration was increased, and this was below the limit of detection with 200 ppm concentration (data not shown). HT-2 toxin in the same samples was not detected at ≥50 ppm PTS (Supplementary Figure S2; Supplementary Table S2). With PTSO, T-2 toxin production by F. langsethiae was inhibited compared to the control, although no specific pattern was observed with concentration. HT-2 toxin production was below the limit of detection in all PTSO concentrations. Statistically, the effect of PTS concentration was significant on T-2 toxin production but not for HT-2 toxin. The effect of PTSO was not significant for either of these two related type A trichothecenes.

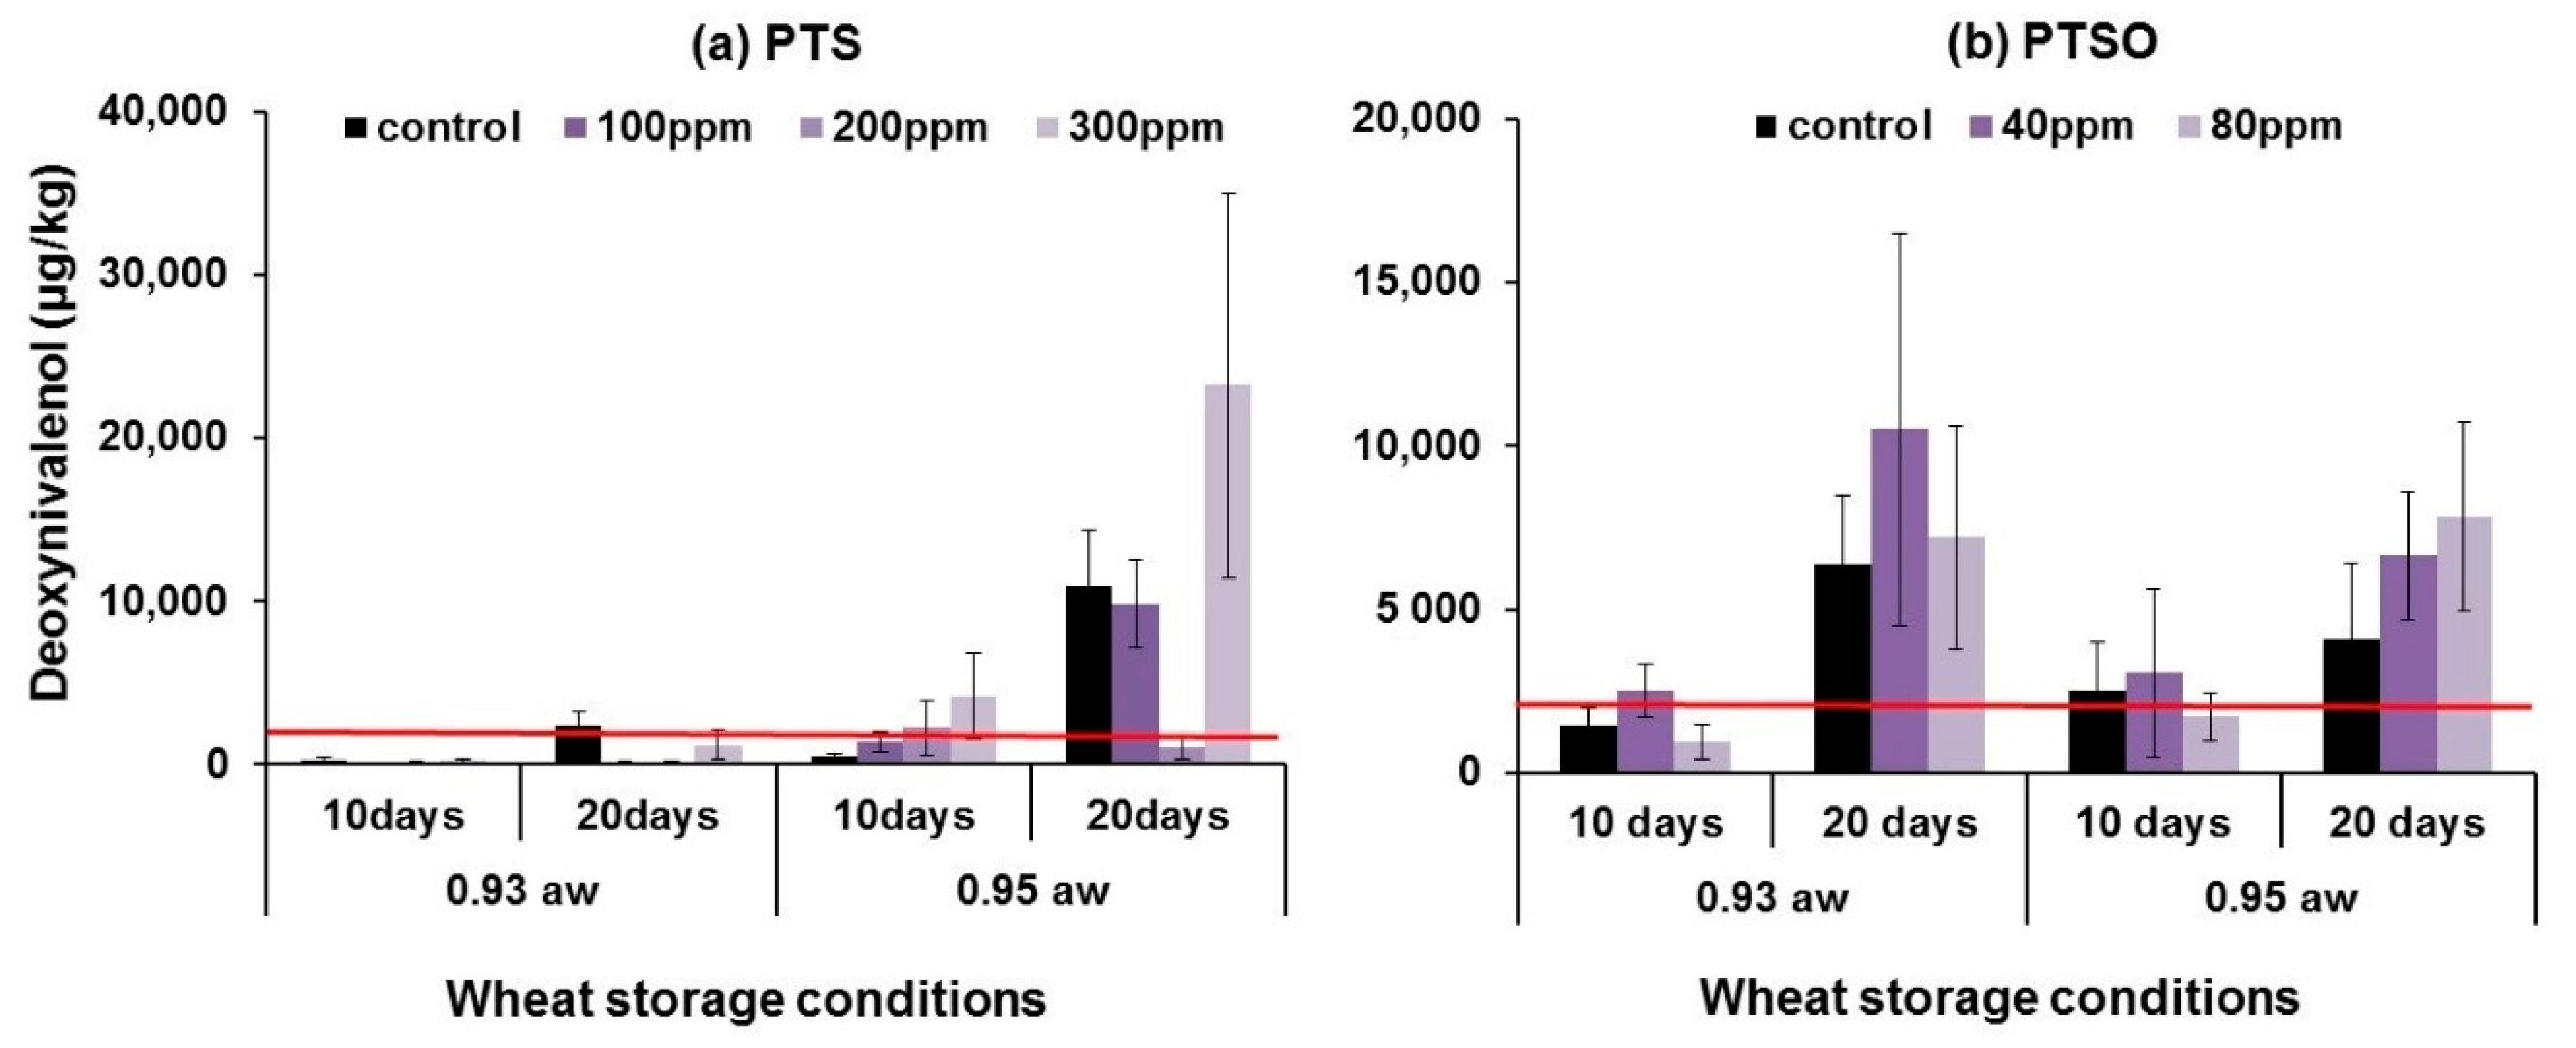
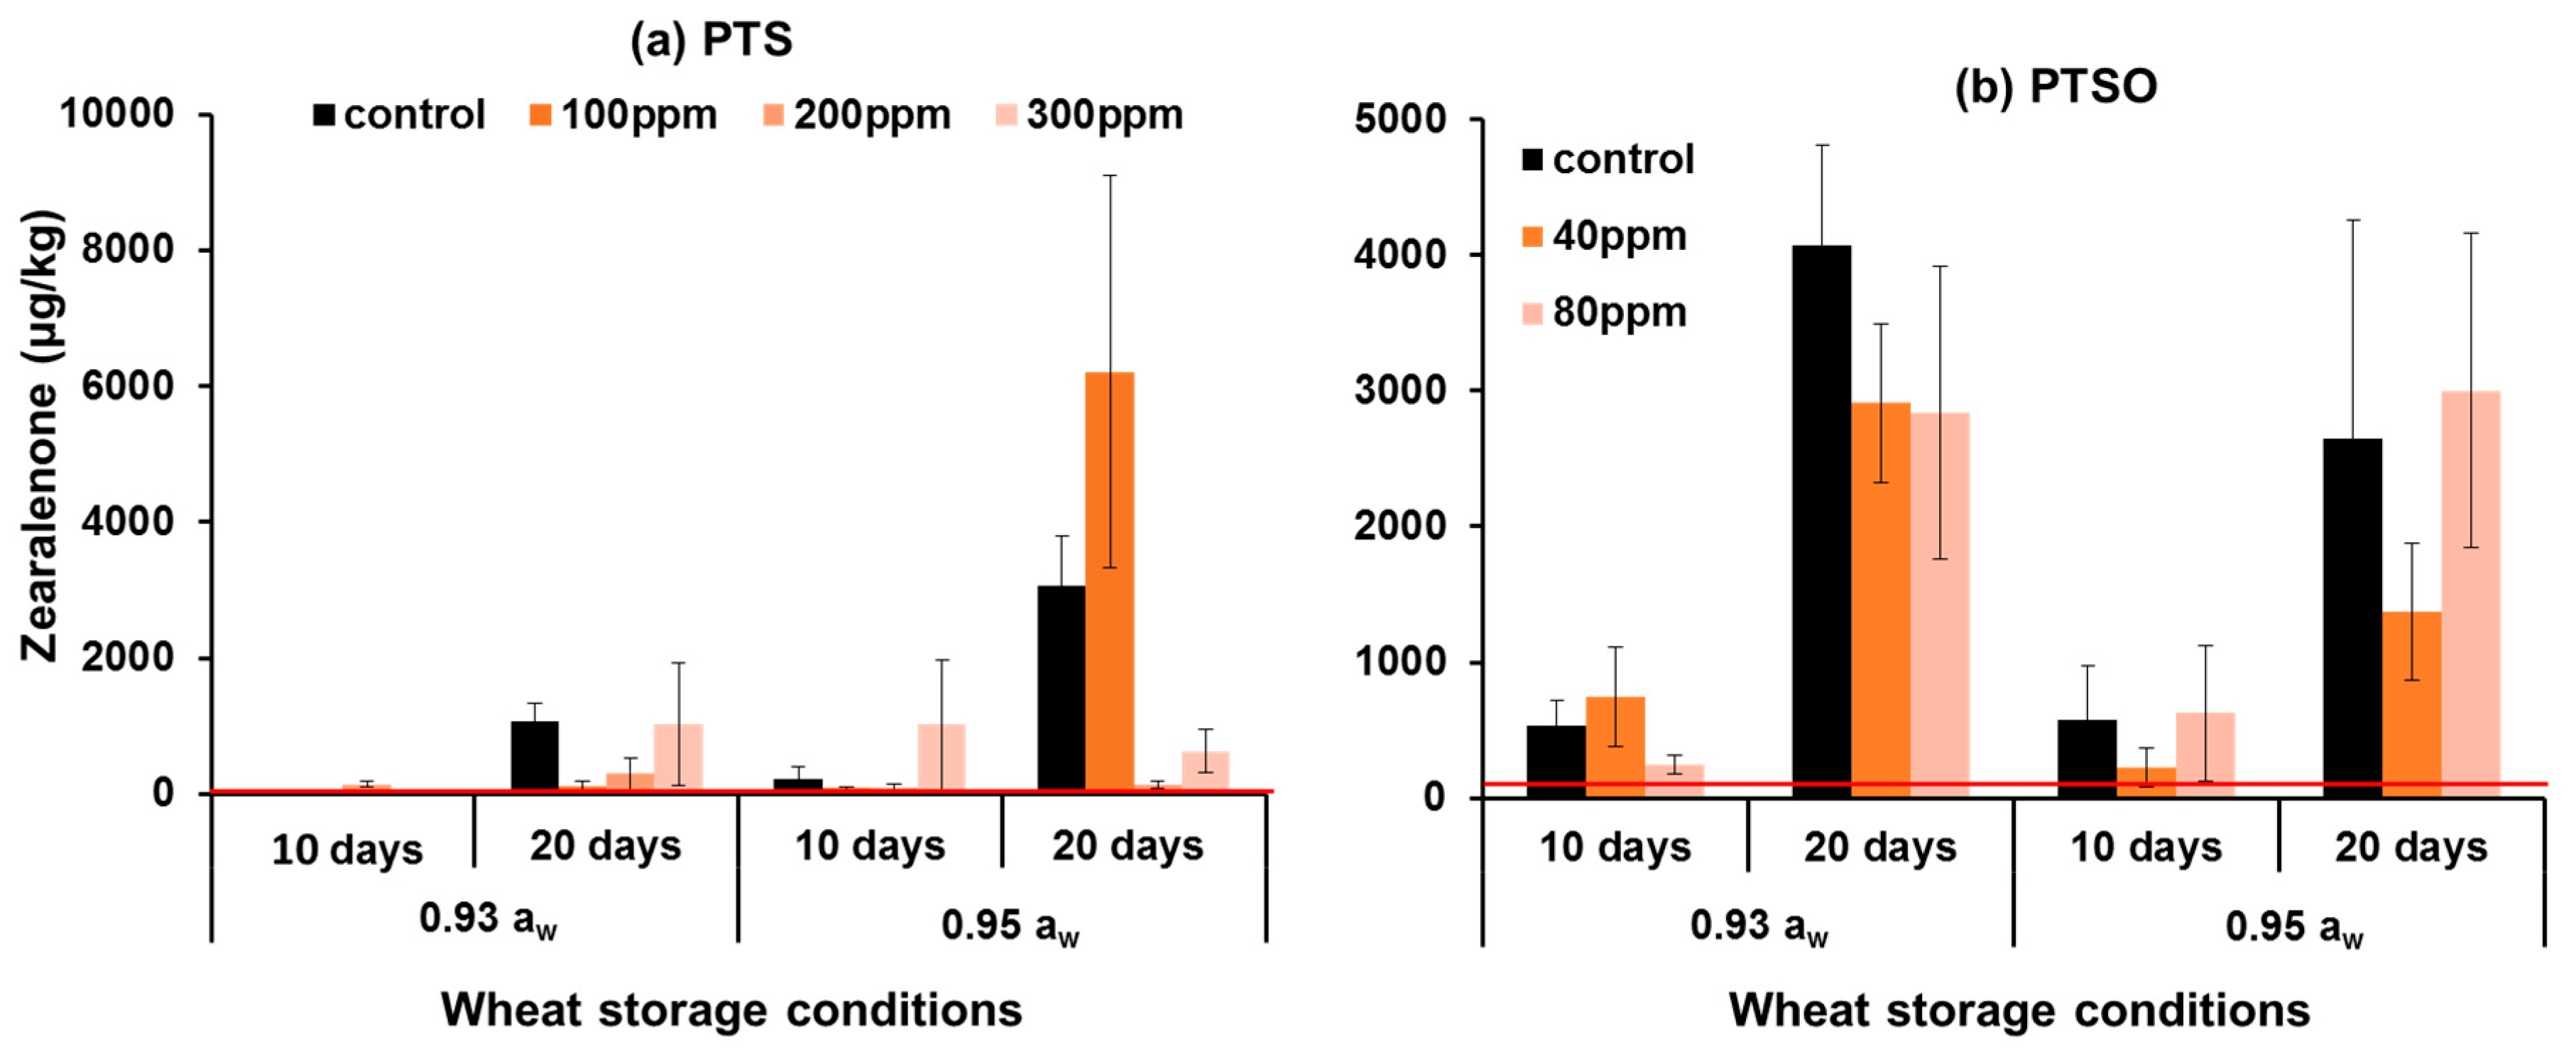
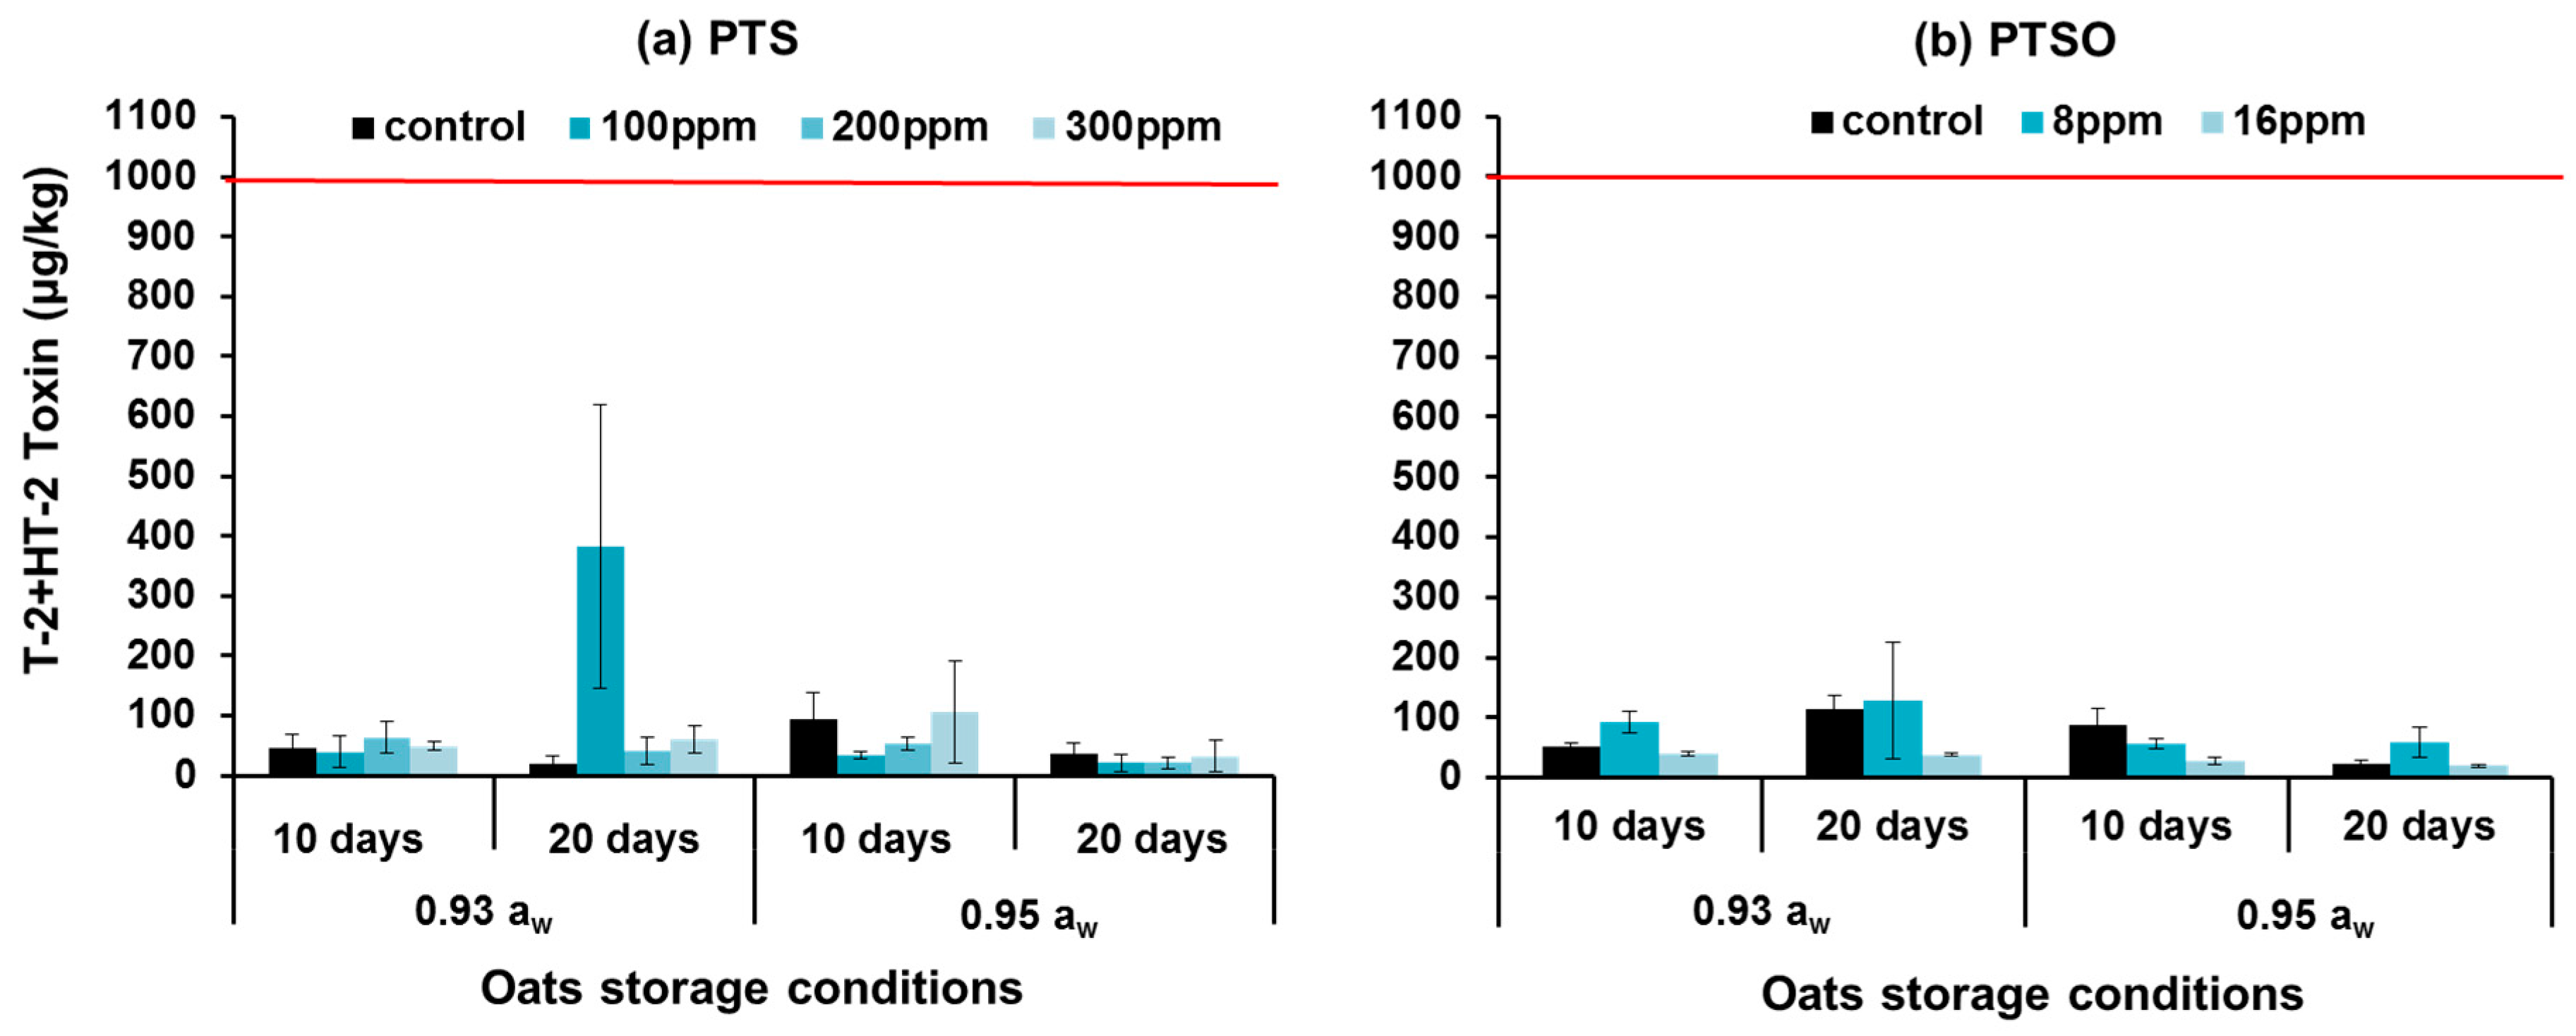
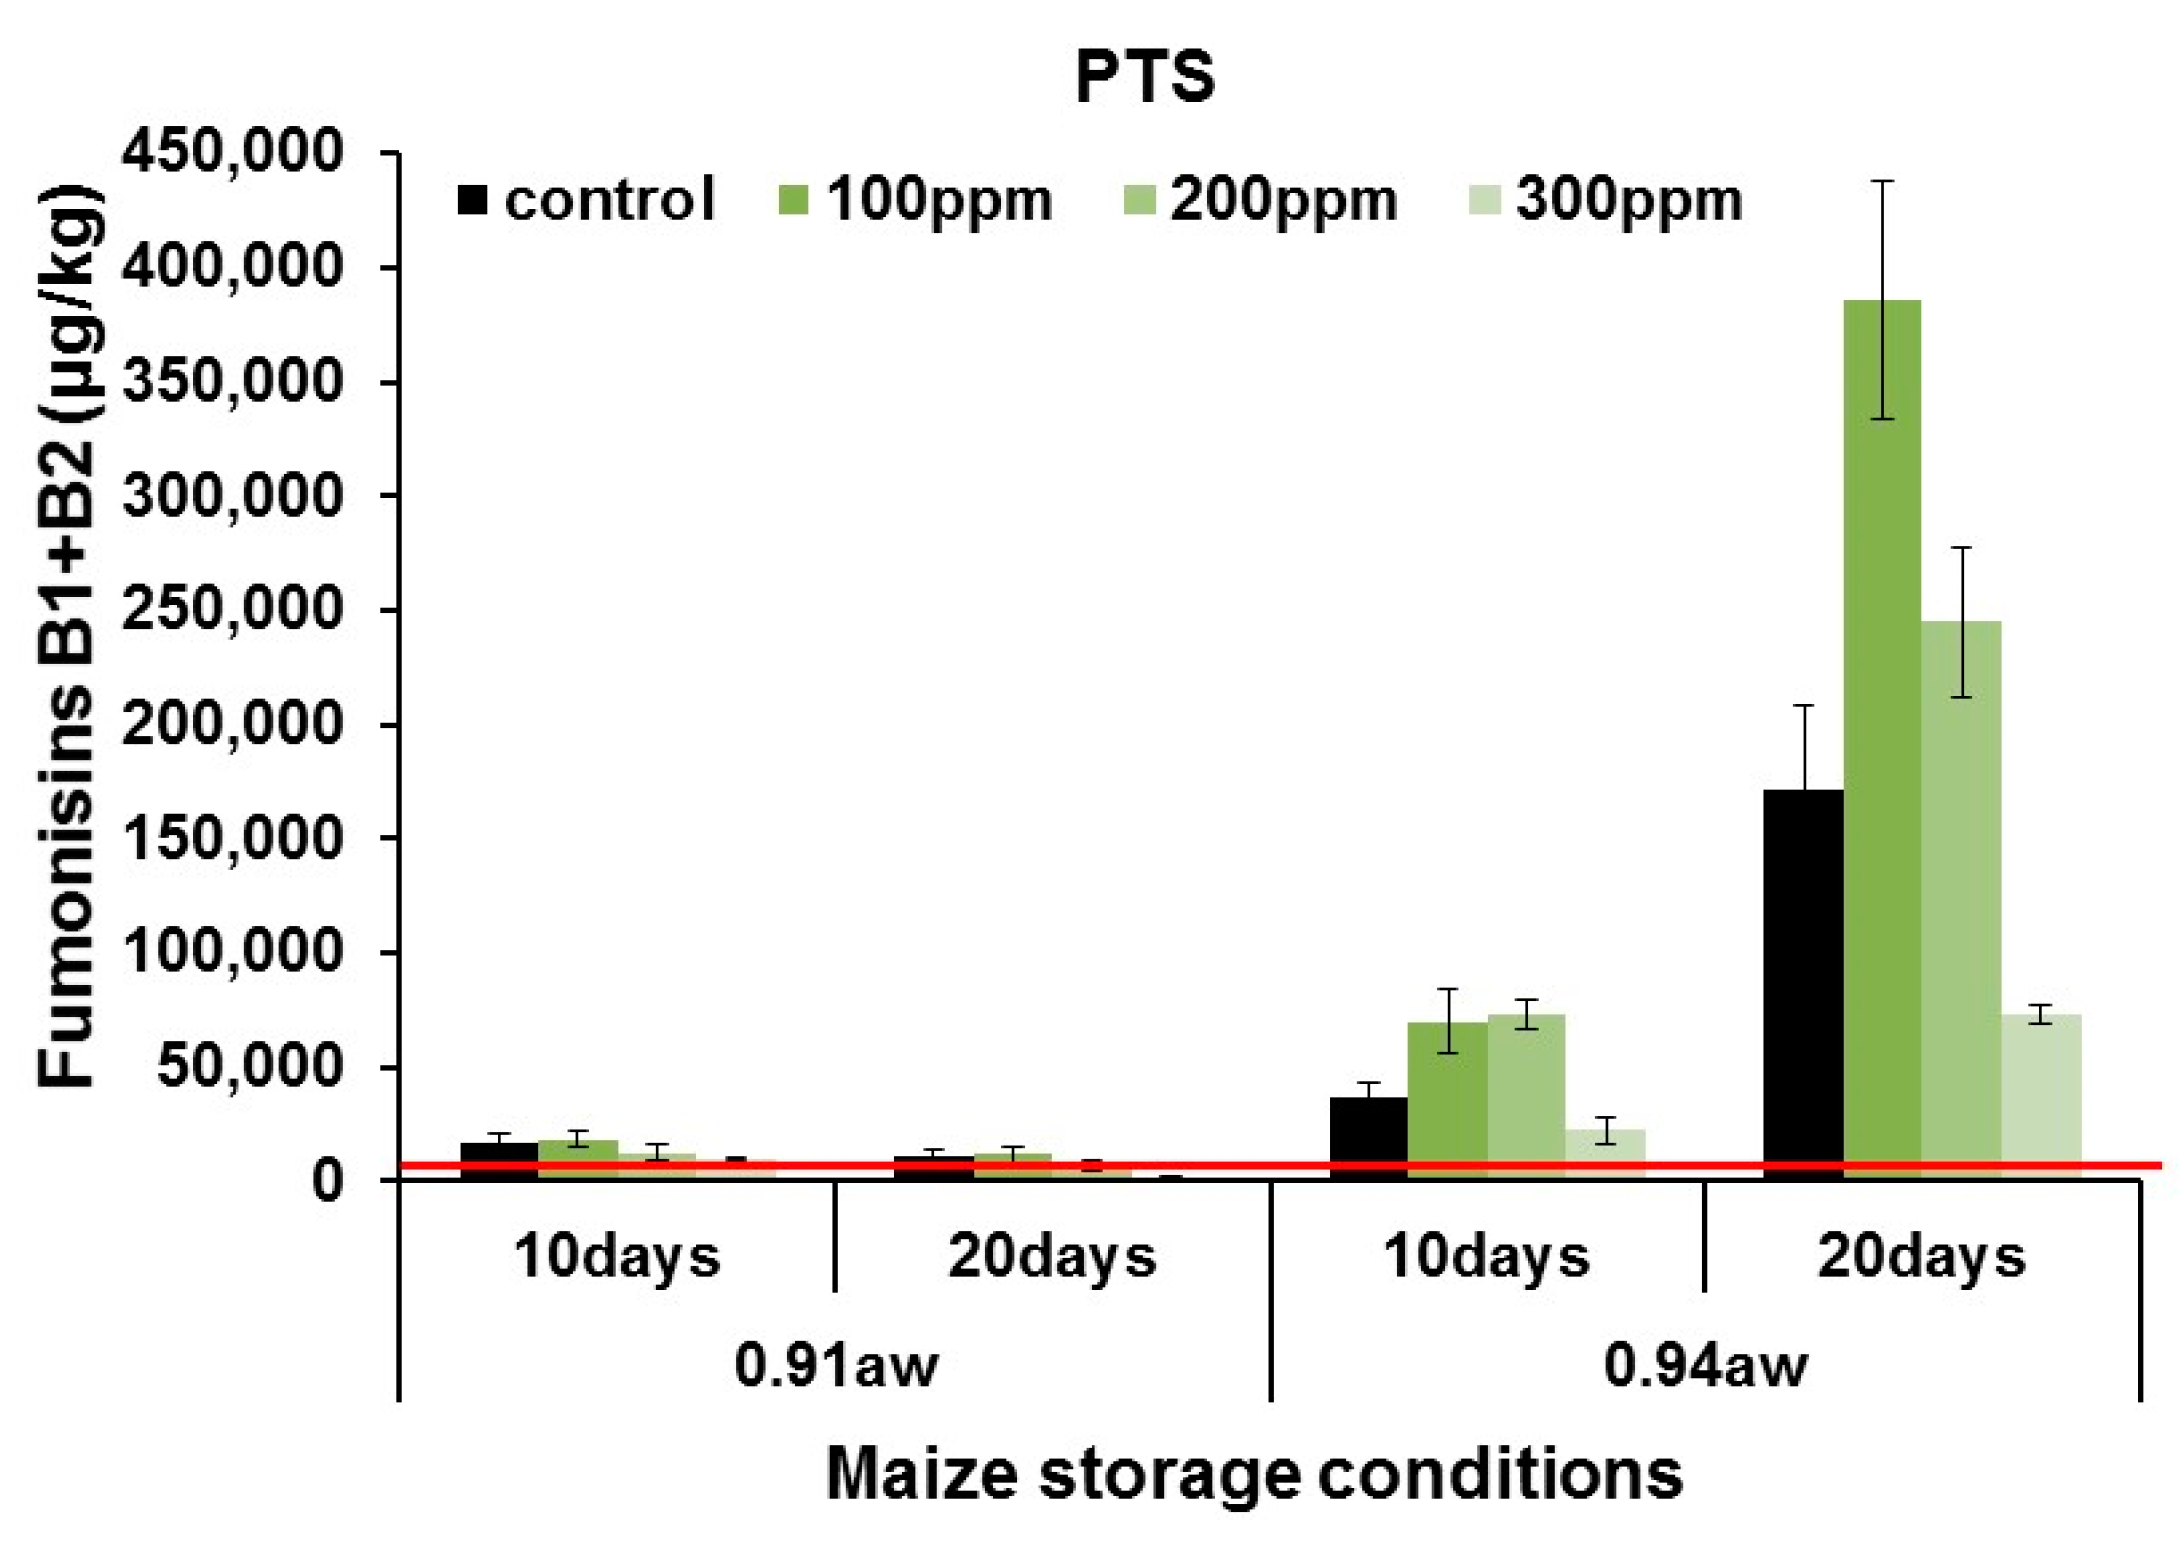
2.3. In Situ Mycotoxin Control in Stored Wheat, Oats and Maize Using PTS and PTSO

Figure 4 and Figure 5 show the effects of either PTS or PTSO on DON and ZEN production in wheat modified to two different aw levels, inoculated with F. graminearum and stored for 10 and 20 days at 25 °C. The red lines show the EU regulatory limits for each of the toxins in wheat [12] (EC 1881/2006). DON production was reduced in all the PTS-treated samples stored at 0.93 aw for up to 20 days at 25 °C compared to the control. Maximum inhibition was obtained with 100 and 200 ppm PTS after 10 and 20 days storage (76% and 95%) respectively when compared with the control. In the wetter wheat samples at 0.95 aw stored for 10 days DON production increased with increasing PTS concentration, while after 20 days irregular results were obtained ranging from 90% inhibition of DON production with 200 ppm PTS to >100% stimulation at 300 ppm. In the PTSO treatments, a small reduction in DON contamination (~33%) was observed with 80 ppm PTSO in wheat stored for 10 days at both aw levels. With lower concentration of PTSO (40 ppm) there was a stimulation of toxin production when compared to the control. After 20 days storage stored wheat treated with PTSO had toxin levels higher than in the controls at both aw levels. ANOVA showed that the effects of PTS concentration, aw and storage time significantly affected log(DON) production by F. graminearum in the stored wheat treatments (see Supplementary Table S3). However, interactions between these factors was not significant. For PTSO, ANOVA showed that concentration and aw significantly affected log (DON) production, while the effects of storage time and interactions between factors were not significant.
Figure 5 shows the effect of PTS and PTSO on ZEN production by F. graminearum in stored wheat. The most effective control of ZEN production by PTS was 100ppm at 0.93 aw with 89% control after 20 days storage. In the wetter 0.95 aw grain 100 ppm of PTS inhibited ZEN production by about 64% after 10 days storage. However, after 20 days storage, 200 ppm PTS was required for 96% ZEN control. Overall, the most efficient PTS concentrations for the control of both toxins (DON, ZEN) was 100 ppm PTS in the 0.93 aw stored wheat, and 200 ppm for the wetter stored wheat (0.95 aw). PTSO at 40 and 80 ppm reduced ZEN contamination of stored wheat inoculated with F. graminearum at both 0.93 and 0.95 aw by 30–60% after 20 days storage. Statistically, the Kruskal–Wallis analyses (non-parametric analyses) showed that there was no significant effect of PTS concentration or grain aw on ZEN production, while storage time was highly significant. For PTSO, concentration or storage aw were not significant for ZEN production, while storage time was highly significant.
Figure 6 shows the T-2 + HT-2 toxins in stored oats inoculated with F. langsethiae and treated with 0–300 ppm PTS and 0–80 ppm PTSO for up to 20 days. The red line shows the indicative directive with regard to limits more commonly established in Europe for the sum of T-2 + HT-2 toxins [13] (EC 165/2013). In all cases, the toxin levels produced were below the indicative levels suggested by the EU. Statistical analyses showed that the effects of PTS concentration, and storage time had no significant effect on log(T-2 + HT-2) toxin contamination of stored oats by F. langsethiae (see Supplementary Table S3) The effect of aw, and interaction between aw × storage time were significant. For PTSO, ANOVA showed that concentration and aw had significant effects on the production of these two toxins while the effect of storage time and interactions between the factors were not significant.
Figure 7 shows the effect of treatments on the production of total fumonisins B1 + B2 (FUMs) in maize rewetted to 0.91 and 0.94 aw and inoculated with F. verticillioides spores and treated with 0–300 ppm PTS, Only PTS was studied in these assays because of the limited efficacy of PTSO in controlling FUMs production in vitro (see Figure 3). The red line shows the EU legislative limits established for the sum of FUMs in maize. At 0.91 aw PTS was effective with up to 80% control achieved after 20 days with 200–300 ppm treatment. This was also below the relevant EU limit. However, in wetter maize stored at 0.94 aw most treatments were ineffective in controlling FUMs contamination. Indeed there was a stimulation in FUMs, especially with 100–200 ppm PTS, regardless of aw or storage time. There was a statistically significant effect of PTS concentration, maize aw and storage time on the logarithm of total FUMs production (see Supplementary Table S3). The interaction of aw×storage time and aw × PTS concentration were also significant. However, the interactions of PTS × storage time and interaction between all three factors was not significant. For PTSO, none of the single factors or interacting factors were significant except for aw × storage time was significant.

3. Discussion

3.1. In Vitro Efficacy of PTS and PTSO

This is the first study to evaluate the efficacy of the garlic-derived compounds PTS and PTSO for control of fungal growth and mycotoxin production by isolates of the three important mycotoxigenic Fusarium species in vitro. The present study has shown that solutions of either PTS or PTSO were effective at inhibiting the in vitro growth of each isolate of the three Fusarium species studied. The inhibitory effect increased with concentration and generally, the level of inhibition was species-dependent. F. langsethiae was the most sensitive Fusarium species to both compounds with complete inhibition of growth with 100 and 200 ppm of PTS and PTSO respectively.
Our results suggest that there is differential sensitivity of Fusarium species to PTS and PTSO. Thus, higher ED50 concentrations of the two garlic-derived compounds were required for the isolate of F. verticilloides when compared to F. gaminearum and F. langshetiae. Previously, 200 ppm of star anise extract was needed to inhibit growth of F. verticillioides completely when compared to effects on F. solani, F. oxysporum and F. graminearum where only 100 ppm was required [14]. Similarly, Morcia et al. [15] observed lower ED50 values of seven EOs were needed in the case of F. langsethiae when compared to effects on F. graminearum and F. sporotrichioides. However, most of these studies did not assess interactions with water availability which is critical for determining efficacy, especially in relation to toxin control [14,15,16,17,18,19,20,21,22]. It is also difficult to compare the dose-effect relationships obtained between species across the studies because different times and doses, and different matrices were used, often nutritionally unrelated to the commodity in which in situ control was required.
In addition, different EO extracts have different active ingredients and thus do not have the same efficacy against the same species. For example, the effect of EOs belonging to five botanical families (Umbeliferae, Labiateae, Compositeae, Rosaceae and Lauraceae) against F. moniliforme (=F. verticillioides) was evaluated [16]. Growth was completely inhibited with 500 ppm of anise, thyme and cinnamon, 2000 ppm of marigold, and 3000 ppm of the other extracts examined. Overall, no significant differences between these botanical families were found. Also, complete inhibition of this Fusarium species was achieved with 600 ppm of thyme, 800 ppm of basil and lemongrass and 1000–2500 ppm of ginger [17,18]. These differences could be due to the different tolerances between strains, but also because of the different compositions and purity of EOs obtained from the different plants. Elhouiti et al. [23] studied the chemical composition of leaves and flowers of Rhanterium adpressum, harvested at different times over three years. They observed that the percentage of the leading chemical groups changed according to the month of extraction. Also, the EOs produced by the flower had better inhibitory activity than the leaf extracts (MICs, 6–10 ppm vs 11–14 ppm) against F. culmorun and F. graminearum respectively. Kurita and Koike et al. [24] pointed out that the magnitude of the antifungal effect was related to the functional groups and they proposed a scale of antifungal potency of chemical groups from the best to worst being phenols > alcohols > aldehydes > ketones > ethers > hydrocarbons. However, these previous studies did not evaluate the impact that changing water availability might have on the relative control achieved.
In terms of control of mycotoxin production, both PTS and PTSO reduced DON, ZEN, T-2, HT-2 and FUMs production by the relevant Fusarium species when compared to the controls. There were some differences in efficacy between PTS and PTSO. The latter compound only controlled FB1 and FB2 production at 200 ppm, with >4 times the amount of PTS required, compared to PTSO to obtain the same inhibitory effects. Generally, PTS was more effective in controlling mycotoxin production than PTSO, except in the case of T-2 toxin where the latter compound was more effective at <200 ppm. Similarly, HT-2 toxin was completely inhibited at all PTSO concentrations, while for PTS ≥50 ppm was required. It was also generally observed that higher PTS concentrations (200 ppm) completely inhibited the production of all toxins, except in the case of the FUMs.
Previous studies have suggested that complete inhibition of FUMs could be achieved with 6 ppm of 3-carene, D-limonene and B-ocimene [21]. Also, ginger EOs inhibited FB1 (2500 ppm), FB2 (2000 ppm) and DON (2000 ppm) production [17,22]. Lower doses of extracts of R. adpressum (0.25 ppm) significantly inhibited production of type B tricothecenes (3-acetyl deoxynivalenol, 15-acetyl deoxynivalenol and fusarenon X) [23]. Morcia et al. [15] reported that the seven EOs (cuminaldehyde, cinnamaldehyde, lemon oil, citral, limonene, bergamot and citroneall) had a variable effect on the biosynthesis of T-2 and HT-2 by F. langsethiae and F. sporotrichioides. 0.1 mL of bergamoil/mL reduced T-2 and HT-2 toxin produced by the former species but stimulated production by the latter species. However, again, few of these studies included the impact of aw stress on the efficacy of the EOs.

3.2. In Situ Efficacy of PTS and PTSO against Mycotoxin Production in Stored Grain

The aw levels chosen for the wheat, oats and maize storage studies was based on the marginal and optimum aw levels for growth and mycotoxin production by the isolates of these three species from previous studies [25,26,27]. Drier conditions of <0.90 aw are considered very marginal for colonisation by Fusarium species of wheat, oats or maize. Treatment of wheat with 100 ppm of PTS resulted in 76–94% control of DON, depending on the storage aw. Better results were obtained in the 0.93 aw treatment where colonisation was slower than in the 0.95 aw treatment. PTS was also effective in controlling ZEN production, by reducing the production to below or near the applicable EU limits after both 10 and 20 days storage respectively. However, it should be noted that under some storage conditions intermediate PTS concentrations stimulated mycotoxin production.
Overall, PTS was not efficient in controlling the production of T-2 and HT-2 toxins in artificially inoculated oats at 0.93 aw, particularly in samples stored for 20 days. In contrast, at 0.95 aw reasonably good control with 100 ppm PTS for T-2 and HT-2 production was achieved after 10 days storage, and with 200 ppm after 20 day storage. For control of FUMs, 300 ppm PTS was necessary in stored maize at 0.91 aw and 0.94 aw resulting in 39–80% inhibition when compared to the control samples. The control achieved was below the EU legislative limits but only in the 0.91 aw treatments. In moist maize, much higher concentrations would be required to try and control FUMs to below the EU legislative limits, especially if destined for feed use.
Treatment of wet grain with PTSO was generally capable of reducing mycotoxin contamination after storage at 0.93–0.95 aw for 10–20 days compared to the untreated control samples. Thus, where water ingress might occur in a silo this compound would be effective at controlling toxin contamination in stored cereals produced by Fusaria, in the short to medium term. DON contamination in wheat treated with 80 ppm PTSO and stored for 10 days had 1/3rd less toxin than the control, which was also below the relevant EU limits. However, this treatment was not efficient for extended storage beyond 20 days with the exception of ZEN, which was more effectively reduced, even after 20 days storage. Better control was observed with 40 ppm PTSO (48–60%) in relatively moist wheat stored at 0.95 aw. However, all the treatments contained ZEN levels above the applicable EU limits.
Overall, PTSO was more efficient in controlling the production of T-2/HT-2 toxins by F. langsethiae in oats, with as little as 16 ppm required. This treatment was generally more effective against HT-2 toxin (8–78%) than T-2 toxin (18–42%) and this may be important, as often T-2 toxin is converted rapidly to HT-2 toxin and thus control of this toxin is important.
Previously, Soliman et al. [16] examined the efficacy of low concentrations (0.1–2.0 ppb) of the more efficient EOs tested in vitro (anise, cinnamon, spearmint and thyme) on FUMs contamination of stored wheat over 8 week storage periods. They claimed that low doses (0.1 ppb) completely inhibited the biosynthesis of FUMs after 2 weeks. Thyme EO was shown to have the highest anti-mycotoxigenic activity and the best control of growth. Although water availability was not considered, the concentrations appear to be very low for achieving control. In addition, F. verticillioides colonisation is more important in maize where it is primarily responsible for FUM contamination. Venkatesh et al. [21] suggested that use of guggul EO at 10 ppm treatment of maize at 28 °C for 10 days reduced FUMs from 42.5 to 2.6 ppm; with complete inhibition of FB1 achieved with 200 ppm of star anise or 50 ppb of allyl isothiocyanate [14,28]. Allyl isothiocyanate was found to inhibit the production of FB1 by F. verticilloides [2,28].
These cereals are naturally contaminated with a mixture of toxigenic fungi as part of the mycobiota. Thus, the differential effect on different Fusarium species would also apply to other toxigenic species such as Penicillium verrucosum (ochratoxin A producer) or Aspergillus species. Thus, consideration should be given to changes in the ratio of mycotoxins which might occur when treated with different preservatives. Recently, Giorni et al. [29] showed that in ripening maize co-inoculated with mixtures of F. graminearum, F. verticillioides and Aspergillus flavus influenced the relative contamination of the maize cobs with deoxynivalenol, FUMs and aflatoxins. Interactions between non-toxigenic mycobiota and has also been shown to influence the relative contamination with different mycotoxins in both wheat grain and in grape-based matrices [30].
The in situ storage studies have been done for a maximum of 20 days. For longer term storage periods of 6–9 months it may be necessary to use a slightly increased treatment concentration of such compounds for ensuring that control can be maintained. This would have an impact on the relative economic costs of treatment which would have to be considered in the context of the overall inputs into management of grain for food and feed use post-harvest.

4. Conclusions

This was the first detailed examination of these two compounds for control of growth and mycotoxin contamination by Fusarium species in vitro and in artificially inoculated stored wheat, oats and maize under different temporal and water availability conditions. Overall, in vitro efficacy should include important parameters such as water availability, temperature and perhaps pH stress to identify the most effective candidates for control of colonisation, and more importantly, mycotoxin production. Potential efficacy was demonstrated and identified against isolates of three different Fusarium species. However, efficacy in situ was not as effective as that observed in vitro. In addition, the efficacy of the treatments depended on the specific “Fusarium species-toxin” pathosystem. Differences were observed with regard to the production of different mycotoxins by an isolate of a single fungal species when inoculated into naturally contaminated cereals. However, the right concentrations need to be used for effective control to be achieved. This depended on the water availability and the mycotoxigenic species involved.
Both garlic-derived compounds tested in this study (PTS and PTO) are liquids and water soluble and can thus be applied to grain prior to storage for post-harvest control of spoilage mycotoxigenic fungi. Garlic extracts have been approved for use as a pesticide (although currently under re-evaluation) and commercial products are available based on such extracts. Certainly, the use of odourless versions of these compounds could be effectively used for food applications. In addition, the existing compounds could also be used for animal feed applications where often moist grain needs to be preserved for the short to medium term prior to use.

5. Materials and Methods

5.1. Preparation of Stock Solutions of Chemical Compounds

Stock solutions of the following compounds were prepared in sterile distilled water.
(a) Propyl propane thiosulfonate (PTS): This organosulfonate compound is obtained from the decomposition of initial compounds present in garlic bulbs (Allium sativum) and was kindly provided by DOMCA SA, Granada, Spain. A stock solution of 5000 ppm was prepared by dissolving 1.1 g PTS (90% PTS, Domca, S.A., Granada, Spain) (Mousala SL., 2006) into a 200 mL container containing 200 mL of sterile distilled water and vigorously shaking. Due to the oily nature of PTS the stock solution had the appearance of a stable water emulsion. A second stock solution of 20000 ppm was prepared by dissolving 2.2 g PTS into 100 mL of a mixture of ethanol:H2O (80:20). This solution was clear.
(b) Propyl propane thiosulfinate (PTSO): A stock solution of 10000 ppm was prepared by dissolving 1.1 g PTSO (90% PTSO, Domca, S.A., Granada, Spain) (Mousala SL., 2006) into a 100 mL container containing 100 mL sterile distilled water and vigorously shaking. Due to the oily nature of PTSO the stock solution had the appearance of a water emulsion. A second stock solution of 20,000 ppm was prepared as for PTS.

5.2. In Vitro Studies: Fungal Species, Media, Inoculation and Measurements of Growth and Mycotoxin Production

Fusarium graminearum isolate L1-2/2D (wheat; DON, ZEN), F. langsethiae strain 2004/59 (oats; T-2 + HT-2) and F. verticillioides isolate MPVP 294 (maize; FUMS) were used in this study. The strains were all maintained on Malt Extract Agar (MEA) media (OXOID, malt extract, 30; mycological peptone, 5; agar, 15 g/L). These isolates were kindly supplied by Prof. S. Edwards, Harper Adams University and Prof. P. Battilani, Catholic University of Italy, Piacenza, Italy). They have all been examined previously for mycotoxin production and shown to be high producers of the respective mycotoxins in previous studies [31,32].
For the in vitro trials a 2% milled wheat medium was prepared by adding 2% milled wheat and 2% agar (OXOID Ltd, Basingstoke, England) to water to obtain the basal medium. For the initial screening, concentrations of PTS and PTSO in the range 10–200 ppm were used by adding the necessary stock solutions to the molten cooled medium, shaking vigorously and then pouring the media into 9 cm Petri plates (15 mL per plate). The basal 2% media had a water activity (aw) value of 0.995. This basal medium was modified by replacing water with different amounts of mixtures of glycerol/water solution to the milled cereal + agar to obtain the target aw values of 0.92, 0.94 and 0.98 (20.7, 15.4 and 4.9 g glycerol/50 mL of water, respectively) without diluting the nutritional status of the media. These aw levels represent the range over which these Fusaria can effectively grow [33]. The media were all checked with an Aqualab TE4 to confirm the actual aw levels were achieved.
Agar plugs (4 mm diameter) cut from the margin of 10-day-old cultures with a sterile cork borer, were used as an inoculum for the in vitro trials. Three replicate per treatment and replicate plates were centrally inoculated with the inoculum agar plugs. All experiments were repeated once. Each aw treatment and replicates were stored in separate polyethylene bags to maintain the environmental conditions over the experimental period.
The treatments and replicates were all incubated at 25 °C for 10 days, or until the Petri dishes were completely colonised by the fungi. Each concentration of the PTS and PTSO treatments were kept separately in polyethylene bags to avoid cross-contamination. Two diameters of the colonies formed (at right angles of each other) were measured daily and compared against the diameters of the controls. From these data the relative growth rates were calculated and the effect of different concentrations was calculated. The percentage inhibition of mycelial growth of the Fusarium species was determined at each different chemical compound concentration and the different water activities.
For mycotoxin analyses on the tenth day of incubation, agar plugs (5, 5-mm diameter) were cut out from each of the replicate plates diagonally across the colony. The agar plugs were placed in 2-mL safe-lock Eppendorf® tubes (Eppendorf AG, Hamburg, Germany), their weight was recorded and frozen at −40 °C for subsequent toxin analysis. The extraction and analysis of the relevant toxins for each fungal species were performed according to the methods described later.

5.3. In Situ Studies with Stored Cereal Grain

Fungal inoculum: Cultures of the above fungal species were prepared on MEA and incubated at 25 °C for 10 days. A Tween 80 solution was prepared by addition of one drop of Tween 80 (ACROS organics) in 100 mL sterile water. Spore suspensions were prepared by gently scraping the culture surface with a sterile spatula and transferring the spores into sterile 25 mL Universal glass vials containing the water + Tween 80 solution. The spore suspensions were filtered through glass wool in order to remove any mycelial fragments. The spore concentration was determined using a haemocytometer (Olympus BX40 microscope, Microoptical Co.; slide Marienfeld superior, Germany; microscope glass cover slips, No 3, 18 × 18mm, Chance Proper LTD, Smethwick, UK) and adjusted by dilution to 107 spores/mL. Naturally contaminated wheat, oats and maize were artificially inoculated with these suspensions for the in situ storage experiments.
Grain equilibration: Water adsorption curves were prepared for each grain type. The amount of water required to accurately modify these cereals to 0.91, 0.94 (maize) and 0.93 and 0.95 aw (wheat, oats) was determined from these curves. Initially, each grain type (approx. 1 kg) was taken from a 25-kg bag and placed in a Duran bottle (2.5 L). The initial moisture content was known from the moisture adsorption curves. The grain was randomly divided into batches of 100 g in Duran flasks (1 L). These were labeled for each treatment condition and the required amounts of sterile water added to each one including the treatment PTS or PTSO stock solution, shaken vigorously and sealed. They were placed at 4°C to equilibrate overnight. The treatments were then inoculated with 1-mL spore suspension containing ~105 spores/mL of the individual Fusarium species and thoroughly mixed using a roller mixer in order for the spores to become dispersed throughout the grain mass. For each grain type, 15 g was weighed into surface sterilized 40 mL vials (Chromacol Ltd., London, UK) with microporous lids to obtain six replicates per aw treatment and stored in sandwich boxes for up to 20 days. The equilibrium relative humidity (ERH) was maintained by including 2 × 500 mL of a glycerol-water solution in beakers to maintain the treatment aw levels. The experiments were carried out twice with six replicates per treatment.
For each experiment, after 10 and 20 days storage, three replicates were destructively removed from storage chambers and frozen at −20 °C for subsequent toxin analysis. Grain samples were oven-dried for 24–48 h at 60 °C, milled and then extracted and analysed as described later.

5.4. Mycotoxin Analyses

5.4.1. Equipment Description

High performance liquid chromatography (HPLC) were used to quantify DON, T-2 and HT-2 from media. In addition, liquid chromatography tandem mass spectrometry (LC-MS/MS) were used to quantify FUMS from media and Fusarium toxins from grains. HPLC used consisted of an Agilent 1200 Series system equipped with a UV diode array detector (DAD) set at 220.4 nm (Agilent Technologies, Palo Alto, CA, USA). The column used for the chromatographic separation was a Phenomenex® Gemini C18, 150 mm × 4.6 mm, 3 µm (Phenomenex, Macclesfield, UK) preceded by a Phenomenex® Gemini 3 mm guard cartridge and the column temperature was set at 25 °C. LC-MS/MS used consisted of an QTrap 5500 LC-MS/MS System (Applied Biosystems, Foster City, CA, USA) equipped with a TurboIonSpray electrospray ionization (ESI) source and an 1290 Series HPLC System (Agilent, Waldbronn, Germany). Chromatographic separation was performed at 25 °C on a Gemini® C18-column, 150 × 4.6 mm i.d., 5 µm particle size, equipped with a C18 4 × 3 mm i.d. security guard cartridge (all from Phenomenex, Torrance, CA, USA).

5.4.2. In Vitro Extraction and Analysis

Agar plugs were removed from media and placed in the 2-mL safe-lock Eppendorf® tubes. After that, the weight of the agar plugs were register.

Deoxynivalenol

The extraction was performed using 1-mL acetonitrile:water (AcN:H2O) (84:16), the mixture more commonly used for trichothecenes extraction [34] and the tubes were shaken in an orbital shaker at 200 rpm in the dark for 60 min at 25 °C. The extract was transferred to a new tube and oven-dried overnight at 60 °C. Subsequently, it was redissolved in 1 mL 90:10 (H2O: AcN) and vortexed for a few seconds. The cleaning step involved the addition of 150 mg/mL Alumina directly into the redissolved extract followed by vortexing the mixture for 15 s. The treated extract was then filtered through a 0.22 µm Millipore filter (Minisart, Sartorius, Germany) into an amber silanised LC vial and inserted into the LC-DAD for analysis. The chromatographic analysis was performed in the gradient mode, using water (solvent A) and acetonitrile (solvent B). The starting composition of the mobile phase was 5% B, at a flow rate of 0.5 mL/min held for 2 min. The composition was then gradually changed to 25% B over 15 min and maintained for further 3 min. Then it increased gradually to 30% B over 3 min at the same flow rate. The composition was then changed to 99% B during 1 min with a flow rate of 1 mL/min in this case, in order to achieve a fast cleaning step and maintained at 99% B for 4 more minutes. Afterwards the composition of the mobile phase was changed linearly to 5% B in 1 min at a flow rate of 1 mL/min and held for 4 min for further cleaning. In the last step, the composition was maintained at 5% B, but the flow rate changed to 0.5 mL/min for 1 min, in order to be the same as the starting composition of the mobile phase for the following chromatographic run. The injection volume was 50 μL. The total time for the analysis of each sample was 35 min. DON was eluted from the column at 16.2 min. The LOD was 4 µg/kg. The mean recovery for DON using this method was 63.2 ± 2.8%.

T-2 and HT-2

Extraction method used was Medina et al. [32] with modifications. The extraction was performed using 1 mL acetonitrile:water (AcN:H2O) (84:16) and the tubes were shaken for 1 h at 150 rpm at 25 °C in the dark in an orbital shaker. The samples were then centrifuged at 1150× g for 15 min. The extract was filtered through a 0.2 µm Millipore filter (Minisart, Sartorius) directly into an HPLC silanised amber vial and injected in the chromatograph. The analysis was performed in the gradient mode with a mobile phase of AcN:H2O at a flow rate of 1 mL/min and the conditions were 3 min 30% AcN, changed linearly to 55% AcN over 18 min, changed to 99% AcN in 1 min and held to 99% AcN for 5 min. The LOD was 4 and 5 µg/kg for T-2 and HT-2. The mean recoveries for this method were 99 ± 1.53% for T-2 toxin and 101.28 ± 3.11% for HT-2 toxin.

Fumonisins

The extraction was performed using 1 mL of extraction solvent AcN:H2O:Acetic acid (79:20:1) and the tubes were shaking 250 rpm in the dark for 1 h. The extracts were filtered through a 0.22 µm Millipore filter (Minisart, Sartorius) into new tubes, and dried in an oven at 60 °C for 24 h. The dried extracts were redissolved in a mixture of AcN:H2O (1:1) containing 1% acetic acid. The individual fumonisins were quantified using LC-MS/MS according to the method of Vishwanath et al. [35]. LOD was 25 µg/kg with a recovery rate of 57% (FB1) and 70% (FB2).

5.4.3. In Situ Extraction and Analysis

The initial mycotoxin contamination levels were quantified and this was taken into account when calculating the results of the treatments and appropriately corrected. The mean contamination levels were: DON, 0.233 µg/kg; T-2 toxin, 9.07 µg/kg (no HT-2 toxin present); ZEN, 8.42 µg/kg, and FB1 0.14 µg/kg. The grain samples were oven-dried at 60 °C for 24–48 h and then milled in a small laboratory blender (Waring Commercial, Christison, UK). Samples were analysed for Fusarium toxins by LC-MS/MS at the Centre for Analytical Chemistry, Department of Agrobiotechnology (IFA-Tulln, Tulln, Austria), University of Natural Resources and Life Sciences, Vienna, Austria. The analysis was performed according to the methods described by Sulyok et al. and Vishwanath et al. [35,36]. The accuracy of the method was externally checked by participation in proficiency testing organised by the Bureau Inter Professionel d’Etudes Analytiques (BIPEA; Gennevilliers, France). Z-scores were 0.4 and 0.62 for DON in two wheat samples, −0.8 and −1.09 for ZON in two wheat samples and 1.36 and 1.55 for FB1 and FB2, respectively in a sample of maize.

5.5. Statistical Analysis

All experiments have been performed in triplicate and repeated once. Data were analysed with Microsoft Office Excel 2007 and with the package STATISTICA 9 (StatSoft®, Inc. 2010. STATISTICA (data analysis software system), version 9.1. www.statsoft.com, (Tulsa, OK, USA). The standard error of the mean was calculated in all trials and it is denoted with vertical bars in the figures.
Datasets were tested for normality and homoscedasticity using the Shapiro–Wilk and Levene test, respectively. When data failed the normality test, variable transformation was performed to try to improve normality or homogenise the variances. If still not normally distributed, it was analysed using the Kruskal–Wallis test by ranks.

Supplementary Materials

The following are available online at https://www.mdpi.com/2072-6651/11/9/495/s1, Figure S1: Effect of 0–250 ppm PTSO and PTS on in vitro DON production by F. graminearum in wheat agar media at 25 °C, Figure S2: Effect of 0–250 ppm (a) PTSO and (b) PTS on the production of T-2 and HT-2 toxins by F. langsethiae in vitro at 25 °C, Table S1: One-way ANOVA for the effect of different PTS and PTSO concentrations on in vitro fumonisins (B1 and B2) production by F. verticillioides, Table S2: Kruskal-Wallis ANOVA by ranks for the effect of PTSO concentration and substrate water activity on the production of T-2 and HT-2 toxins by F. langsethiae, Table S3: Summary of statistical P-values of effects of (a) PTS and (b) PTSO on mycotoxin contamination of stored cereals.

Author Contributions

K.M. and E.G.-C. carried out the practical work and statistical analyses, M.S. carried out some of the mycotoxin analyses in naturally contaminated cereals and with preservatives. A.M. and N.M. supervised the research work and wrote the draft and final manuscript.

Funding

Parts of this work were funded by the European Union via the FP7 MYCORED Project (Grant Agreement No. 222690).

Acknowledgments

The authors would like to thank S. Edwards, Harper Adams University and P. Battilani, Catholic University of Italy, Piacenza, Italy) for supplied the strains.

Conflicts of Interest

The authors declare no conflict of interest.

References

  1. Prakash, B.; Mishra, P.K.; Kedia, A.; Dwivedy, A.K.; Dubey, N.K. Efficacy of some essential oil components as food preservatives against food contaminating molds, aflatoxin b1 production and free radical generation. J. Food Qual. 2015, 38, 231–239. [Google Scholar] [CrossRef]
  2. Yin, M.; Tsao, S. Inhibitory effect of seven Allium plants upon three Aspergillus species. Int. J. Food Microbiol. 1999, 49, 49–56. [Google Scholar] [CrossRef]
  3. Yoshida, S.; Kasuga, S.; Hayashi, N.; Ushiroguchi, T.; Matsuura, H.; Nakagawa, S. Antifungal Activity of Ajoene Derived from Garlic. Appl. Environ. Microbiol. 1987, 53, 615–617. [Google Scholar]
  4. Benkeblia, N. Antimicrobial activity of essential oil extracts of various onions (Allium cepa) and garlic (Allium sativum). LWT - Food Sci. Technol. 2004, 37, 263–268. [Google Scholar] [CrossRef]
  5. Singh, I.; Singh, V.P. Effect of plant extracts on mycelial growth and aflatoxin production by Aspergillus flavus. Indian J. Microbiol. 2005, 45, 139–142. [Google Scholar]
  6. Aldred, D.; Cairns-Fuller, V.; Magan, N. Environmental factors affect efficacy of some essential oils and resveratrol to control growth and ochratoxin A production by Penicillium verrucosum and Aspergillus westerdijkiae on wheat grain. J. Stored Prod. Res. 2008, 44, 341–346. [Google Scholar] [CrossRef]
  7. Magan, N.; Aldred, D. Post-harvest control strategies: Minimizing mycotoxins in the food chain. Int. J. Food Microbiol. 2007, 119. [Google Scholar] [CrossRef]
  8. Garcia, D.; Garcia-Cela, E.; Ramos, A.J.; Sanchis, V.; Marín, S. Mould growth and mycotoxin production as affected by Equisetum arvense and Stevia rebaudiana extracts. Food Control 2011, 22, 1378–1384. [Google Scholar] [CrossRef]
  9. Garcia-Cela, E.; Gil-Serna, J.; Marin, S.; Acevedo, H.; Patino, B.; Ramos, A.J. Effect of preharvest anti-fungal compounds on Aspergillus steynii and A. carbonarius under fluctuating and extreme environmental conditions. Int. J. Food Microbiol. 2012, 159, 167–176. [Google Scholar] [CrossRef]
  10. Magan, N.; Hope, R.; Colleate, A.; Baxter, E. Relationship Between Growth and Mycotoxin Production by Fusarium species, Biocides and Environment. Eur. J. Plant Pathol. 2002, 108, 685–690. [Google Scholar] [CrossRef]
  11. Small, L.D.; Bailey, J.H.; Cavallito, C.T. Alkyl thiosulfinates. J. Am. Chem. Soc. 1947, 69, 1710–1713. [Google Scholar] [CrossRef]
  12. European Commission. Commission Regulation (EC) No. 1881/2006 of 19 December 2006, Setting maximum levels for certain contaminants in foodstuffs. Off. J. Eur. Union 2006, 364, 5–24. [Google Scholar]
  13. European Commission. Commission Recommendation No 2013/165/EU of 27 March 2013 on the presence of T-2 and HT-2 toxin in cereals and cereal products. Off. J. Eur. Union 2013, 91, 12–15. [Google Scholar] [CrossRef]
  14. Aly, S.E.; Sabry, B.A.; Shaheen, M.S.; Hathout, A.S. Assessment of antimycotoxigenic and antioxidant activity of star anise (Illicium verum) in vitro. J. Saudi Soc. Agric. Sci. 2016, 15, 20–27. [Google Scholar] [CrossRef]
  15. Morcia, C.; Tumino, G.; Ghizzoni, R.; Bara, A.; Salhi, N.; Terzi, V.; Morcia, C.; Tumino, G.; Ghizzoni, R.; Bara, A.; et al. In vitro evaluation of sub-lethal concentrations of plant-derived antifungal compounds on FUSARIA growth and mycotoxin production. Molecules 2017, 22, 1271. [Google Scholar] [CrossRef]
  16. Soliman, K.; Badeaa, R. Effect of oil extracted from some medicinal plants on different mycotoxigenic fungi. Food Chem. Toxicol. 2002, 40, 1669–1675. [Google Scholar] [CrossRef]
  17. Yamamoto-Ribeiro, M.M.G.; Grespan, R.; Kohiyama, C.Y.; Ferreira, F.D.; Mossini, S.A.G.; Silva, E.L.; de Abreu Filho, B.A.; Mikcha, J.M.G.; Machinski Junior, M. Effect of Zingiber officinale essential oil on Fusarium verticillioides and fumonisin production. Food Chem. 2013, 141, 3147–3152. [Google Scholar] [CrossRef]
  18. Nguefack, J.; Leth, V.; Amvam Zollo, P.H.; Mathur, S.B. Evaluation of five essential oils from aromatic plants of Cameroon for controlling food spoilage and mycotoxin producing fungi. Int. J. Food Microbiol. 2004, 94, 329–334. [Google Scholar] [CrossRef]
  19. Xing, F.; Hua, H.; Selvaraj, J.N.; Zhao, Y.; Zhou, L.; Liu, X.; Liu, Y. Growth inhibition and morphological alterations of Fusarium verticillioides by cinnamon oil and cinnamaldehyde. Food Control 2014, 46, 343–350. [Google Scholar] [CrossRef]
  20. Sumalan, R.-M.; Alexa, E.; Poiana, M.-A. Assessment of inhibitory potential of essential oils on natural mycoflora and Fusarium mycotoxins production in wheat. Chem. Cent. J. 2013, 7, 32. [Google Scholar] [CrossRef]
  21. Venkatesh, H.N.; Sudharshana, T.N.; Abhishek, R.U.; Thippeswamy, S.; Manjunath, K.; Mohana, D.C. Antifungal and antimycotoxigenic properties of chemically characterised essential oil of Boswellia serrata Roxb. ex Colebr. Int. J. Food Prop. 2017, 1–13. [Google Scholar] [CrossRef]
  22. Ferreira, F.M.D.; Hirooka, E.Y.; Ferreira, F.D.; Silva, M.V.; Mossini, S.A.G.; Machinski, M., Jr. Effect of Zingiber officinale Roscoe essential oil in fungus control and deoxynivalenol production of Fusarium graminearum Schwabe in vitro. Food Addit. Contam. Part A 2018, 35, 2168–2174. [Google Scholar] [CrossRef]
  23. Elhouiti, F.; Tahri, D.; Takhi, D.; Ouinten, M.; Barreau, C.; Verdal-Bonnin, M.-N.; Bombarda, I.; Yousfi, M. Variability of composition and effects of essential oils from Rhanterium adpressum Coss. & Durieu against mycotoxinogenic Fusarium strains. Arch. Microbiol. 2017, 199, 1345–1356. [Google Scholar] [CrossRef]
  24. Kurita, N.; Koike, S. Synergistic antimicrobial effect of ethanol, sodium chloride, acetic acid and essential oil components. Agric. Biol. Chem. 1983, 47, 67–75. [Google Scholar] [CrossRef]
  25. Marin, S.; Magan, N.; Ramos, A.J.; Sanchis, V. Fumonisin-producing strains of Fusarium: A review of their ecophysiology. J. Food Prot. 2004, 67, 1792–1805. [Google Scholar] [CrossRef]
  26. Hope, R.; Aldred, D.; Magan, N. Comparison of the effect of environmental factors on deoxynivalenol production by F. culmorum and F. graminearum on wheat grain. Lett. Appl. Microbiol. 2005, 40, 295–300. [Google Scholar] [CrossRef]
  27. Medina, A.; Magan, N. Water availability and temperature affects production of T-2 and HT-2 by Fusarium langsethiae strains from north European countries. Food Microbiol. 2011, 28, 392–398. [Google Scholar] [CrossRef]
  28. Tracz, B.L.; Bordin, K.; de Melo Nazareth, T.; Costa, L.B.; de Macedo, R.E.F.; Meca, G.; Luciano, F.B. dAssessment of allyl isothiocyanate as a fumigant to avoid mycotoxin production during corn storage. LWT 2017, 75, 692–696. [Google Scholar] [CrossRef]
  29. Giorni, P.; Bertuzzi, T.; Battilani, P. Impact of fungi co-occurrence on mycotoxin contamination in maize during the growing season. Front. Microbiol. 2019, 10, 1265. [Google Scholar] [CrossRef]
  30. Magan, N.; Aldred, D.; Hope, R.; Mitchell, D. Environmental factors and interactions with mycoflora of grain and grapes: effects on growth and deoxynivalenol and ochratoxin production by Fusarium culmorum and Aspergillus carbonarius. Toxins 2010, 2, 353–366. [Google Scholar] [CrossRef]
  31. Mylona, K.; Sulyok, M.; Magan, N. Fusarium graminearum and Fusarium verticillioides colonisation of wheat and maize, environmental factors, dry matter losses and mycotoxin production relevant to the EU legislative limits. Food Addit. Contam. 2012, 29, 1118–1128. [Google Scholar] [CrossRef]
  32. Medina, A.; Valle-Algarra, F.M.; Jiménez, M.; Magan, N. Different sample treatment approaches for the analysis of T-2 and HT-2 toxins from oats-based media. J. Chromatogr. B 2010, 878, 2145–2149. [Google Scholar] [CrossRef] [Green Version]
  33. Sanchis, V.; Magan, N. Mycotoxins in food: Detection and control. In Environmental Profiles for Growth and Mycotoxin Production; Magan, N., Olsen, M., Eds.; Woodhead Publishing: Cambridge, UK, 2004; pp. 174–189. [Google Scholar]
  34. Krska, R.; Welzig, E.; Boudra, H. Analysis of Fusarium toxins in feed. Anim. Feed Sci. Technol. 2007, 137, 241–264. [Google Scholar] [CrossRef]
  35. Vishwanath, V.; Sulyok, M.; Labuda, R.; Bicker, W.; Krska, R. Simultaneous determination of 186 fungal and bacterial metabolites in indoor matrices by liquid chromatography/tandem mass spectrometry. Anal. Bioanal. Chem. 2009, 395, 1355–1372. [Google Scholar] [CrossRef]
  36. Sulyok, M.; Berthiller, F.; Krska, R.; Schuhmacher, R. Development and validation of a liquid chromatography/tandem mass spectrometric method for the determination of 39 mycotoxins in wheat and maize. Rapid Commun. Mass Spectrom. 2006, 20, 2649–2659. [Google Scholar] [CrossRef]
Figure 1. Effect of 0–200 ppm (a) Propyl Propane Thiosulfonate (PTS) and (b) Propyl Propane Thiosulphonate (PTSO) on the in vitro (2% wheat agar medium) on the radial growth rate (n = 6) of an isolate of F. graminearum, F. langsethiae and F. verticillioides. Vertical bars indicate the standard error of the means. For PTS effects on growth: F. graminearum: H (4, N = 30) = 26.612, p < 0.001; F. langsethiae: H (4, N = 30) = 27.647, p < 0.001; F. verticillioides: H (4, N = 30) = 26.522, p < 0.001; for fungal species: H (2, N = 90) = 3.176, p = 0.2004. For PTSO effects on growth: F. graminearum: H (4, N = 30) = 27.451, p < 0.001; F. langsethiae: H (4, N = 30) = 27.877, p < 0.001; fungal species: H (2, N = 90) = 12.926, p = 0.002.
Toxins 11 00495 g001
Figure 2. Effect of 0–100 ppm Propyl Propane Thiosulfinate (PTSO) on the radial growth rates (n = 6) of an isolate of (a) F. graminearum and (b) F. langsethiae in vitro (2% wheat agar medium) in relation to water activity (aw). Vertical bars indicate the standard error of the means. Statistical analyses for (a) F. graminearum: H (4, N = 30) = 27.451, p < 0.001; and for (b) F. langsethiae: H (4, N = 30) = 27.877, p < 0.001.
Toxins 11 00495 g002
Figure 3. Effect of 0–200 ppm of (a) PTS and (b) PTSO on the production of fumonisins B1 and B2 by F. verticillioides in vitro at 25 °C. Vertical bars indicate the standard error of the means. For statistical analyses see Supplementary Table S2.
Toxins 11 00495 g003
Figure 4. Effect of 0–300 ppm of PTS (a) and 0–80 ppm PTSO (b) on deoxynivalenol production by F. graminearum in artificially inoculated wheat of 0.93 and 0.95 aw stored for 10 and 20 days at 25 °C (n = 2 × 3). Vertical bars indicate the standard error of the means. The red lines show the EU legislative limits (EC 1881/2006) for deoxynivalenol in unprocessed wheat for feed use (1750 µg/kg).
Toxins 11 00495 g004
Figure 5. Effect of (a) 0–300 ppm PTS and (b) 0–80 ppm PTSO on zearalenone production by F. graminearum in artificially inoculated stored wheat at 0.93 and 0.95 aw for 10 and 20 days at 25 °C (n = 2 × 3). Vertical bars indicate the standard error of the means. The red lines show the EU legislative limits (EC. 1881/2006) for zearalenone in unprocessed wheat for human use (100 µg/kg). Kruskal–Wallis ANOVA for Statistical effects for PTS concentration: H (3, N = 48) = 1.39, p = 0.707, grain aw: H (1, N = 48) = 3.44, p = 0.064, storage time: H (1, N = 48) = 12, p < 0.001; For PTSO conc.: H (2, N = 36) = 0.47, p = 0.789, aw: H (1, N = 36) = 1.48, p = 0.223, storage time: H (1, N = 36) = 21.34, p < 0.001.
Toxins 11 00495 g005
Figure 6. Effect of (a) 0–300 ppm aqueous PTS and (b) 0–16 ppm PTSO on T-2+HT-2 toxin production by F. langsethiae in artificially inoculated oats of 0.93 and 0.95 aw and stored for 10 and 20 days at 25 °C. Vertical bars indicate the standard error of the means. The red lines show the EU recommended for maximum limits (EC. 165/2013) for sum T-2 and HT-2 toxin in unprocessed oat for human use (1000 µg/kg).
Toxins 11 00495 g006
Figure 7. Effect of 0–300 ppm aqueous PTS on total fumonisins production by F. verticillioides in artificially inoculated maize stored at 0.91 and 0.94 aw for 10 and 20 days at 25 °C. Vertical bars indicate the standard error of the means. The red lines show the EU legislative limits (EC. 1881/2006) for fumonisins (FB1 + FB2) in unprocessed maize for human use (2000 µg/kg).
Toxins 11 00495 g007
Table 1. Effective dose of PTS and PTSO for 50% and 90% control (ED50; ED90 values) of growth, when compared to the untreated control, for inhibition of F. graminearum, F. langsethaie and F. verticillioides on 2% milled wheat agar medium at 25 °C.
Treatment (ppm)PTSPTSO
SpeciesED50ED90ED50ED90
F. graminearum3314452186
F. langsethiae128021113
F. verticilloides064172>200>200
Table 2. Effective dose ED50 values (ppm) of PTSO for 50% inhibition of the growth of F. graminearum, F. verticillioides and F. langsethiae on wheat agar media of different water activities (aw) at 25 °C.
TreatmentsF. graminearumF. verticillioidesF. langsethiae
PTSO (0.98 aw)421899.5
PTSO (0.94 aw)36>10050
PTSO (0.92 aw)37>10032

