Diagnosing Microcystin Intoxication of Canines: Clinicopathological Indications, Pathological Characteristics, and Analytical Detection in Postmortem and Antemortem Samples

 ,
,
Abstract
:1. Introduction
2. Results
2.1. Presentation, Clinical Data and Treatment
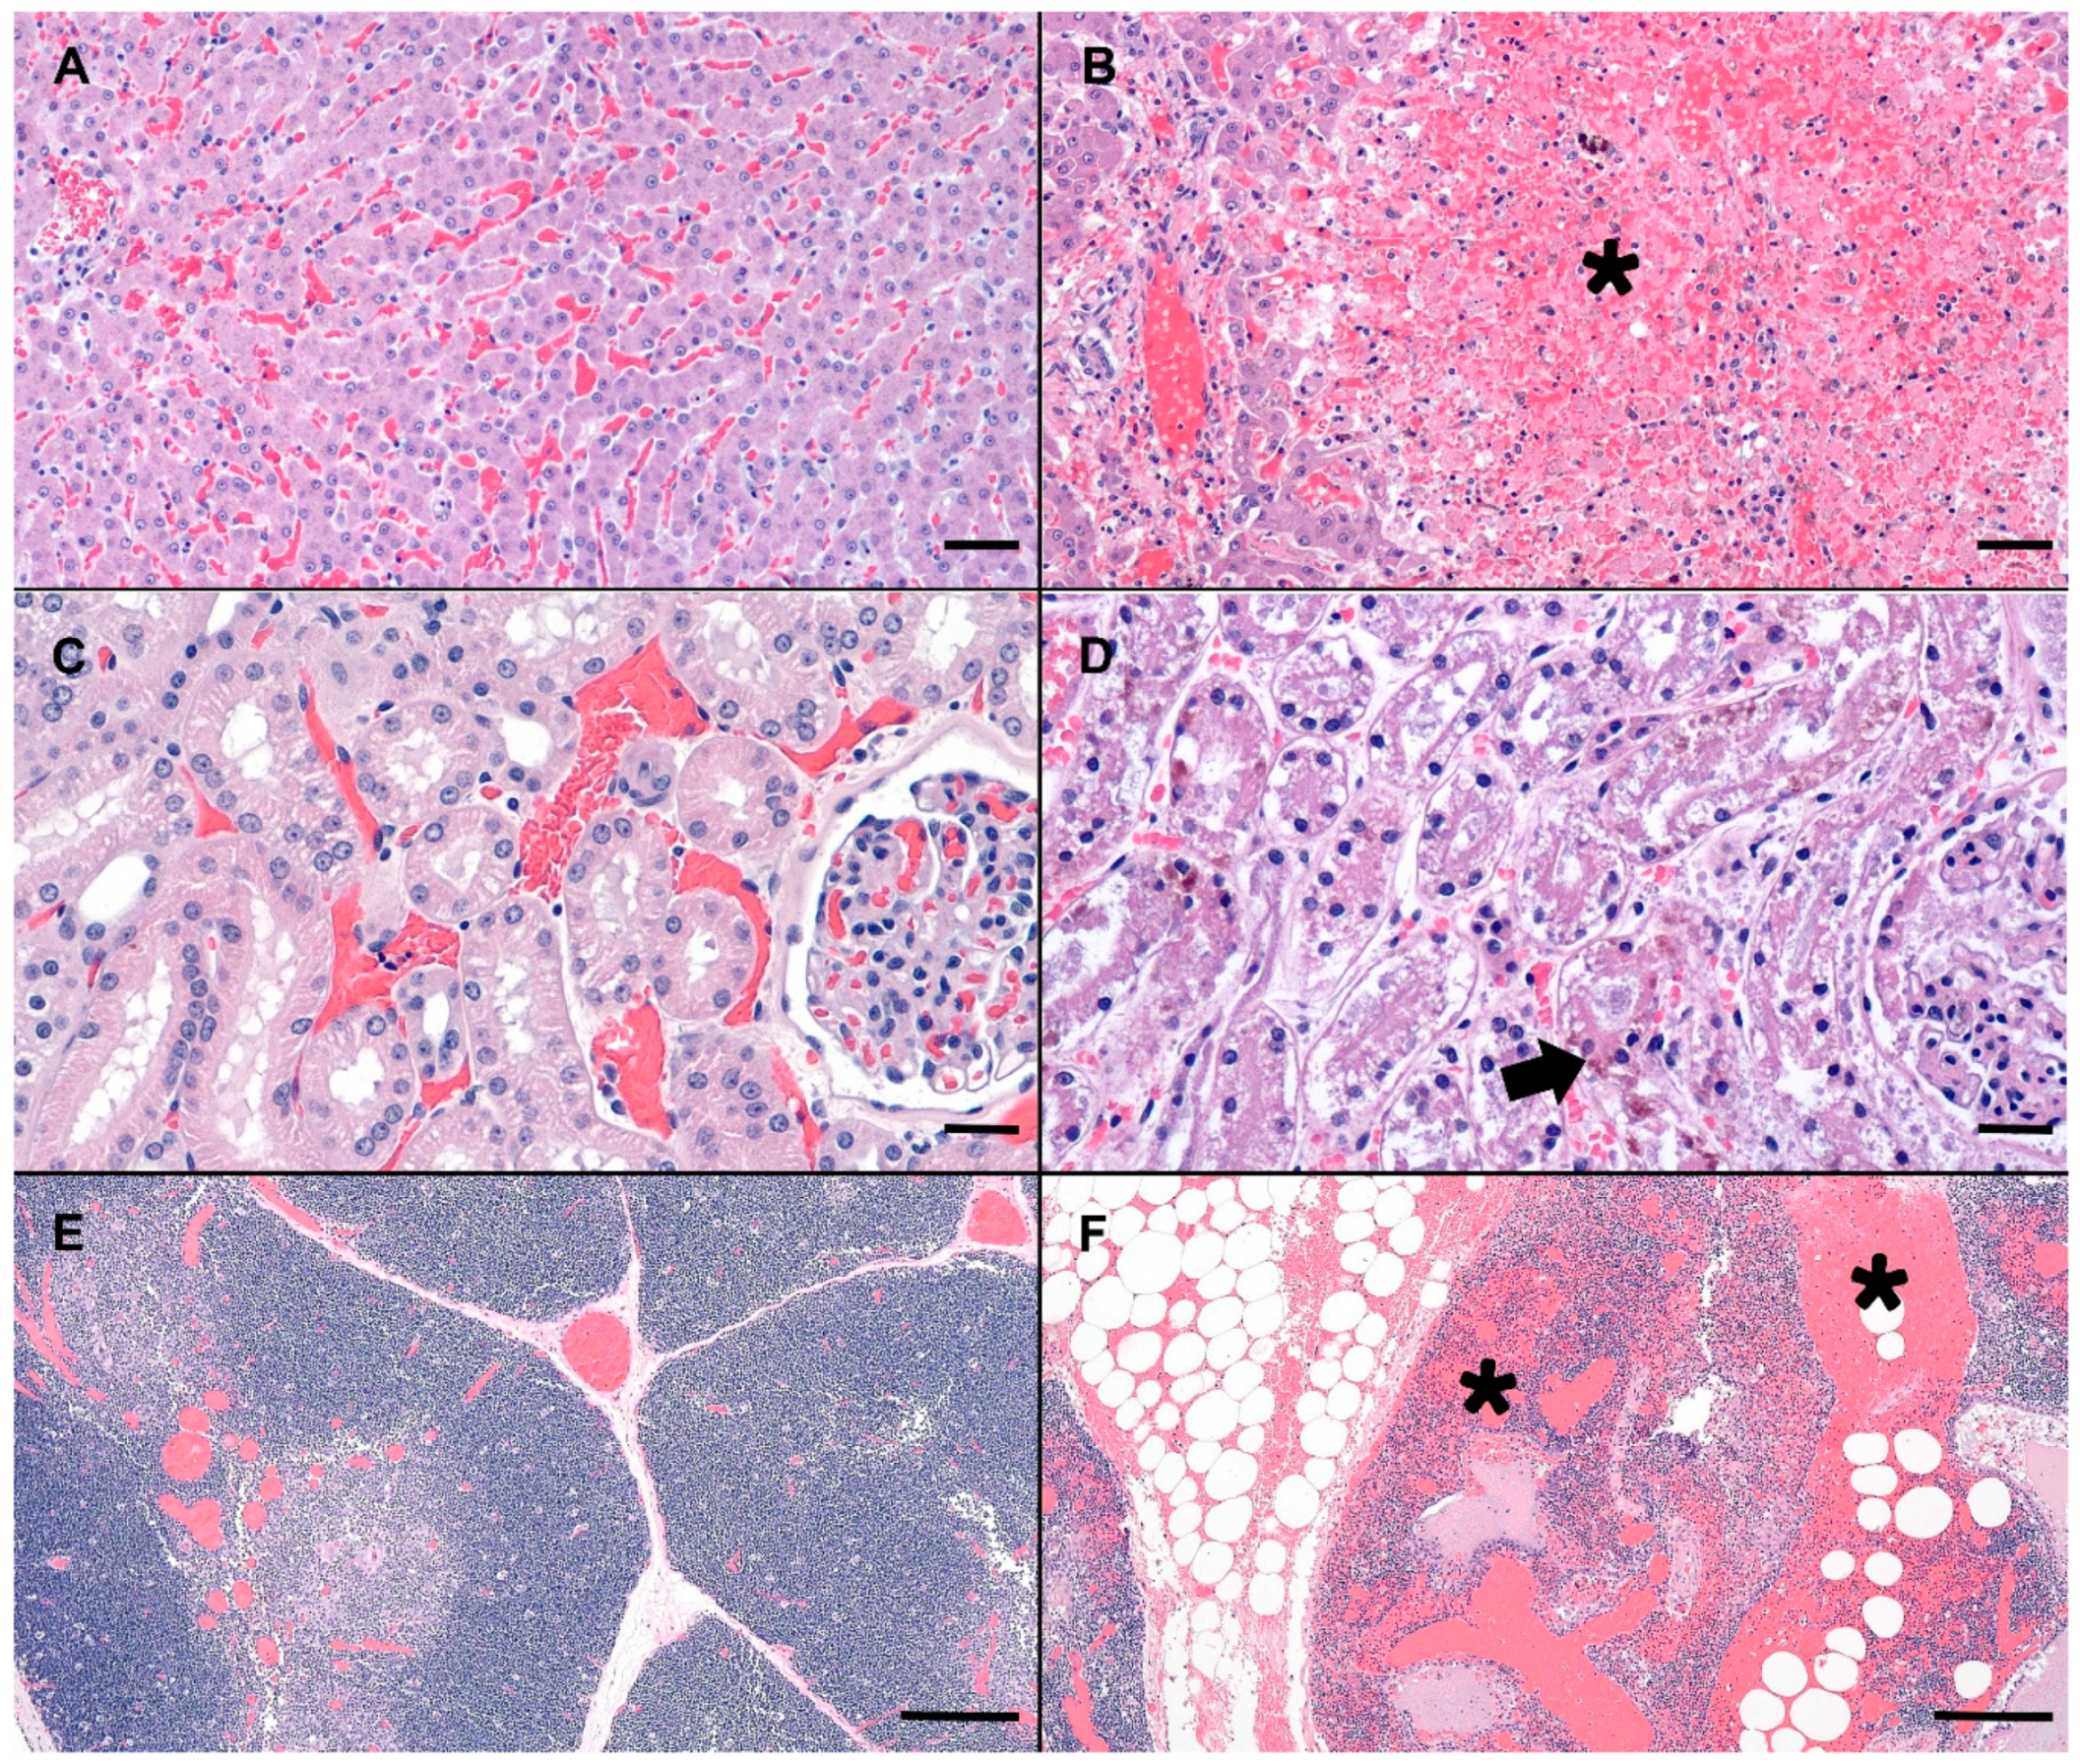
2.2. Pathology
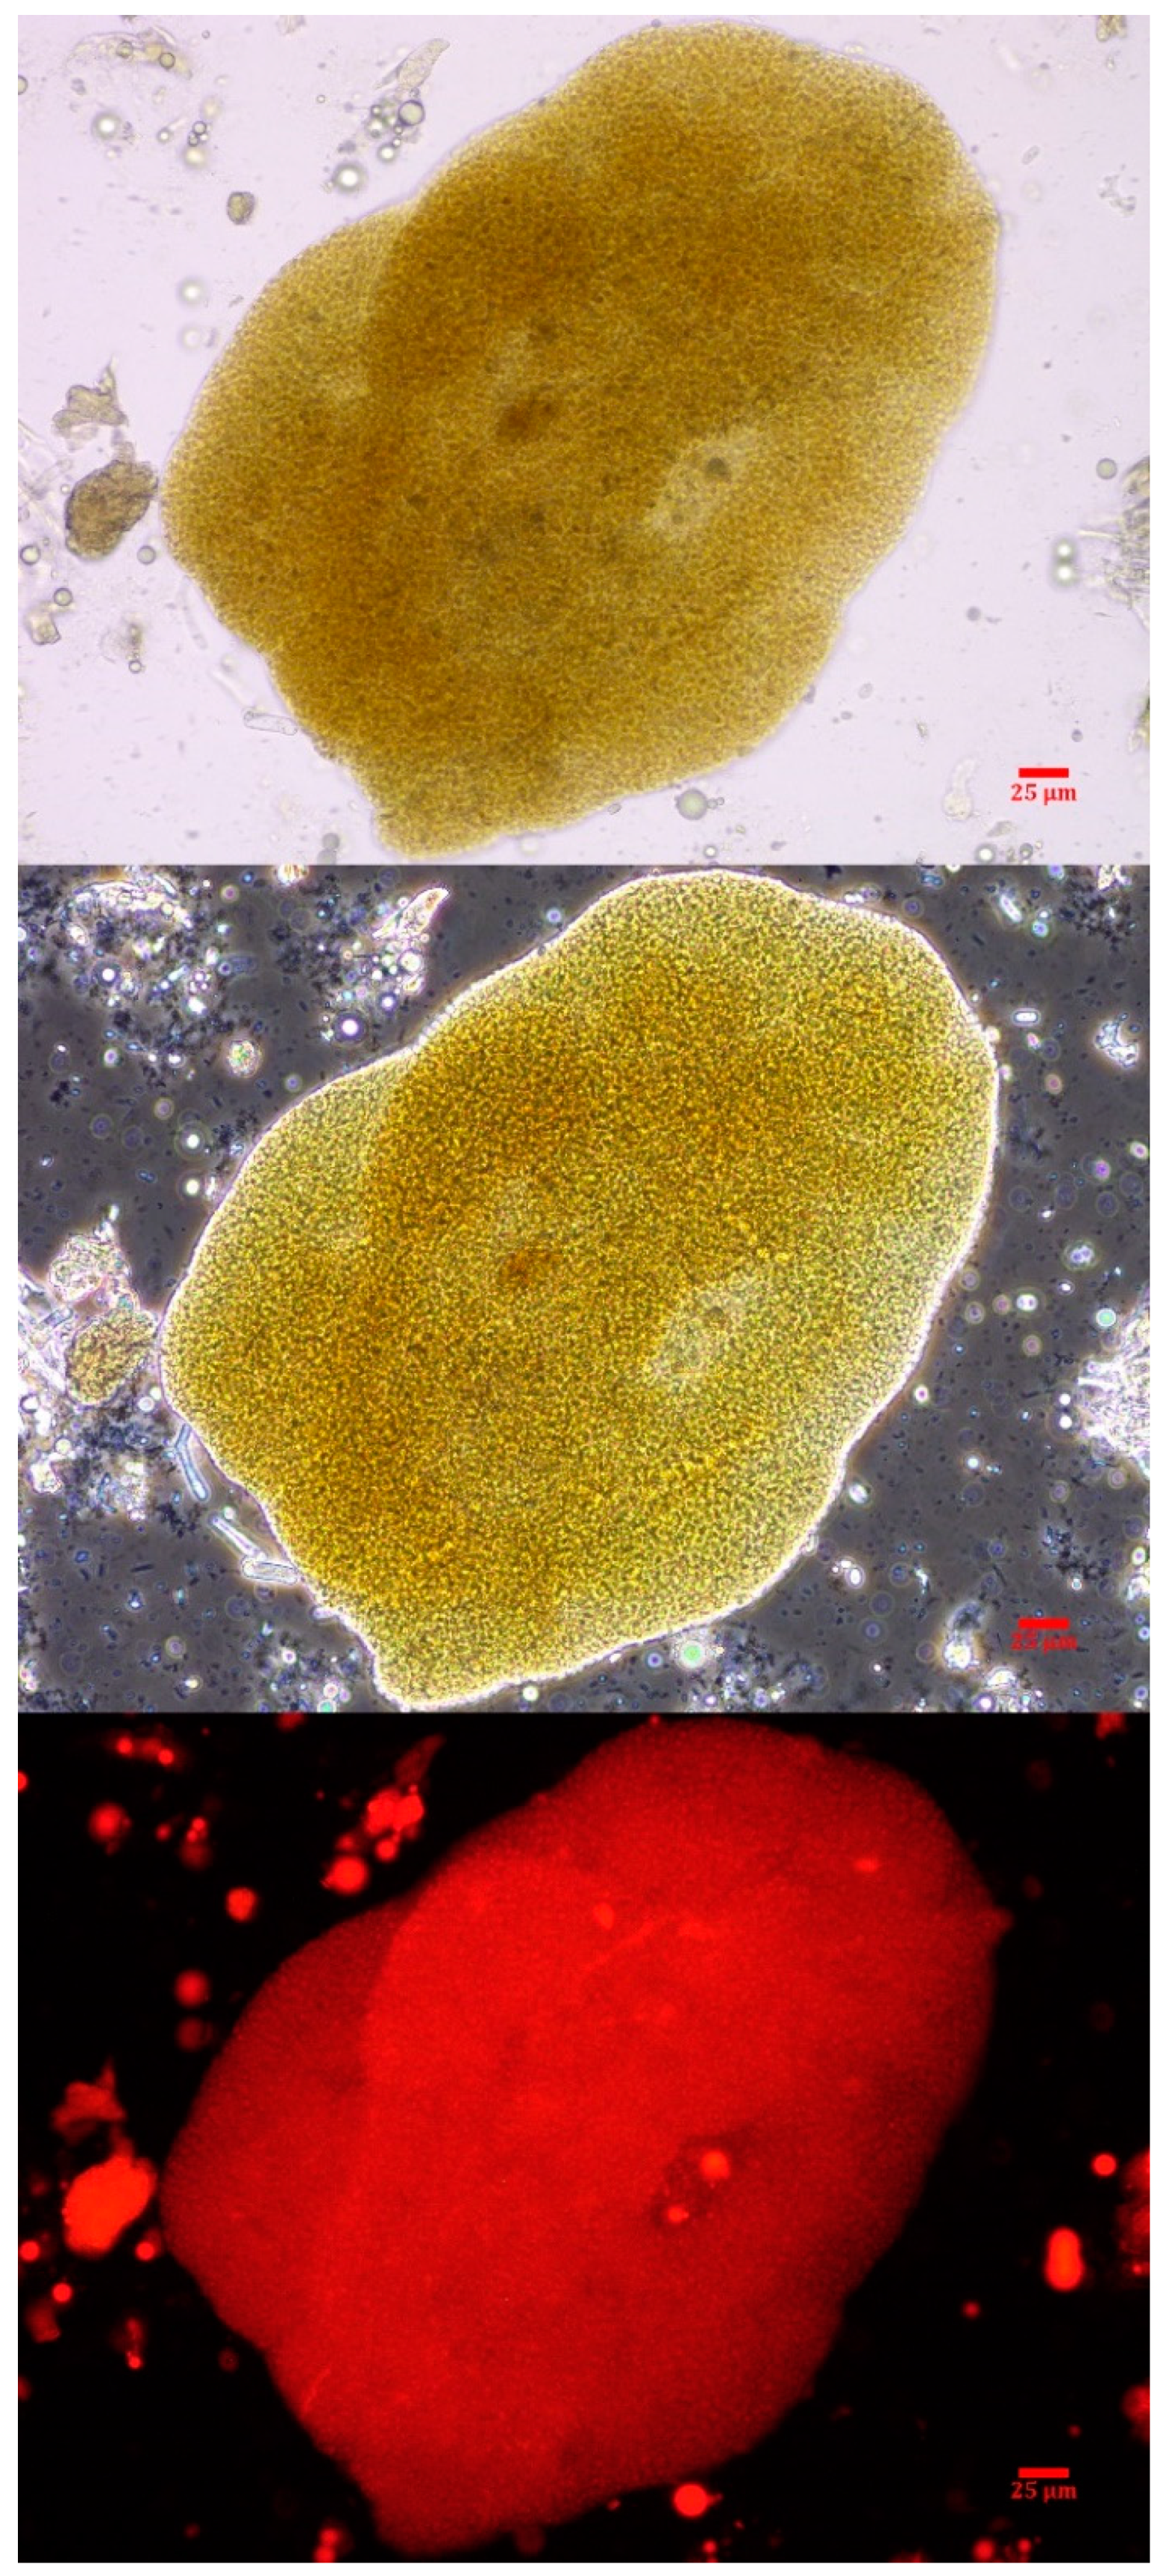
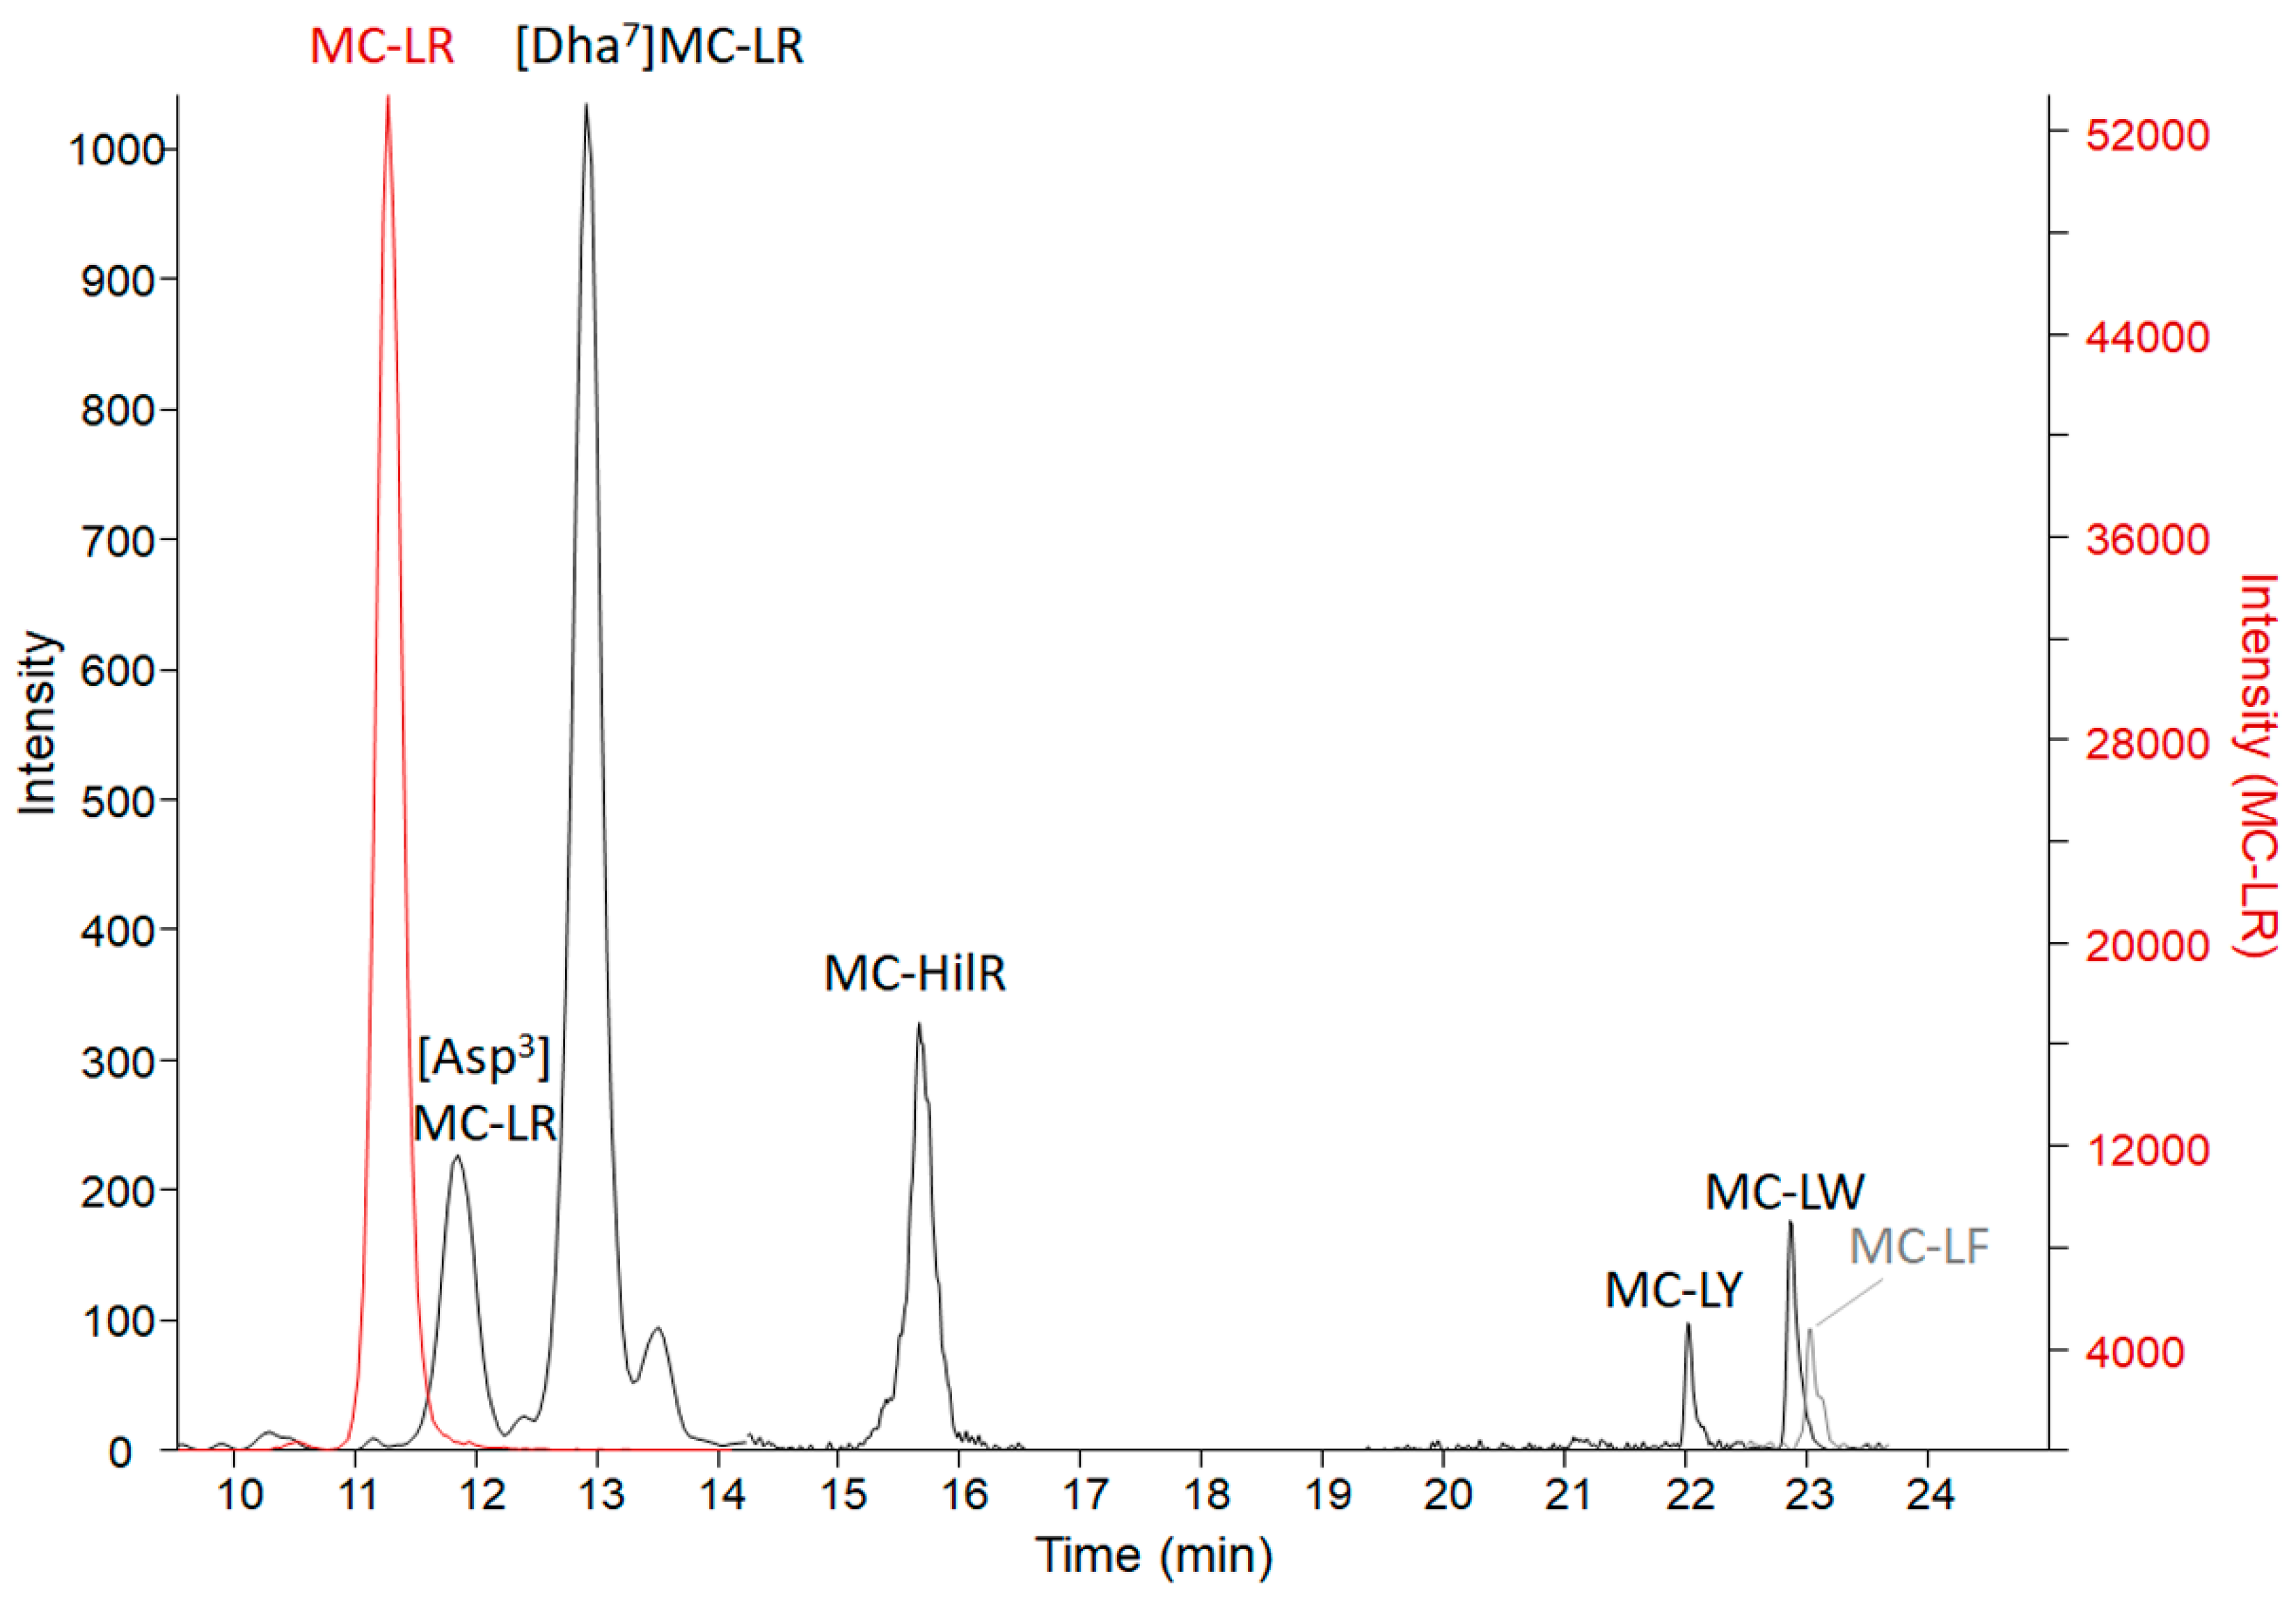
2.3. Phycology
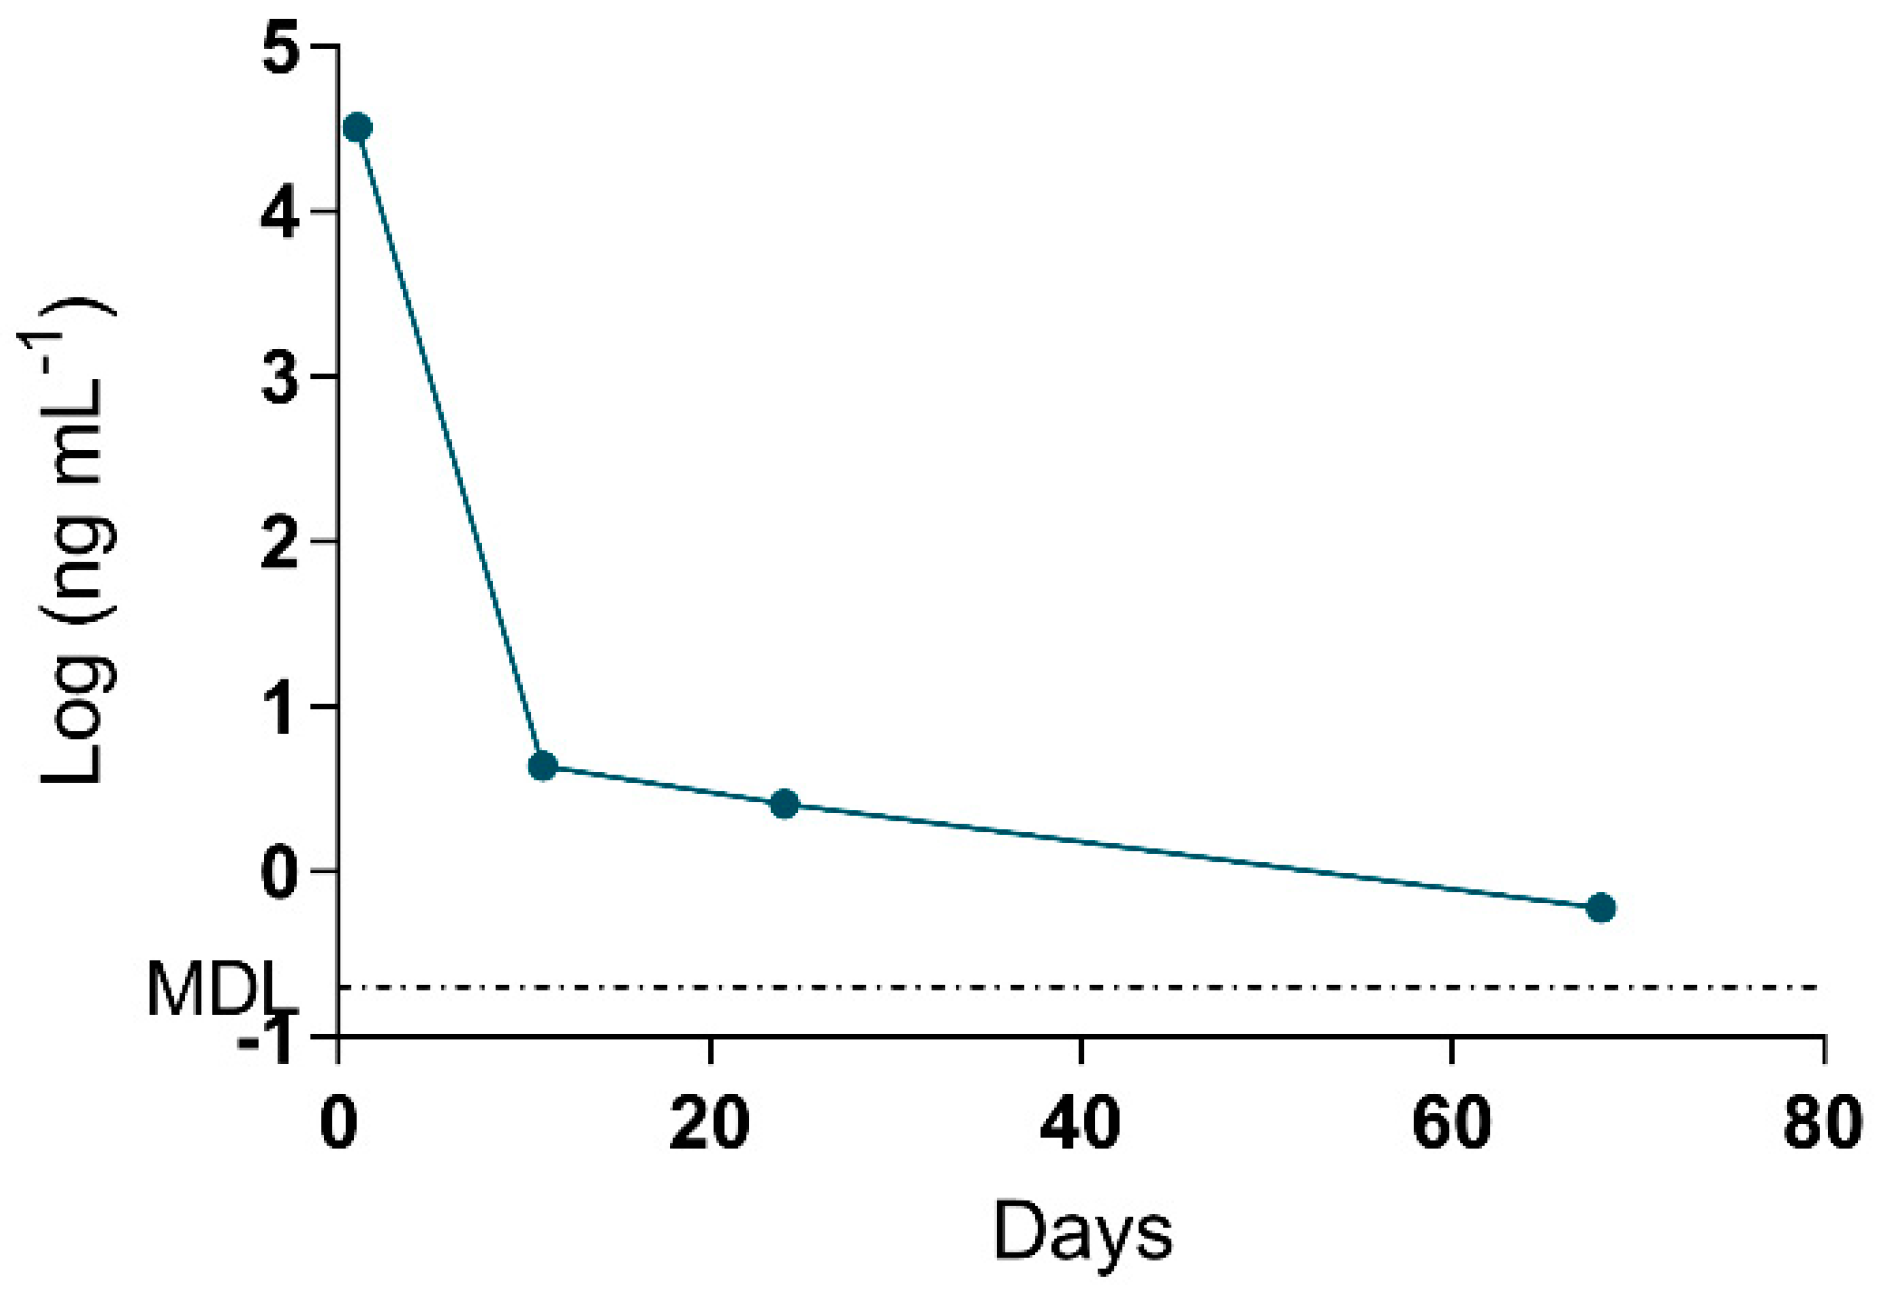
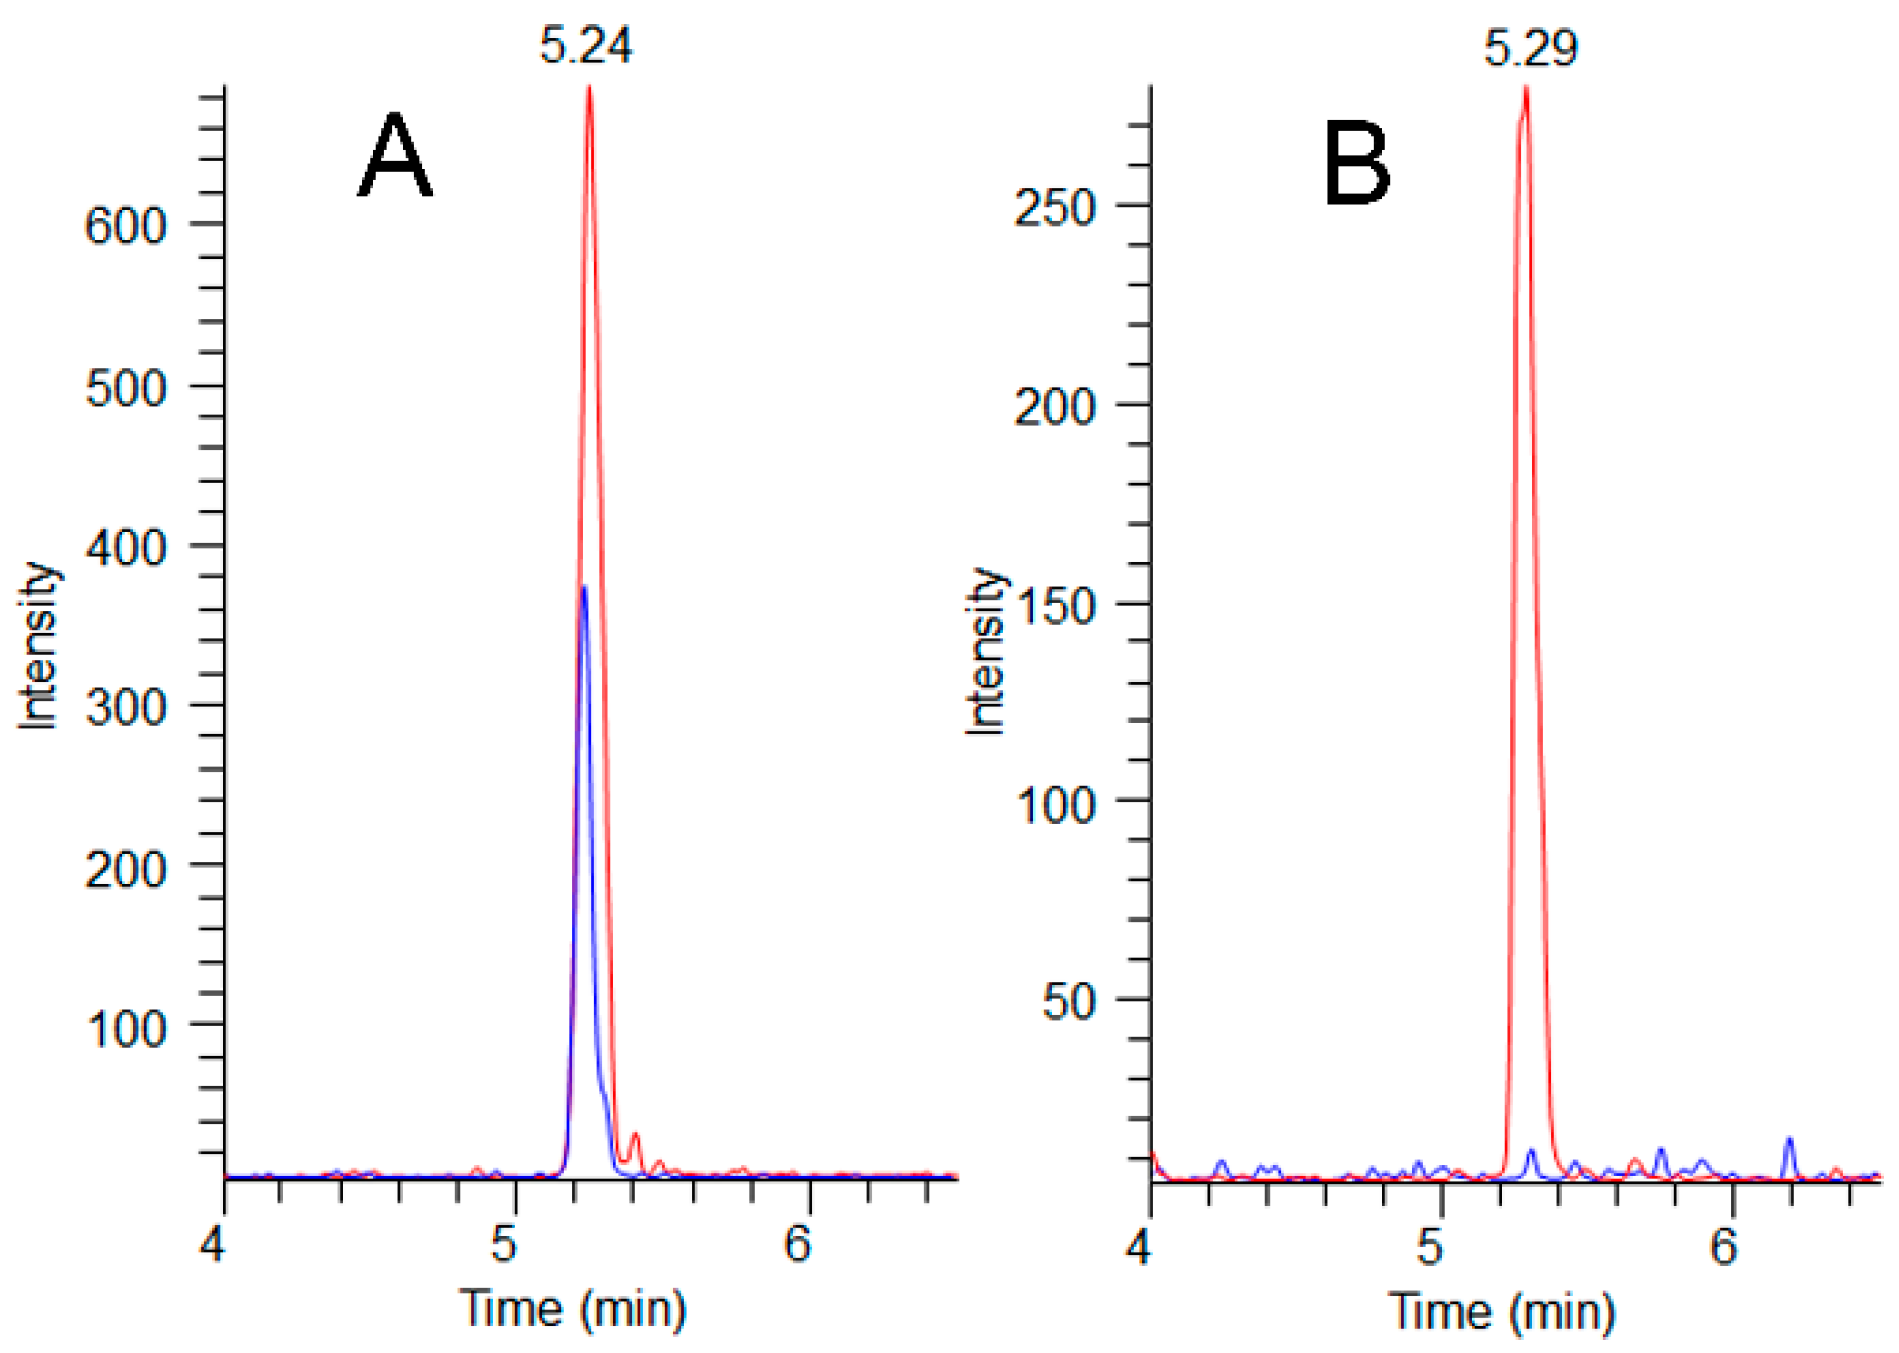
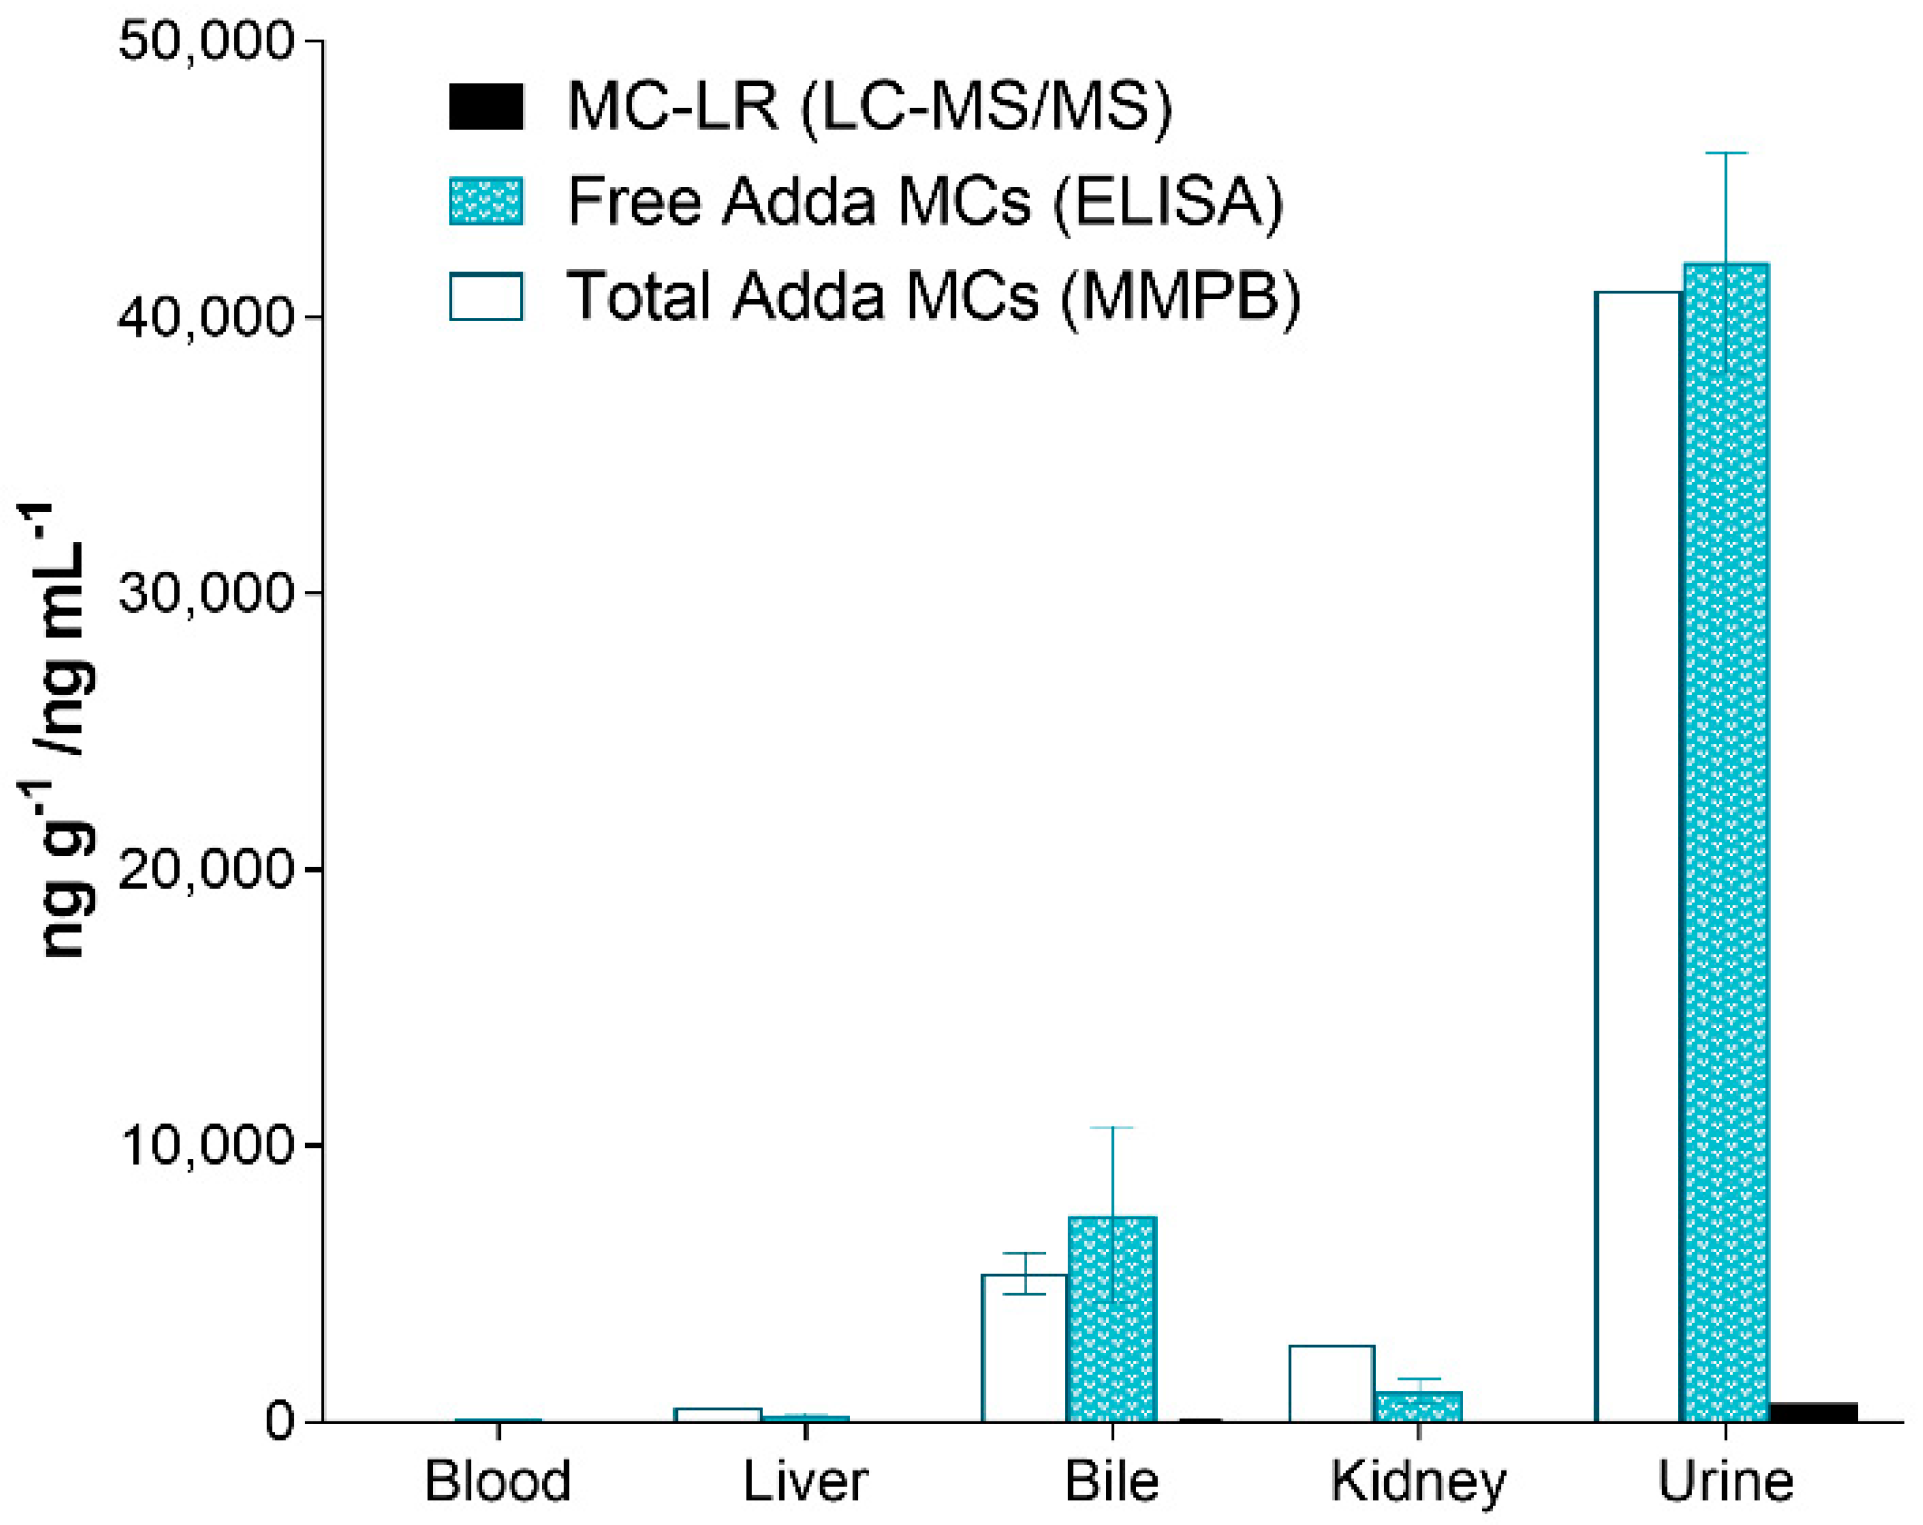
2.4. Adda Microcystin/Nodularin (MC/NOD) Levels
3. Discussion
4. Materials and Methods
4.1. Pathology and Specimen Collection
4.2. Phycology of Vomitus Sample
4.3. Adda MC/NOD Analyses
4.3.1. Specimen Homogenization
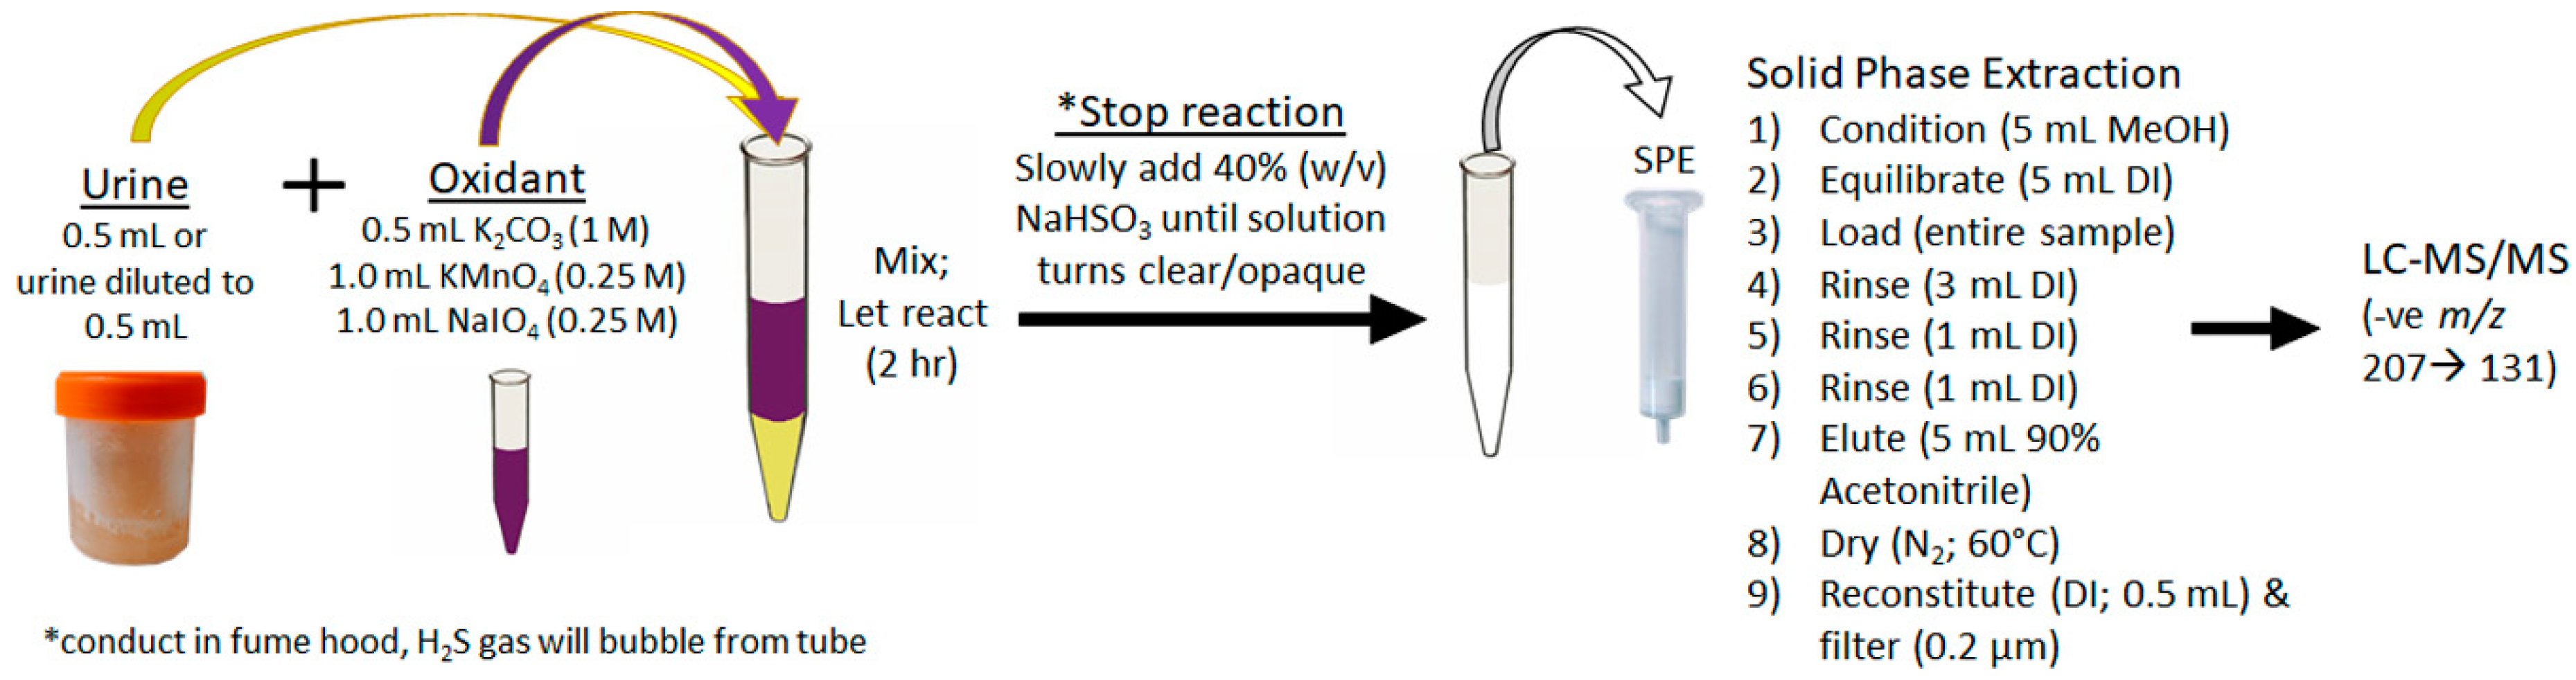
4.3.2. Total Adda MCs/NODs Oxidation, Extraction and Analysis (MMPB)
4.3.3. Free Adda MCs/NODs Extraction and Analyses
Supplementary Materials
Author Contributions
Funding
Acknowledgments
Conflicts of Interest
References
- Backer, L.C.; Manassaram-Baptiste, D.; LePrell, R.; Bolton, B. Cyanobacteria and algae blooms: Review of health and environmental data from the harmful algal bloom-related illness surveillance system (HABISS) 2007–2011. Toxins 2015, 7, 1048–1064. [Google Scholar] [CrossRef] [PubMed]
- Backer, L.C.; Landsberg, J.H.; Miller, M.; Keel, K.; Taylor, T.K. Canine cyanotoxin poisonings in the United States (1920s–2012): Review of suspected and confirmed cases from three data sources. Toxins 2013, 5, 1597–1628. [Google Scholar] [CrossRef] [PubMed]
- Backer, L.C.; Grindem, C.B.; Corbett, W.T.; Cullins, L.; Hunter, J.L. Pet dogs as sentinels for environmental contamination. Sci. Total Environ. 2001, 274, 161–169. [Google Scholar] [CrossRef] [Green Version]
- Rankin, K.A.; Alroy, K.A.; Kudela, R.M.; Oates, S.C.; Murray, M.J.; Miller, M.A. Treatment of cyanobacterial (microcystin) toxicosis using oral cholestyramine: Case report of a dog from Montana. Toxins 2013, 5, 1051–1063. [Google Scholar] [CrossRef] [PubMed]
- Van der Merwe, D.; Sebbag, L.; Nietfeld, J.C.C.; Aubel, M.T.T.; Foss, A.; Carney, E. Investigation of a Microcystis aeruginosa cyanobacterial freshwater harmful algal bloom associated with acute microcystin toxicosis in a dog. J. Vet. Diagnostic Investig. 2012, 24, 679–687. [Google Scholar] [CrossRef] [PubMed]
- Lürling, M.; Faassen, E.J. Dog poisonings associated with a Microcystis aeruginosa bloom in the Netherlands. Toxins 2013, 5, 556–567. [Google Scholar] [CrossRef] [PubMed]
- Faassen, E.J.; Harkema, L.; Begeman, L.; Lürling, M. First report of (homo)anatoxin-a and dog neurotoxicosis after ingestion of benthic cyanobacteria in The Netherlands. Toxicon 2012, 60, 378–384. [Google Scholar] [CrossRef]
- Stotts, R.R.; Twardock, A.R.; Koritz, G.D.; Haschek, W.M.; Manuel, R.K.; Hollis, W.B.; Beasley, V.R. Toxicokinetics of tritiated dihydromicrocystin-LR in swine. Toxicon 1997, 35, 455–465. [Google Scholar] [CrossRef]
- Stotts, R.R.; Twardock, A.R.; Haschek, W.M.; Choi, B.W.; Rinehart, K.L.; Beasley, V.R. Distribution of tritiated dihydromicrocystin in swine. Toxicon 1997, 35, 937–953. [Google Scholar] [CrossRef]
- Fawell, J.K.; Mitchell, R.E.; Everett, D.J.; Hill, R.E.; Everett, D.J. The toxicity of cyanobacterial toxins in the mouse: I microcystin-LR. Hum. Exp. Toxicol. 1999, 18, 168–173. [Google Scholar] [CrossRef]
- Eriksson, J.E.; Grönberg, L.; Nygård, S.; Slotte, J.P.; Meriluoto, J. a Hepatocellular uptake of 3H-dihydromicrocystin-LR, a cyclic peptide toxin. Biochim. Biophys. Acta 1990, 1025, 60–66. [Google Scholar] [CrossRef]
- Fischer, W.J.; Altheimer, S.; Cattori, V.; Meier, P.J.; Dietrich, D.R.; Hagenbuch, B. Organic anion transporting polypeptides expressed in liver and brain mediate uptake of microcystin. Toxicol. Appl. Pharmacol. 2005, 203, 257–263. [Google Scholar] [CrossRef] [Green Version]
- Lee, W.; Glaeser, H.; Smith, L.H.; Roberts, R.L.; Moeckel, G.W.; Gervasini, G.; Leake, B.F.; Kim, R.B. Polymorphisms in human organic anion-transporting polypeptide 1A2 (OATP1A2): Implications for altered drug disposition and central nervous system drug entry. J. Biol. Chem. 2005, 280, 9610–9617. [Google Scholar] [CrossRef]
- Li, X.-B.; Zhang, X.; Ju, J.; Li, Y.; Yin, L.; Pu, Y. Alterations in neurobehaviors and inflammation in hippocampus of rats induced by oral administration of microcystin-LR. Environ. Sci. Pollut. Res. 2014, 21, 12419–12425. [Google Scholar] [CrossRef]
- Pouria, S.; De Andrade, A.; Barbosa, J.; Cavalcanti, R.L.; Barreto, V.T.S.; Ward, C.J.; Preiser, W.; Poon, G.K.; Neild, G.H.; Codd, G.A. Fatal microcystin intoxication in haemodialysis unit in Caruaru, Brazil. Lancet 1998, 352, 21–26. [Google Scholar] [CrossRef]
- Wilby, A.J.; Maeda, K.; Courtney, P.F.; Debori, Y.; Webborn, P.J.H.; Kitamura, Y.; Kusuhara, H.; Riley, R.J.; Sugiyama, Y. Hepatic uptake in the dog: Comparison of uptake in hepatocytes and human embryonic kidney cells expressing dog organic anion-transporting polypeptide 1B4. Drug Metab. Dispos. 2011, 39, 2361–2369. [Google Scholar] [CrossRef]
- König, J.; Cui, Y.; Nies, A.T.; Keppler, D. Localization and genomic organization of a new hepatocellular organic anion transporting polypeptide. J. Biol. Chem. 2000, 275, 23161–23168. [Google Scholar] [CrossRef]
- Campos, A.; Vasconcelos, V. Molecular mechanisms of microcystin toxicity in animal cells. Int. J. Mol. Sci. 2010, 11, 268–287. [Google Scholar] [CrossRef]
- MacKintosh, R.W.; Dalby, K.N.; Campbell, D.G.; Cohen, P.T.W.; Cohen, P.; MacKintosh, C. The cyanobacterial toxin microcystin binds covalently to cysteine-273 on protein phosphatase 1. FEBS Lett. 1995, 371, 236–240. [Google Scholar] [Green Version]
- Honkanan, R.E.; Codispoti, B.A.; Tse, K.; Boynton, A.L. Characterization of natural toxins with inhibitory activity against serine/threonine protein phosphatases. Toxicon 1994, 32, 339–350. [Google Scholar] [CrossRef]
- Mattos, L.J.; Valença, S.S.; Azevedo, S.M.F.O.; Soares, R.M. Dualistic evolution of liver damage in mice triggered by a single sublethal exposure to Microcystin-LR. Toxicon 2014, 83, 43–51. [Google Scholar] [CrossRef]
- Ding, W.X.; Shen, H.M.; Ong, C.N. Critical role of reactive oxygen species formation in microcystin-induced cytoskeleton disruption in primary cultured hepatocytes. J. Toxicol. Environ. Health. A 2001, 64, 507–519. [Google Scholar] [CrossRef]
- Falconer, I.R.; Yeung, D.S. Cytoskeletal changes in hepatocytes induced by Microcystis toxins and their relation to hyperphosphorylation of cell proteins. Chem. Biol. Interact. 1992, 81, 181–196. [Google Scholar] [CrossRef]
- Kondo, F.; Ikai, Y.; Oka, H.; Okumura, M.; Ishikawa, N.; Harada, K.; Matsuura, K.; Murata, H.; Suzuki, M. Formation, characterization, and toxicity of the glutathione and cysteine conjugates of toxic heptapeptide microcystins. Chem. Res. Toxicol. 1992, 5, 591–596. [Google Scholar] [CrossRef]
- Buratti, F.M.; Scardala, S.; Funari, E.; Testai, E. Human glutathione transferases catalyzing the conjugation of the hepatoxin microcystin-LR. Chem. Res. Toxicol. 2011, 24, 926–933. [Google Scholar] [CrossRef]
- Kondo, F.; Matsumoto, H.; Yamada, S.; Ishikawa, N.; Ito, E.; Nagata, S.; Ueno, Y.; Suzuki, M.; Harada, K. Detection and identification of metabolites of microcystins formed in vivo in mouse and rat livers. Chem. Res. Toxicol. 1996, 9, 1355–1359. [Google Scholar] [CrossRef]
- Ito, E.; Kondo, F.; Harada, K.I. First report on the distribution of orally administered microcystin-LR in mouse tissue using an immunostaining method. Toxicon 2000, 38, 37–48. [Google Scholar] [CrossRef]
- Li, W.; He, J.; Chen, J.; Xie, P. Excretion pattern and dynamics of glutathione detoxification of microcystins in Sprague Dawley rat. Chemosphere 2018, 191, 357–364. [Google Scholar] [CrossRef]
- Wang, Q.; Xie, P.; Chen, J.; Liang, G. Distribution of microcystins in various organs (heart, liver, intestine, gonad, brain, kidney and lung) of Wistar rat via intravenous injection. Toxicon 2008, 52, 721–727. [Google Scholar] [CrossRef]
- Ito, E.; Takai, A.; Kondo, F.; Masui, H.; Imanishi, S.; Harada, K.I. Comparison of protein phosphatase inhibitory activity and apparent toxicity of microcystins and related compounds. Toxicon 2002, 40, 1017–1025. [Google Scholar] [CrossRef]
- Guo, X.; Chen, L.; Chen, J.; Xie, P.; Li, S.; He, J.; Li, W.; Fan, H.; Yu, D.; Zeng, C. Quantitatively evaluating detoxification of the hepatotoxic microcystin-LR through the glutathione (GSH) pathway in SD rats. Environ. Sci. Pollut. Res. 2015, 22, 19273–19284. [Google Scholar] [CrossRef]
- Milutinovic, A.; Sedmak, B.; Horvat-Znidarsic, I.; Suput, D. Renal injuries induced by chronic intoxication with microcystins. Cell. Mol. Biol. Lett. 2002, 7, 139–141. [Google Scholar]
- Hooser, S.B.; Beasley, V.R.; Lovell, R.A.; Carmichael, W.W.; Haschek, W.M. Toxicity of microcystin LR, a cyclic heptapeptide hepatotoxin from Microcystis aeruginosa, to rats and mice. Vet. Pathol. 1989, 26, 246–252. [Google Scholar] [CrossRef]
- Chorus, I.; Bartram, J.; World Health Organization. Toxic Cyanobacteria in Water: A Guide to Their Public Health Consequences, Monitoring and Management; CRC Press: London, UK, 1999; ISBN 0419239308. [Google Scholar]
- Miles, C.O.; Stirling, D. Toxin Mass List, Version 15. Available online: https://www.researchgate.net/publication/316605326_Toxin_mass_list_version_15 (accessed on 1 May 2017). [CrossRef]
- Brown, A.; Foss, A.; Miller, M.A.; Gibson, Q. Detection of cyanotoxins (microcystins/nodularins) in livers from estuarine and coastal bottlenose dolphins (Tursiops truncatus) from Northeast Florida. Harmful Algae 2018, 76, 22–34. [Google Scholar] [CrossRef]
- Foss, A.J.; Aubel, M.T. Using the MMPB technique to confirm microcystin concentrations in water measured by ELISA and HPLC (UV, MS, MS/MS). Toxicon 2015, 104, 91–101. [Google Scholar] [CrossRef]
- Foss, A.J.; Miles, C.O.; Samdal, I.A.; Løvberg, K.E.; Wilkins, A.L.; Rise, F.; Jaabæk, J.A.H.; McGowan, P.C.; Aubel, M.T. Analysis of free and metabolized microcystins in samples following a bird mortality event. Harmful Algae 2018, 80, 117–129. [Google Scholar] [CrossRef]
- Sano, T.; Nohara, K.; Shiraishi, F.; Kaya, K. A method for micro-determination of total microcystin content in waterblooms of cyanobacteria (blue-green algae). Int. J. Environ. Anal. Chem. 1992, 49, 163–170. [Google Scholar] [CrossRef]
- Foss, A.J.; Butt, J.; Fuller, S.; Cieslik, K.; Aubel, M.T.; Wertz, T. Nodularin from benthic freshwater periphyton and implications for trophic transfer. Toxicon 2017, 140, 45–59. [Google Scholar] [CrossRef]
- German, A.J.; Holden, S.L.; Moxham, G.L.; Holmes, K.L.; Hackett, R.M.; Rawlings, J.M. A simple, reliable tool for owners to assess the body condition of their dog or cat. J. Nutr. 2006, 136, 2031S–2033S. [Google Scholar] [CrossRef]
- Florida Department of Environmental Protection Algal Bloom Monitoring and Response. Available online: https://floridadep.gov/AlgalBloom (accessed on 1 June 2019).
- Trevino-Garrison, I.; Dement, J.; Ahmed, F.S.; Haines-Lieber, P.; Langer, T.; Ménager, H.; Neff, J.; Van Der Merwe, D.; Carney, E. Human illnesses and animal deaths associated with freshwater harmful algal blooms—Kansas. Toxins 2015, 7, 353–366. [Google Scholar] [CrossRef]
- Figgatt, M.; Hyde, J.; Dziewulski, D.; Wiegert, E.; Kishbaugh, S.; Zelin, G.; Wilson, L. Harmful Algal Bloom–Associated Illnesses in Humans and Dogs Identified Through a Pilot Surveillance System—New York, 2015. MMWR. Morb. Mortal. Wkly. Rep. 2017, 66, 1182–1184. [Google Scholar] [CrossRef]
- Glibert, P.; Burford, M. Globally Changing Nutrient Loads and Harmful Algal Blooms: Recent Advances, New Paradigms, and Continuing Challenges. Oceanography 2017, 30, 58–69. [Google Scholar] [CrossRef] [Green Version]
- Ndlela, L.L.; Oberholster, P.J.; Van Wyk, J.H.; Cheng, P.H. An overview of cyanobacterial bloom occurrences and research in Africa over the last decade. Harmful Algae 2016, 60, 11–26. [Google Scholar] [CrossRef]
- Paerl, H.W.; Scott, J.T. Throwing fuel on the fire: Synergistic effects of excessive nitrogen inputs and global warming on harmful algal blooms. Environ. Sci. Technol. 2010, 7756–7758. [Google Scholar] [CrossRef]
- Oehrle, S.; Rodriguez-Matos, M.; Cartamil, M.; Zavala, C.; Rein, K.S. Toxin composition of the 2016 Microcystis aeruginosa bloom in the St. Lucie Estuary, Florida. Toxicon 2017, 138, 169–172. [Google Scholar] [CrossRef]
- DeVries, S.E.; Galey, F.D.; Namikoshi, M.; Woo, J.C. Clinical and pathologic findings of blue-green algae (Microcystis aeruginosa) intoxication in a dog. J. Vet. Diagn. Invest. 1993, 5, 403–408. [Google Scholar] [CrossRef]
- Stoner, R.D.; Adams, W.H.; Slatkin, D.N.; Siegelman, H.W. The effects of single L-amino acid substitutions on the lethal potencies of the microcystins. Toxicon 1989, 27, 825–828. [Google Scholar] [CrossRef]
- Spoof, L.; Błaszczyk, A.; Meriluoto, J.; Cegłowska, M.; Mazur-Marzec, H. Structures and activity of new anabaenopeptins produced by Baltic Sea cyanobacteria. Mar. Drugs 2016, 14, 8. [Google Scholar] [CrossRef]
- Elkobi-Peer, S.; Carmeli, S. New prenylated aeruginosin, microphycin, anabaenopeptin and micropeptin analogues from a Microcystis bloom material collected in Kibbutz Kfar Blum, Israel. Mar. Drugs 2015, 13, 2347–2375. [Google Scholar] [CrossRef]
- Creasia, D.A. Acute inhalation toxicity of microcystin-LR with mice. In Proceedings of the Third Pan-American symposium on animal, plant and microbial toxins, Oaxtepec, Morelos State, Mexico -U.S. Army Medical Research Institute of Infectious Diseases, Frederick, MD, USA, 12 January 1990; p. 605. [Google Scholar]
- Wood, S.A.; Dietrich, D.R. Quantitative assessment of aerosolized cyanobacterial toxins at two New Zealand lakes. J. Environ. Monit. 2011, 13, 1617–1624. [Google Scholar] [CrossRef] [Green Version]
- Backer, L.C.; McNeel, S.V.; Barber, T.; Kirkpatrick, B.; Williams, C.; Irvin, M.; Zhou, Y.; Johnson, T.B.; Nierenberg, K.; Aubel, M.; et al. Recreational exposure to microcystins during algal blooms in two California lakes. Toxicon 2010, 55, 909–921. [Google Scholar] [CrossRef]
- Greer, B.; Meneely, J.P.; Elliott, C.T. Uptake and accumulation of Microcystin-LR based on exposure through drinking water: An animal model assessing the human health risk. Sci. Rep. 2018, 8, 4913. [Google Scholar] [CrossRef]
- Ballot, A.; Sandvik, M.; Rundberget, T.; Botha, C.J.; Miles, C.O. Diversity of cyanobacteria and cyanotoxins in Hartbeespoort Dam, South Africa. Mar. Freshw. Res. 2014, 65, 175–189. [Google Scholar] [CrossRef] [Green Version]

| ID | Breed | Age (years) | Sex | Weight (kg) | Date of Exposure | Status |
|---|---|---|---|---|---|---|
| C-SP | Standard Poodle | 9 | Male/N | 23 | 4 September 2018 | Deceased |
| C-GR #1 | Golden Retriever | 6 | Female/S | 32 | 8 September 2018 | Living |
| C-GR #2 | Golden Retriever | 2 | Female/S | 30 | 8 September 2018 | Living |
| C-GR #3 | Golden Retriever | 4 | Female/S | 31 | 1 September 2018 | Living |
| C-Pom | Pomeranian | 2 | Female/S | 2.3 | 26 August 2018 | Living |
| C-Chih | Chihuahua | 6 | Male/N | 5.5 | 26 August 2018 | Living |
| C-LR | Labrador Retriever | <1 | Male | 36 | UE | Living |
| C-GD | Goldendoodle | 10 | Female/S | 34 | UE | Deceased |
| C-CBR | Chesapeake Bay Retriever | 11 | Female | 34 | UE | Living |
| ID: | C-SP | C-GR #1 | C-GR #2 | 1C-GR #3 | C-Pom | 1C-Chih |
|---|---|---|---|---|---|---|
| Vomiting: | Yes | Yes | Yes | Yes | Yes | Yes |
| Melena: | Yes | No | No | Yes | Yes | No |
| Tachycardia: | Yes | No | No | Yes | No | Yes |
| Body cavity effusion: | Yes | Yes | No | Yes | Yes | Unknown |
| APTT/PT: | >DL | >DL | Normal | >DL | >DL | 128/17 |
| Thrombocytopenia: | 12K | 15K | 60K | 69K | 24K | 77K |
| Bilirubin (mg/dL): | 2.1 | 15 | 0.1 | 3.1 | 2.2 | 7.2 |
| ALT (U/L): | >DL | 10K | 1889 | 3294 | 5287 | >DL |
| Blood Glucose (mg/dL): | 26 | 74 | 97 | 66 | 27 | 120 |
| ID | # Days PE | Specimen | Total Adda MCs (MMPB) | Spike Return | Adda ELISA | Spike Return | MC-LR | Spike Return |
|---|---|---|---|---|---|---|---|---|
| C-SP | 2 | Liver | 530 | 21% | 260 ± 78 | 193% | 7.2 ± 1.5 | 97% |
| 2 | Kidney | 2800 | 12% | 1100 ± 460 | 106% | 20 ± 7.2 | 63% | |
| 2 | Heart Blood | 73 | 9% | 85 ± 28 | 146% | 1.7 ± 0.0 | 68% | |
| 2 | Bile | 5400 ± 750 | 72% | 7500 ± 3200 | 211% | 65 ± 26 | 78% | |
| 2 | Urine | 41,000 | 79% | 42,000 ± 4000 | 143% | 670 | 57% | |
| C-GR #1 | 1 | Blood | 50 | 27% | ― | ― | ― | ― |
| 1 | Urine | 32,000 ± 1600 | 42% | 22,000 ± 4500 | 197% | 110 ± 26 | ― | |
| 11 | Urine | 4.4 | 65% | ― | ― | ― | ― | |
| 24 | Urine | 2.6 ± 1.0 | 35% | ― | ― | ― | ― | |
| 68 | Urine | 0.6 ± 0.0 | 22% | ― | ― | ― | ― | |
| 72 | Hair | 180 ± 19 | 4% | < 30 | 0% | < 30 | 111% | |
| C-GR #2 | 1 | Blood | 70 | 74% | 33 | ― | < 1.0 | ― |
| 0 | Vomit | 46,000 ± 8000 | 114% | 25,000 ± 1800 | 14,000 ± 1700 | |||
| 10 | Urine | 0.6 ± 0.3 | 72% | ― | ― | ― | ― | |
| 24 | Urine | < 0.2 | 36% | ― | ― | ― | ― | |
| C-Pom | 25 | Blood | < 0.2 | 8% | ― | ― | ― | ― |
| 23 | Urine | 2.6 | 37% | ― | ― | ― | ― | |
| 37 | Urine | 0.21 | 26% | ― | ― | ― | ― | |
| 85 | Urine | < 0.2 | 11% | ― | ― | ― | ― | |
| C-CBR | UE | Hair | < 20 | 4% | < 30 | 133% | < 30 | 108% |
| C-GD | UE | Liver | < 4.0 | 7% | 522 | 33% | < 5 | 108% |
| C-LR | UE | Urine | < 0.2 | 36% | < 15 | 107% | < 2 | 79% |
| C-LR | UE | Blood | < 0.2 | 3% | < 15 | 92% | < 2 | 83% |
| Specimen | Total Adda MCs (MMPB) | Adda ELISA | MC-LR (LC-MS/MS) |
|---|---|---|---|
| Liver (ng g−1) | 4.0 | 15 | 5.0 |
| Kidney (ng g−1) | 4.0 | 15 | 5.0 |
| Bile | 50 | 15 | 50 |
| Blood | 0.2 | 15 | 2.0 |
| Urine | 0.2 | 15 | 2.0 |
| Hair (ng g−1) | 20 | 30 | 30 |
© 2019 by the authors. Licensee MDPI, Basel, Switzerland. This article is an open access article distributed under the terms and conditions of the Creative Commons Attribution (CC BY) license (http://creativecommons.org/licenses/by/4.0/).
Share and Cite
Foss, A.J.; Aubel, M.T.; Gallagher, B.; Mettee, N.; Miller, A.; Fogelson, S.B. Diagnosing Microcystin Intoxication of Canines: Clinicopathological Indications, Pathological Characteristics, and Analytical Detection in Postmortem and Antemortem Samples. Toxins 2019, 11, 456. https://doi.org/10.3390/toxins11080456
Foss AJ, Aubel MT, Gallagher B, Mettee N, Miller A, Fogelson SB. Diagnosing Microcystin Intoxication of Canines: Clinicopathological Indications, Pathological Characteristics, and Analytical Detection in Postmortem and Antemortem Samples. Toxins. 2019; 11(8):456. https://doi.org/10.3390/toxins11080456
Chicago/Turabian StyleFoss, Amanda J., Mark T. Aubel, Brandi Gallagher, Nancy Mettee, Amanda Miller, and Susan B. Fogelson. 2019. "Diagnosing Microcystin Intoxication of Canines: Clinicopathological Indications, Pathological Characteristics, and Analytical Detection in Postmortem and Antemortem Samples" Toxins 11, no. 8: 456. https://doi.org/10.3390/toxins11080456