Article

Characterization of Cyanophages in Lake Erie: Interaction Mechanisms and Structural Damage of Toxic Cyanobacteria

1
Department of Food Science and Technology, The Ohio State University, Columbus, OH 43210, USA
2
Department of Mechanical and Aerospace Engineering, The Ohio State University, Columbus, OH 43210, USA
3
College of Public Health, Division of Environmental Health Sciences, The Ohio State University, Columbus, OH 43210, USA
*
Author to whom correspondence should be addressed.
Toxins 2019, 11(8), 444; https://doi.org/10.3390/toxins11080444
Submission received: 30 May 2019 / Revised: 11 July 2019 / Accepted: 23 July 2019 / Published: 26 July 2019
(This article belongs to the Collection Freshwater HABs and Health in a Changing World)

Abstract

:
Cyanophages are abundant in aquatic environments and play a critical role in bloom dynamics, including regulation of cyanobacteria growth and photosynthesis. In this study, cyanophages from western Lake Erie water samples were screened for lytic activity against the host cell (Microcystis aeruginosa), which also originated from Lake Erie, and identified with real-time sequencing (Nanopore sequencing). M. aeruginosa was mixed with the cyanophages and their dynamic interactions were examined over two weeks using atomic force microscopy (AFM) as well as transmission electron microscopy (TEM), qPCR, phycocyanin and chlorophyll-a production, and optical absorbance measurements. The TEM images revealed a short-tailed virus (Podoviridae) in 300 nm size with unique capsid, knob-like proteins. The psbA gene and one knob-like protein gene, gp58, were identified by PCR. The AFM showed a reduction of mechanical stiffness in the host cell membranes over time after infection, before structural damage became visible. Significant inhibition of the host growth and photosynthesis was observed from the measurements of phycocyanin and chlorophyll-a concentrations. The results provide an insight into cyanobacteria–cyanophage interactions in bloom dynamics and a potential application of cyanophages for bloom control in specific situations.
Key Contribution: This is the first study to report that Podoviridae destroys toxin-producing cyanobacteria from Lake Erie. Atomic force microscopy results discovered the damage in mechanical stiffness of Microcystis by the cyanophage infection.

Graphical Abstract

1. Introduction

Cyanobacterial blooms in freshwater have been a growing concern not only in the United States but also globally, with increasing frequency, duration, and intensity [1]. They pose a great threat for environmental and public health because of toxic compounds released from the blooms, and cause significant economic loss for those bloom-affected areas [2,3,4,5]. These toxins, such as microcystins, saxitoxins, nodularins and cylindrospermopsin, are widely distributed across the world and are difficult to remove [3]. Previous studies focused on controlling blooms in many ways, including applying various chemicals [6,7] and controlling eutrophication of waterbodies [8,9]. However, more specific and targeted approach is needed for controlling toxic blooms without adding more chemicals.
Cyanophages are viruses that infect cyanobacteria as their host. Similar to other bacteriophages, cyanophages can alter the metabolism and the replication of their hosts, then further influencing the structure of the cyanobacterial community [10,11,12]. The succession of toxic Microcystis aeruginosa, one of the most commonly found toxic cyanobacteria in freshwater, is affected by the abundance of its cyanophages, indicating that cyanophages may play a critical role in bloom formation dynamics [13,14,15]. Therefore, cyanophages were considered as a potential biological control of cyanobacterial blooms [16,17]. Bacteriophages are promising for controlling bacterial infections, with great advantages of its host specificity. Instead of using chemicals, such as antibiotics, bacteriophages would minimize the side effect of disturbing other natural microbiota [18,19].
While most freshwater cyanophages are known as tailed Myoviridae (with a long contractile tail), Podoviridae (short non-contractile tail), Siphoviridae (long non-contractile tail), and tail-less phages have been also reported [20,21,22,23,24,25]. Current PCR-based diagnoses of cyanophages are mostly targeting structural genes of Myoviridae, such as capsid protein gene (g20) and tail sheath protein (g91) [15,26,27,28,29]. The presence and abundance of other cyanophage families in environments are still highly underestimated [29]. In addition, active gene exchanges between cyanophages and their hosts make it more difficult to find a quantitative target.
At a morphological level, the development of microscopy with high-resolution, three-dimensional imaging, such as atomic force microscopy (AFM), enables a more accurate description of host–phage interactions. Previous studies described the application of AFM as a versatile tool to explore phage infections from a morphological to a molecular scale [30,31]. To achieve high sensitivity on soft cyanobacteria samples, AFM’s tapping mode was performed. For this, an AFM probe, consisting of a micro-cantilever with a nanometer scale tip, was driven to oscillate at/or near its resonance frequency and gently tap the sample surface that was characterized. Then the amplitude and phase of oscillations were changed by the tip–sample interactions, which were measured by a laser detection system. The recorded change in amplitude provides the morphology of the sample, while the change of phase reveals the compositional variations. It has recently been applied for observing viruses, including cyanophages [31,32].
The main objectives of this study were to: (1) characterize lytic cyanophages isolated from Lake Erie, both morphologically and genetically; and (2) examine the host (M. aeruginosa) and cyanophage interactions using multiple tools, including signature gene screening, photopigment measurements, transmission electron microscopy (TEM), and AFM. Thus, we aimed to gain insights into potential use of cyanophages for controlling toxic cyanobacteria proliferation under applicable situations.

2. Results and Discussion

2.1. Screening of Lytic Cyanophages

Water samples from western Lake Erie were collected from May to August 2015 and were screened for cyanophages. Among the samples, the cyanophage with the highest lytic activities against M. aeruginosa was selected. It was named as Ma-LEP, which indicates its host strain (Microcystis aeruginosa, Ma), origin (Lake Erie, LE) and taxonomic family (Podoviridae, see below for more details). The host, Microcystis aeruginosa, was also isolated from Lake Erie and confirmed with PCR by targeting PC-IGS and toxin-producing genes (mcyA, and mcyE), and identified with real-time sequencing technique (MinION, Oxford Nanopore Technologies) (Figure S1).

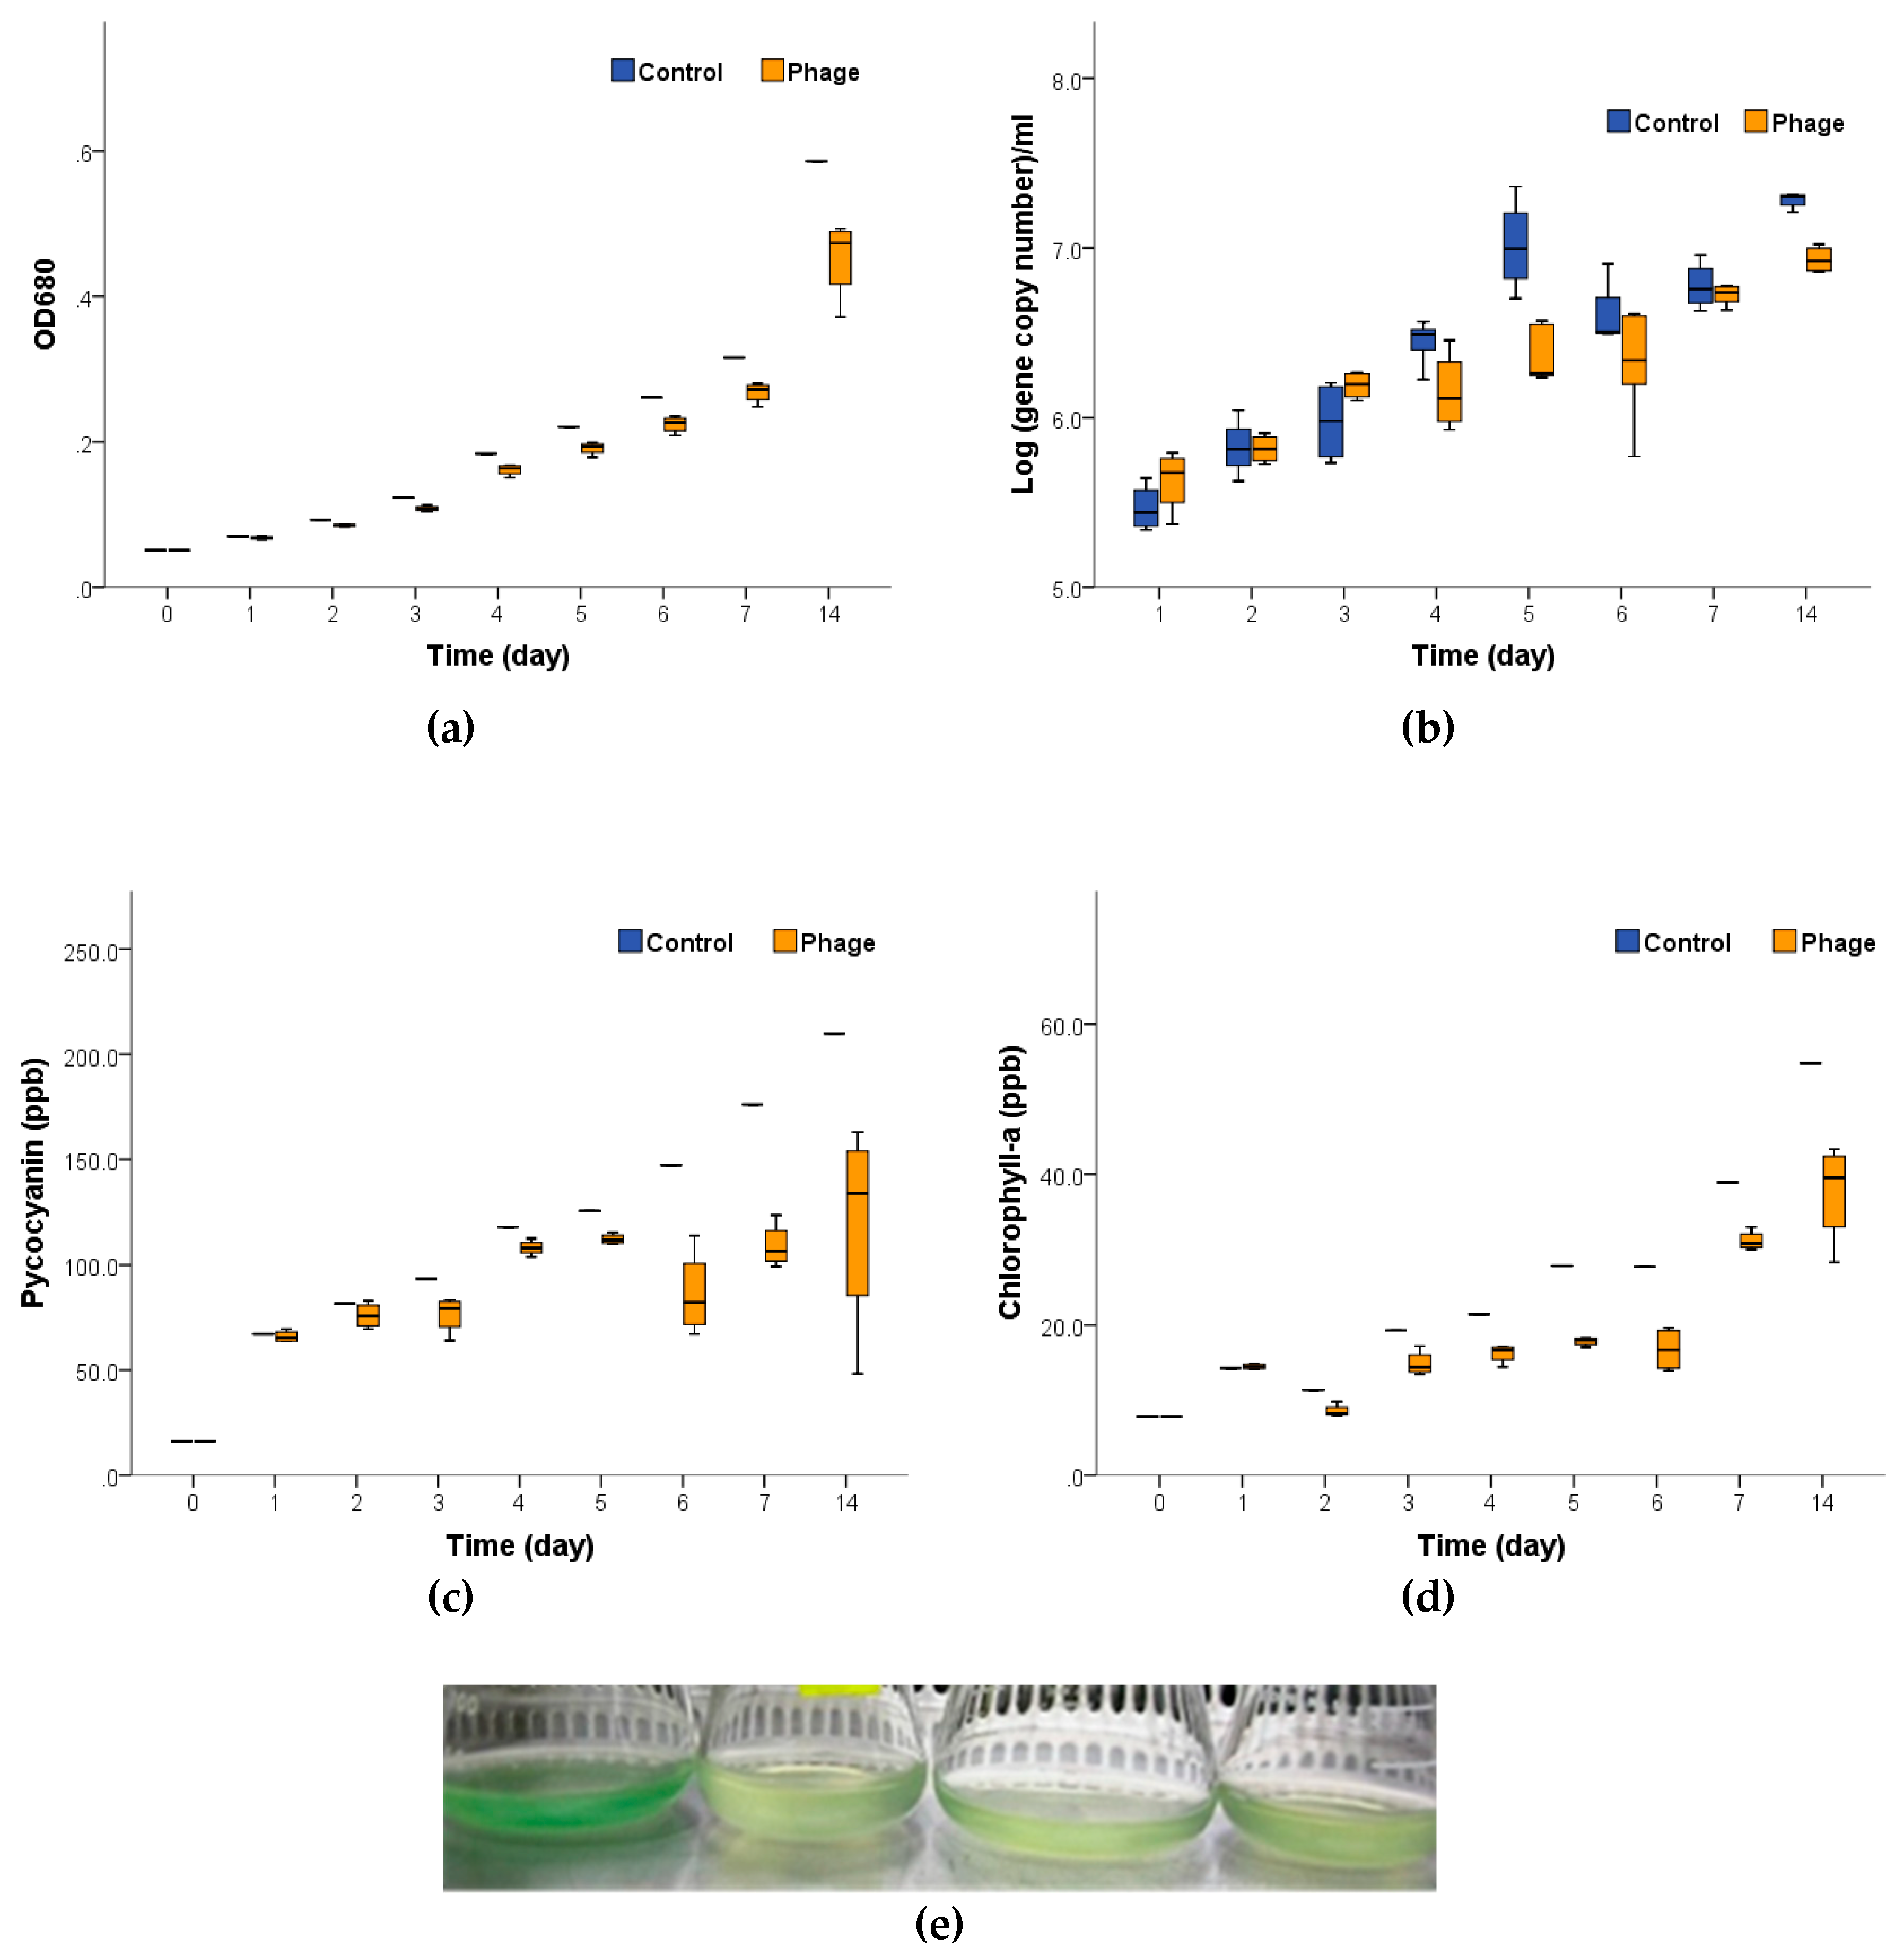
2.2. The Effects of Ma-LEP Infection on Microcystis aeruginosa

To examine effects of lytic cyanophage Ma-LEP on M. aeruginosa (host), dynamic change of host population was measured with multiple parameters; OD (680 nm), two important photosynthetic pigments (phycocyanin and chlorophyll-a) and targeted gene of M. aeruginosa (mcyE). Figure 1 shows the dynamic changes of these parameters over time after phage infections. Table 1 summarizes the growth of pigment production rate (slope) and the correlation coefficient (R2) of each parameter when fitting the raw data of Figure 1 in linear models (for mcyE gene, data from day 0 to day 5 had a strong fit of the linear regression).
Ma-LEP impaired the growth and photosynthesis of M. aeruginosa significantly when compared with the control group (M. aeruginosa host inoculated with autoclaved cyanophage), indicating that Ma-LEP can slow down or reduce bloom intensity. The phage-infected M. aeruginosa showed a significant decrease (p < 0.01) in their growth rates (OD at 680 nm, Figure 1a). The qPCR results (Figure 1b) showed the mcyE gene concentration (microcystin-producing M. aeruginosa abundance) was reduced at days 4, 5, and 14 (p < 0.05). Noteworthy, the extracellular DNA from lysed cells was also contributing to the total DNA copy counts; therefore, using qPCR might have overestimated the host count, especially in the cyanophage group. Meanwhile, the production of the photosynthetic pigments, phycocyanin, and chlorophyll-a, was significantly reduced (p < 0.01) after Ma-LEP infection, possibly due to the cell lysis or suppression of related genes by cyanophages (Figure 1c,d). For more accurate measurements of M. aerguginosa’s photosynthetic activities, amount of carbon fixed, and oxygen production per unit time should be measured.
In addition, Ma-LEP also showed lysogenic activity during continuous culturing under lab conditions when appropriate dose of UV light was applied. It was found that 23.58 mJ/cm2 of UV intensity was sufficient for the cyanophage to activate cell lysis (Figure S2; Table S1).
Since the toxin concentrations were the sum of both free (released from dead cells) and particulate (from intact cells) toxins within the confined flasks, no statistical significance was observed in microcystin concentrations between the two groups (phage treated vs. control) during the one-week period (Figure S3).
AFM is an emerging technique in biological studies, including cells, viruses, and biological molecules (DNA, protein, etc.) [1,2,3,4,5]. In this study, AFM images provided an in-depth view of the physical changes of infected host. To better visualize the host–phage interaction over time, an air tapping mode of AFM was used. It applied a fine tip to the object surface and monitored the frequency change of the tip when it interacted with different shapes, material, etc. The height images (the left column in Figure 2 provides morphological information of the cyanobacterial hosts) and the phase images (the right column in Figure 2) show the changes in stiffness of the targeted objects (M. aeruginosa). The changes from both images revealed the structural damages of M. aeruginosa cells after the cyanophage Ma-LEP infection. Initially, the M. aeruginosa was observed in a clear circular shape about 2 μm tall in contrast to the background (mica, in this case), indicating the intactness of host cells (Figure 2a). Following cyanophage infection, cells became irregular and started to shrink and break down, while the height was reduced to 0.8 and 0.4 μm (Figure 2b,c, only one representative cell was shown in Figure 2) and, finally resulted in the rupture of the entire cell. Actually, the tapping mode can achieve resolution down to several nanometers without damaging the samples (either during sample preparation or imaging steps), allowing repeated observations and flexible applications [6]. Therefore, AFM air tapping modes can be used repeatedly to further observe viral topology (e.g., the arrangement of the “knob-like protein” on Ma-LEP capsids). AFM also enables observation of biological specimens in fluid, which can maintain the bioactivity of samples and allows more vivid visualization [1]. This method allows capturing the cellular changes of hosts at lytic cycle in vivo, which may provide more information on host–phage interactions and mechanisms of interests in future studies.
The interpretation of phase images requires a detailed understanding about the cantilever dynamics depending on the AFM tip–sample interactions. When the AFM tip hovers over a sample instead of indenting it due to relatively high attractive forces (so-called attraction-dominant regime), the phase becomes larger than 90°. In the phase map of Figure 2a, the perimeter of the cyanobacteria showing the bright color over 90° indicates that the tip experiences a strong attractive force. We conjecture this strong attraction was caused by large surface tension of the cyanobacteria owing to its intact, spherical shape. When the AFM tip gently indents the surface at every tapping cycle (so-called repulsion-dominant regime), the phase is maintained to be less than 90°. Within this regime, phase is known to be sensitive to the viscoelastic stiffness of the surface: the increase in phase qualitatively indicates that the mechanical stiffness is reduced. Comparing the phase values within the repulsive dominant regime where phase is less than 90°, one can see that the stiffness of the cyanobacteria is reduced with the phage infection.

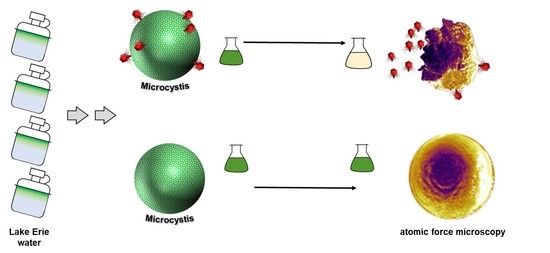
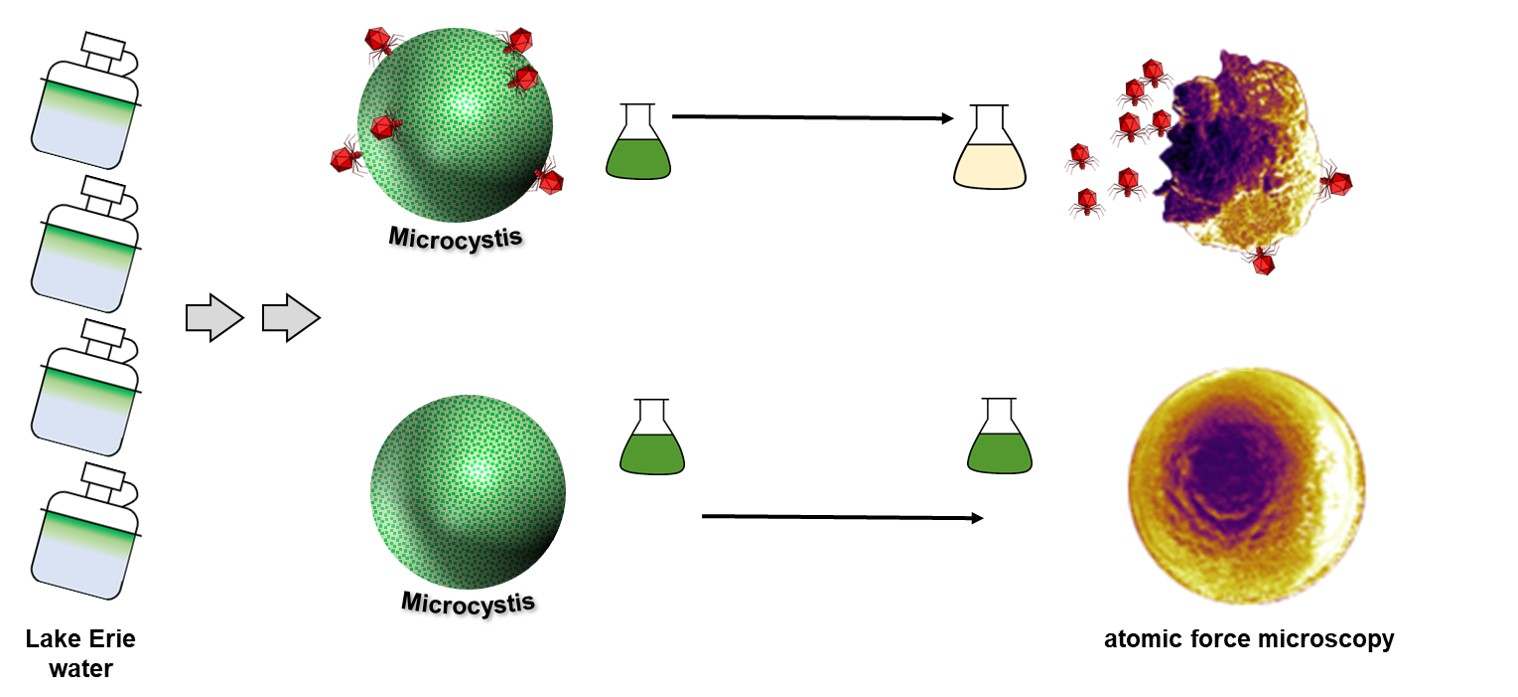
2.3. Morphology of Ma-LEP

Ma-LEP was taken for TEM imaging to visualize structure of Ma-LEP (Figure 3). Multiple short-tailed viruses (~300 nm) were observed (Figure 3a). Interestingly, the structure of capsids (Figure 3c) looked similar to the knob-like proteins found in marine phage Syn5 [7], leading to a deeper investigation of this novel structure (see more details in Section 2.4).

2.4. Genetic Characterization

For genetic characterization of the isolated cyanophage, multiple signature genes from previous studies were tested (Table S2) and only one photosynthesis-related gene was present. The core gene psbA, originated from the cyanobacteria photosystem II core protein D1, was detected by PCR and yielded a 582-base pair (bp) gene fragment (accession #: MK765681). The sequence showed 79% identities with the one in Synechococcus (a major marine cyanobacteria genera, but also inhabits in freshwater) cyanophage, which suggests a potential common host range (Figure 4). One potential hypothesis is that cyanophages may take advantage of their own replications by regulating photosynthetic capacity of the hosts [12,33,34,35]. It was also reported that the psb gene serves to protect host cells from light stress, which induces excessive oxidative species and damages to the photosynthetic complex [36]. In addition, through gene transfer from host to phages, the psbA gene may be shared by various cyanophages and can serve as a ubiquitous indicator of co-evolution [29,37]. Interestingly, the freshwater cyanophage Ma-LMM01 isolated in Japan does not have psb gene [24], but contains a phycobilisome (a major photosynthesis complex, especially in Synechococcus) degradation gene (nblA). Other freshwater tail-less cyanophages were also known to carry the nblA [20,21]. However, nblA gene was absent in our cyanophage Ma-LEP (data not shown).
As TEM images showed, a “knob-like protein”, a unique structure of capsid protein in cyanophage Syn5, seemed to be present on Ma-LEP’s capsid [7,8]. This special protein may be a stabilizer for viral capsids. Instead of “sewing” the capsomere together as stabilizing proteins in other viruses do, it displays a distinctive diagonal positioning on the hexametric capsomeres of mature Syn5 capsid and “breaks” the symmetric structure of viral capsids [7]. Three potential genes (gp55, gp57, gp58) encoding this protein were identified and sequenced, but there have been no additional reports of its presence in other cyanophages. In this study, using self-designed gp58 primers yielded a ~300bp-fragnent, which is similar to the gp58 of Syn5 [9] (100% identities; accession number: MK765680). This result further confirmed the presence of this novel protein and similar evolutionary roots of the two cyanophages. It can be predicted that the cyanophage Ma-LEP may possess similar arrangements of capsid proteins, but additional details are needed using more advanced imaging techniques. However, no phylogenic tree can be created due to its rare presence.
In summary, this is the first study to utilize the phase image data from AFM and to visualize the changing mechanical stiffness of M. aeruginosa membranes after cyanophage infection. The short-tailed cyanophage, named as Ma-LEP, from Lake Erie can infect bloom-forming toxic cyanobacteria, Microcystis aeruginosa, and negatively affect the host’s photosynthesis and growth. Ma-LEP contains two signature genes, psbA and gp58, but more genome data is needed in a future study. The results from this study provide an insight into Microcystis-cyanophage interactions in bloom dynamics and a potential application of cyanophage for bloom control in adequate settings.

3. Materials and Methods

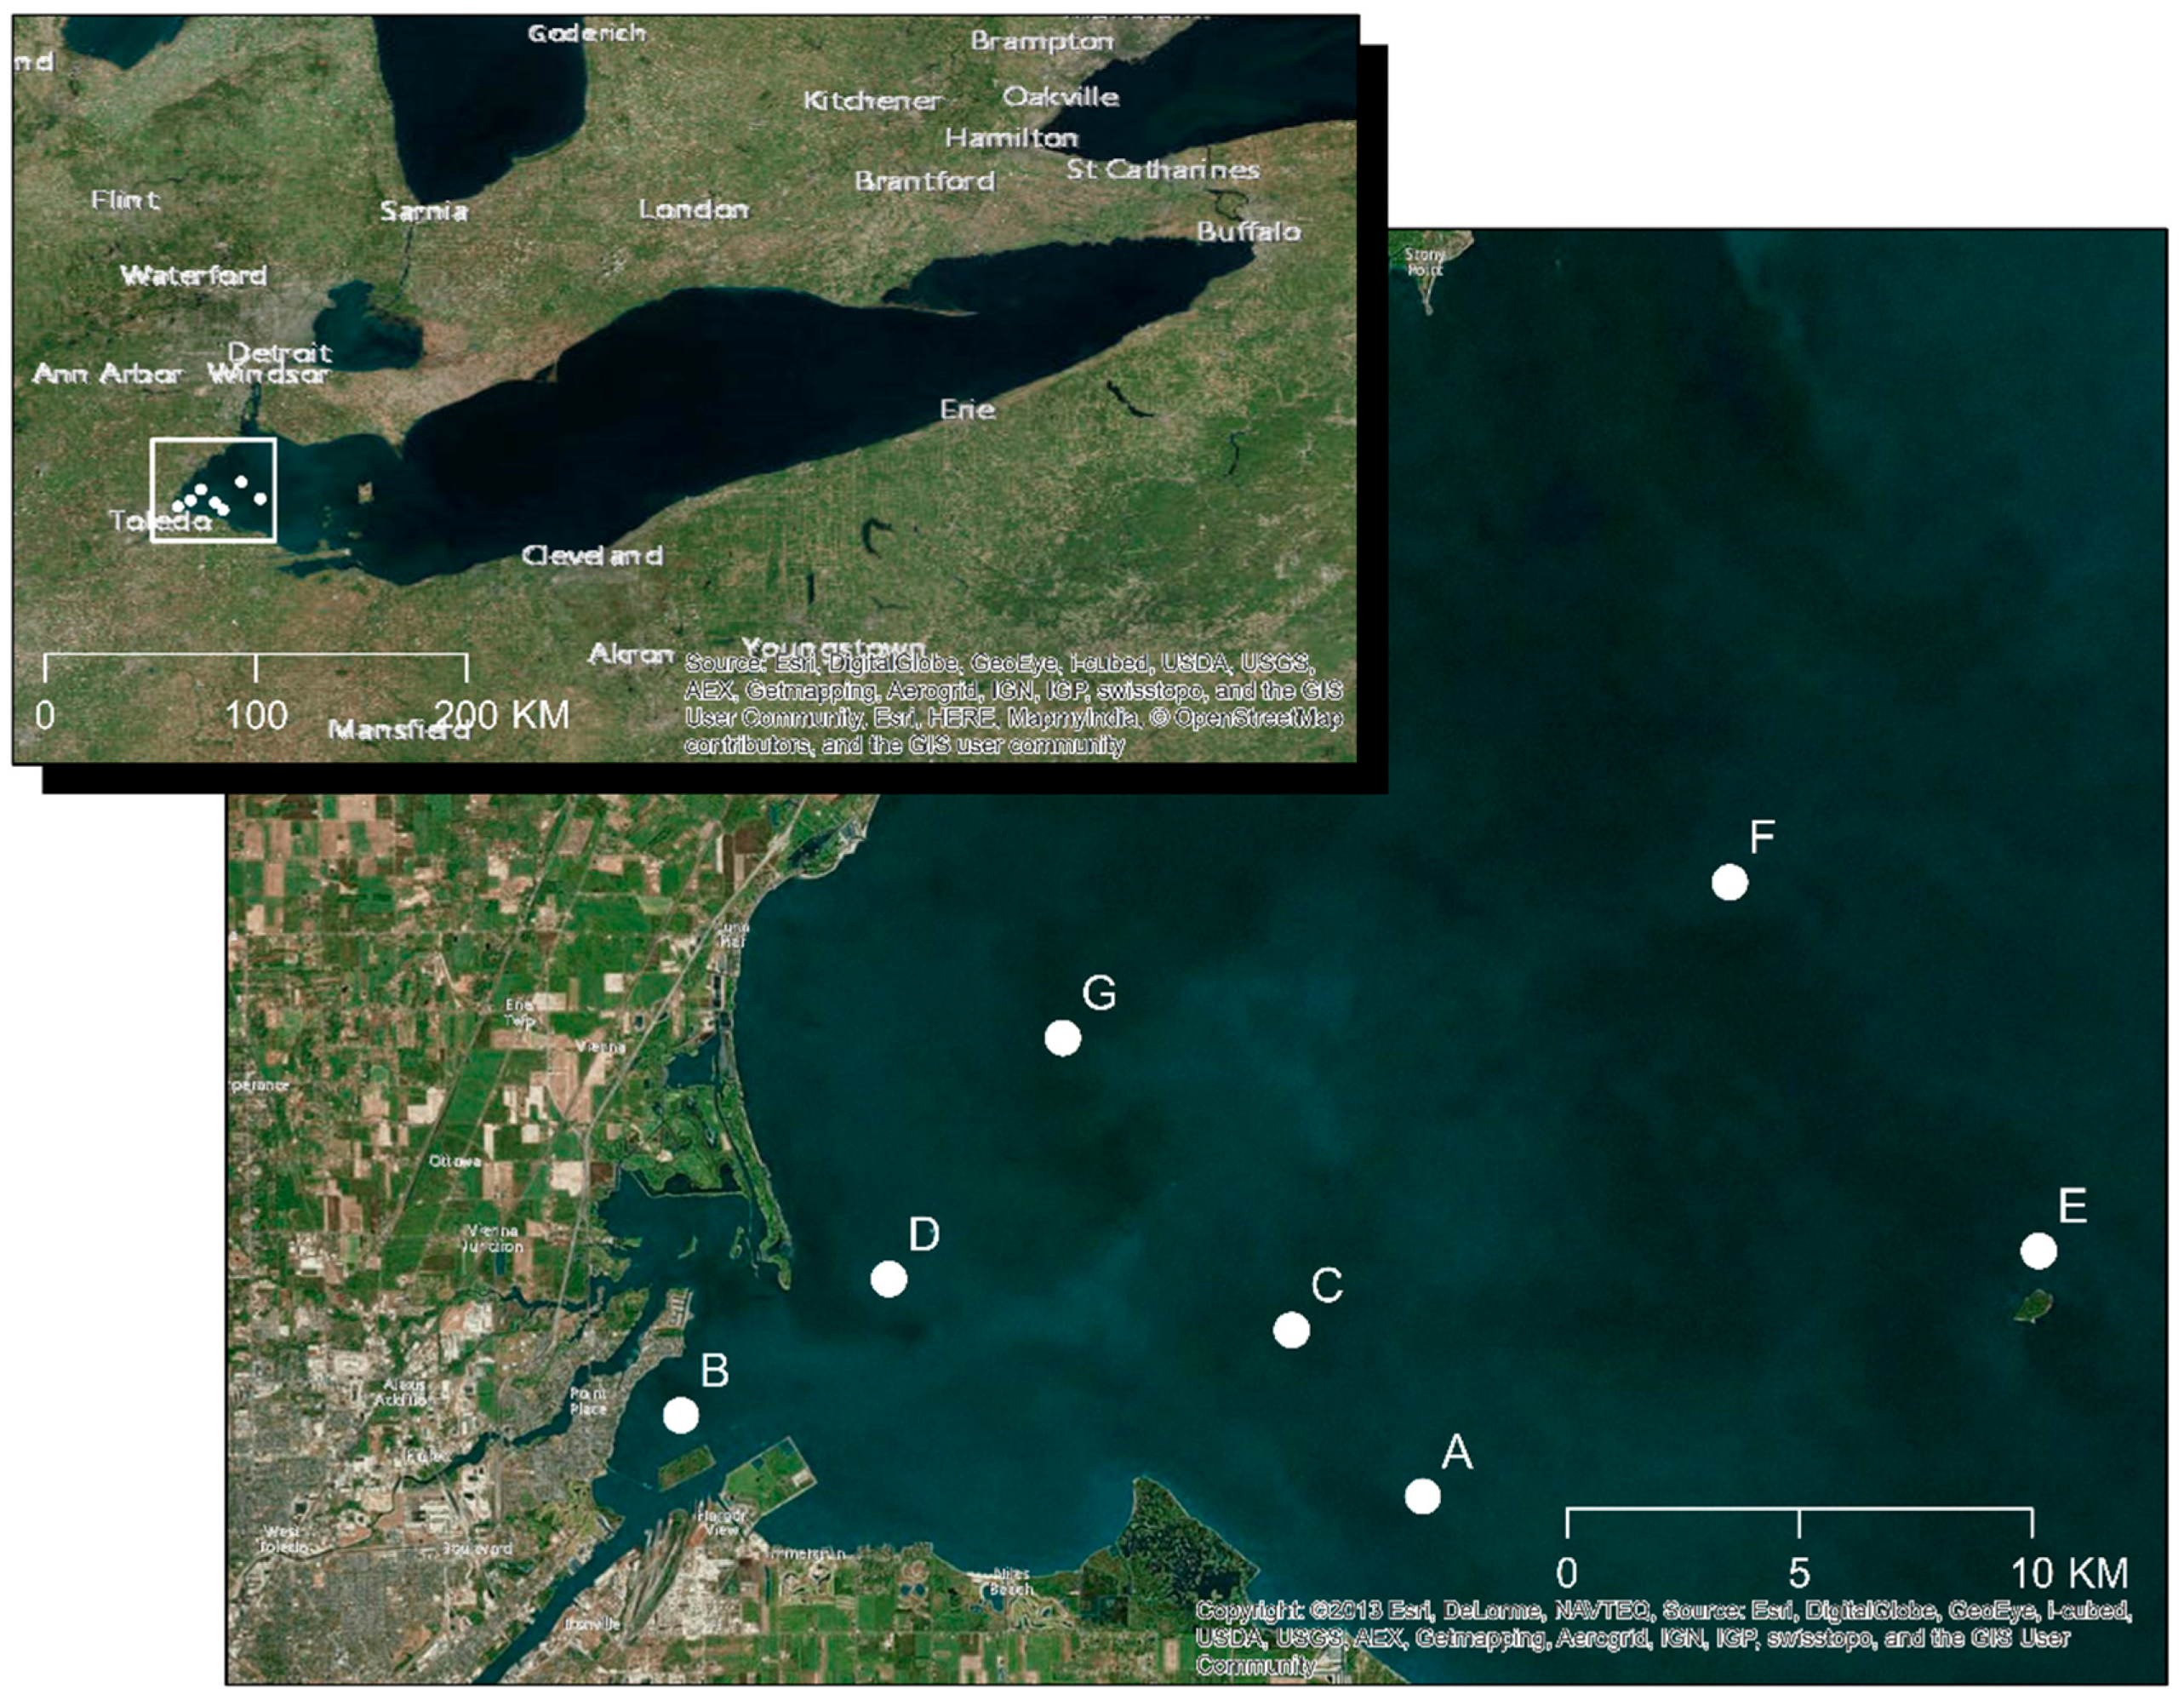
3.1. Water Sample Collection, Concentration, and Screening of Lytic Cyanophages

Water samples were collected from western Lake Erie from 2013 to 2015 at seven different locations (Figure 5). The map was created using ArcGIS for Desktop 10.2 (Esri, Redlands CA, USA). Viruses in water samples were collected and concentrated using cation-coated filter methods [38]. Briefly, 500 mL of water was passed through an Al3+-coated 0.45µm filters (EMD Millipore Filter, SIGMA-ALDRICH Co., St Louis, MO, USA), and viruses captured by the filter were eluted into 10 mL of 1.0 mM NaOH (pH = 10.8) after rinsing with 200 mL of 0.5 mM H2SO4 (pH 3.0). The eluate was neutralized with 100 μL of 50 mM H2SO4 (pH 1.0) in 10 mL of 1× Tris-EDTA buffer (pH 8.0), and concentrated by centrifugation at 3000 g for 10 min (twice) using a Centriprep™ YM-50 Filter (4310 centrifugal concentrator regenerated cellulose 50 kDa NMWL, EMD Millipore, Billerica, MA, USA). Fifty microliters of each concentrate were inoculated into an optimized well-assay containing 100 μL of Microcystis aeruginosa culture, which was originally isolated from Lake Erie (see below section), and then incubated at room temperature with a 12 h light cycle for 2 days to screen for lytic cyanophages by measuring the OD at 680 nm.

3.2. Host Bacteria: Microcystis aeruginosa

M. aeruginosa was isolated from Lake Erie using BG-11and CT media with agarose method [39]. M. aeruginosa was first identified by targeting PC-IGS (phycocyanin intergenic spacer) and microcystin-producing mcyA and mcyE genes [40]. Furthermore, M. aeruginosa was identified by following Nanopore’s protocol (1D genomic DNA by ligation protocol). For that, ligation sequencing kit 1D (SQK-LSK108, Oxford Nanopore Technologies, Oxford, UK) was used and then real-time sequencing technique, MinION (Oxford Nanopore Technologies, Oxford, UK) [41,42] was used. Briefly, bacterial DNA was extracted with QIAamp genomic DNA kit (Qiagen, Valencia, CA, USA). Concentration of the extracted DNA (~1 µg) was measured with Qubit 3.0 fluorimeter (Thermo Fischer Scientific, Waltham, MA, USA). For fragmented DNA repair and end-repaired DNA, NEBNext FFPE repair Mix and NEBNext End repair/dA-tailing Module (New England BioLabs Inc., Ipswich, MA, USA) was used, respectively. After DNA purification with AMPure XP beads (Beckman Coulter, Brea, CA, USA), the sample was loaded on the SpotON flow cell (Oxford Nanopore Technologies, Oxford, UK). A 72 h sequencing protocol was applied using the Nanopore sequencing software, MinKNOW (v1.10.23, 2017, Oxford Nanopore Technologies, Oxford, UK), in order to collect electronic signal data. Oxford Nanopore Technologies provides a bioinformatics tool, which is a cloud-based EPI2MEAgent platform. Figure S1 shows the identification result of the M. aeruginosa from Lake Erie.

3.3. The Effects of Cyanophage Infections on Microcystis aeruginosa

Cyanophage concentrates (four independent sets) or autoclaved cyanophage concentrates (as a control) were inoculated into a Microcystis aeruginosa culture (host) at a ratio of 1:100 by volume, then incubated at room temperature with a 12 h light cycle for 2 weeks. The optical density at 680 nm, and concentrations of phycocyanin and chlorophyll-a were measured to monitor the dynamic changes of the host, using a spectrophotometer (4001/4 Spectronic Unicam, Moyer Instruments, Inc. Tamaqua, PA, USA) or an AquaFluor Handheld Fluorometer (8000-010 Turner designs, San Jose, CA, USA) with units of phycocyanin and in vivo chlorophyll-a (details can be found at http://www.turnerdesigns.com/t2/doc/spec-guides/998-8081.pdf) [43]. DNA of Microcystis aeruginosa was extracted using ZR fungal/bacteria DNA MicroPrep™ Kit (Zymo Research Corp, Irvine, CA, USA) following the manufacturer’s instruction. The quantification of the toxin-producing Microcystis by targeting mcyE was performed using CFX96 TouchTM Real-time PCR Detection System (Bio-Rad, Hercules, CA, USA) in duplicate (Table S2). The total volume of PCR reaction was 20 μL containing 2 μL extracted DNA, 0.5 μM of each primer, 0.125 mM probe, 10 uL of TaqMan® Universal PCR Master Mix II (ThermoFisher Scientific, Grand Island, NY, USA). The microcystins were measured by Abraxis microcystins/nodularins-ADDA ELISA kit (Abraxis LLC, Warminster, PA, USA) following EPA method 546 [44].

3.4. Atomic Force Microscopy

Gelatin-coated mica (gelatin from porcine skin, Sigma, CAS# 9000-70-8, St. Louis, MO, USA; PELCO® mica sheet, Ted Pella Inc., Redding, CA, USA) was prepared as previous research described [45]. One mL of cyanophage propagation from Method 3.5 was centrifuged at 2320× g for 2 min (Eppendorf centrifuge 5415R with F45-24-11 rotor, Hauppauge, NY, USA), and the supernatant was discarded. The pellet was mixed with 10 µL of 2.5% of Glutaraldehyde to fix overnight at 4 °C, which was then applied on the gelatin-coated mica, using a pipette tip and rested for 10 min. The mica slides were washed by sterilized deionized water to remove extra propagation material and dried at aseptic atmosphere for imaging. Imaging was performed in tapping mode of a commercial AFM (MFP-3D infinity from Asylum Research) equipped with silicon cantilever (natural frequency ~70 kHz, spring constant ~2 N/m, AC240 from Asylum Research).

3.5. TEM

Ten microliters of the cyanophage propagation was mixed with 10 μL of 5% of Glutaraldehyde to fix the samples. Carbon/Formvar-coated copper grids were glow discharged in a PELCO easiGlow™ discharge unit. Ten µl of drop sample were incubated on the grid for 5 min, and then incubated with a drop of 1% uranyl acetate for 30 s after removing excess sample. Grids were imaged in a FEI Tecnai™ G2 Biotwin TEM (ThermoFisher Scientific, Hillsboro, Oregon, USA) at 80 kEV and images captured using an AMT camera and software (R5.6, 2017, Thermo Fisher Scientific, Woburn, MA, USA).

3.6. Targeting Viral Genes Using PCR

The viral DNAs from cyanophage concentrates were extracted using PowerViral Environmental DNA Isolation Kit (MO BIO, San Diego, CA, USA). Primers of gp55, gp57 and gp58 (knob-like protein genes) were generated from sequences of corresponding genes using NCBI Primer Blast [38,39]. Other PCR primers, including psbA, and PCR conditions were described in Table S1. PCR amplicon were checked by 2% agarose gel at 50 V for 30 min and purified by QIAquick PCR Purification Kit (Qiagen, Germantown, MD, USA) following manufacturer’s instruction. Sequencing was performed by BigDye® Terminator Cycle Sequencing combined with 3730 DNA Analyzer (ThermoFisher Scientific, Grand Island, NY, USA) and identified by NCBI BLASTn [40]. The phylogenic analyses of cyanophage Ma-LEP based on the sequence of psbA gene (accession number: MK765681) was carried out using a software from the PhyML program, which is available at www.phylogeny.fr [45,46,47,48,49].

3.7. Statistical Analysis

Data were fitted into a linear regression model using SPSS Statistics for Windows, Version 24.0 (2017, IBM, Armonk, NY, USA).

Supplementary Materials

The following are available online at https://www.mdpi.com/2072-6651/11/8/444/s1, Figure S1: Taxonomy tree at the genus level and classification of Microcystis with read numbers. Figure S2: Induction of lysogenic cyanophage Ma-LEP by UV irradiation. Figure S3: Microcystin concentrations with or without lysogenic cyanophage Ma-LEP infection (no significant difference). Table S1: Pigment production and growth of M. aeruginosa with or without lysogenic Cyanophage Ma-LEP infection after UV irradiation as a function of time in a linear model. Table S2: PCR conditions and primer sequences used in this study (Reference [50] is cited in the Supplementary Materials).

Author Contributions

Conceptualization, J.L.; methodology, X.J., H.C., T.G. and J.L.; validation, X.J. and S.L.; formal analysis, X.J.; investigation, X.J., C.H., S.L., J.K. and T.G.; data curation, X.J., C.H., J.L. and H.C.; resources, J.L. and H.C.; writing—original draft preparation, X.J.; writing—review and editing, J.L., S.L., H.C., C.H., and T.G.; visualization, C.H., J.K., X.J., S.L. and T.G.; supervision, J.L.; project administration, J.L.; funding acquisition, J.L.

Funding

This study is funded by Ohio Department of Higher Education and partially funded by US EPA STAR grant (83519201).

Acknowledgments

The help from Thomas Bridgeman, Brenda Snyder, and George Bullerjahn for providing Lake Erie water samples, and Takashi Yoshida for providing positive control DNA of g91 and cyanophage, is greatly appreciated.

Conflicts of Interest

The funders had no role in study design, data collection, and interpretation, or the decision to submit the work for publication.

References

  1. Davis, T.W.; Gobler, C.J. Preface for Special Issue on “Global expansion of harmful cyanobacterial blooms: Diversity, ecology, causes, and controls”. Harmful Algae 2016, 54, 1–3. [Google Scholar] [CrossRef] [PubMed]
  2. Hoagland, P.; Anderson, D.M.; Kaoru, Y.; White, A.W. The economic effects of harmful algal blooms in the United States: Estimates, assessment issues, and information needs. Estuaries 2002, 25, 819–837. [Google Scholar] [CrossRef]
  3. Lee, J.; Lee, S.; Jiang, X. Cyanobacterial Toxins in Freshwater and Food: Important Sources of Exposure to Humans. Annu. Rev. Food Sci. 2017, 8, 281–304. [Google Scholar] [CrossRef] [PubMed]
  4. Machado, J.; Campos, A.; Vasconcelos, V.; Freitas, M. Effects of microcystin-LR and cylindrospermopsin on plant-soil systems: A review of their relevance for agricultural plant quality and public health. Environ. Res. 2016, 153, 191–204. [Google Scholar] [CrossRef] [PubMed]
  5. Bin Alam, M.Z.; Otaki, M.; Furumai, H.; Ohgaki, S. Direct and indirect inactivation of Microcystis aeruginosa by UV-radiation. Water Res. 2001, 35, 1008–1014. [Google Scholar] [CrossRef]
  6. Yu, Z.; Song, X.; Cao, X.; Liu, Y. Mitigation of harmful algal blooms using modified clays: Theory, mechanisms, and applications. Harmful Algae 2017, 69, 48–64. [Google Scholar] [CrossRef] [PubMed]
  7. Wang, Y.; Liu, Q.; Wei, Z.; Liu, N.; Li, Y.; Li, D.; Jin, Z.; Xu, X. Thiazole Amides, A Novel Class of Algaecides against Freshwater Harmful Algae. Sci. Rep. 2018, 8, 8555. [Google Scholar] [CrossRef] [PubMed]
  8. Mitsch, W.J. Solving Lake Erie’s harmful algal blooms by restoring the Great Black Swamp in Ohio. Ecol. Eng. 2017, 108, 406–413. [Google Scholar] [CrossRef]
  9. Paerl, H.W.; Otten, T.G.; Kudela, R. Mitigating the Expansion of Harmful Algal Blooms Across the Freshwater-to-Marine Continuum. Environ. Sci. Technol. 2018, 52, 5519–5529. [Google Scholar] [CrossRef] [PubMed]
  10. Mann, N.H. Phages of the marine cyanobacterial picophytoplankton. FEMS Microbiol. Rev. 2003, 27, 17–34. [Google Scholar] [CrossRef]
  11. Roux, S.; Brum, J.R.; Dutilh, B.E.; Sunagawa, S.; Duhaime, M.B.; Loy, A.; Poulos, B.T.; Solonenko, N.; Lara, E.; Sullivan, M.B.; et al. Ecogenomics and potential biogeochemical impacts of globally abundant ocean viruses Ocean microbes drive biogeochemical cycling on a global scale. Nature 2016, 537, 689–693. [Google Scholar] [CrossRef] [PubMed]
  12. Xia, H.; Li, T.; Deng, F.; Hu, Z. Freshwater cyanophages. Virol. Sin. 2013, 28, 253–259. [Google Scholar] [CrossRef] [PubMed]
  13. Yoshida, M.; Yoshida, T.; Kashima, A.; Takashima, Y.; Hosoda, N.; Nagasaki, K.; Hiroishi, S. Ecological dynamics of the toxic bloom-forming cyanobacterium Microcystis aeruginosa and its cyanophages in freshwater. Appl. Environ. Microbiol. 2008, 74, 3269–3273. [Google Scholar] [CrossRef] [PubMed]
  14. Yoshida, M.; Yoshida, T.; Yoshida-Takashima, Y.; Kashima, A.; Hiroishi, S. Real-time PCR detection of host-mediated cyanophage gene transcripts during infection of a natural Microcystis aeruginosa population. Microbes Environ. 2010, 25, 211–215. [Google Scholar] [CrossRef] [PubMed]
  15. Xia, H.; Wang, M.; Ge, X.; Wu, Y.; Yang, X.; Zhang, Y.; Li, T.; Shi, Z. Study of the dynamics of Microcystis aeruginosa and its cyanophage in East Lake using quantitative PCR. Virol. Sin. 2013, 28, 309–311. [Google Scholar] [CrossRef] [PubMed]
  16. Cheung, M.Y.; Liang, S.; Lee, J. Toxin-producing cyanobacteria in freshwater: A review of the problems, impact on drinking water safety, and efforts for protecting public health. J. Microbiol. 2013, 51, 1–10. [Google Scholar] [CrossRef] [PubMed]
  17. Van Wichelen, J.; Vanormelingen, P.; Codd, G.A.; Vyverman, W. The common bloom-forming cyanobacterium Microcystis is prone to a wide array of microbial antagonists. Harmful Algae 2016, 55, 97–111. [Google Scholar] [CrossRef]
  18. Meaden, S.; Koskella, B. Exploring the risks of phage application in the environment. Front. Microbiol. 2013, 4, 358. [Google Scholar] [CrossRef] [Green Version]
  19. Doss, J.; Culbertson, K.; Hahn, D.; Camacho, J.; Barekzi, N. A Review of Phage Therapy against Bacterial Pathogens of Aquatic and Terrestrial Organisms. Viruses 2017, 9, 50. [Google Scholar] [CrossRef]
  20. Ou, T.; Gao, X.C.; Li, S.H.; Zhang, Q.Y. Genome analysis and gene nblA identification of microcystis aeruginosa myovirus (MaMV-DC) reveal the evidence for horizontal gene transfer events between cyanomyovirus and host. J. Gen. Virol. 2015, 96, 3681–3697. [Google Scholar] [CrossRef]
  21. Gao, E.-B.; Gui, J.-F.; Zhang, Q.-Y. A novel cyanophage with a cyanobacterial nonbleaching protein A gene in the genome. J. Virol. 2012, 86, 236–245. [Google Scholar] [CrossRef] [PubMed]
  22. Safferman, R.; Morris, M. Growth characteristics of the blue-green algal virus LPP-1. J. Bacteriol. 1964, 88, 771–775. [Google Scholar] [PubMed]
  23. Tucker, S.; Pollard, P. Identification of cyanophage Ma-LBP and infection of the cyanobacterium Microcystis aeruginosa from an Australian subtropical lake by the virus. Appl. Environ. Microbiol. 2005, 71, 629–635. [Google Scholar] [CrossRef] [PubMed]
  24. Yoshida, T.; Takashima, Y.; Tomaru, Y.; Takao, Y.; Hiroishi, S.; Shirai, Y. Isolation and Characterization of a Cyanophage Infecting the Toxic Cyanobacterium Microcystis aeruginosa Isolation and Characterization of a Cyanophage Infecting the Toxic Cyanobacterium Microcystis aeruginosa. Appl. Environ. Microbiol. 2006, 72, 1239–1247. [Google Scholar] [CrossRef] [PubMed]
  25. Ou, T.; Liao, X.-Y.; Gao, X.-C.; Xu, X.-D.; Zhang, Q.-Y. Unraveling the genome structure of cyanobacterial podovirus A-4L with long direct terminal repeats. Virus Res. 2015, 203, 4–9. [Google Scholar] [CrossRef] [PubMed]
  26. Short, C.M.; Suttle, C.A. Nearly Identical Bacteriophage Structural Gene Sequences Are Widely Distributed in both Marine and Freshwater Environments Nearly Identical Bacteriophage Structural Gene Sequences Are Widely Distributed in both Marine and Freshwater Environments. Appl. Environ. Microbiol. 2005, 71, 480–486. [Google Scholar] [CrossRef] [PubMed]
  27. Mohiuddin, M.; Schellhorn, H.E. Spatial and temporal dynamics of virus occurrence in two freshwater lakes captured through metagenomic analysis. Front. Microbiol. 2015, 6, 1–13. [Google Scholar] [CrossRef] [PubMed]
  28. Kimura-Sakai, S.; Sako, Y.; Yoshida, T. Development of a real-time PCR assay for the quantification of Ma-LMM01-type Microcystis cyanophages in a natural pond. Lett. Appl. Microbiol. 2015, 60, 400–408. [Google Scholar] [CrossRef]
  29. Adriaenssens, E.M.; Cowan, D.A. Using signature genes as tools to assess environmental viral ecology and diversity. Appl. Environ. Microbiol. 2014, 80, 4470–4480. [Google Scholar] [CrossRef]
  30. Baclayon, M.; Wuite, G.J.L.; Roos, W.H. Imaging and manipulation of single viruses by atomic force microscopy. Soft Matter 2010, 6, 5273. [Google Scholar] [CrossRef]
  31. Kuznetsov, Y.G.; McPherson, A. Atomic Force Microscopy in Imaging of Viruses and Virus-Infected Cells. Microbiol. Mol. Biol. Rev. 2011, 75, 268–285. [Google Scholar] [CrossRef] [PubMed] [Green Version]
  32. Watkins, S.C.; Smith, J.R.; Hayes, P.K.; Watts, J.E.M. Characterisation of host growth after infection with a broad-range freshwater cyanopodophage. PLoS ONE 2014, 9, e87339. [Google Scholar] [CrossRef] [PubMed]
  33. Bailey, S.; Clokie, M.R.J.; Millard, A.; Mann, N.H. Cyanophage infection and photoinhibition in marine cyanobacteria. Res. Microbiol. 2004, 155, 720–725. [Google Scholar] [CrossRef] [PubMed]
  34. Clokie, M.R.J.; Mann, N.H. Marine cyanophages and light. Environ. Microbiol. 2006, 8, 2074–2082. [Google Scholar] [CrossRef] [PubMed]
  35. Rohwer, F.; Prangishvili, D.; Lindell, D. Roles of viruses in the environment. Environ. Microbiol. 2009, 11, 2771–2774. [Google Scholar] [CrossRef] [PubMed]
  36. Shaw, G.H. The Origin of Oxygenic Photosynthesis and Its Impact on the Atmosphere. In Earth’s Early Atmosphere and Oceans, and The Origin of Life; Springer International Publishing: Berlin/Heidelberg, Germany, 2016; pp. 75–93. [Google Scholar]
  37. Honda, T.; Takahashi, H.; Sako, Y.; Yoshida, T. Gene expression of Microcystis aeruginosa during infection of cyanomyovirus Ma-LMM01. Fish. Sci. 2014, 80, 83–91. [Google Scholar] [CrossRef]
  38. Haramoto, E.; Katayama, H.; Oguma, K.; Ohgaki, S. Application of cation-coated filter method to detection of noroviruses, enteroviruses, adenoviruses, and torque teno viruses in the Tamagawa River in Japan. Appl. Environ. Microbiol. 2005, 71, 2403–2411. [Google Scholar] [CrossRef] [PubMed]
  39. Shirai, M.; Matumaru, K.; Ohotake, A.; Takamura, Y.; Aida, T.; Nakano, M. Development of a Solid Medium for Growth and Isolation of Axenic Microcystis Strains (Cyanobacteria). Appl. Environ. Microbiol. 1989, 55, 2569. [Google Scholar]
  40. Jiang, X.; Lee, S.; Mok, C.; Lee, J. Sustainable Methods for Decontamination of Microcystin in Water Using Cold Plasma and UV with Reusable TiO2 Nanoparticle Coating. Int. J. Environ. Res. Public Health 2017, 14, 480. [Google Scholar] [CrossRef]
  41. Schmidt, K.; Mwaigwisya, S.; Crossman, L.C.; Doumith, M.; Munroe, D.; Pires, C.; Khan, A.M.; Woodford, N.; Saunders, N.J.; Wain, J.; et al. Identification of bacterial pathogens and antimicrobial resistance directly from clinical urines by nanopore-based metagenomic sequencing. J. Antimicrob. Chemother. 2017, 72, 104–114. [Google Scholar] [CrossRef]
  42. Quick, J.; Ashton, P.; Calus, S.; Chatt, C.; Gossain, S.; Hawker, J.; Nair, S.; Neal, K.; Nye, K.; Peters, T.; et al. Rapid draft sequencing and real-time nanopore sequencing in a hospital outbreak of Salmonella. Genome Biol. 2015, 16, 114. [Google Scholar] [CrossRef]
  43. Marion, J.W.; Lee, J.; Wilkins, J.R.; Lemeshow, S.; Lee, C.; Waletzko, E.J.; Buckley, T.J. In vivo phycocyanin flourometry as a potential rapid screening tool for predicting elevated microcystin concentrations at eutrophic lakes. Environ. Sci. Technol. 2012, 46, 4523–4531. [Google Scholar] [CrossRef] [PubMed]
  44. US EPA. Method 546: Determination of Total Microcystins and Nodularins in Drinking Water and Ambient Water by Adda Enzyme-Linked Immunosorbent Assay; EPA: Washington, DC, USA, 2016.
  45. Castresana, J. Selection of conserved blocks from multiple alignments for their use in phylogenetic analysis. Mol. Biol. Evol. 2000, 17, 540–552. [Google Scholar] [CrossRef]
  46. Anisimova, M.; Gascuel, O. Approximate Likelihood-Ratio Test for Branches: A Fast, Accurate, and Powerful Alternative. Syst. Biol. 2006, 55, 539–552. [Google Scholar] [CrossRef] [PubMed]
  47. Dereeper, A.; Guignon, V.; Blanc, G.; Audic, S.; Buffet, S.; Chevenet, F.; Dufayard, J.-F.; Guindon, S.; Lefort, V.; Lescot, M.; et al. Phylogeny.fr: Robust phylogenetic analysis for the non-specialist. Nucleic Acids Res. 2008, 36, W465–W469. [Google Scholar] [CrossRef] [PubMed]
  48. Edgar, R.C. MUSCLE: Multiple sequence alignment with high accuracy and high throughput. Nucleic Acids Res. 2004, 32, 1792–1797. [Google Scholar] [CrossRef]
  49. Guindon, S.; Gascuel, O. A Simple, Fast, and Accurate Algorithm to Estimate Large Phylogenies by Maximum Likelihood. Syst. Biol. 2003, 52, 696–704. [Google Scholar] [CrossRef] [Green Version]
  50. Dekel-Bird, N.P.; Avrani, S.; Sabehi, G.; Pekarsky, I.; Marston, M.F.; Kirzner, S.; Lindell, D. Diversity and evolutionary relationships of T 7-like podoviruses infecting marine cyanobacteria. Environ. Microbiol. 2013, 15, 1476–1491. [Google Scholar]
Figure 1. The dynamic changes of M. aeruginosa infected by cyanophage Ma-LEP in two weeks. (a) optical density (OD) at 680 nm; (b) the concentration of M. aeruginosa (mcyE gene); (c) the concentration of phycocyanin; (d) the concentration of chlorophyll-a.; (e) control (M. aeruginosa only, left) and infected by cyanophage Ma-LEP (right three).
Toxins 11 00444 g001
Figure 2. Structural changes of M. aeruginosa caused by cyanophage Ma-LEP infection. (a) Control group; (b,c) cyanophage Ma-LEP infected group. Left and right columns show the morphological change and the stiffness damage of the host cells, respectively, as the infection progressed.
Toxins 11 00444 g002
Figure 3. TEM images of repeating cyanophages (red arrows in a,b) with short tail (red circle in c) and special capsids (red arrows in c).
Toxins 11 00444 g003
Figure 4. Phylogenic tree of cyanophage Ma-LEP based on the sequence of psbA gene (accession number: MK765681). The horizontal lines show genetic distance and the bar at the bottom of the figure denotes distance.
Toxins 11 00444 g004
Figure 5. Sampling locations western Lake Erie.
Toxins 11 00444 g005
Table 1. Pigment production and growth of M. aeruginosa with or without cyanophage Ma-LEP infection as a function of time in a linear model.
TreatmentPhycocyaninChlorophyll-aOD at 680 nmLog (Gene Copy Number) 1
SlopeR2SlopeR2SlopeR2SlopeR2
Control13.100.933.450.840.04>0.990.280.82
Cyanophage
Ma-LEP
5.75 **0.682.18 **0.900.03 **0.990.13 **0.74
1 Data from day 1 to day 5 were fitted, ** p < 0.01.

