1. Introduction
3-Hydroxy-3-methylglutaryl coenzyme A reductase inhibitors (statins), which are potent inhibitors of cholesterol biosynthesis, are widely used for the prevention of atherosclerotic cardiovascular disease due to hypercholesterolemia [
1,
2,
3]. However, statins are associated with a variety of muscle complaints such as myopathies and rhabdomyolysis. Although Strippoli et al. reported that the adverse drug reaction profile of statins was similar to that of placebo in patients with chronic kidney disease [
4], rhabdomyolysis is a rare adverse drug reaction and statin-induced rhabdomyolysis was partly regarded as problematic in patients with end-stage kidney disease (ESKD). It is thought that one of the risk factors for rhabdomyolysis among statin users may be, while not statistically significant, kidney dysfunction [
5]. The frequency of rhabdomyolysis in ESKD patients may be higher than that in patients with normal kidney function. Recently, we reported that uremic toxins accumulated in ESKD patients is, at least in part, associated with enhancement of statin-induced cytotoxicity via small G-protein geranylgeranylation [
6]. In statin users, severe vitamin D deficiency that occurs in ESKD patients also appear to be one of risk factors for myalgia which is an initial symptom of rhabdomyolysis [
7,
8]. These facts indicate that various factors is associated with risk enhancement of statin-induced rabdomyolysis. Despite that, however, the quantity of various trace elements such as Zn is also changed in ESKD patients [
9], it has not been investigated the effects of the difference of trace elements on statin-induced rabdomyolysis.
There is an imbalance of various trace elements, such as low plasma concentrations of Zn, in ESKD patients. In addition, patients undergoing hemodialysis (HD patients) have abnormally high plasma Cu/Zn ratios, low activity of superoxide dismutase (SOD), and high levels of oxidative stress; Zn supplementation in HD patients ameliorates Cu/Zn ratios and may reduce oxidative stress [
10]. Atorvastatin is associated with mitochondrial reactive oxygen species (ROS)-induced apoptosis in glycolytic skeletal muscle and may contribute to myopathy [
11]. Moreover, it has been shown that Zn deficiency induces apoptosis in a variety of tissues in rats [
12], and pre-treatment with either Cu or Zn reduces growth inhibition by lovastatin in human cervical carcinoma HeLa cells [
13]. Therefore, we hypothesized that the concentrations of various trace elements, such as Zn, may be changed in ESKD patients and may augment statin-induced cytotoxicity in striated muscle.
The aim of this study is to determine whether variation in the concentration of trace elements affects statin-induced cytotoxicity. Therefore, we investigated the effects of Mg, Ca, Mn, Cu, and Zn on statin-induced cytotoxicity in long-time uremic serum (US)-exposed human rhabdomyosarcoma (RD) cells.
3. Discussion
We had previously shown that statin-induced cytotoxicity in differentiated RD cells was augmented by pre-treatment with uremic toxins—hippuric acid, 3-carboxy-4-methyl-5-propyl-2-furanpropionate, indole-3-acetic acid, and 3-indoxyl sulfate, whereas cisplatin-induced cytotoxicity was not affected by pre-treatment with uremic toxins [
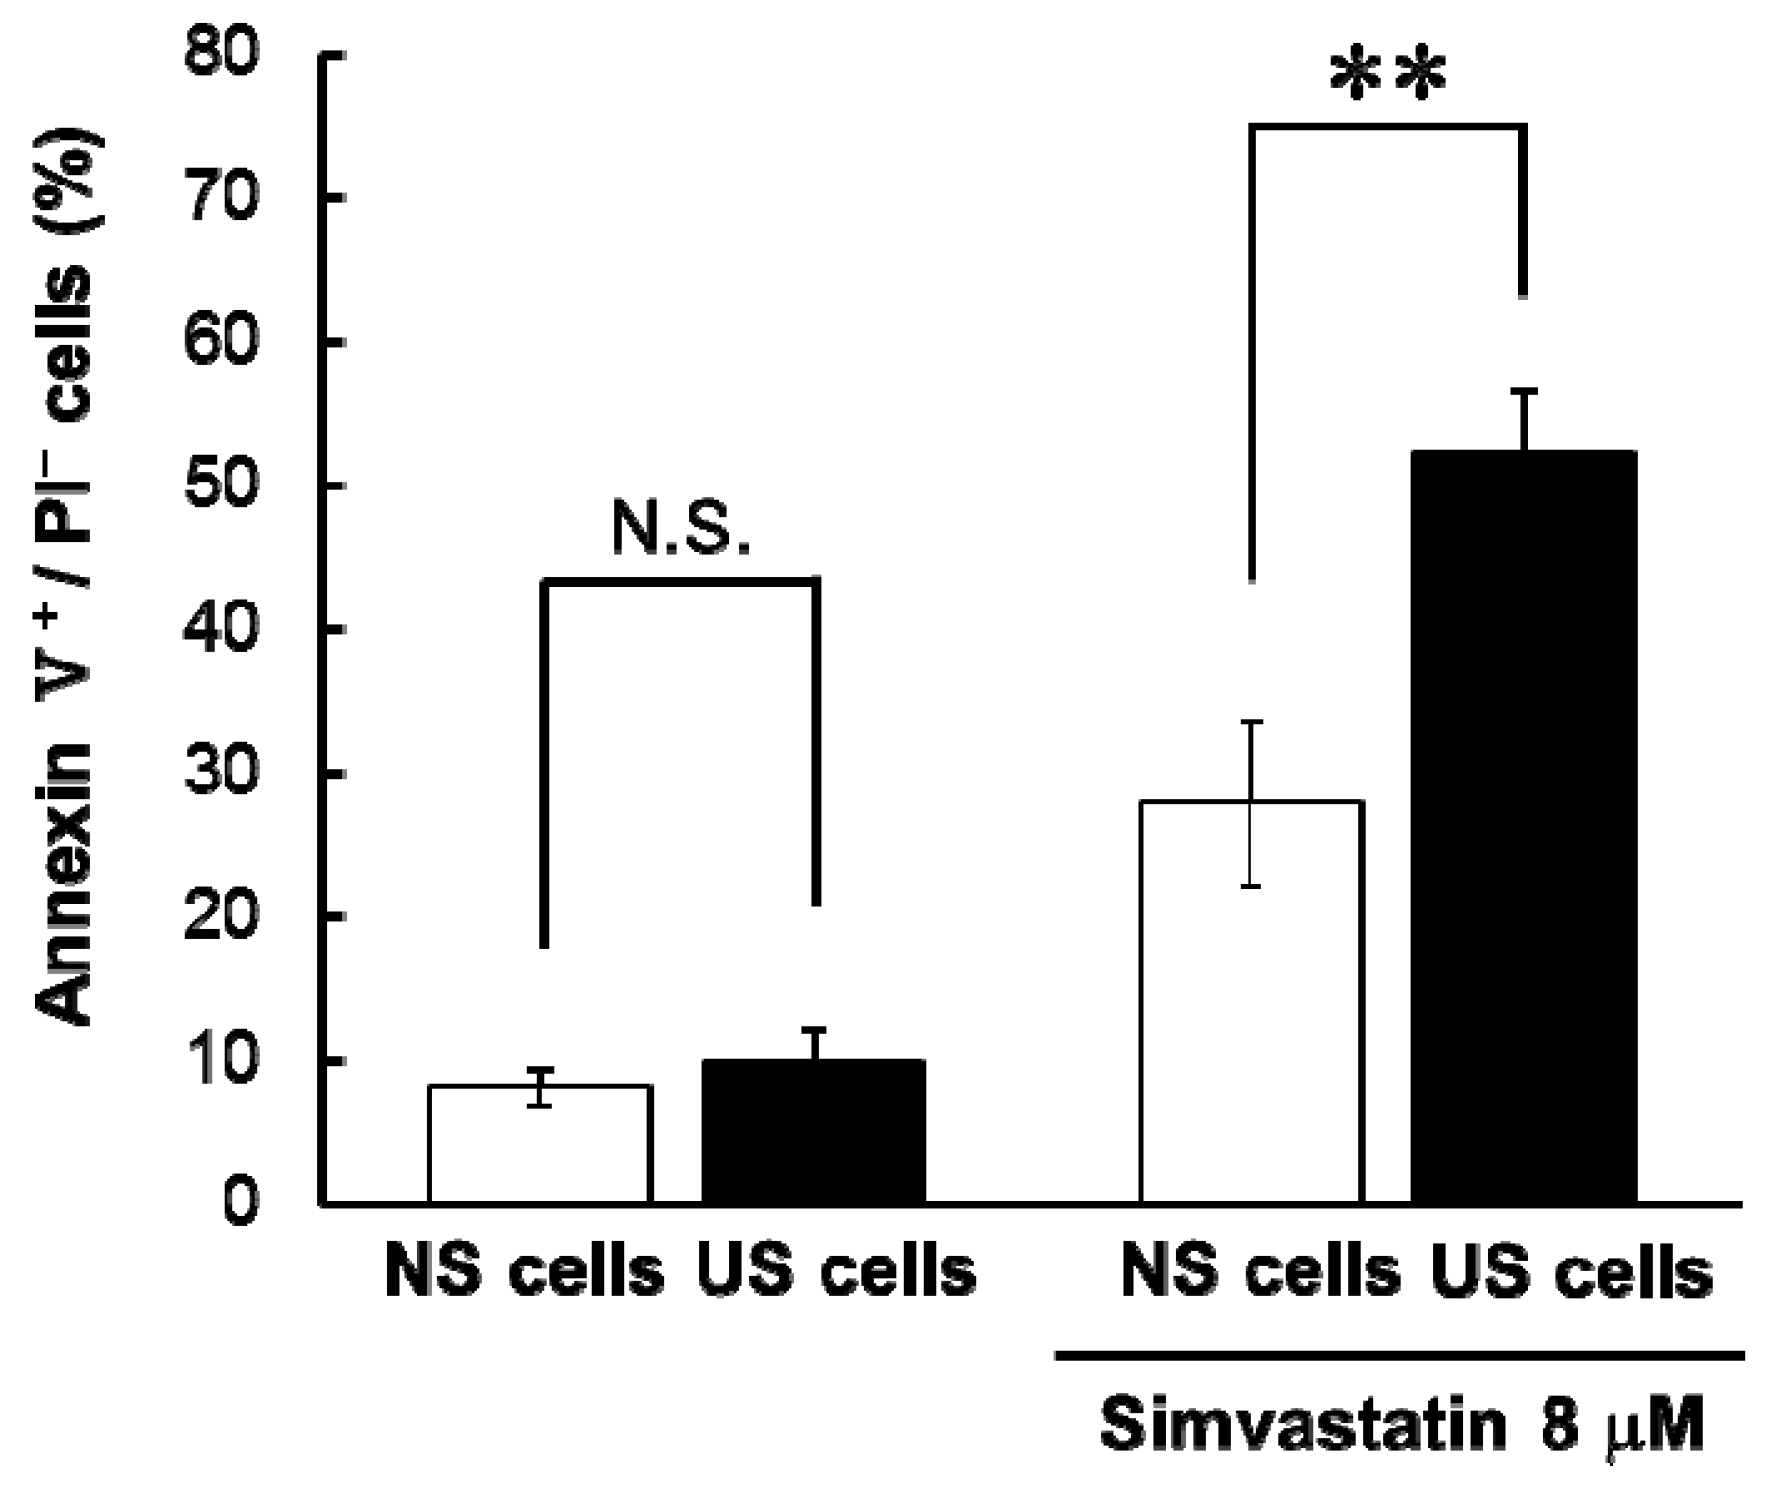
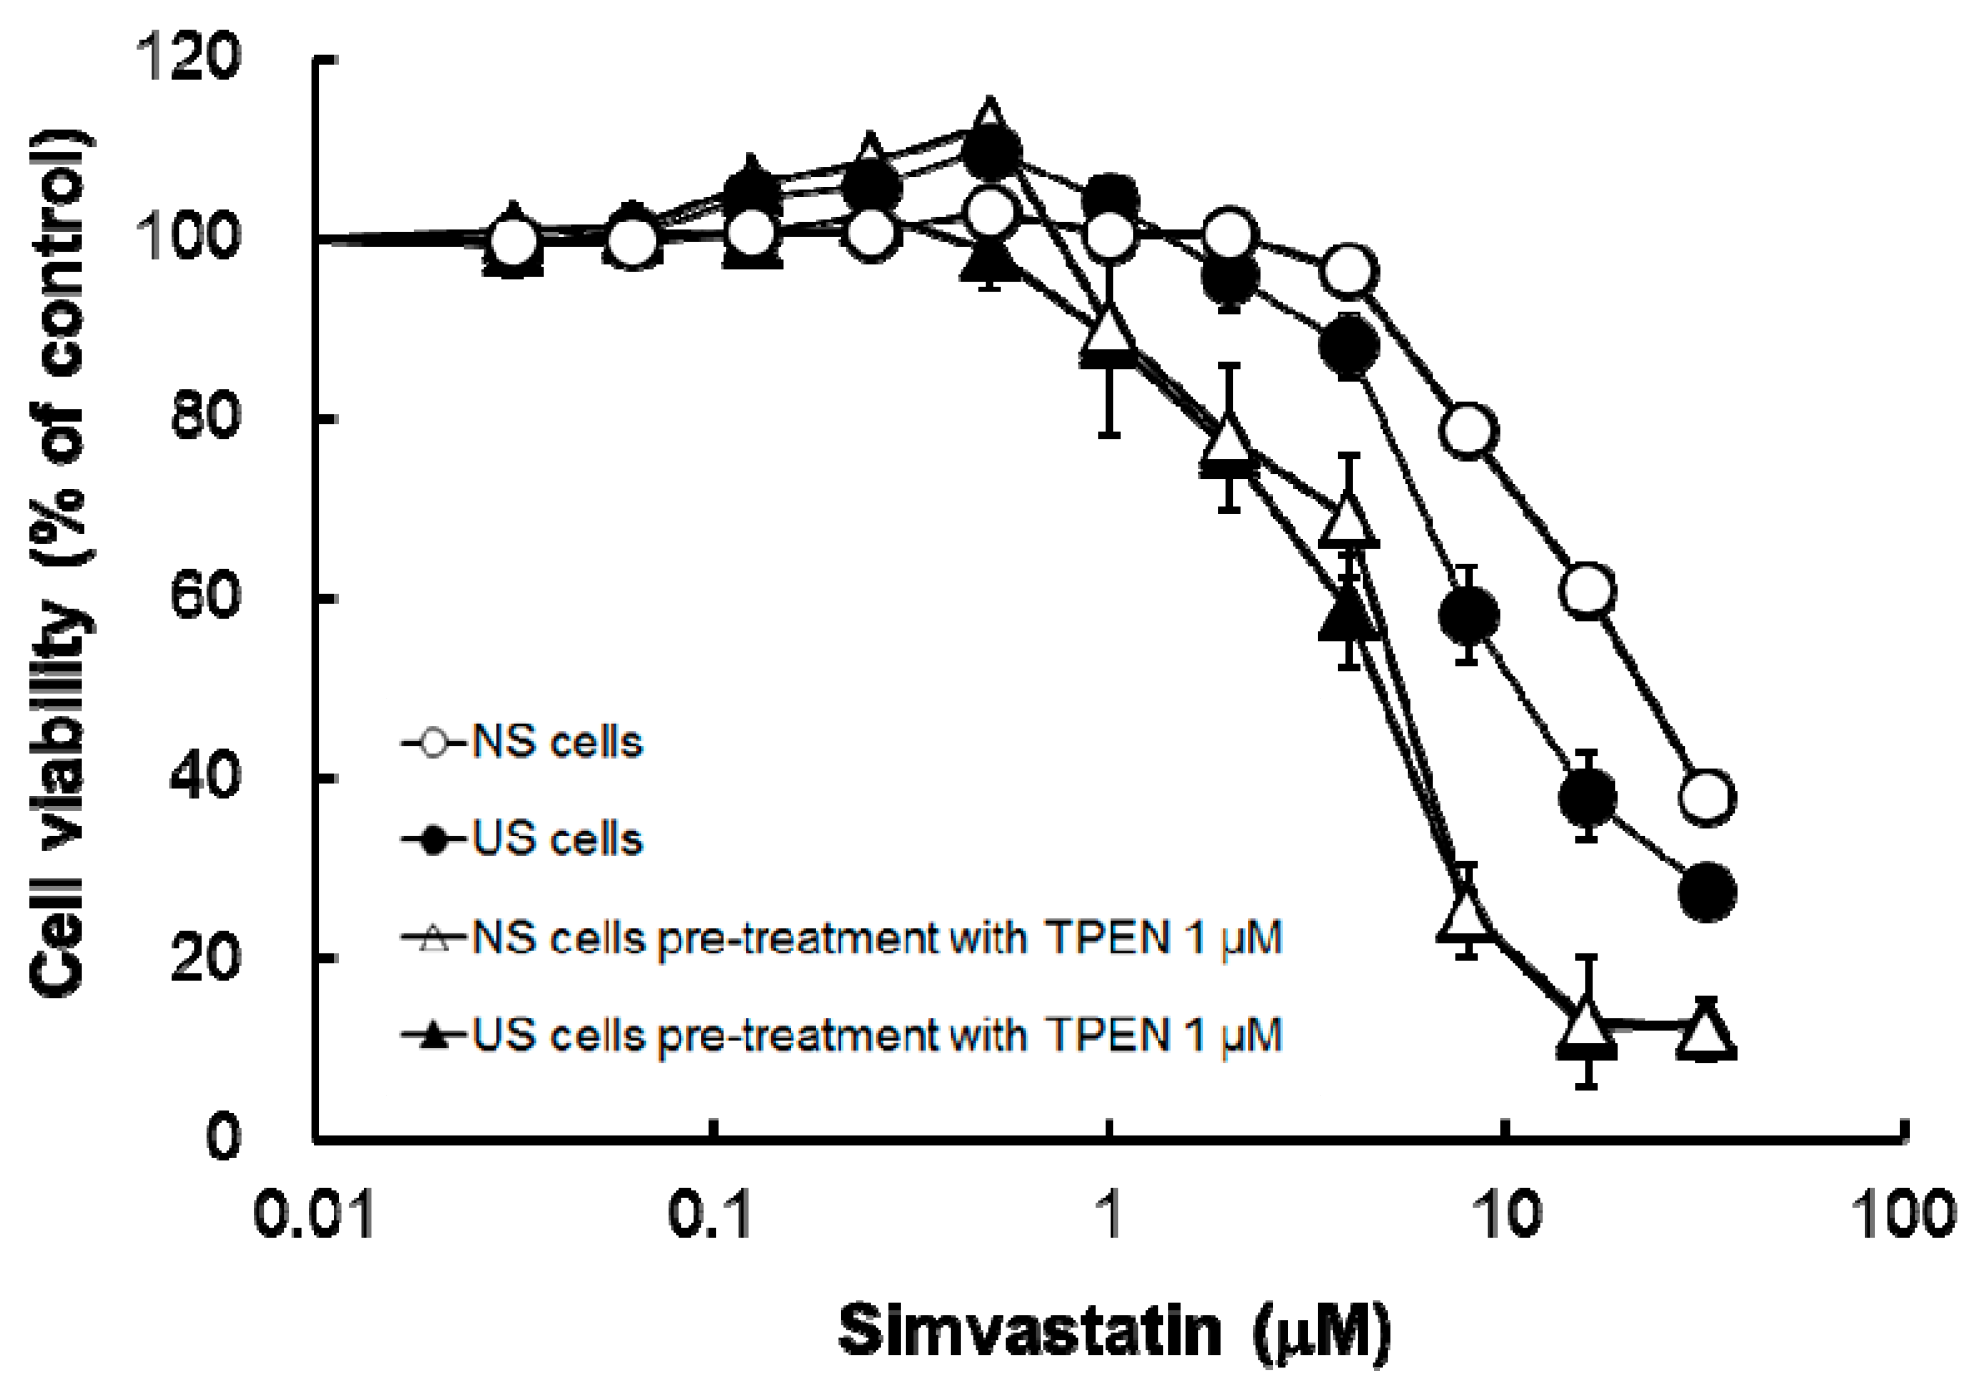
6]. In this study, simvastatin-induced apoptosis and cytotoxicity was greater in US cells than in NS cells (
Table 1 and
Figure 1), and here, we found that simvastatin-induced cytotoxicity was similarly augmented in US cells. By contrast, cytotoxicity associated with losartan and cisplatin was lower in US cells than NS cells (
Table 1). The effect of long-time exposed with US on cisplatin-induced cytotoxicity in RD cells was different from effect of pre-treatment with uremic toxins [
6]. It is possible that the decrease in cisplatin-induced cytotoxicity in US cells was due to serum components apart from uremic toxins. Components in US may vary sensitivity to specific drugs, and US components besides uremic toxins may also affect statin-induced cytotoxicity by accelerating drug-induced apoptosis.
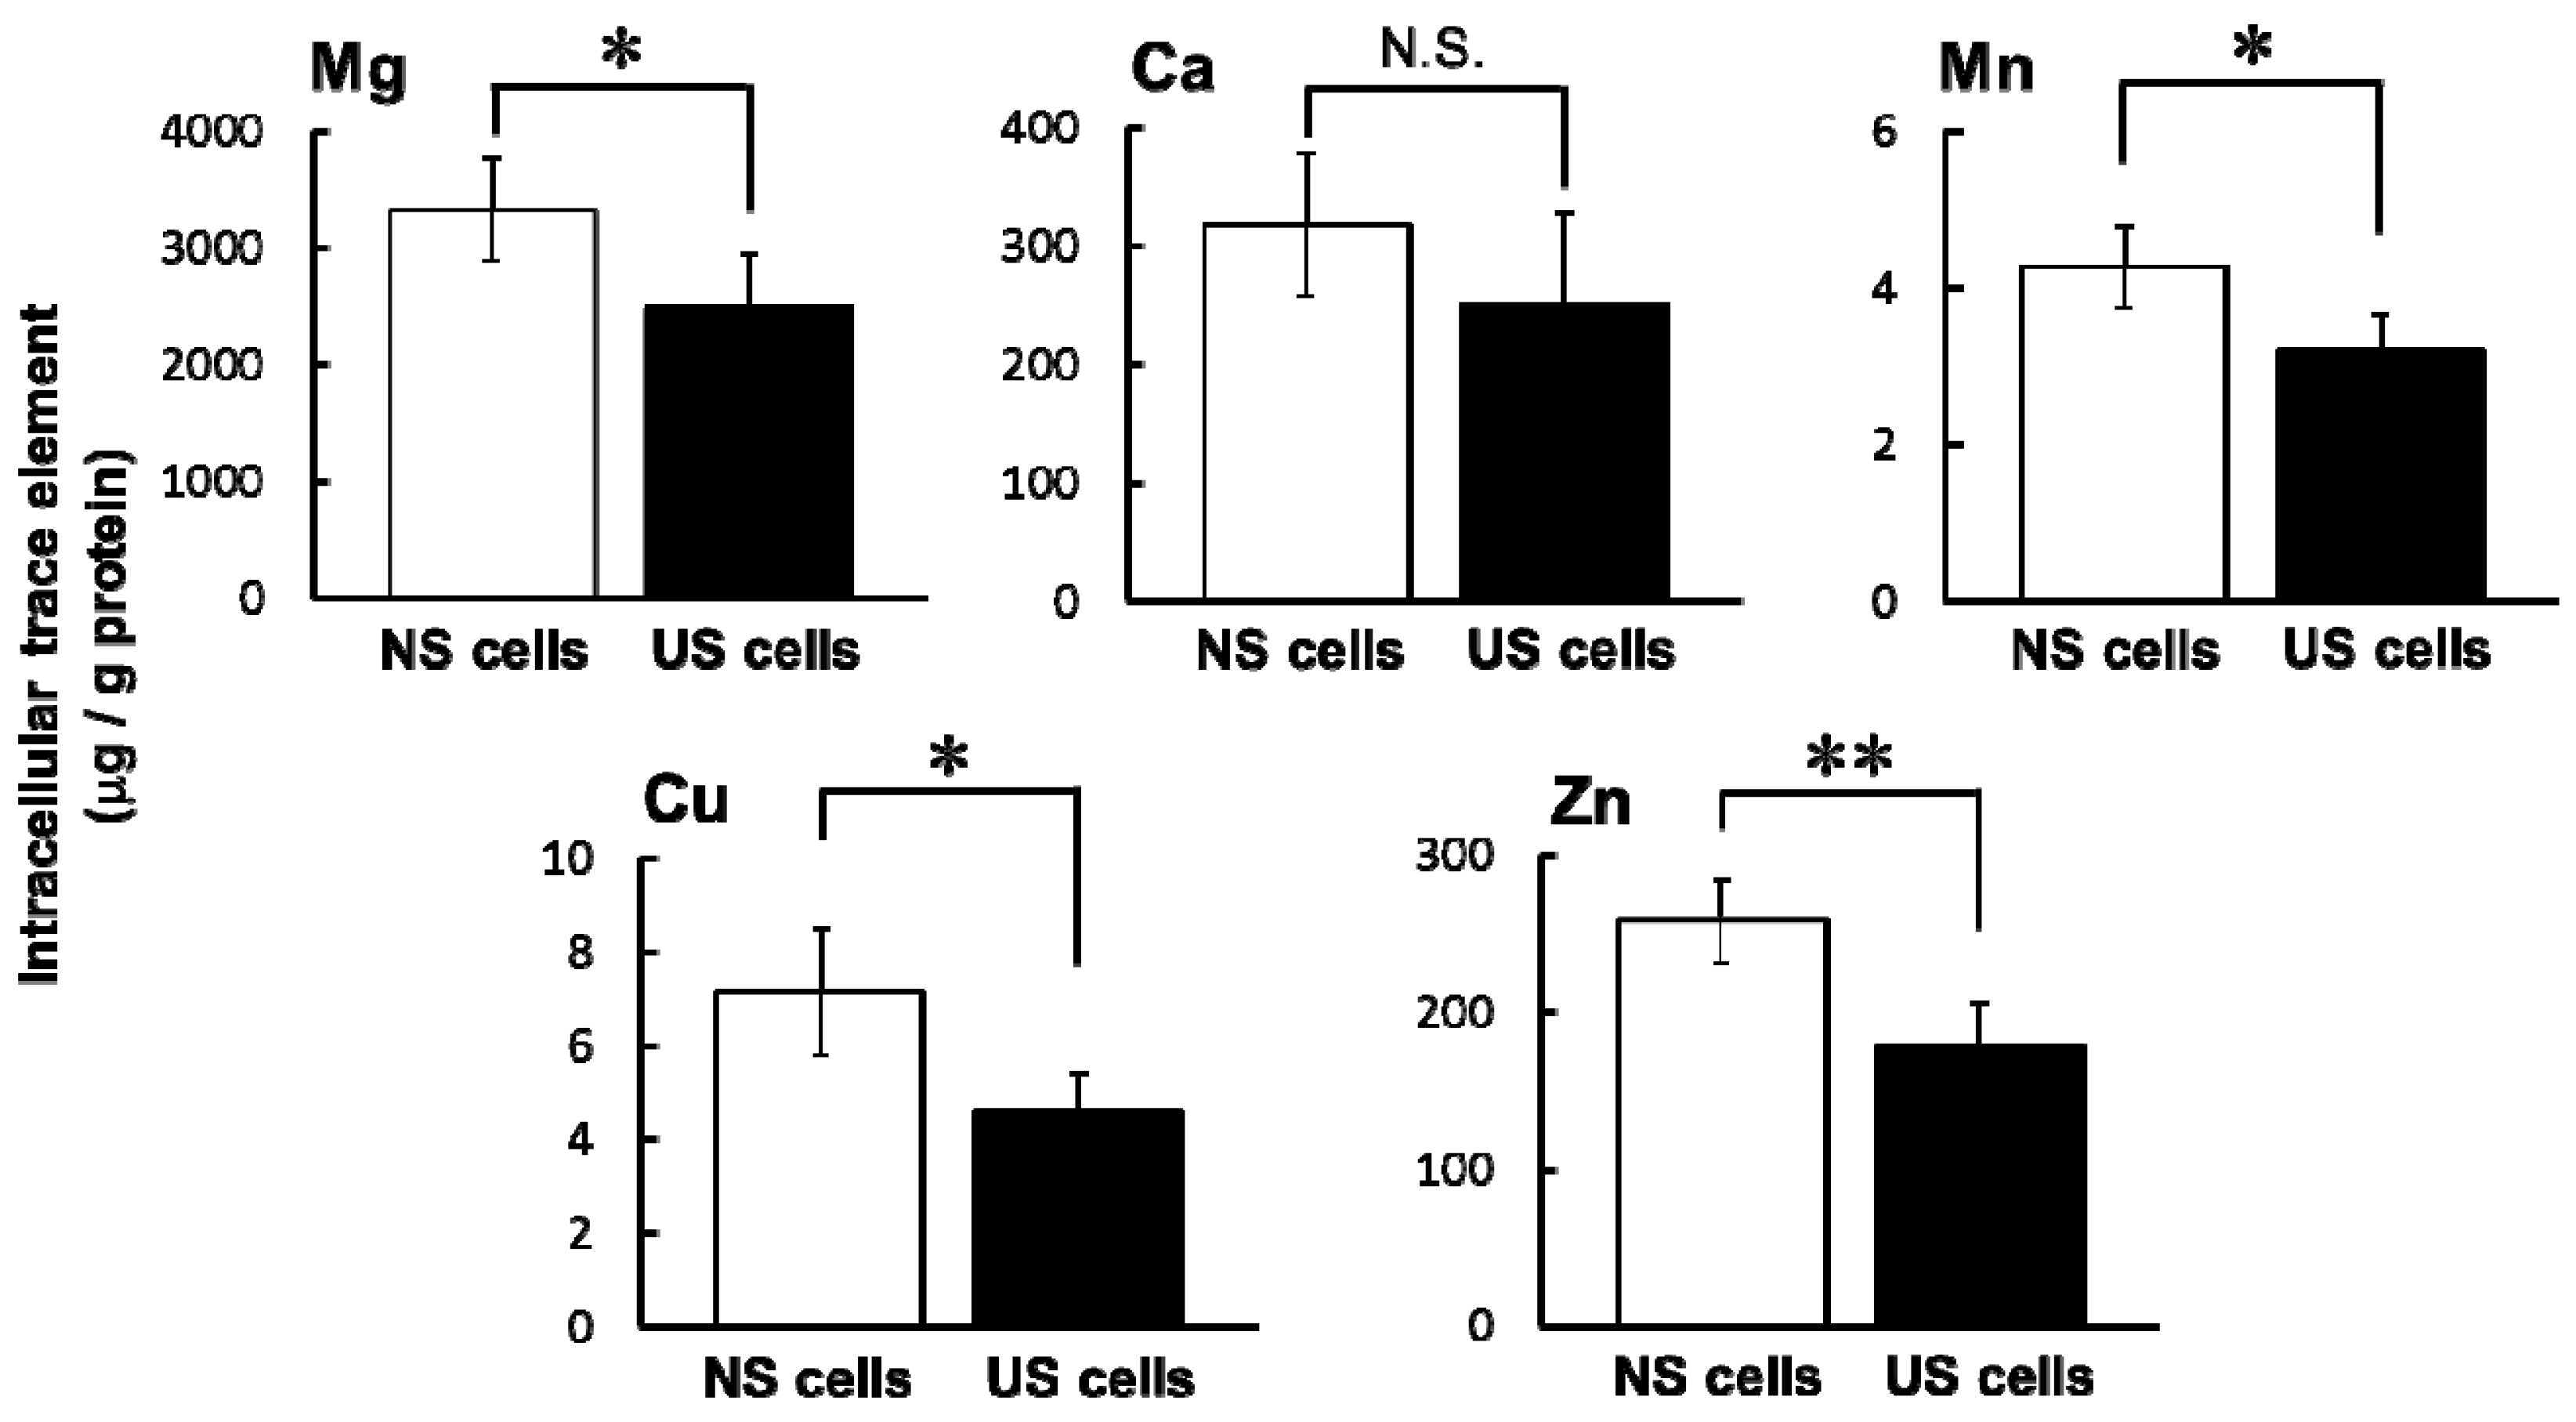
One factor that may influence sensitivity to specific drugs in ESKD patients is an imbalance of various trace elements. Intracellular concentrations of Mg, Mn, Cu, and Zn were significantly lower in US cells than in NS cells (
Figure 2). Ari et al. reported in HD patients that the serum levels of Zn and Mn were lower but that levels of Cu and Mg were higher compared to healthy volunteers [
9]. These differences may be influenced by a meal or circadian rhythms in trace elements. A decrease in intracellular Mg increases potassium secretion by Mg-mediated inhibition of renal outer medullary potassium channel (ROMK). If ROMK in the apical membrane of distal nephron is in Mg deficiency same as RD cells, it may be one of risk factors for hypokalemia. Then, the hypokalemia can cause rhabdomyolysis [
14,
15].
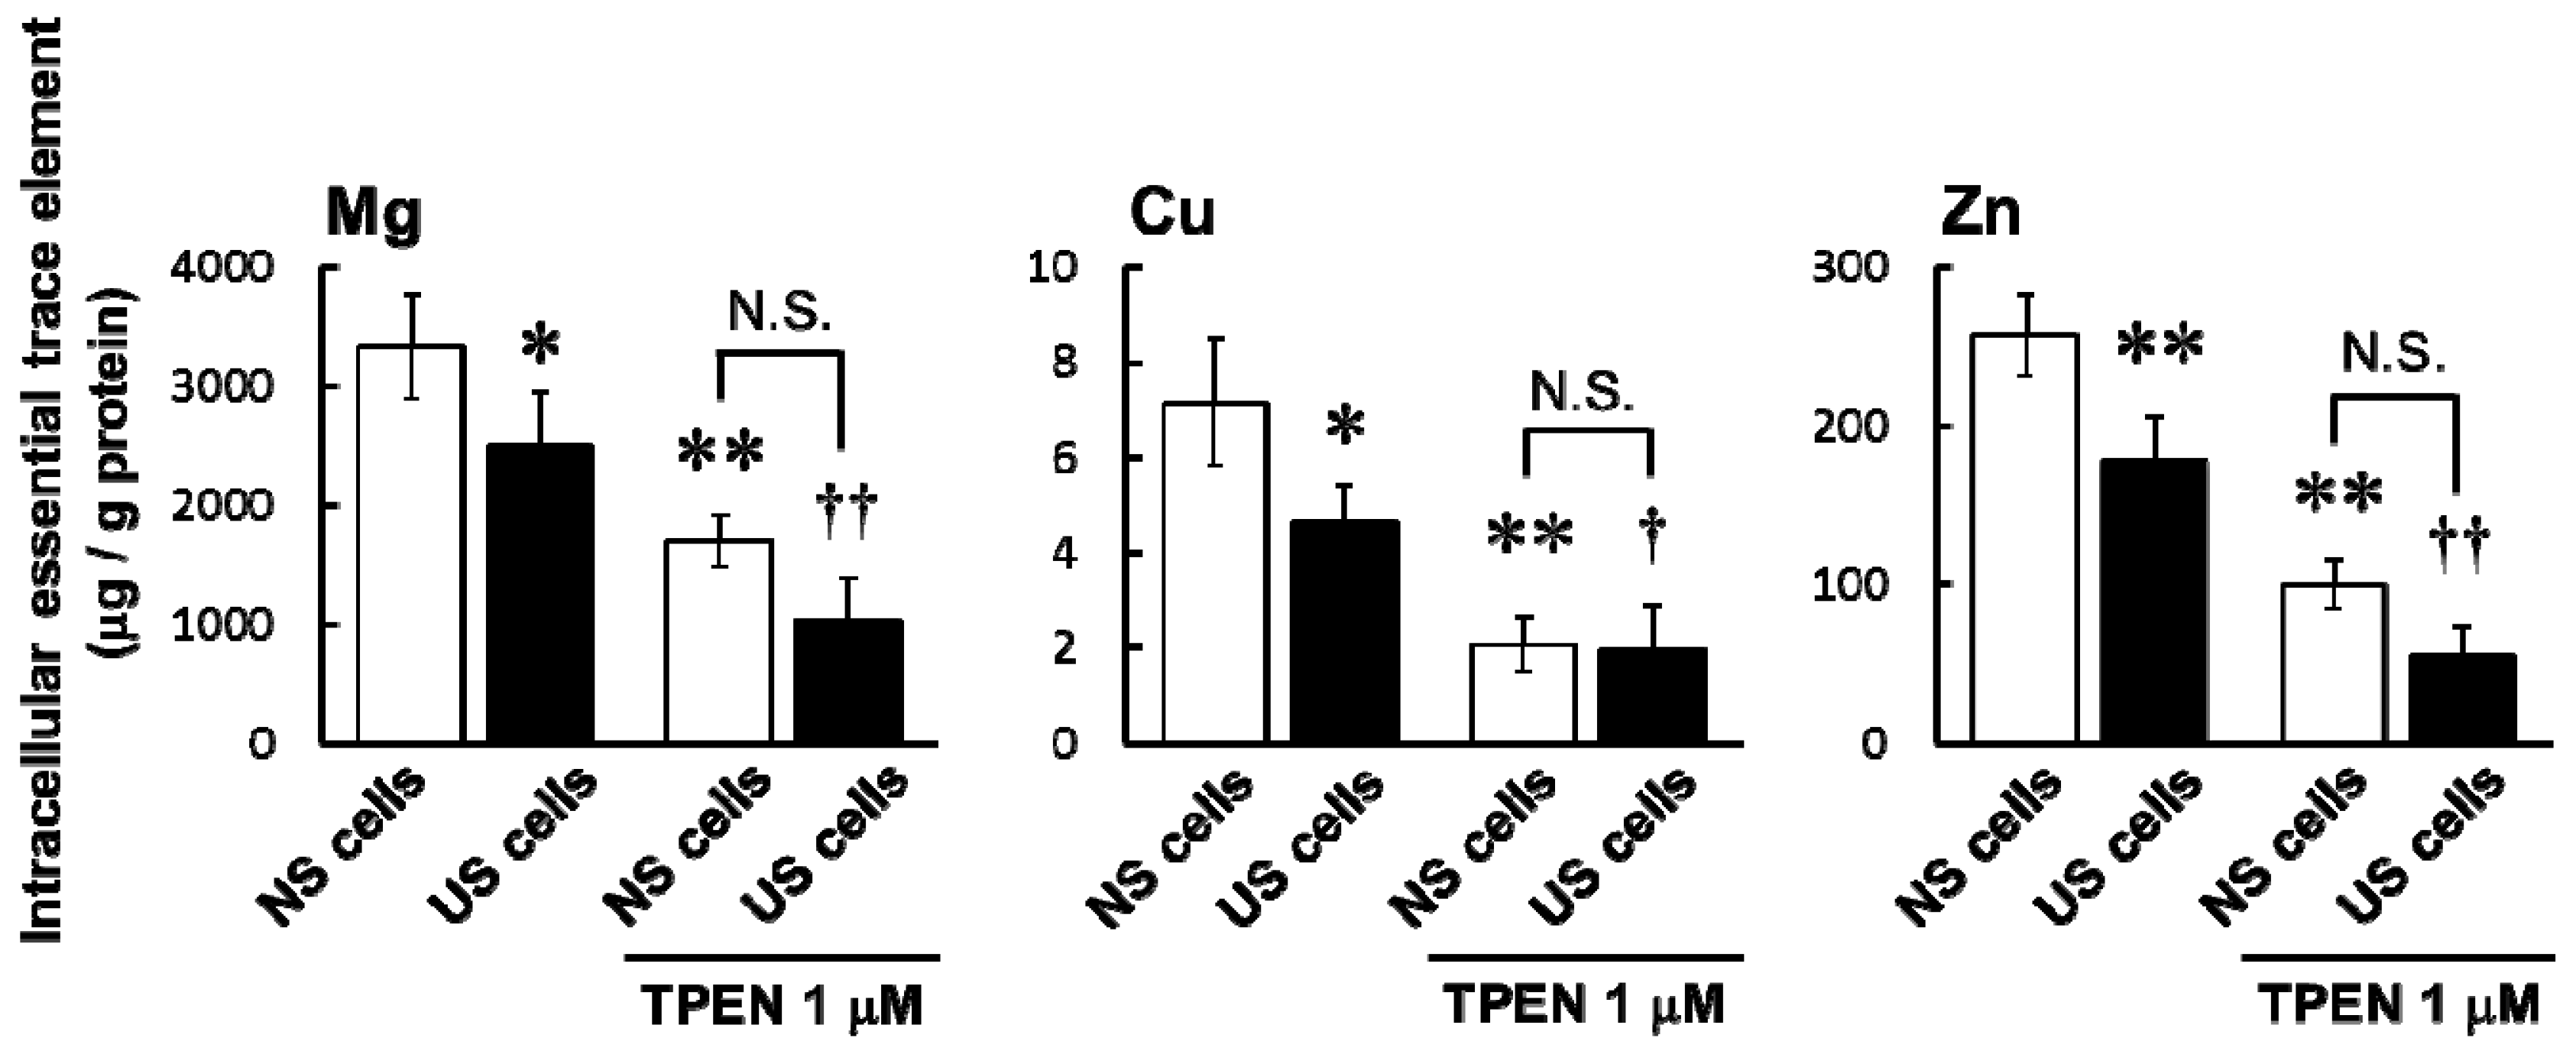
Pre-treatment with the membrane-permeable heavy metal chelator TPEN significantly decreased intracellular concentrations of Mg, Cu, and Zn in both US and NS cells (
Figure 3) and increased simvastatin-induced cytotoxicity (
Figure 4 and
Table 2). The result of augmentation of simvastatin-induced cytotoxicity eliminated the distinction between cytotoxicity in US and NS cells (
Figure 4 and
Table 2). In vivo, it has been reported that Zn is present at active centers of some antioxidant enzymes, such as SOD, and is an important factor against oxidative stress [
16]. Atorvastatin was previously shown to induce changes in oxidative stress and to reduce exercise capacities in rats [
17]. Therefore, deficiencies of intracellular trace elements, such as Zn, may be involved in the augmentation of oxidative stress. In important fact to HD patients, it has been reported that the serum levels of Zn is lower compared to healthy volunteers [
9], and oxidative product in plasma is higher compared to healthy volunteers [
10]. These results suggest that deficiencies in trace elements may also be involved in the augmentation of simvastatin-induced cytotoxicity caused by US.
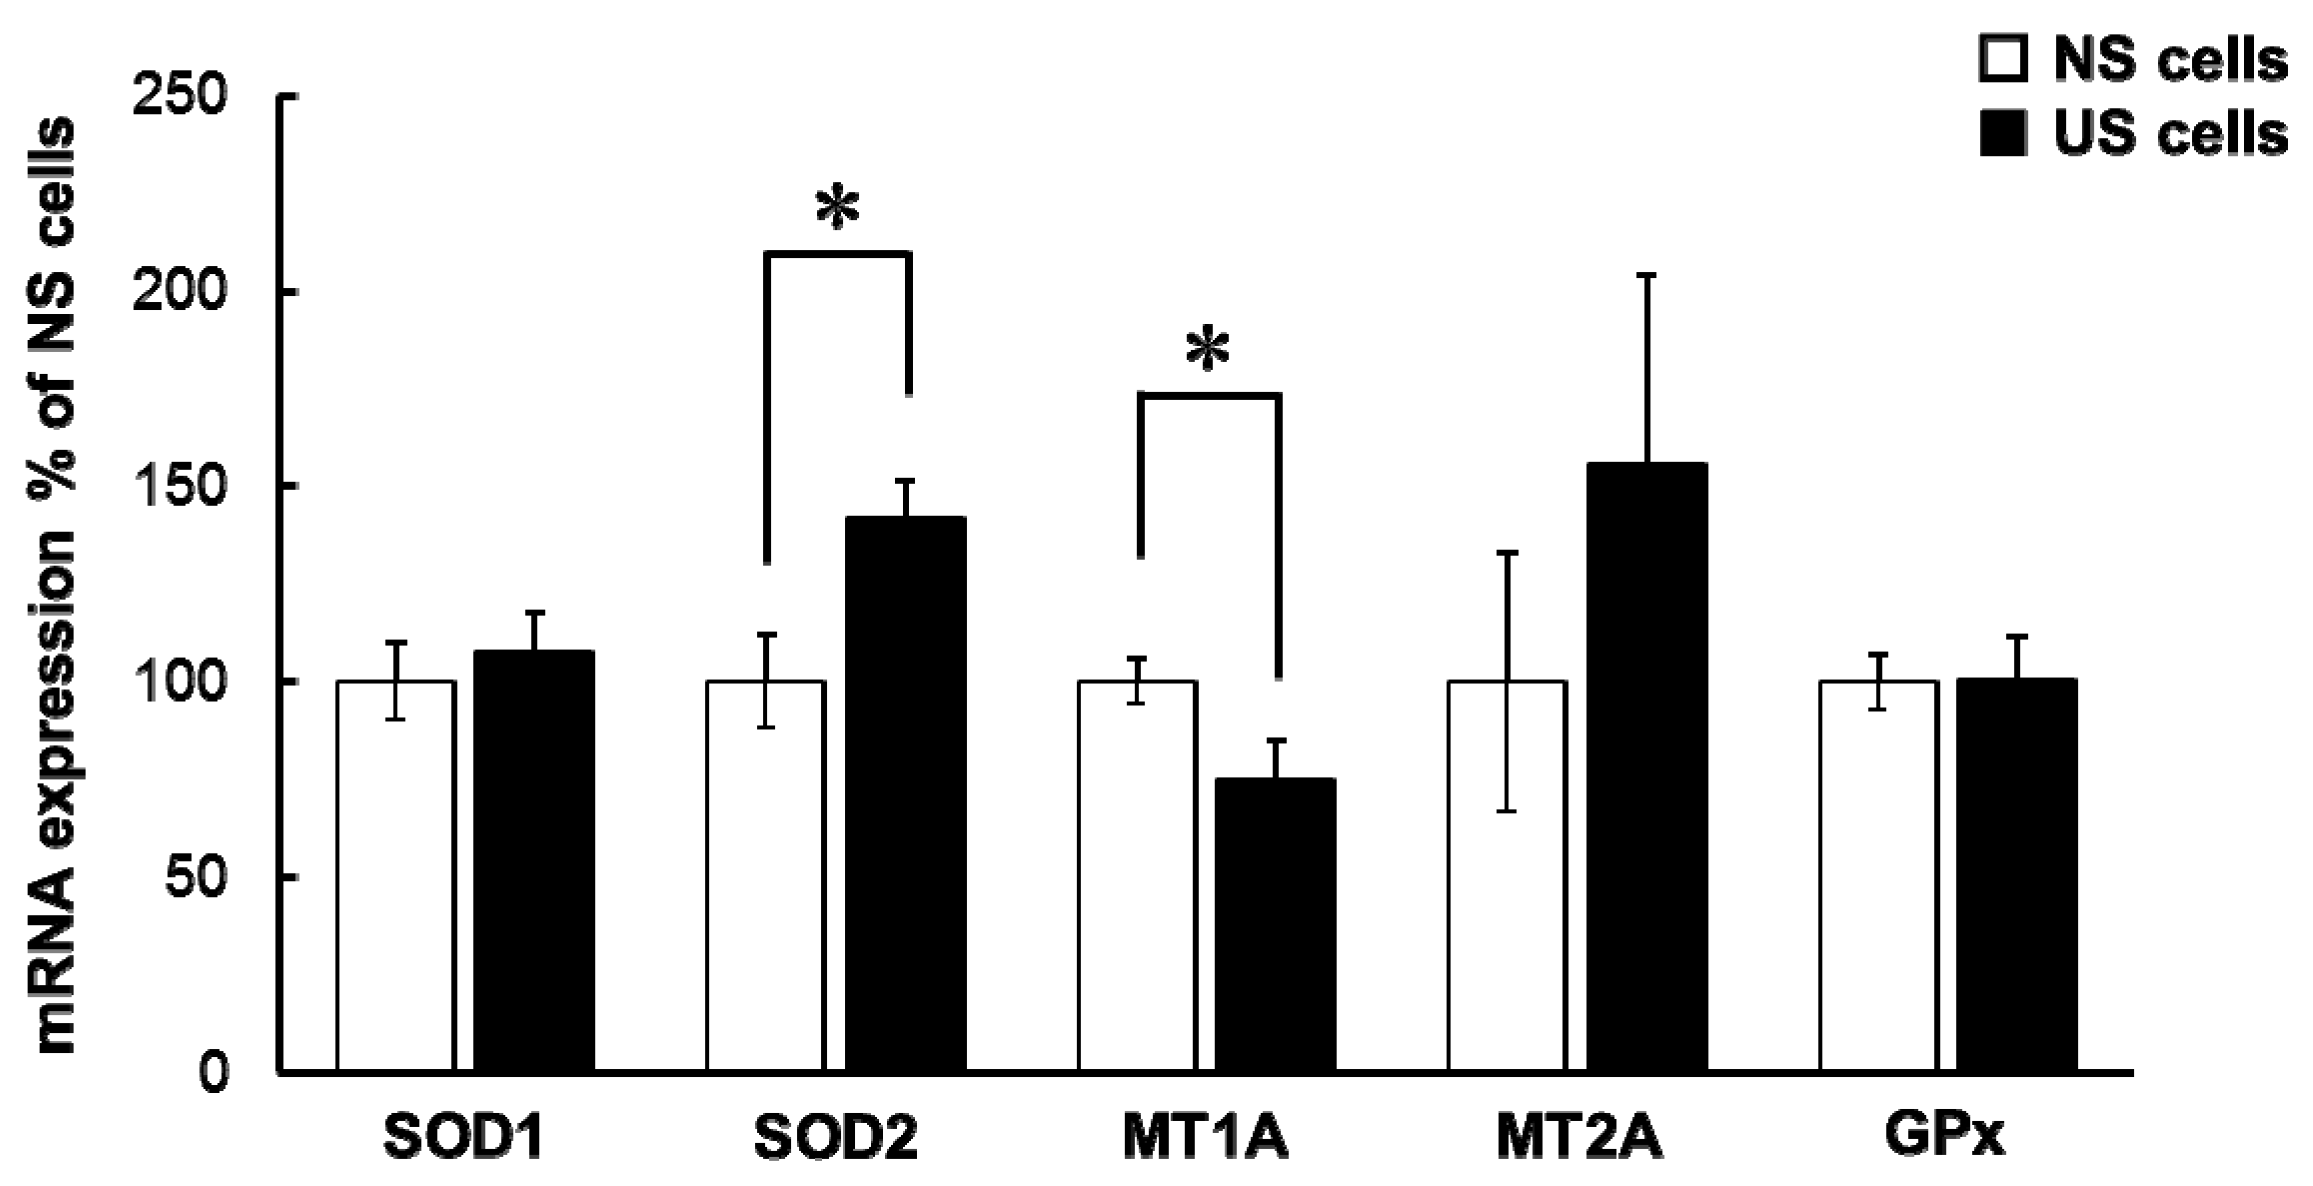
mRNA levels of SOD1, MT2A, and GPx1 in US cells were comparable to that in NS cells, but the level of SOD2 mRNA in US cells was significantly higher than that in NS cells (
Figure 5). In addition, mRNA levels of SOD1 were significantly decreased in NS and US cells treated with TPEN, but no changes in mRNA levels of SOD2 were found (data not shown). Therefore, augmentation of simvastatin-induced cytotoxicity in US cells may be at least partly associated with oxidative stress.
mRNA expression of MT1A in US cells was significantly lower than in NS cells (
Figure 5). Metallothioneins are proteins with the capacity to bind metal, and have a function in antioxidation. Hence, alterations in simvastatin-induced cytotoxicity caused by US may be due to the low level of MT1A expression. The level of MT expression was increased by Zn and decreased by TPEN [
18], suggesting that decreased levels of MT1A mRNA may be associated with intracellular Zn deficiencies.
The limitations of this study include lack of changes in oxidative stress, and the relationship between protein and mRNA expression levels. Accordingly, typical markers of oxidative stress or ROS production and the protein expression of antioxidant enzymes or a metal transporter need to be measured directly to confirm our findings.
5. Materials and Methods
5.1. Chemicals
Simvastatin was purchased from Toronto Research Chemicals, Inc. (North York, ON, Canada). Losartan was purchased from LKT Laboratories, Inc. (St. Paul, MN, USA). Cisplatin was purchased from Wako Pure Chemical Industries (Osaka, Japan). TPEN was purchased from Santa Cruz Biotechnology, Inc. (Dallas, TX, USA). Annexin V-fluorescein isothiocyante (FITC) was purchased from BioLegend, Inc. (San Diego, CA, USA). The Cell Quanti-Blue™ Cell Viability Assay Kit (CellQuanti-Blue™) was purchased from BioAssay Systems (Hayward, CA, USA). Pooled human serum as NS was purchased from Merck Millipore Co. (Billerica, MA, USA). Serum that was pooled from more than 400 dialysis patients as US was obtained from Shirasagi Hospital (Osaka, Japan). Because the patients were administered various drugs for medication, those drugs might affect our research. All uremic sera, however, were collected from patients just before hemodialysis. Because HD patients do not administer drugs before hemodialysis in general except for prophylactic drug for adverse events such as dialysis hypotension, it was thought that there were negligible effects of prescription drugs in US. This study (approval number 08-04) was approved in advance by the Shirasagi Hospital and Kyoto Pharmaceutical University ethical review board on 11 December 2008 and 1 April 2008, respectively.
5.2. Cell Culture
The RD cell line was purchased from American Type Culture Collection (Manassas, VA, USA). Dulbecco’s modified Eagle’s medium (DMEM, Life Technologies, Tokyo, Japan) without fetal bovine serum (FBS, Thermo Fisher Scientific, Inc., Kanagawa, Japan) contained sodium hydrogen carbonate (3.7 g), 100 U/mL penicillin, and 100 µg/mL streptomycin and 0.1 mM non-essential amino acids solution (Nacalai Tesque, Inc., Kyoto, Japan). NS and US were deproteinized using three volumes methanol and the supernatants were dried under a stream of nitrogen at 50 °C. The residue was dissolved in 10 volumes DMEM without FBS and ultrafiltered using a 0.22 µm membrane filter. The final concentration of 10% FBS was ultrafiltered in DMEM with serum using a 0.45 µm membrane filter, and these media were named 10% NS medium or 10% US medium, respectively. RD cells were exposed for at least one month to 10% NS medium or 10% US medium at 37 °C with 5% CO2. During this period, RD cells were re-plated at a density of 1 × 10⁶ cells per 10 mL in media every third or fourth day. The resulting cells were named NS and US cells, respectively.
5.3. Evaluation of Cytotoxicity
RD cells that grown as the following are a model cells of human skeletal muscle and used for myotoxicity evaluation in this study [
19]. NS and US cells were plated at a density of 5 × 10
3 cells/well/100 µL into 96-well plates in DMEM with 10% FBS for three days at 37 °C with 5% CO
2. These cells were then cultured in DMEM with 1% FBS (differentiation medium) for seven days to induce differentiation. In the pre-treatment experiment with TPEN, 1 µM TPEN was added to the differentiation medium. After removal of the medium from differentiated RD cells, differentiated RD cells were exposed to medium containing the following test compounds for three days at 37 °C with 5% CO
2. The concentrations of simvastatin, losartan, and cisplatin (test compounds) used were 0.03125–32 or 0.25–256 µM, 16–4096 µM, and 0.5–512 µM, respectively.
After treatment with the test compounds for three days, cell viability was measured using CellQuanti-Blue™ and a microplate reader (excitation wavelength = 535 nm, emission wavelength = 590 nm, GENios, Tecan, Seestrasse, Switzerland).
The lethal concentration 50 (LC
50) value was calculated using the non-linear least squares program (MULTI)
where
L,
Lmax,
C, and γ are cell viability (% of control), maximum cell lethality, drug concentration in the medium, and sigmoid function, respectively.
5.4. Assessment of Apoptosis
NS and US cells were incubated in medium containing 8 µM simvastatin for 24 h (shorter than cytotoxicity experiment) at 37 °C with 5% CO2. NS and US cells dissociated by trypsin-EDTA were suspended at a concentration of 1 × 10⁶ cells/mL in ice-cold buffer (140 mM NaCl, 2.5 mM CaCl2, 10 mM 2-[4-(2-hydroxyetyl)-1-piperazinyl] ethanesulfonic acid (HEPES)/NaOH, pH 7.4). Annexin V-FITC (5 μL) and 50 µg/mL propidium iodide (PI) solution (1 μL) were added to the 100 μL cell suspension and incubated for 15 min in the dark. The reaction solution was diluted five-fold in the same buffer and then analyzed using fluorescence activated cell sorting (FACS) Calibur™ (Becton Dickinson, Franklin Lakes, NJ, USA). Apoptotic cells were defined as those that were annexin V-FITC-positive and PI-negative.
5.5. Measurement of Intracellular Trace Elements
NS and US cells were lysed by addition of 1% sodium dodecyl sulfate (5 mL). After pouring the cell lysate (4.7 mL) into a nitric acid-treated tall beaker, the lysate was evaporated completely on a hot plate at 170 °C. Upon addition, in turn, of nitric acid, perchloric acid, and hydrogen peroxide to the residue, the residue was dried under the same conditions as described above. Three cycles of the same operation were performed for complete incineration of the sample.
The incinerated sample was lysed by addition of nitric acid (9 mL), and the concentrations of intracellular Mg, Ca, Mn, and Zn were determined by inductively coupled plasma-mass spectrometry (ICP-MS, Agilent 7700, Agilent Technologies Japan, Ltd., Tokyo, Japan). Prepared calibration standard samples were 0, 5, 10, 50, 100, and 500 ppb. The overall relationship among the standards was best described by a linear relationship (r2 > 0.999).
5.6. Measurement of mRNA
NS and US cells were lysed by addition of RNAzol
®RT Reagent (1 mL, Molecular Research Center, Inc., Cincinnati, OH, USA). After adding diethyl pyrocarbonate-treated water (400 µL) to the cell lysates, they were vortex mixed for 15 s, left at room temperature for 15 min, and centrifuged at 12,000×
g at 25 °C for 15 min. After adding isopropanol (1 mL) to the supernatant (1 mL), the supernatant was left at room temperature for 10 min. RNA precipitate formed a pellet upon centrifugation at 12,000×
g at 25 °C for 15 min. The residue was removed from the supernatant and was washed twice using 75% ethanol (500 µL). After washing, RNase-free water (50 µL) was added to the residue, and the RNA in the residue was quantified spectrophotometrically at 260 nm using a DU
®730 (Becton Dickinson). RNA quantity was calculated using the formula
The RNA solutions were diluted to 100 µg/mL with RNase-free water and stored at −80 °C.
Reverse transcriptase polymerase chain reaction (RT-PCR) was performed using ReverTra Ace
® qPCR (Toyobo, Ltd., Osaka, Japan). For preparation of cDNA, the total reaction volume per sample was 20 µL (9 µL of nuclease-free water, 4 µL of 5× RT buffer, 1 µL of RT enzyme mix, 1 µL of primer mix, 5 µL of RNA). RT-PCR was performed using an i-Cycler iQ (Bio-Rad Laboratories, Inc., Hercules, CA, USA) with 37 °C for 15 min (reverse transcription reaction), 98 °C for 5 min (inactivation of reverse transcriptase), and then 4 °C (cooling). DNA was amplified in a total reaction solution volume of 20 µL (7.16 µL of sterile distilled water, 10 µL of Thunderbird
THSYBR
® qPCR Mix (Toyobo), 0.4 µL of 10 µM sense primer, 0.4 µL of 10 µM antisense primer, 0.04 µL of 50× ROX reference dye (Toyobo), 2 µL of RT sample). Real-time PCR was performed using a LightCycler
® Nano System (Roche Diagnostics K.K., Tokyo, Japan). The initial denaturation was 95 °C for 1 min and was followed by 45 cycles of amplification, with a thermal cycling profile of 95 °C for 10 s and 60 °C for 30 s. Beta-2-microglobulin (β2M) was used as a housekeeping gene. Primer sequences are specified in
Table 3.
CT was calculated using the fluorescence intensity of SYBR® Green I, and the amount of target mRNA relative to β2M mRNA was expressed as 2−⊿CT, where ⊿CT is the value obtained by subtracting the CT value of β2M mRNA from the CT value of the target mRNA.
5.7. Statistical Analysis
Measured values and LC50 values were expressed as mean ± standard deviation (S.D.) and median (95% confidence intervals), respectively. Non-overlapping confidence intervals of LC50 were considered statistically significant. The significant differences between groups were determined using unpaired Student’s t-test or non-repeated measures analysis of variance (ANOVA) followed by Tukey–Kramer multiple comparison test. A p value less than 0.05 was considered statistically significant.

 ,
, 


