The Effect of the Sodium to Potassium Ratio on Hypertension Prevalence: A Propensity Score Matching Approach


Abstract
:
1. Introduction
2. Data and Methods
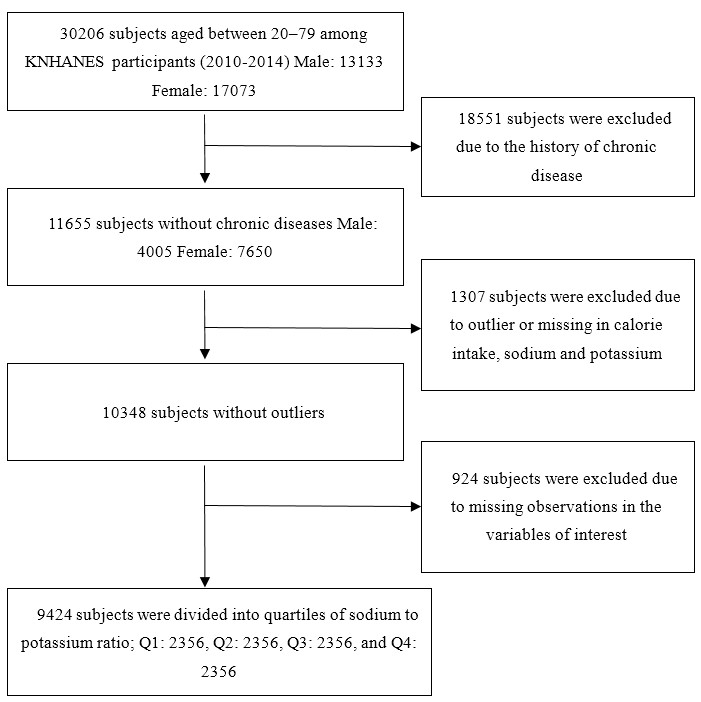
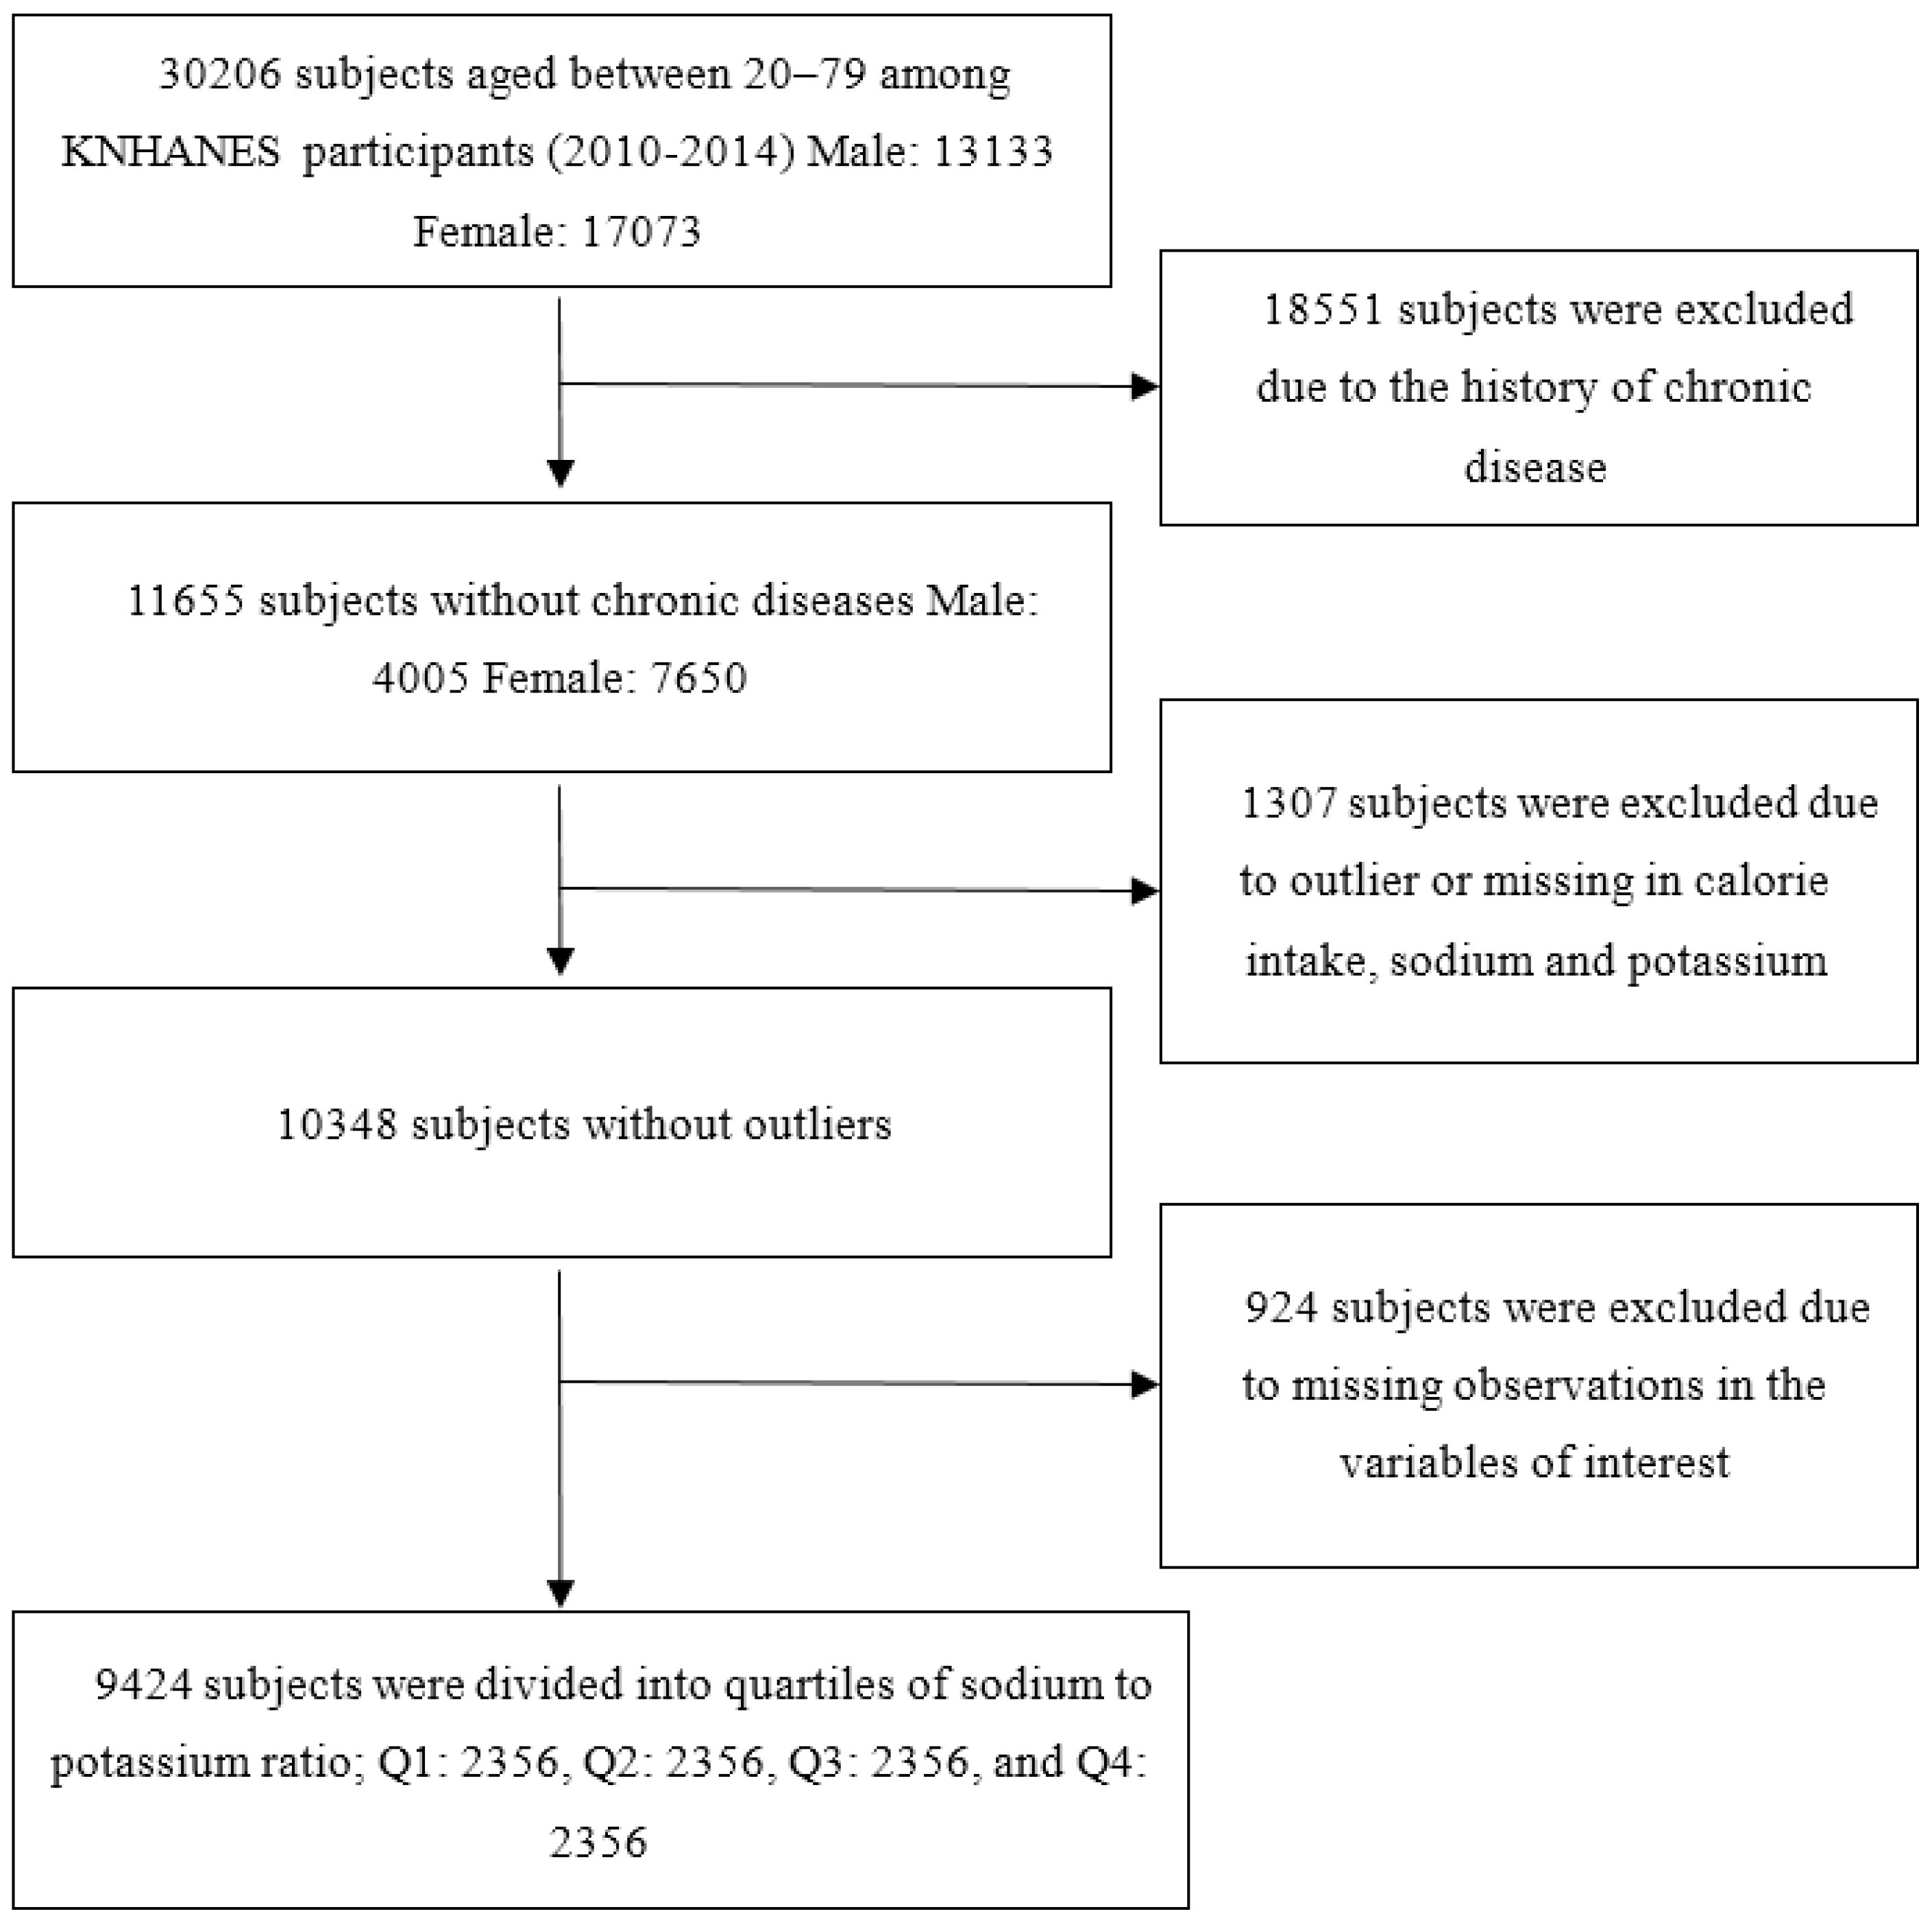
2.1. Study Population
2.2. Study Measures
2.3. Statistical Analyses
3. Results
3.1. General Characteristics of the Study Population
3.2. The Effect of the Sodium to Potassium Ratio on Hypertension Prevalence
3.3. The Effect of the Sodium to Potassium Ratio on Blood Pressure
4. Discussion and Conclusions
Acknowledgments
Author Contributions
Conflicts of Interest
References
- Korean Centers for Disease Control and Prevention, 2013 National Health Statistics. Available online: https://knhanes.cdc.go.kr/knhanes/sub01/sub01_05.jsp#s5_01_05 (accessed on 25 November 2015).
- National Health Insurance Service. The Yearbook of Health Insurance Statistics. Available online: http://www.nhis.or.kr/bbs7/attachments/16690 (accessed on 25 November 2015).
- Institute of Medicine. Sodium Intake in Populations: Assessment of Evidence; The National Academies Press: Washington, DC, USA, 2013. [Google Scholar]
- Mente, A.; O’Donnell, M.; Rangarajan, S.; Dagenais, G.; Lear, S.; McQueen, M.; Diaz, R.; Avezum, A.; Lopez-Jaramillo, P.; Lanas, F.; et al. Associations of urinary sodium excretion with cardiovascular events in individuals with and without hypertension: A pooled analysis of data from four studies. Lancet 2016. [Google Scholar] [CrossRef]
- Graudal, N.; Jürgens, G.; Baslund, B.; Alderman, M.H. Compared with usual sodium intake, low- and excessive sodium diets are associated with increased mortality: A meta-analysis. Am. J. Hypertens. 2014, 27, 1129–1137. [Google Scholar] [CrossRef] [PubMed]
- Graudal, N. Dietary sodium: Where science and policy conflicts: Impact of the 2013 IOM Report on Sodium intake in population. Curr. Hypertens. Rep. 2015, 17, 9. [Google Scholar] [CrossRef] [PubMed]
- Cogswell, M.E.; Musgavero, K.; Bowman, B.A.; Frieden, T.R. Dietary sodium and cardiovascular disease risk-Measurement matters. N. Engl. J. Med. 2016. [Google Scholar] [CrossRef] [PubMed]
- He, F.J.; Li, J.; MacGregor, G.A. Effect of longer term modest salt reduction on blood pressure: Cochrane systematic review and meta-analysis of randomised trials. BMJ 2013, 346, 1325. [Google Scholar] [CrossRef] [PubMed]
- Du, S.; Batis, C.; Wang, H.; Zhang, B.; Zhang, J.; Popkin, B.M. Understanding the patterns and trends of sodium intake, potassium intake, and sodium to potassium ratio and their effect on hypertension in China. Am. J. Clin. Nutr. 2014, 99, 334–343. [Google Scholar] [CrossRef] [PubMed]
- Mente, A.; O’Donnell, M.J.; Rangarajan, S.; McQueen, M.J.; Poirier, P.; Wielgosz, A.; Morrison, H.; Li, W.; Wang, X.; Di, C.; et al. Association of urinary sodium and potassium excretion with blood pressure. N. Engl. J. Med. 2014, 371, 601–611. [Google Scholar] [CrossRef] [PubMed]
- Zhang, Z.; Cogswell, M.; Gillespie, C.; Fang, J.; Loustalot, F.; Dai, S.; Carriquiry, A.L.; Kuklina, E.V.; Hong, Y.; Merritt, R.; et al. Association between usual sodium and potassium intake and blood pressure and hypertension among U.S. adults: NHANES 2005–2010. PLoS ONE 2013, 8, e75289. [Google Scholar] [CrossRef] [PubMed]
- Huggins, C.E.; O’Reilly, S.; Brinkman, M.; Hodge, A.; Giles, G.G.; English, D.R.; Nowson, C.A. Relationship of urinary sodium and sodium-to-potassium ratio to blood pressure in older adults in Australia. Med. J. Aust. 2011, 195, 128–132. [Google Scholar] [PubMed]
- Park, J.; Lee, J.S.; Kim, J. Relationship between dietary sodium, potassium, and calcium, anthropometric indexes, and blood pressure in young and middle aged Korean adults. Nutr. Res. Pract. 2010, 4, 155–162. [Google Scholar] [CrossRef] [PubMed]
- Ducher, M.; Fauvel, J.P.; Maurin, M.; Laville, M.; Maire, P.; Paultre, C.Z.; Cerutti, C. Sodium intake and blood pressure in healthy individuals. J. Hypertens. 2003, 21, 289–294. [Google Scholar] [CrossRef] [PubMed]
- Kim, M.K.; Kim, K.; Shin, M.H.; Shin, D.H.; Lee, Y.H.; Chun, B.Y.; Choi, B.Y. The relationship of dietary sodium, potassium, fruits, and vegetables intake with blood pressure among Korean adults aged 40 and older. Nutr. Res. Pract. 2014, 8, 453–462. [Google Scholar] [CrossRef] [PubMed]
- Perez, V.; Chang, E.T. Sodium-to-Potassium Ratio and Blood Pressure, Hypertension, and Related Factors. Adv. Nutr. 2014, 5, 712–741. [Google Scholar] [CrossRef] [PubMed]
- Sacks, F.M.; Svetkey, L.P.; Vollmer, W.M.; Appel, L.J.; Bray, G.A.; Harsha, D.; Obarzanek, E.; Conlin, P.R.; Miller, E.R.; Simons-Morton, D.G.; et al. Effects on blood pressure of reduced dietary sodium and the Dietary Approaches to Stop Hypertension (DASH) diet. DASH-Sodium Collaborative Research Group. N. Engl. J. Med. 2001, 344, 3–10. [Google Scholar] [CrossRef] [PubMed]
- Intersalt Cooperative Research Group. Intersalt: An international study of electrolyte excretion and blood pressure: Results for 24 hour urinary sodium and potassium excretion. BMJ 1988, 297, 319–328. [Google Scholar]
- Hedayati, S.S.; Minhajuddin, A.T.; Ijaz, A.; Elsayed, E.F.; Reilly, R.F.; Huang, C.L. Association of urinary sodium/potassium ratio with blood pressure: Sex and racial differences. Clin. J. Am. Soc. Nephrol. 2012, 7, 315–322. [Google Scholar] [CrossRef] [PubMed]
- Adrogué, H.J.; Madias, N.E. Sodium and potassium in the pathogenesis of hypertension. N. Engl. J. Med. 2007, 356, 1966–1978. [Google Scholar] [CrossRef] [PubMed]
- Haddy, F.J.; Vanhoutte, P.M.; Feletou, M. Role of potassium in regulating blood flow and blood pressure. Am. J. Physiol. Regul. Integr. Comp. Physiol. 2006, 290, 546–552. [Google Scholar] [CrossRef] [PubMed]
- Cobb, L.K.; Anderson, C.; Elliott, P.; Hu, F.B.; Liu, K.; Neaton, J.D.; Whelton, P.K.; Woodward, M.; Appel, L.J. Methodological issues in cohort studies that relate sodium intake to cardiovascular disease outcomes: A science advisory from the American Heart Association. Circulation 2014, 129, 1173–1186. [Google Scholar] [CrossRef] [PubMed]
- Kweon, S.; Kim, Y.; Jang, M.J.; Kim, Y.; Kim, K.; Choi, S.; Chun, C.; Khang, Y.; Oh, K. Data Resource Profile: The Korea National Health and Nutrition Examination Survey. Int. J. Epidemiol. 2014, 43, 69–77. [Google Scholar] [CrossRef] [PubMed]
- Baek, Y.; Hwang, J.Y.; Kim, K.; Moon, H.K.; Kweon, S.; Yang, J.; Oh, K.; Shim, J.E. Dietary intake of fats and fatty acids in the Korean population: Korea National Health and Nutrition Examination Survey 2013. Nutr. Res. Pract. 2015, 9, 650–657. [Google Scholar] [CrossRef] [PubMed]
- Kwock, C.K.; Park, J. Dietary patterns and body mass indices among adults in Korea: Evidence from the pseudo panel data. Agric. Econ. 2015, 46, 163–172. [Google Scholar] [CrossRef]
- Brown, I.J.; Elliott, P.; Robertson, C.E.; Chan, Q.; Daviglus, M.L.; Dyer, A.R.; Huang, C.C.; Rodriguez, B.L.; Sakata, K.; Ueshima, H. Dietary starch intake of individuals and their blood pressure: The INTERMAP study. J. Hypertens. 2009, 27, 231–236. [Google Scholar] [CrossRef] [PubMed]
- Schulze, M.B.; Fung, T.T.; Manson, J.E.; Willett, W.C.; Hu, F.B. Dietary patterns and changes in body weight in women. Obesity 2006, 14, 1444–1453. [Google Scholar]
- Hu, F.B.; Rimm, E.B.; Stampfer, M.J.; Ascherio, A.; Spiegelman, D.; Willett, W.C. Prospective study of major dietary patterns and risk of coronary heart disease in men. Am. J. Clin. Nutr. 2000, 72, 912–921. [Google Scholar] [PubMed]
- Wirfält, A.K.E.; Jeffery, R.W. Using cluster analysis to examine dietary patterns: Nutrient intakes, gender, and weight status differ across food pattern clusters. J. Am. Diet. Assoc. 1997, 97, 272–279. [Google Scholar] [CrossRef]
- Jepsen, P.; Johnsen, S.P.; Gillman, M.W.; Sorensen, H.T. Interpretation of observational studies. Heart 2004, 90, 956–960. [Google Scholar] [CrossRef] [PubMed]
- Foster, E.M. Propensity Score Matching: An Illustrative Analysis of Dose Response. Med. Care 2003, 41, 1183–1192. [Google Scholar] [CrossRef] [PubMed]
- Haukoos, J.S.; Lewis, R.J. The propensity score. JAMA 2015, 314, 1637–1638. [Google Scholar] [CrossRef] [PubMed]
- Rosenbaum, P.R.; Rubin, D.B. The central role of the propensity score in observational studies for causal effects. Biometrika 1983, 70, 41–55. [Google Scholar] [CrossRef]
- Becker, S.O.; Ichino, A. Estimation of average treatment effects based on propensity score. Stata J. 2002, 2, 358–377. [Google Scholar]
- Rosenbaum, P.R.; Rubin, D.B. Constructing a control group using multivariate matched sampling methods that incorporate the propensity score. Am. Stat. 1985, 39, 33–38. [Google Scholar]
- Caliendo, M.; Kopeinig, S. Some practical guidance for the implementation of propensity score matching. J. Econ. Surv. 2008, 22, 31–72. [Google Scholar] [CrossRef]
- Sianesi, B. An evaluation of the Swedish system of active labour market programmes in the 1990s. Rev. Econ. Stat. 2004, 86, 133–155. [Google Scholar] [CrossRef]
- Lechner, M. Program heteogeneity and propensity score matching: An application to the evaluation of active labor market policies. Rev. Econ. Stat. 2003, 84, 205–220. [Google Scholar] [CrossRef]
- National Institute of Health. Risk Factors for High Blood Pressure. 2015. Available online: http://www.nhlbi.nih.gov/health/health-topics/topics/hbp/atrisk (accessed on 15 December 2015). [Google Scholar]
- StataCorp. STATA Release 12; StataCorp.: College Station, TX, USA, 2012. [Google Scholar]
- World Health Organization. Guideline: Potassium Intake for Adults and Children; World Health Organization: Geneva, Switzerland, 2012. [Google Scholar]
- Haddy, F.; Pamnani, M. Role of dietary salt in hypertension. J. Am. Coll. Nutr. 1995, 14, 428–438. [Google Scholar] [CrossRef] [PubMed]
- Das, U.N. Nutritional factors in the pathobiology of human essential hypertension. Nutrition 2001, 17, 337–346. [Google Scholar] [CrossRef]
- Stein, P.; Black, H. The role of diet in the genesis and treatment of hypertension. Med. Clin. N. Am. 1993, 77, 831–847. [Google Scholar] [CrossRef]
- Whelton, P.; He, J.; Culter, J.; Brancati, F.; Appel, L.; Follmann, D.; Klag, M. Effects of oral potassium on blood pressure: Meta-analysis of randomized controlled clinical trials. JAMA 1997, 277, 1624–1632. [Google Scholar] [CrossRef] [PubMed]
- Cook, N.R.; Obarzanek, E.; Cutler, J.A.; Buring, J.E.; Rexrode, K.M.; Kumanytka, S.K. Joint effects of sodium and potassium intak on subsequent cardiovascular disease. Arch. Intern. Med. 2009, 169, 32–40. [Google Scholar] [CrossRef] [PubMed]
- Baik, I.; Lee, M.; Jun, N.R.; Lee, J.Y.; Shin, C. A healthy dietary pattern consisting of a variety of food choices is inversely associated with the development of metabolic sysdrome. Nutr. Res. Pract. 2013, 7, 233–241. [Google Scholar] [CrossRef] [PubMed]
- Newby, P.K.; Muller, D.; Hallfrisch, J.; Qiao, N.; Andres, R.; Tucker, K. Dietary patterns and changes in body mass index and waist circumference in adults. Am. J. Clin. Nutr. 2003, 77, 1417–1425. [Google Scholar] [PubMed]
- Laatikainen, T.; Pietinen, P.; Valsta, L.; Sundvall, J.; Reinivuo, H.; Tuomilehto, J. Sodium in the Finnish diet: 20-year trends in urinary sodium excretion among the adult population. Eur. J. Clin. Nutr. 2006, 60, 965–970. [Google Scholar] [CrossRef] [PubMed]
- Whelton, P.K.; Appel, L.J.; Sacco, R.L.; Anderson, C.A.M.; Antman, E.M.; Campbell, N. Sodium, blood pressure, and cardiovascular disease: Further evidence supporting the American Heart Association Sodium reduction recommendations. Circulation 2013, 126, 2880–2889. [Google Scholar] [CrossRef] [PubMed]
- Schröder, H.; Schmelz, E.; Marrugat, J. Relationship between diet and blood pressure in a representative Mediterranean population. Eur. J. Nutr. 2002, 41, 161–167. [Google Scholar] [CrossRef] [PubMed]
- Institute of Medicine. Dietary Reference Intakes for Water, Potassium Sodium Chloride, and Sulfate; The National Academies Press: Washington, DC, USA, 2004. [Google Scholar]
- Franco, V.; Oparil, S. Salt sensitivity, a determinant of blood pressure, cardiovascular disease and survival. J. Am. Coll. Nutr. 2006, 25, 247–255. [Google Scholar] [CrossRef]
- Kelly, T.N.; Rice, T.K.; Gu, D.; Hixson, J.E.; Chen, J.; Liu, D.; Jaquish, C.E.; Bazzano, L.A.; Hu, D.; Ma, J.; et al. Novel genetic variants in the alpha-adducin and guanine nucleotide binding protein beta-polypeptide 3 genes and salt sensitivity of blood pressure. Am. J. Hypertens. 2009, 22, 985–992. [Google Scholar] [CrossRef] [PubMed]
- Gu, D.; Kelly, T.N.; Hixson, J.E.; Chen, J.; Liu, D.; Chen, J.C.; Rao, D.C.; Mu, J.; Ma, J.; Jaquish, C.E.; et al. Genetic variants in the renin-angiotensin-aldosterone system and salt sensitivity of blood pressure. J. Hypertens. 2010, 28, 1210–1220. [Google Scholar] [CrossRef] [PubMed]


| Variables | Definitions | Mean a (n = 9424) |
|---|---|---|
| Sodium intake | The quantity of sodium intake per day (mg/day) | 4533.17 ± 30.24 |
| Potassium intake | The quantity of potassium intake per day (mg/day) | 3104.64 ± 15.97 |
| Sodium to potassium ratio | The quantity of sodium intake divided by the quantity of potassium intake (Na/K) | 1.54 ± 0.01 |
| Hypertension (%) | 1 if systolic blood pressure ≥140 mmHg, diastolic blood pressure ≥90 mmHg or currently taking hypertension medications, 0 otherwise. | 19.56 |
| Body mass index | The body weight divided by the square of height (kg/m2) | 22.87 ± 0.03 |
| Walking exercise | Time spent walking per day (hours/day) | 0.67 ± 0.01 |
| Smoking status (%) | 1 if a subject is currently smoking, 0 otherwise | 14.51 |
| Drinking status (%) | 1 if a subject drinks a glass or more/month for the last 1 year, 0 otherwise | 53.28 |
| Daily stress level (%) | 1 if a subject reports “high” or “very high” levels of usual stress, 0 otherwise | 24.49 |
| Use of nutrition label (%) | 1 if a subject reads the nutrition label, 0 otherwise | 30.19 |
| Family history of hypertension (%) | 1 if a subject’s father, mother, or siblings have ever been diagnosed with hypertension, 0 otherwise | 37.37 |
| Female (%) | 1 if sex is female, 0 otherwise | 68.19 |
| Age | Age (years) | 46.12 ± 0.16 |
| Marital status (%) | 1 if unmarried, 0 otherwise | 15.86 |
| Manual worker (%) | 1 if a subject has a manual job, 0 otherwise | 22.50 |
| Household Income | Monthly household income (million won/month) | 446.57 ± 8.05 |
| Education | Schooling year: elementary school graduation = 6, middle school graduation = 9, high school graduation = 12, university = 16 | 12.30 ± 0.04 |
| Variables | Q1 | Q2 | Q3 | Q4 | p-Difference | p-Trend a |
|---|---|---|---|---|---|---|
| n | 2356 | 2356 | 2356 | 2356 | ||
| (Sodium and potassium variables) | ||||||
| Sodium intake (mg/day) | 2578.22 | 3783.20 | 4770.62 | 7000.64 | 0.000 b | (+) 0.000 |
| Potassium intake (mg/day) | 3638.99 | 3113.01 | 2919.98 | 2746.57 | 0.000 b | (−) 0.000 |
| Sodium to potassium ratio (Na/K) | 0.74 | 1.22 | 1.64 | 2.57 | 0.000 b | (+) 0.000 |
| (Health-related variables) | ||||||
| Hypertension (%) | 19.27 | 18.00 | 19.44 | 21.52 | 0.023 | (+) 0.025 |
| Body mass index (kg/m2) | 22.88 | 22.78 | 22.87 | 22.93 | 0.438 | (+) 0.668 |
| Walking exercise | 0.71 | 0.65 | 0.67 | 0.67 | 0.270 | (−) 0.001 |
| Smoking status (%) | 9.00 | 13.92 | 16.72 | 18.38 | 0.000 | (+) 0.000 |
| Drinking status (%) | 44.57 | 54.07 | 57.60 | 56.88 | 0.000 | (+) 0.000 |
| Daily stress level (%) | 22.71 | 23.64 | 25.47 | 26.15 | 0.022 | (+) 0.002 |
| Use of nutrition label (%) | 31.96 | 30.35 | 31.62 | 26.83 | 0.000 | (−) 0.001 |
| Family history of hypertension (%) | 39.26 | 37.61 | 38.37 | 34.25 | 0.002 | (−) 0.001 |
| (Socio-demographic variables) | ||||||
| Female (%) | 77.42 | 68.42 | 64.52 | 62.39 | 0.000 | (−) 0.000 |
| Age (year) | 48.17 | 45.62 | 44.70 | 45.99 | 0.000 | (−) 0.000 |
| Marital status (%) | 13.88 | 15.15 | 17.83 | 16.60 | 0.001 | (+) 0.001 |
| Manual worker (%) | 18.97 | 21.86 | 23.09 | 26.06 | 0.000 | (+) 0.000 |
| Household income (million won/month) | 4.53 | 4.52 | 4.54 | 4.27 | 0.588 | (−) 0.000 |
| Education (year) | 12.15 | 12.39 | 12.49 | 12.15 | 0.001 | (+) 0.757 |
| (Other dietary variables) | ||||||
| Energy intake (kcal/day) | 1886.51 | 1992.44 | 2025.98 | 2016.89 | 0.000 | (+) 0.000 |
| Protein intake (g/day) | 64.76 | 71.97 | 74.26 | 73.96 | 0.000 | (+) 0.000 |
| Fat intake (g/day) | 36.54 | 43.45 | 45.81 | 45.01 | 0.000 | (+) 0.000 |
| Carbohydrate intake (g/day) | 321.50 | 316.61 | 310.31 | 309.18 | 0.001 | (−) 0.007 |
| Fiber intake (g/day) | 9.43 | 7.17 | 6.86 | 7.12 | 0.000 | (−) 0.000 |
| Cereals and cereal products (kcal/day) | 891.22 | 1008.12 | 1029.62 | 1083.04 | 0.000 | (+) 0.000 |
| Potatoes and starches (kcal/day) | 86.91 | 41.56 | 32.34 | 19.73 | 0.000 | (−) 0.000 |
| Vegetables (kcal/day) | 83.87 | 87.56 | 88.01 | 91.44 | 0.001 | (+) 0.000 |
| Fruits (kcal/day) | 174.04 | 103.45 | 75.99 | 57.96 | 0.000 | (−) 0.000 |
| Meat and meat products (kcal/day) | 133.22 | 189.94 | 208.58 | 199.43 | 0.000 | (+) 0.000 |
| Variables | Q1 vs. Q2 | Q1 vs. Q3 | Q1 vs. Q4 | Q2 vs. Q3 | Q2 vs. Q4 | Q3 vs. Q4 | ||||||
|---|---|---|---|---|---|---|---|---|---|---|---|---|
| Control | Treatment | Control | Treatment | Control | Treatment | Control | Treatment | Control | Treatment | Control | Treatment | |
| n | 1970 | 1970 | 1897 | 1897 | 1859 | 1859 | 2188 | 2188 | 2103 | 2103 | 2183 | 2183 |
| Hypertension prevalence (%) | 17.56 | 18.58 | 17.13 | 19.87 | 18.77 | 22.22 | 17.64 | 20.11 | 18.12 | 21.07 | 20.43 | 19.65 |
| ATT (% point) | 1.02 | 2.74 | 3.44 | 2.47 | 2.95 | −0.78 | ||||||
| p-value a | 0.204 | 0.015 | 0.005 | 0.019 | 0.008 | 0.260 | ||||||
| Change in hypertension prevalence per unit change of sodium to potassium ratio (% points) | 2.16 | 3.08 | 1.89 | 5.88 | 2.18 | −0.84 | ||||||
| Sodium to potassium ratio (Na/K) | 0.74 | 1.21 | 0.74 | 1.64 | 0.74 | 2.56 | 1.22 | 1.63 | 1.22 | 2.57 | 1.64 | 2.56 |
| Sodium intake (mg/day) | 2588.94 | 3692.91 | 2610.23 | 4628.49 | 2594.76 | 6737.10 | 3813.46 | 4725.11 | 3799.56 | 6932.19 | 4762.82 | 7023.80 |
| Potassium intake (mg/day) | 3641.10 | 3050.27 | 3641.29 | 2833.01 | 3629.11 | 2652.12 | 3139.32 | 2893.91 | 3126.56 | 2721.18 | 2914.06 | 2768.39 |
| Variables | Q1 vs. Q2 | Q1 vs. Q3 | Q1 vs. Q4 | |||||||||
| % Bias | p-Value a | % Bias | p-Value | % Bias | p-Value | |||||||
| Before | After | Before | After | Before | After | Before | After | Before | After | Before | After | |
| Body mass index | −3.0 | −1.6 | 0.295 | 0.625 | −0.3 | −0.7 | 0.905 | 0.824 | 1.8 | 0.3 | 0.544 | 0.938 |
| Walking exercise | −5.5 | 0.4 | 0.058 | 0.891 | −3.7 | 0.6 | 0.202 | 0.850 | −4.1 | 0.1 | 0.164 | 0.971 |
| Smoking status | 15.5 | −0.6 | 0.000 | 0.834 | 23.2 | −2.5 | 0.000 | 0.395 | 27.5 | −2.7 | 0.000 | 0.369 |
| Drinking status | 18.2 | −3.4 | 0.000 | 0.293 | 26.3 | −1.9 | 0.000 | 0.559 | 24.8 | 2.1 | 0.000 | 0.533 |
| Daily stress level | 2.2 | −0.8 | 0.448 | 0.791 | 6.5 | 1.4 | 0.027 | 0.676 | 8.0 | 0.3 | 0.006 | 0.940 |
| Use of nutrition label | −3.5 | 3.5 | 0.232 | 0.274 | −0.7 | 0.3 | 0.802 | 0.918 | −11.3 | 1.9 | 0.000 | 0.565 |
| Family history of hypertension | −3.4 | 0.8 | 0.243 | 0.793 | −1.8 | 1.4 | 0.530 | 0.665 | −10.4 | 1.6 | 0.000 | 0.634 |
| Female | −20.3 | 4.6 | 0.000 | 0.141 | −28.7 | 2.5 | 0.000 | 0.435 | −33.2 | 3.1 | 0.000 | 0.334 |
| Age | −17.2 | 0.2 | 0.000 | 0.945 | −23.4 | 1.7 | 0.000 | 0.598 | −14.3 | −1.6 | 0.000 | 0.627 |
| Marital status | 3.6 | −0.3 | 0.215 | 0.928 | 10.8 | −2.0 | 0.000 | 0.532 | 7.6 | 0.6 | 0.009 | 0.853 |
| Manual worker | 7.2 | −0.4 | 0.014 | 0.904 | 10.1 | 0.1 | 0.001 | 0.968 | 17.0 | −2.7 | 0.000 | 0.398 |
| Household Income | −0.2 | 1.2 | 0.952 | 0.708 | 0.1 | −1.0 | 0.982 | 0.766 | −3.7 | 3.1 | 0.205 | 0.303 |
| Education | 6.7 | −1.3 | 0.021 | 0.691 | 9.3 | −1.1 | 0.001 | 0.725 | −0.0 | 1.7 | 0.997 | 0.613 |
| Pseudo R2 | p > LRb (χ2) | Pseudo R2 | p > LR (χ2) | Pseudo R2 | p > LR (χ2) | |||||||
| Over-all balance tests | 0.022 | 0.001 | 0.000 | 0.979 | 0.037 | 0.000 | 0.000 | 1.000 | 0.041 | 0.001 | 0.000 | 0.993 |
| Variables | Q2 vs. Q3 | Q2 vs. Q4 | Q3 vs. Q4 | |||||||||
| % Bias | p-Value a | % Bias | p-Value | % Bias | p-Value | |||||||
| Before | After | Before | After | Before | After | Before | After | Before | After | Before | After | |
| Body mass index | 2.7 | −0.6 | 0.362 | 0.837 | 4.7 | −2.2 | 0.107 | 0.469 | 2.1 | −0.5 | 0.475 | 0.856 |
| Walking exercise | 1.8 | −0.6 | 0.541 | 0.841 | 1.3 | 1.4 | 0.655 | 0.643 | −0.4 | 1.6 | 0.884 | 0.602 |
| Smoking status | 7.8 | −3.0 | 0.008 | 0.301 | 12.1 | −7.4 | 0.000 | 0.011 | 4.4 | −2.0 | 0.135 | 0.495 |
| Drinking status | 7.1 | −3.5 | 0.015 | 0.247 | 5.6 | −0.5 | 0.053 | 0.877 | −1.5 | 2.8 | 0.617 | 0.358 |
| Daily stress level | 4.2 | −2.8 | 0.146 | 0.358 | 5.8 | 0.7 | 0.047 | 0.830 | 1.6 | −1.6 | 0.594 | 0.603 |
| Use of nutrition label | 2.8 | −1.2 | 0.345 | 0.696 | −7.8 | 0.3 | 0.007 | 0.919 | −10.6 | 0.4 | 0.000 | 0.894 |
| Family history of hypertension | 1.6 | −1.3 | 0.589 | 0.663 | −7.0 | −2.5 | 0.016 | 0.424 | −8.6 | 1.0 | 0.003 | 0.754 |
| Female | −8.3 | 3.7 | 0.005 | 0.221 | −12.7 | 4.7 | 0.000 | 0.123 | −4.4 | 0.5 | 0.130 | 0.875 |
| Age | −6.3 | 3.2 | 0.031 | 0.284 | 2.5 | 1.5 | 0.400 | 0.638 | 8.5 | −5.0 | 0.003 | 0.091 |
| Marital status | 7.2 | −5.2 | 0.013 | 0.078 | 3.9 | −0.8 | 0.175 | 0.799 | −3.3 | 1.3 | 0.263 | 0.662 |
| Manual worker | 2.9 | −0.7 | 0.312 | 0.828 | 9.9 | −3.3 | 0.001 | 0.272 | 6.9 | −5.0 | 0.018 | 0.092 |
| Household Income | 0.2 | 0.2 | 0.941 | 0.945 | −3.1 | 0.0 | 0.287 | 1.000 | −3.4 | 2.2 | 0.248 | 0.425 |
| Education | 2.7 | −0.5 | 0.347 | 0.881 | −6.8 | 0.4 | 0.020 | 0.896 | −9.4 | 5.7 | 0.001 | 0.055 |
| Pseudo R2 | p > LR (χ2) | Pseudo R2 | p > LR (χ2) | Pseudo R2 | p > LR (χ2) | |||||||
| Over-all balance tests | 0.004 | 0.001 | 0.036 | 0.900 | 0.007 | 0.002 | 0.000 | 0.638 | 0.004 | 0.001 | 0.008 | 0.790 |
| Models | Blood Pressure (mm Hg) | ATT (mm Hg) (Standard Error) | p-Value a | |
|---|---|---|---|---|
| Control | Treated | |||
| Systolic blood pressure | ||||
| Q1 vs. Q2 | 111.34 | 112.43 | 1.09 (0.51) | 0.017 |
| Q1 vs. Q3 | 111.05 | 111.93 | 0.88 (0.52) | 0.046 |
| Q1 vs. Q4 | 111.28 | 112.70 | 1.41 (0.54) | 0.005 |
| Q2 vs. Q3 | 112.14 | 112.31 | 0.17 (0.49) | 0.362 |
| Q2 vs. Q4 | 112.48 | 112.76 | 0.28 (0.50) | 0.292 |
| Q3 vs. Q4 | 112.93 | 112.60 | −0.33 (0.49) | 0.255 |
| Diastolic blood pressure | ||||
| Q1 vs. Q2 | 72.51 | 73.34 | 0.83 (0.32) | 0.005 |
| Q1 vs. Q3 | 72.44 | 72.63 | 0.19 (0.33) | 0.284 |
| Q1 vs. Q4 | 72.55 | 73.46 | 0.92 (0.34) | 0.004 |
| Q2 vs. Q3 | 73.44 | 73.11 | −0.33 (0.31) | 0.141 |
| Q2 vs. Q4 | 73.58 | 73.64 | 0.06 (0.32) | 0.426 |
| Q3 vs. Q4 | 73.44 | 73.74 | 0.30 (0.32) | 0.173 |
© 2016 by the authors; licensee MDPI, Basel, Switzerland. This article is an open access article distributed under the terms and conditions of the Creative Commons Attribution (CC-BY) license (http://creativecommons.org/licenses/by/4.0/).
Share and Cite
Park, J.; Kwock, C.K.; Yang, Y.J. The Effect of the Sodium to Potassium Ratio on Hypertension Prevalence: A Propensity Score Matching Approach. Nutrients 2016, 8, 482. https://doi.org/10.3390/nu8080482
Park J, Kwock CK, Yang YJ. The Effect of the Sodium to Potassium Ratio on Hypertension Prevalence: A Propensity Score Matching Approach. Nutrients. 2016; 8(8):482. https://doi.org/10.3390/nu8080482
Chicago/Turabian StylePark, Junhyung, Chang Keun Kwock, and Yoon Jung Yang. 2016. "The Effect of the Sodium to Potassium Ratio on Hypertension Prevalence: A Propensity Score Matching Approach" Nutrients 8, no. 8: 482. https://doi.org/10.3390/nu8080482