Article

Selection of the Optimal Herbal Compositions of Red Clover and Pomegranate According to Their Protective Effect against Climacteric Symptoms in Ovariectomized Mice

1
The Medical Research Center for Globalization of Herbal Medicine, Daegu Haany University, 1, Haanydaero, Gyeongsan, Gyeongsangbuk-Do 38610, Korea
2
Department of Preventive medicine, College of Korean Medicine, Daegu Haany University, 1, Haanydaero, Gyeongsan, Gyeongsangbuk-Do 38610, Korea
3
Research Institute, Health-Love Co., Ltd., Anyang 13946, Korea
4
Department of Histology and Anatomy, College of Korean Medicine, Daegu Haany University, 1, Haanydaero, Gyeongsan, Gyeongsangbuk-Do 38610, Korea
*
Authors to whom correspondence should be addressed.
These authors contributed equally to this work.
Nutrients 2016, 8(8), 447; https://doi.org/10.3390/nu8080447
Submission received: 4 December 2015 / Revised: 19 July 2016 / Accepted: 21 July 2016 / Published: 23 July 2016

Abstract

:
This study aimed to ascertain the optimal range of red clover dry extracts (RC) and dried pomegranate concentrate powder (PCP) to induce anti-climacteric effects. Thus, the dose ranges showing protective effect of mixed formulae consisting of RC and PCP were examined in ovariectomized mice. At 28 days after bilateral ovariectomy (OVX), mixed herbal compositions (RC:PCP = 1:1, 1:2, 1:4, 1:8, 2:1, 4:1, and 8:1) were administered orally, at 120 mg/kg once daily for 84 days. We evaluated that RC and PCP mixture attenuate OVX-caused obesity, hyperlipidemia, hepatic steatosis, and osteoporosis. Compared to OVX-induced control mice, body weight and abdominal fat weight in OVX-induced mice were significantly decreased, concomitantly with increase of uterus weight by RC:PCP mixture. Additionally, significant increases in serum estradiol levels were observed in all RC:PCP-treated mice. RC:PCP mixture also showed protective effect against OVX-induced hyperlipidemia, hepatic steatosis. Total body and femur mean bone mineral density (BMD), osteocalcin, bALP contents were effectively increased by RC:PCP mixture. Taken together, RC:PCP mixture (2:1, 1:1, and 4:1) has remarkable protective effects against the changes induced by OVX. In particular, RC:PCP mixture (2:1) shows the strongest effect and may be considered as a potential protective agent against climacteric symptoms.

Graphical Abstract

1. Introduction

During the climacteric period, many women between the ages of 40 and 65 years experience and complain of uncomfortable symptoms such as vasomotor symptoms, night sweats, cognitive impairment, insomnia, depression, and irritability [1,2]. In addition, body weight gain, fatigue and hot flashes are major symptoms characterized of menopause women. Many symptoms of menopause were closely associated with level of estrogen. These postmenopausal conditions are related to an increased risk of metabolic diseases, such as obesity, heart disease, diabetes, and hypertension, due to estrogen deficiency [3,4]. Additionally, estrogen deficiency is recognized as a common risk factor for osteoporosis. Estrogen deficiency is related to an atherogenic lipid profile, characterized by high density lipoprotein (HDL)-cholesterol, low density lipoprotein (LDL)-cholesterol, triglyceride levels [5], central adiposity [6], increased diastolic pressure [7], and increased insulin resistance [8]. Thus, for attenuating estrogen deficiency of menopausal symptoms, synthetic estrogens were administered to women during menopause. These hormones are as protective as estrogens in the reduction of symptoms [9,10,11].
As mentioned above, hormone therapy has been used to protect women against climacteric symptoms; however, long-term exposure can cause cardiovascular events and breast cancer [9,10,11]. Thus, phytosubstances from plants, as an alternative to hormone therapy, have attracted much attention [12,13,14]. They have similar structures to estrogens and can bind to estrogen receptors, and therefore were named phytoestrogens (PEs). Several PEs, plant-derived chemicals, act as free radical scavengers. Isoflavones, derived from soy and soy derivatives, are representative PEs. Genistein and daidzein are the most abundant and well studied. This class of PEs can also be found in clover. Purified phytohormones show improved activity in the body and enhanced bioavailability [12]. PEs can bind to estrogen receptors due to the presence of a phenolic ring and function like estrogens [12,13,15]. Coumestrol and the isoflavonoids genistein, daidzein, and their plant precursors are found mainly in soybeans and clover [16]. Isoflavones, especially those derived from plants, have various biological activities, can improve metabolic symptoms [17], and have bone-protective effects [18] during menopause. Recently, it has been suggested that various pharmacological effects of plant extracts can be enhanced synergistically by appropriate mixed formulations [19,20,21].
Red clover (RC, Trifolium pratense L.) shows estrogenic effects due to isoflavones and, to a lesser extent, coumestans [22]. Thus, RC botanical dietary supplements have been used for the treatment of menopausal symptoms, maintenance/improvement of cardiovascular health, and their reported benign effects on the breast, endometrium, and neural structures [23]. The isoflavonoids formononetin, biochanin A, genistein, and daidzain are present in RC as glycosides and malonates [24].
Pomegranates (Punica granatum L.) contain various flavonoids and anthocyanidins, and their main active substances are polyphenols, which show antioxidative, antimutagenic, antiinflammatory, and antimicrobial activities [25]. The phytoestrogenic effects of pomegranate [26] are due mainly to isoflavonoids via antioxidant and antiinflammatory pathways [15,27]. Recently, pomegranate extract has been shown to be a selective estrogen receptor modulator [28].
Based on the information above, we hypothesized that dried pomegranate concentrate powder (PCP) might potentiate the anti-climacteric effects of RC. Appropriate mixed formulations of RC and PCP may be expected to show more favorable synergistic anti-climacteric effects. Thus, this study aimed to ascertain the optimal range of RC + PCP to induce anti-climacteric effects. Additionally, we examined whether the anti-climacteric activity of RC could be enhanced by the addition of PCP in ovariectomized (OVX) mice.

2. Experimental Section

2.1. Animals and Husbandry

Kwl:ddY mice (virgin female specific pathogen-free outbred mice) (6 weeks old upon receipt) (Kiwa, Wakayama, Japan) were selected follow to the acclimatization for 16 days. The animals (4 mice per polycarbonate cage) were maintained with a controlled temperature (20–25 °C) and humidity (45%–55%) under 12-h:12-h light:dark cycles. Tap water and normal rodents pellet diet (Table 1; 38057; Purinafeed, Seungnam, Korea) were given ad libitum. All mice were placed in individual cages containing 150 g of diet and 250 mL of water and the remaining amounts were measured at 24 h after feed supply using an automatic electronic balance (Precisa Instruments) and a measuring cylinder (Pyrex, Corning, NY, USA), respectively. This was regarded as the individual daily food (g/24 h/mouse) and water (mL/24 h/mouse) rations [29]. All laboratory animals were controlled according to national regulations for the usage and welfare of laboratory animals and approved by the Institutional Animal Care and Use Committee of Daegu Haany University (Gyeongsan, Gyeongbuk, Korea) prior to the experiments (Approval No. DHU2014-020). In addition, experiments on osteoporosis were performed based on United States Food and Drug Administration guidelines [30].

2.2. Experimental Groups

The dose level of 120 mg/kg was selected as dosages of mixed formula consisted of RC:PCP on the clinical dosage in human (mouse dosage = about 12-fold that of human dosage; (600 mg/60 kg) × 12 = 120 mg/kg). The experimental groups were divided into the following 12 groups (8 mice per group): sham vehicle control (sham control); OVX-operated (OVX control); OVX-operated mice + 17β-estradiol (0.03 μg/head); OVX-operated mice + 120 mg/kg RC; OVX-operated mice + 120 mg/kg PCP; OVX-operated mice + 120 mg/kg RC:PCP 1:1 (60:60 mg/kg) mixture; OVX-operated mice + 120 mg/kg RC:PCP 1:2 (40:80 mg/kg) mixture; OVX-operated mice + 120 mg/kg RC:PCP 1:4 (24:96 mg/kg) mixture; OVX-operated mice + 120 mg/kg RC:PCP 1:8 (13:107 mg/kg) mixture; OVX-operated mice + 120 mg/kg RC:PCP 2:1 (80:40 mg/kg) mixture; OVX-operated mice + 120 mg/kg RC:PCP 4:1 (96:24 mg/kg) mixture; OVX-operated mice + 120 mg/kg RC:PCP 8:1 (107:13 mg/kg) (g/g) mixture.

2.3. Experimental Design

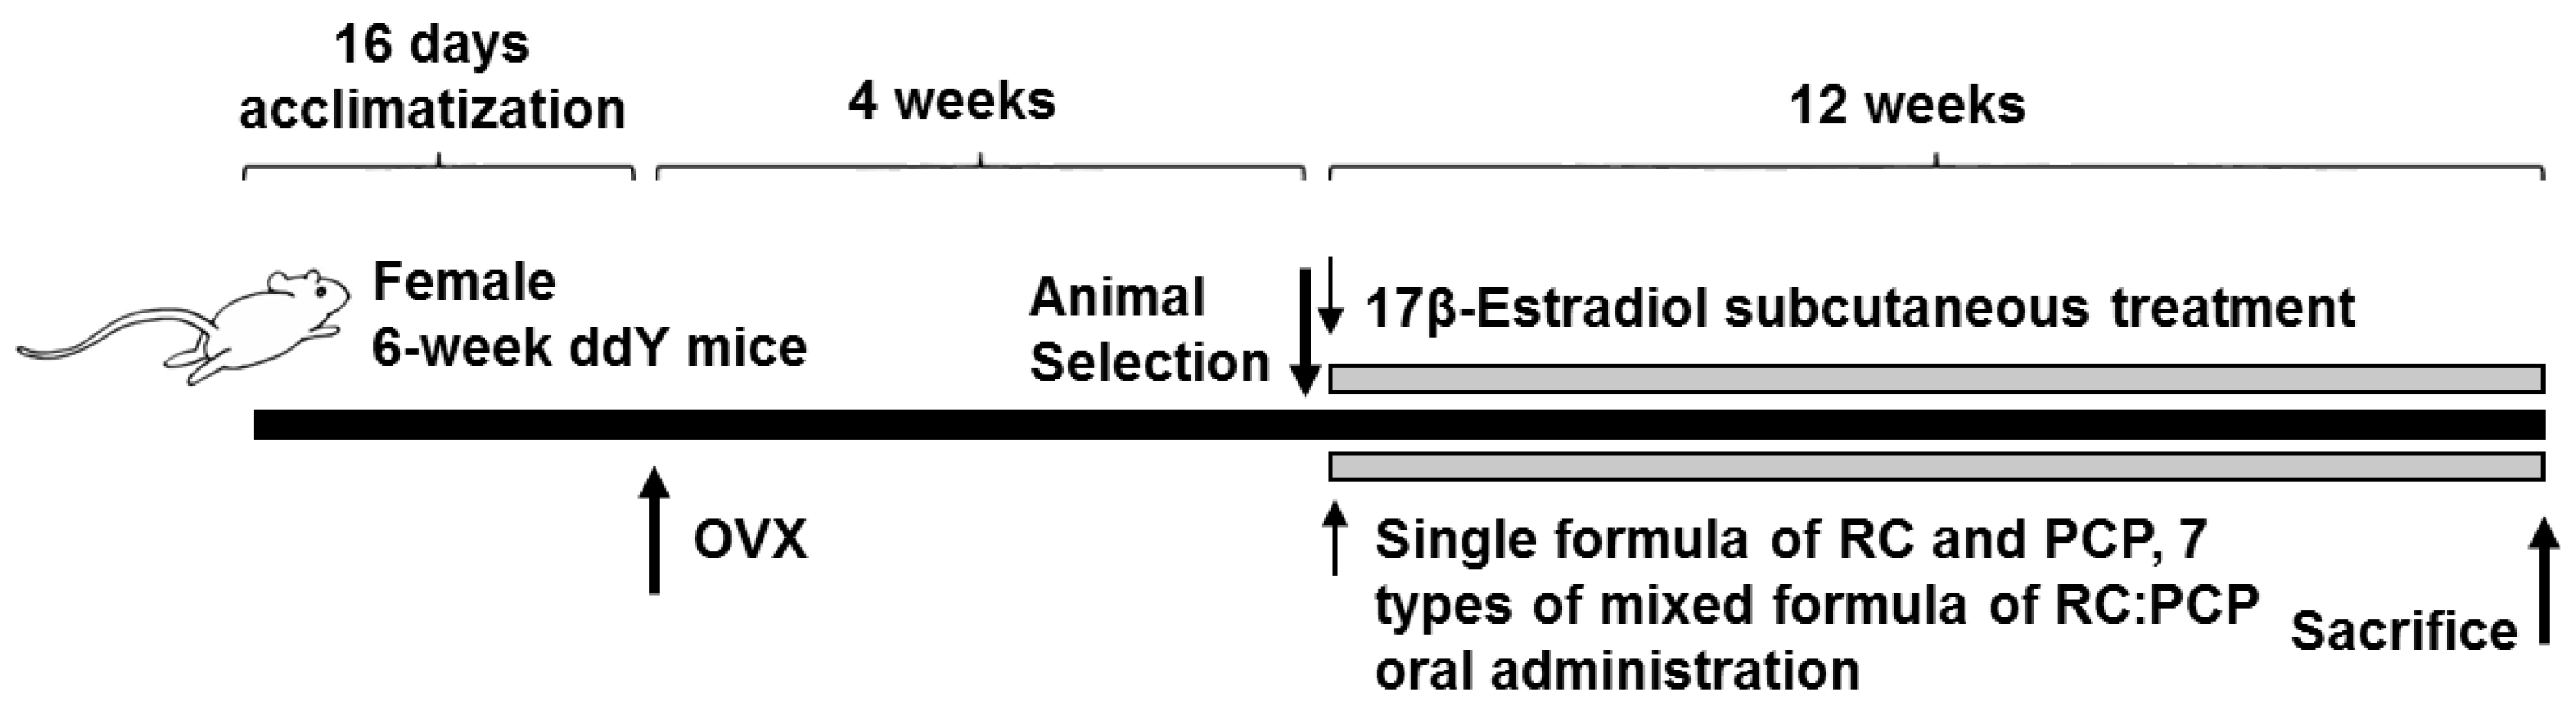
In the present study, Kwl:ddY mice (6 weeks old upon receipt) were prepared and ovariectomy was performed 16 days after acclimatization. Mice were anesthetized with an intraperitoneal injection of 25 mg/kg of Zoletile (Zoletile 50™; Virbac Laboratories, Carros, France) and maintained with 1%–1.5% isoflurane (Hana Pharmaceutical Co., Hwasung, Korea) in a mixture of 70% N2O and 28.5% O2. Surgery was conducted according to established methods [31]. The second group of mice underwent a sham operation in which a similar incision in the linea alba was made but bilateral ovariectomy was not performed.
At 28 days after surgery, 8 mice per group were selected based on body weight and RC (120 mg/kg), PCP (120 mg/kg), or an RC:PCP mixture (g/g) was administered orally once a day for 84 days. Standardized RC, PCP, and RC:PCP 1:1, 1:2, 1:4, 1:8, 2:1, 4:1, and 8:1 (g/g) mixture were provided by HEALTH-LOVE Co., Ltd. (Anyang, Korea). The RC substance contained 8% total isoflavones, 0.62% genistein, 5.43% biochanin A, 3.66% formononetin, and 0.47% daidzein suspended in 12 mg/mL of distilled water. The PCP substance contained 0.90 mg/g of ellagic acid dissolved in 12 mg/mL of distilled water. Appropriate amounts of RC, PCP, and the RC:PCP mixture (g/g) were directly suspended or dissolved in distilled water and administered in a volume of 10 mL/kg. In OVX and sham control mice, only distilled water was administered orally as a vehicle in equal volumes and periods instead of the herbal formulas. In addition, 17β-estradiol (Sigma-Aldrich, St. Louis, MO, USA) 0.03 μg was dissolved in 0.2 mL of sterilized saline, and subcutaneously treated on the dorsal back skins in a volume of 0.2 mL/mouse (0.03 μg/head/day). After 84 days of continuous oral administration, the mice were anesthetized with 50 mg/kg of Zoletile and dissected according to established methods [32] (Figure 1).
Differences in body weight were measured at the time of ovariectomy, 1 day before RC, PCP, and RC:PCP administration, and once a week from the initiation of administration to termination using an automatic electronic balance (Precisa Instruments, Dietikon, Switzerland) [29]. At ovariectomy, the first administration, and at termination, food, but not water, was withheld from the experimental animals (approximately 18 h prior) to reduce differences due to feeding.

2.4. Measurement of the Bone Mineral Density (BMD) and Body Fat Density

The mean BMD of total body and the right femur were determined using in live dual-energy X-ray absorptionmetry (DEXA; InAlyzer, Medikors, Seungnam, Korea). In addition, mean fat densities on the body and abdominal cavity regions of each mouse, respectively.

2.5. Organ Weight Measurements

At sacrifice, the abdominal fat pads deposited in the abdominal cavity, total liver, and uterus (including vagina) were collected after removing the surrounding connective tissues, muscles, and any debris, after which the weights of organs were measured at g levels for absolute wet-weights. To reduce the individual body weight differences, the relative weights (% of body weight) were calculated at sacrifice.

2.6. Bone Weight Measurements

At sacrifice, the right sides of the femurs were collected after removing the surrounding connective tissues, muscles, and any debris. The bone weight was measured at g levels regarding absolute wet-weights, and they were dried at 120 °C for 8 h in a high temperature dry oven (LDO-080N, Daihan Labtech Co., Seoul, Korea) for measurements of dry bone weights. Next, dried bones were carbonized at 800 °C for 6 h in a furnace (LEF-1055-1, Daihan Labtech Co.) to measure ash absolute weights. To reduce the individual body weight differences, the relative weight (%) was calculated the proportion of absolute wet/dry/ash weight based on the body weight at sacrifice.

2.7. Measurement of Bone Strengths

Bone strength was detected as failure load (FL). FL of mid-shaft regions of right femurs were detected using a three-point bending test to failure using a computerized testing machine (SV-H1000, Japan Instrumentation System Co., Tokyo, Japan) as N (Newton).

2.8. Blood Collection

For serum biochemistry, approximately 1 mL of whole blood was collected from vena cava at sacrifice and separated from the serum by centrifugation at 21,000× g for 10 min at 4 °C using a clotting activated serum tube. All serum samples were frozen at −150 °C until they were assayed.

2.9. Serum Biochemistry

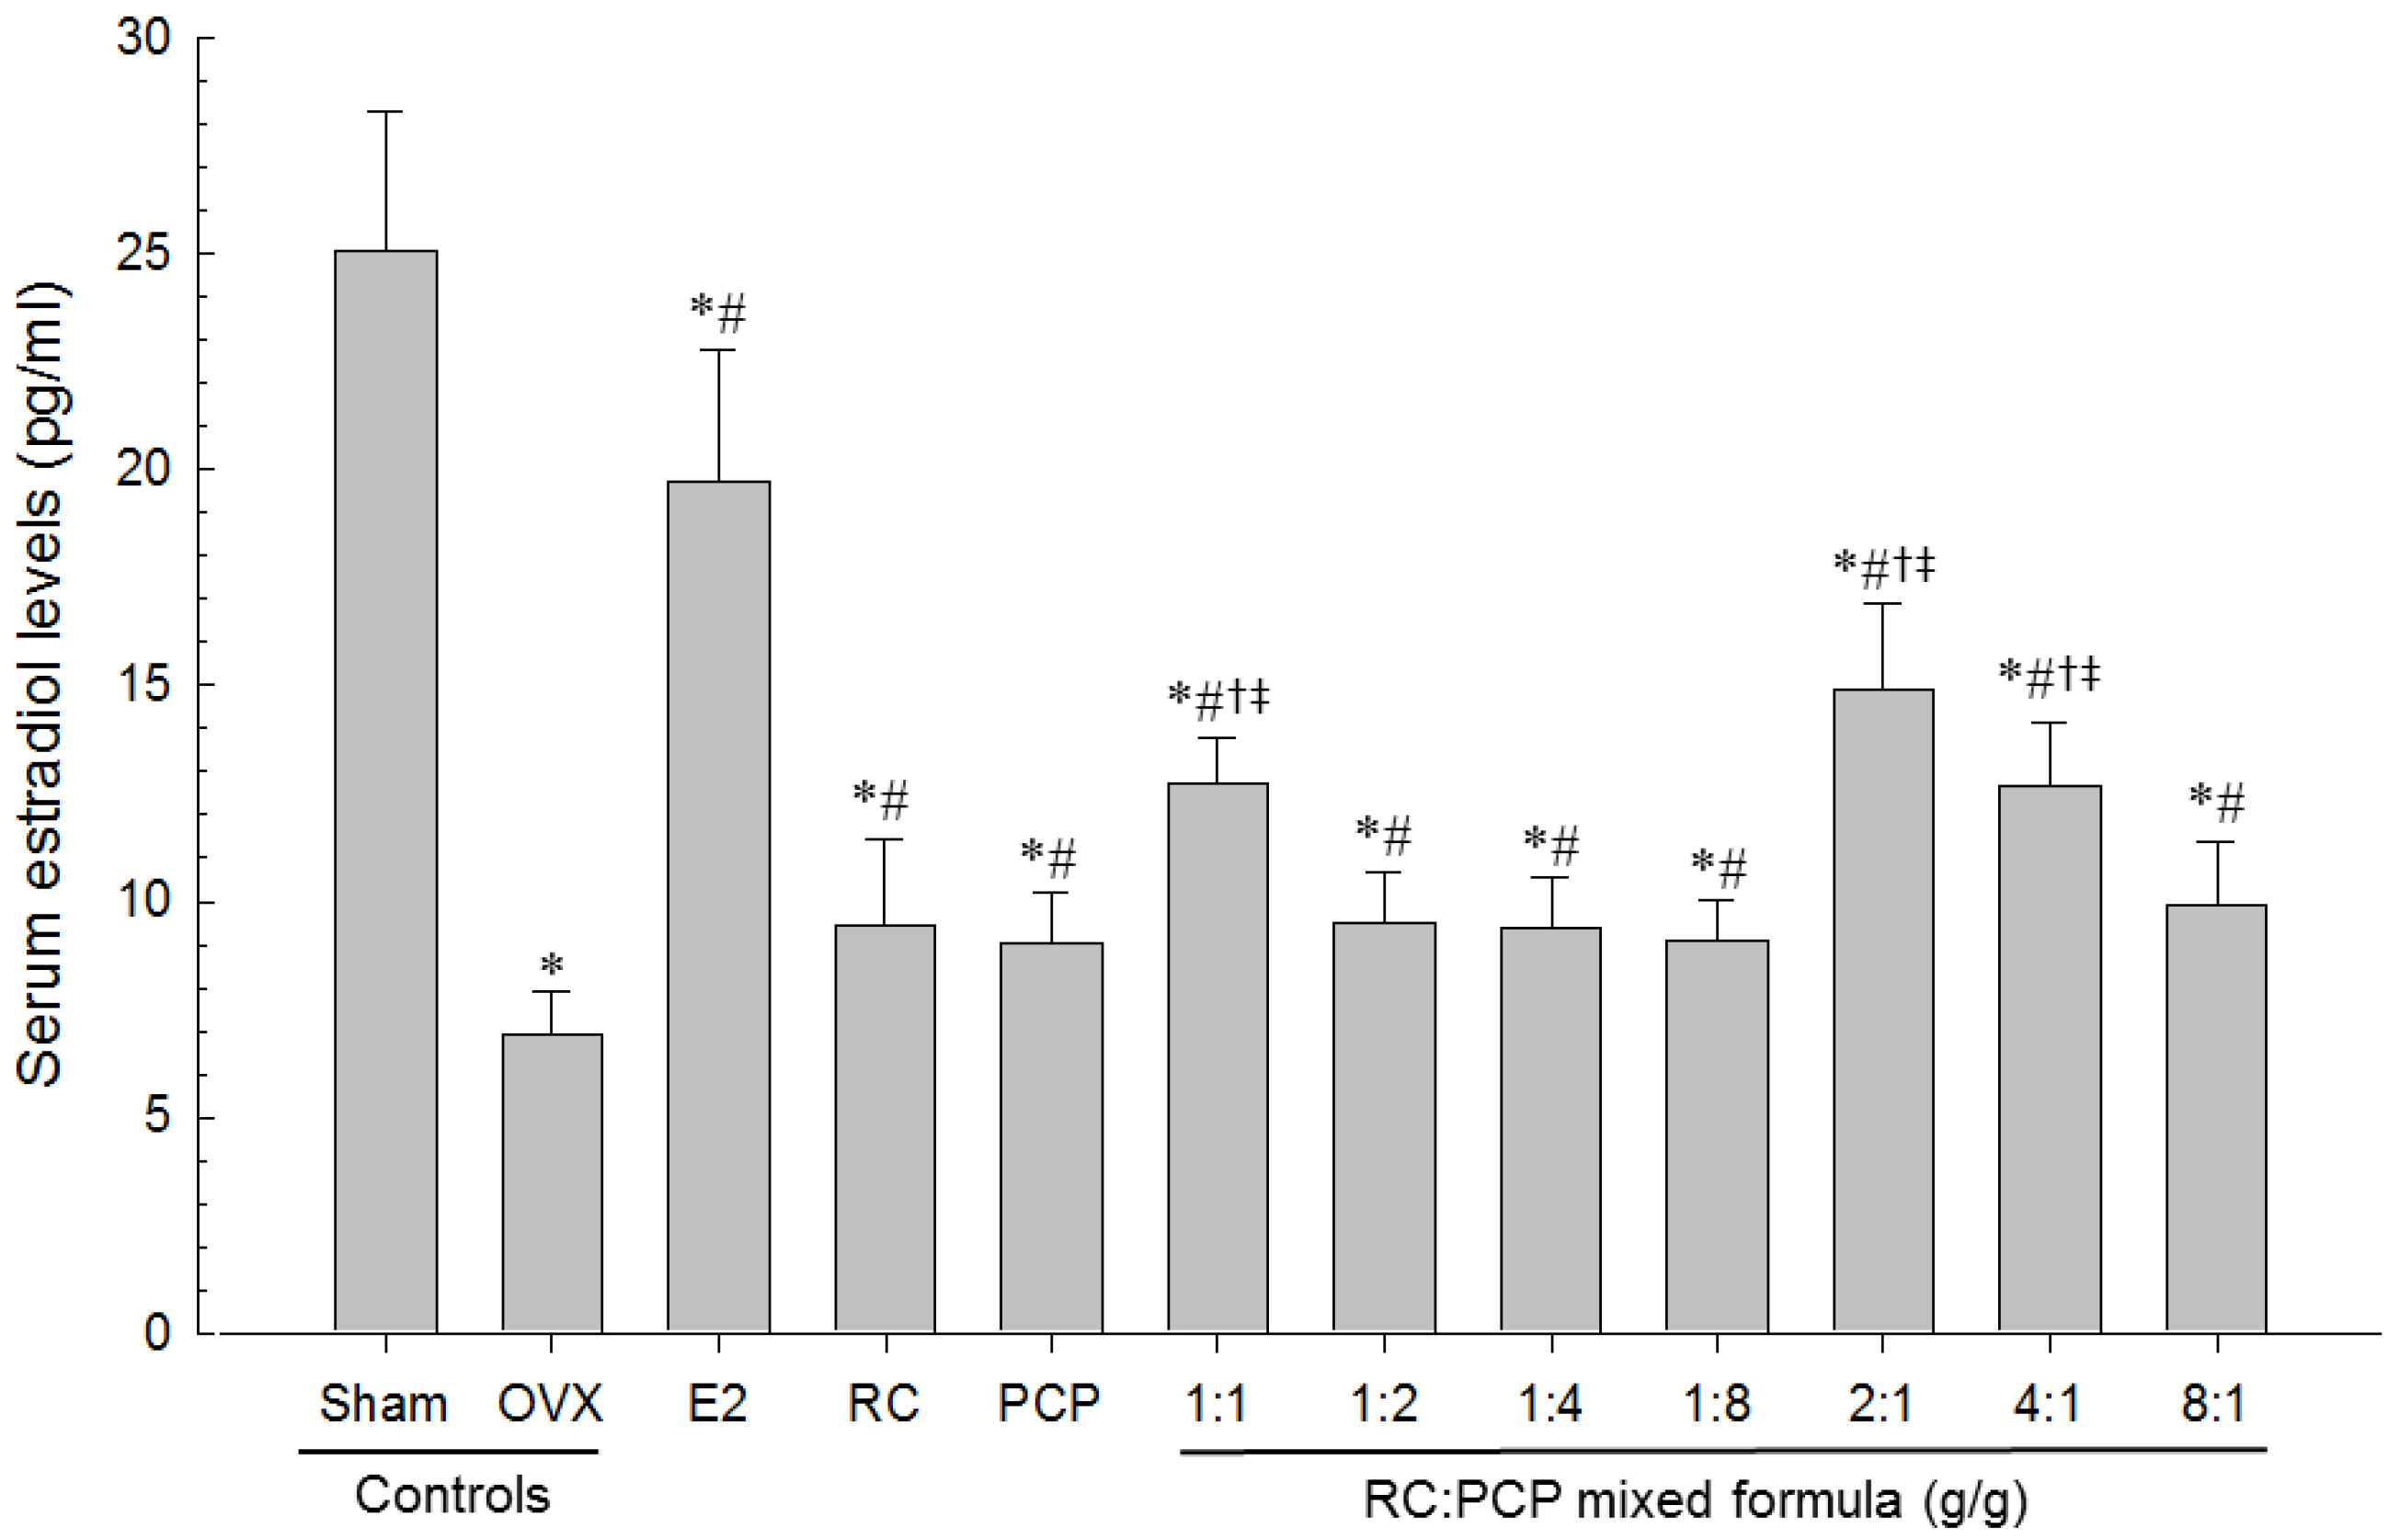
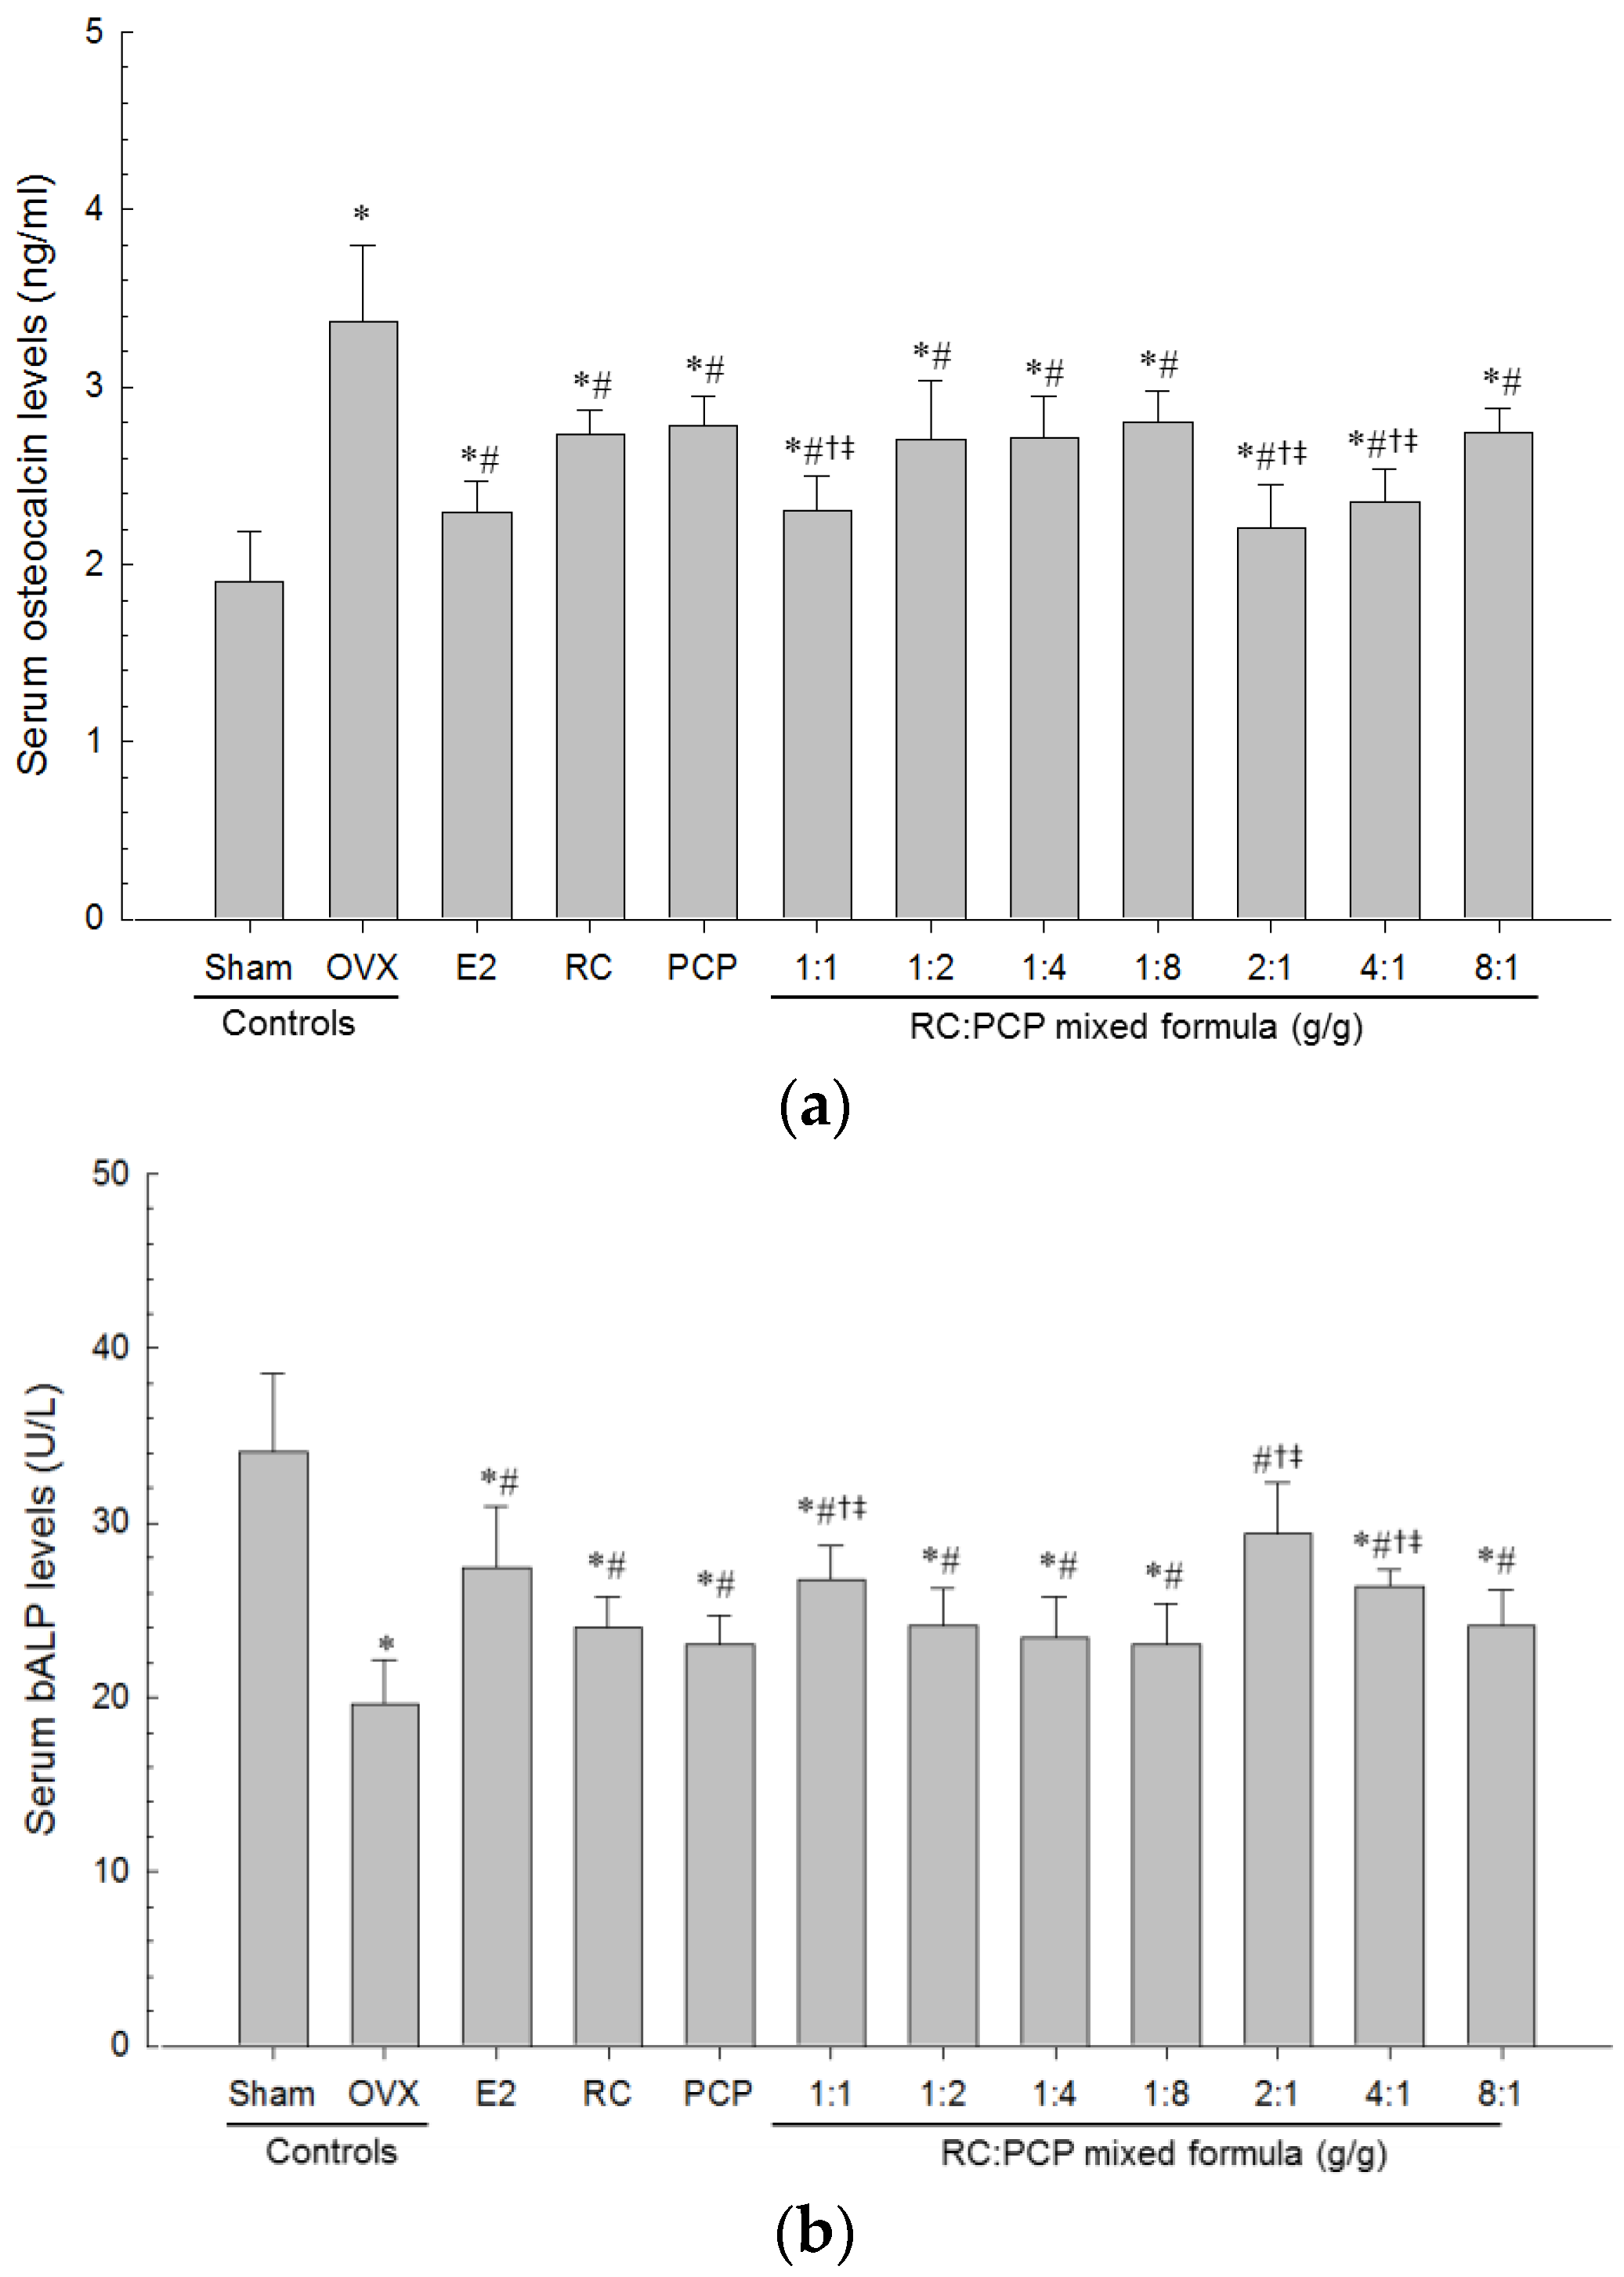
Serum aminotransferase (AST), alanine aminotransferase (ALT), total cholesterol (TC), LDL, and triglyceride (TG) levels were detected using an automated blood analyzer (Hemagen Analyst; Hemagen Diagnostic, Columbia, MD, USA), and HDL levels were measured using another typed automated blood analyzer (AU400; Olympus, Tokyo, Japan). In addition, serum osteocalcin levels were detected using a Mouse Osteocalcin ELISA Kit (Immutopics, San Clemente, CA, USA) as ng/mL levels, and serum bALP levels were detected using the Mouse bALP ELISA kit (Quidel Corp., San Diego, CA, USA), as U/L levels as pg/mL, with an ELISA Reader (Tecan, Männedorf, Switzerland). In addition, serum estradiol contents were measured using the chemiluminescent immunoassay technique (ECLIA, Roche e411 immunoassay analyzer, Roche, Penzberg, Germany) from the separated serum at sacrifice in all mice.

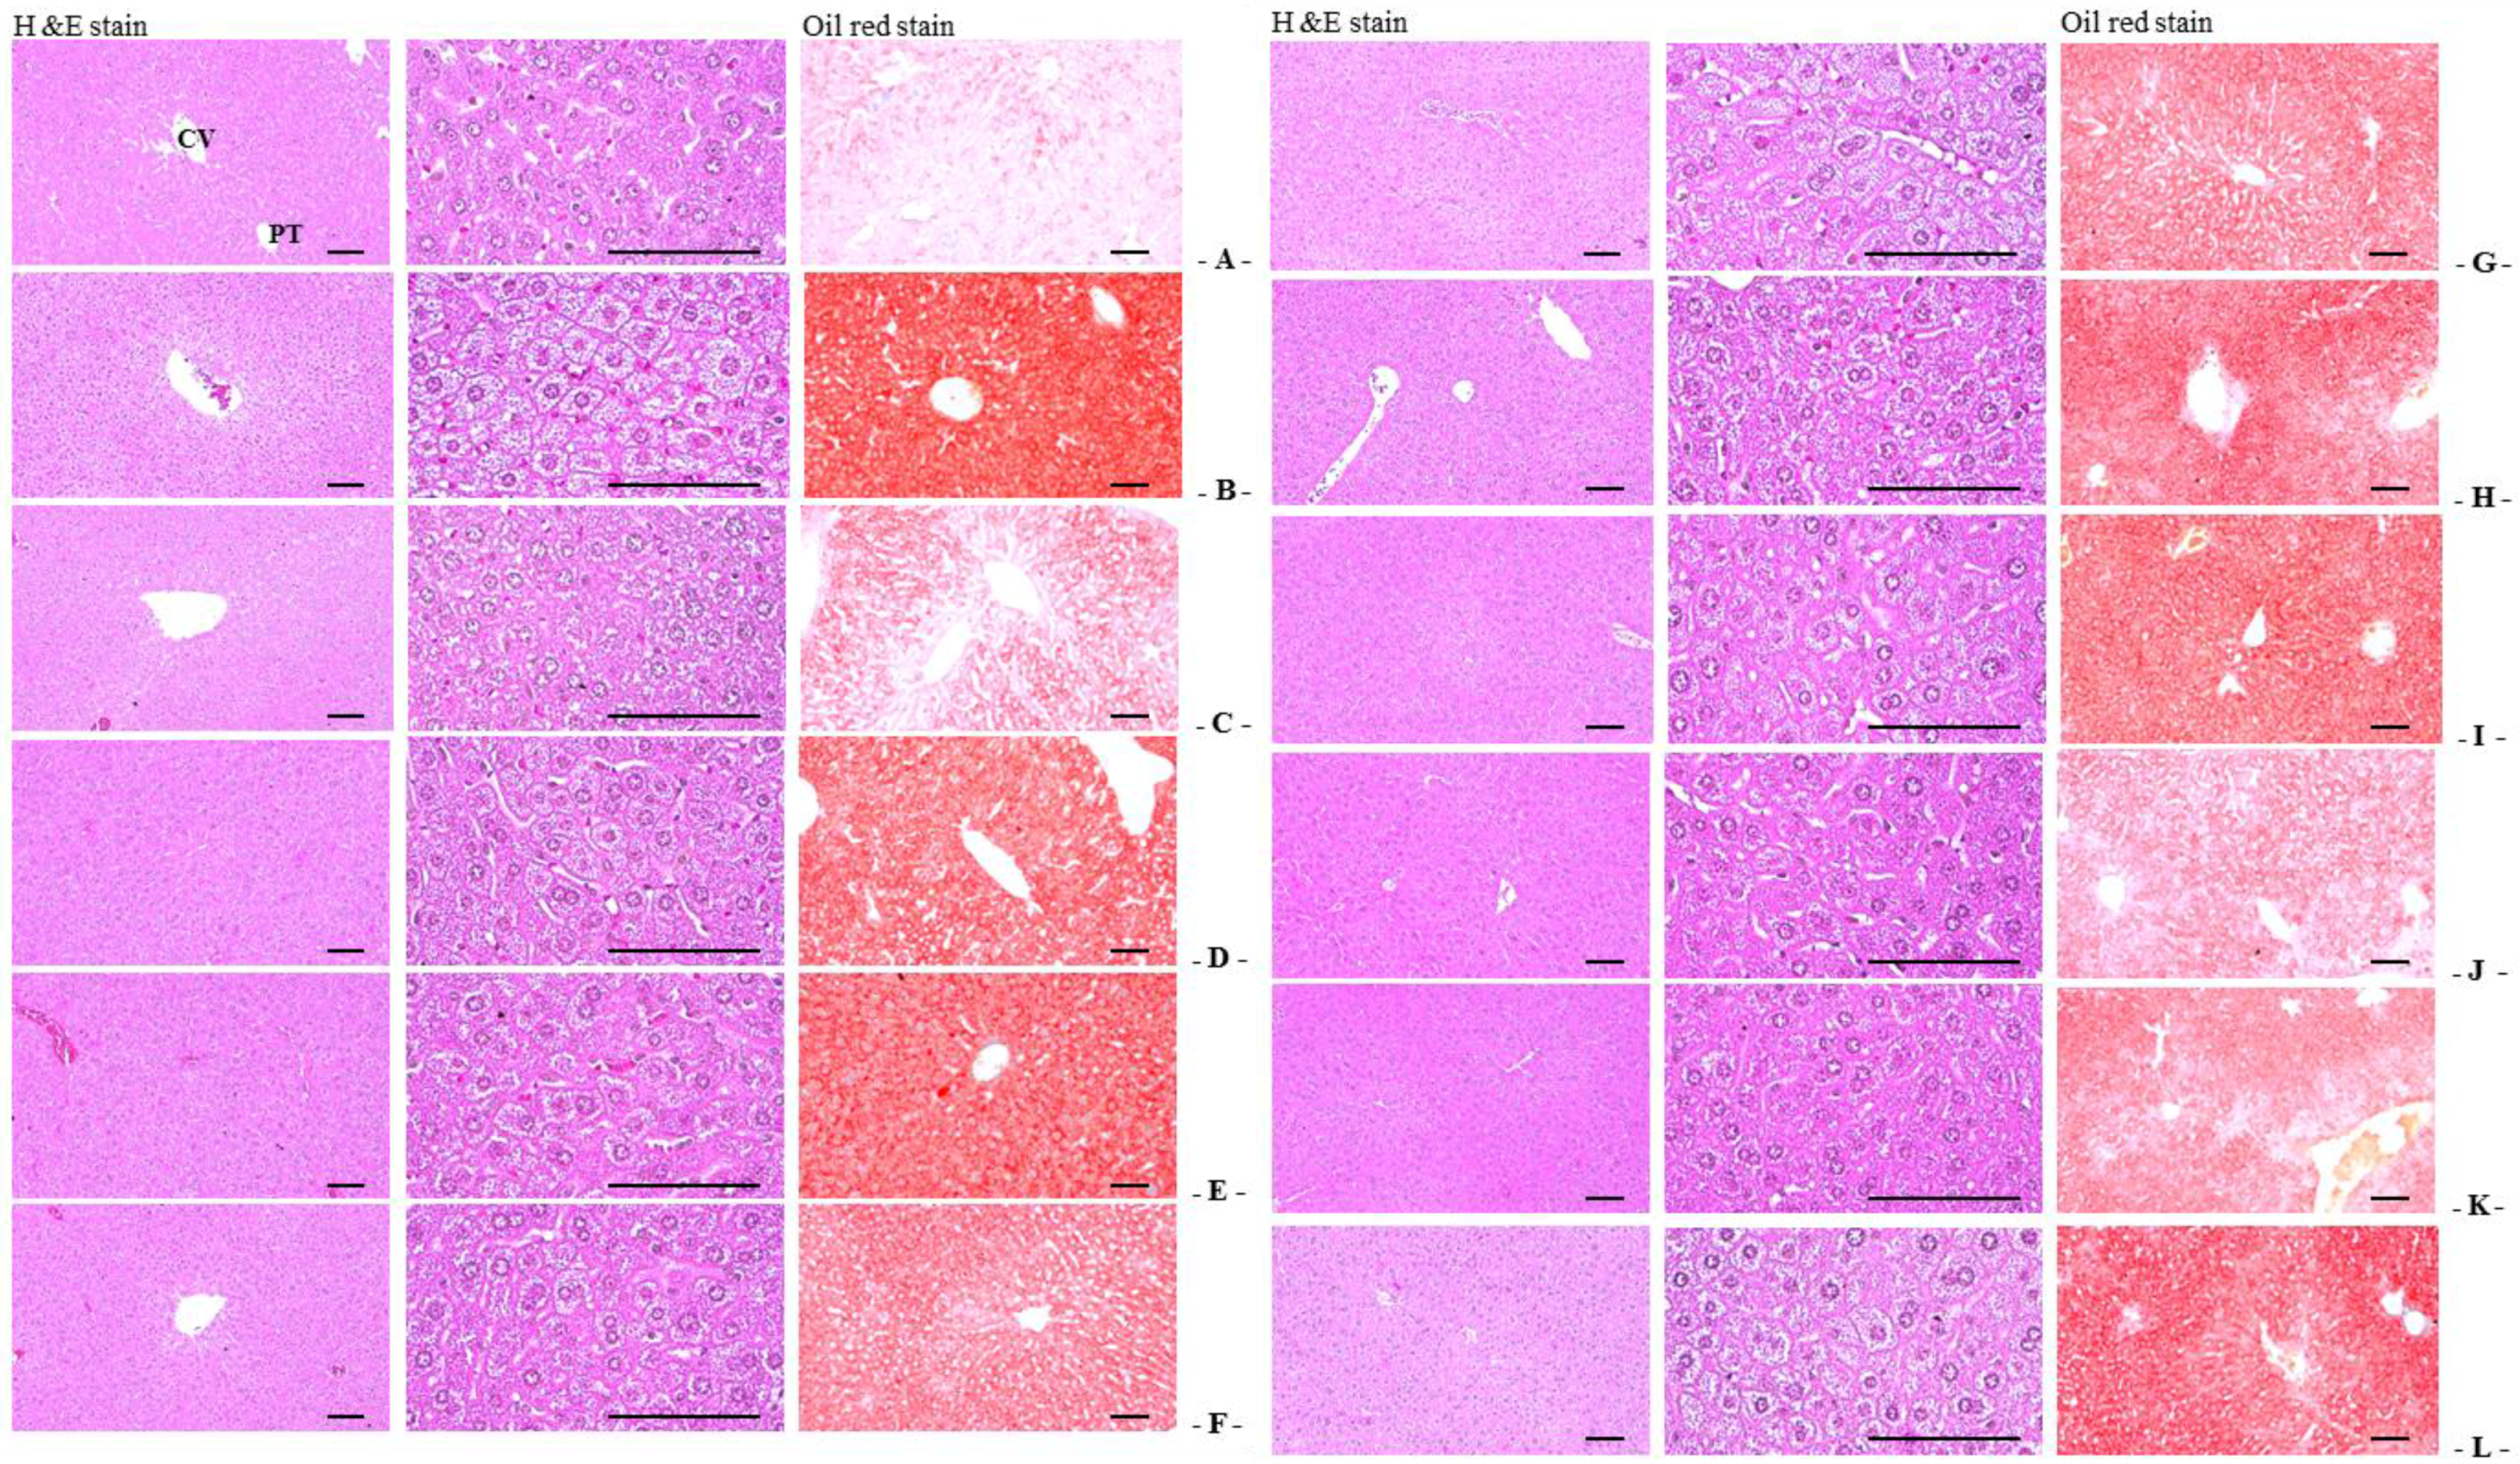
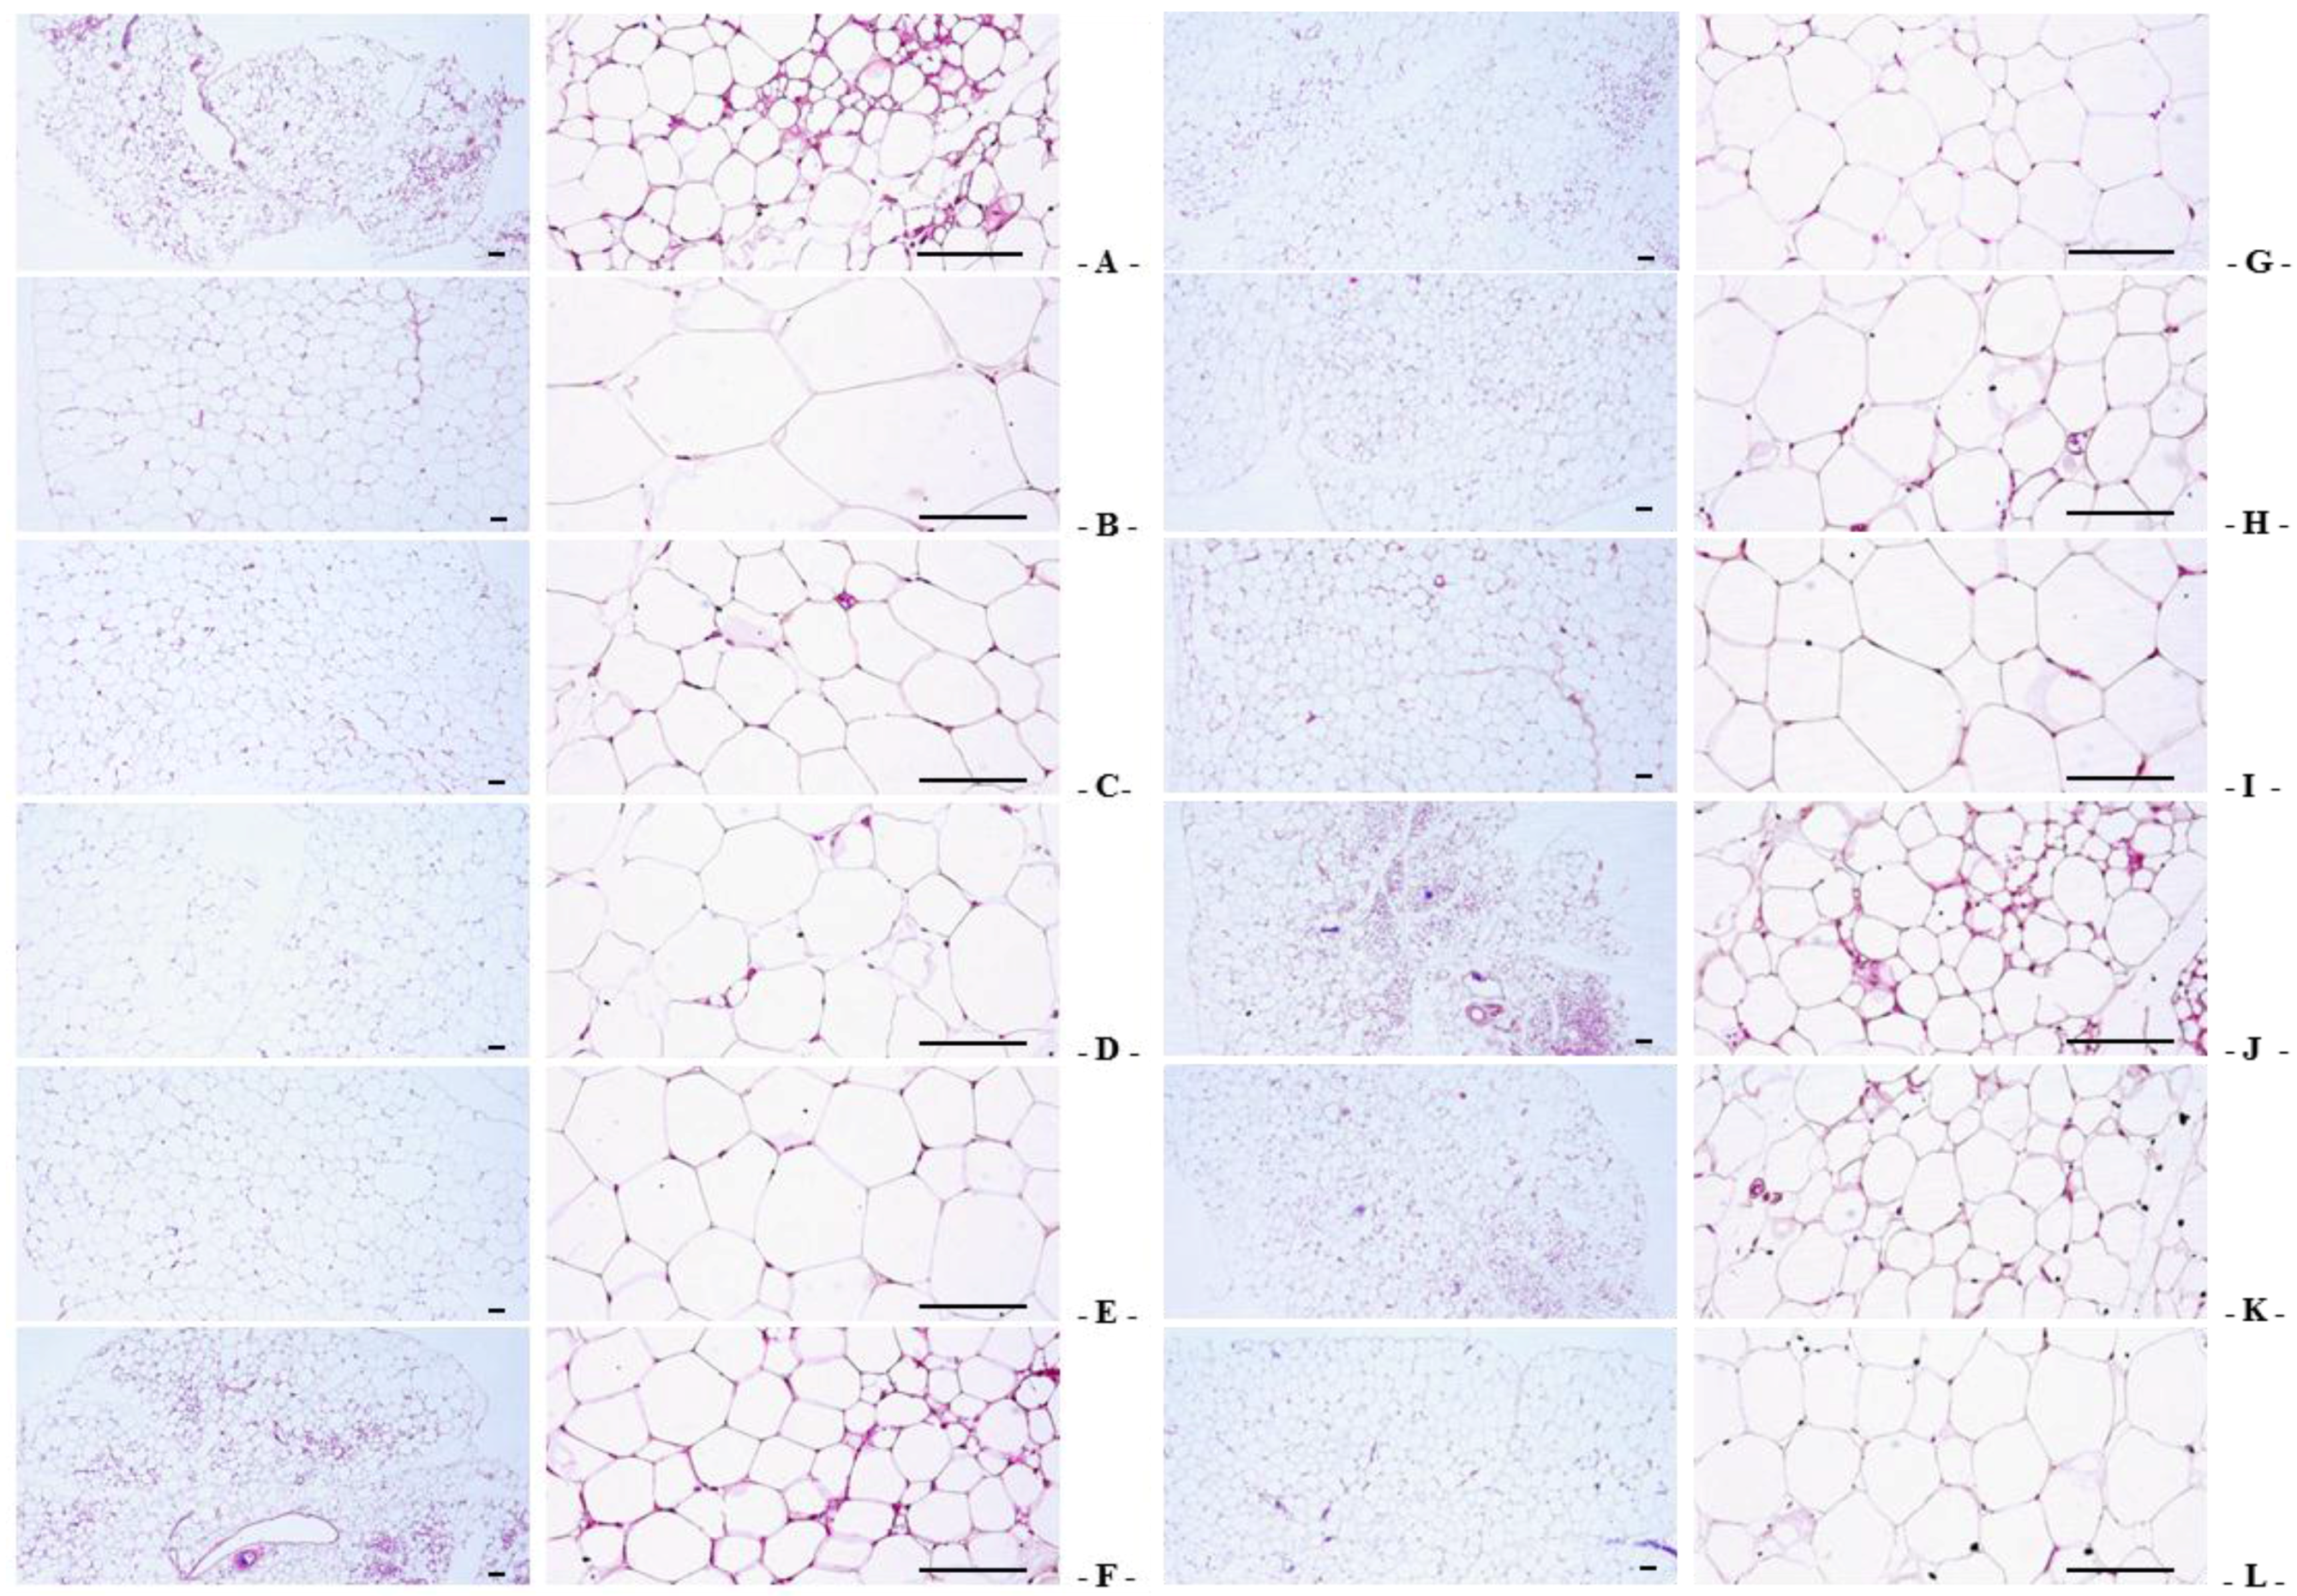
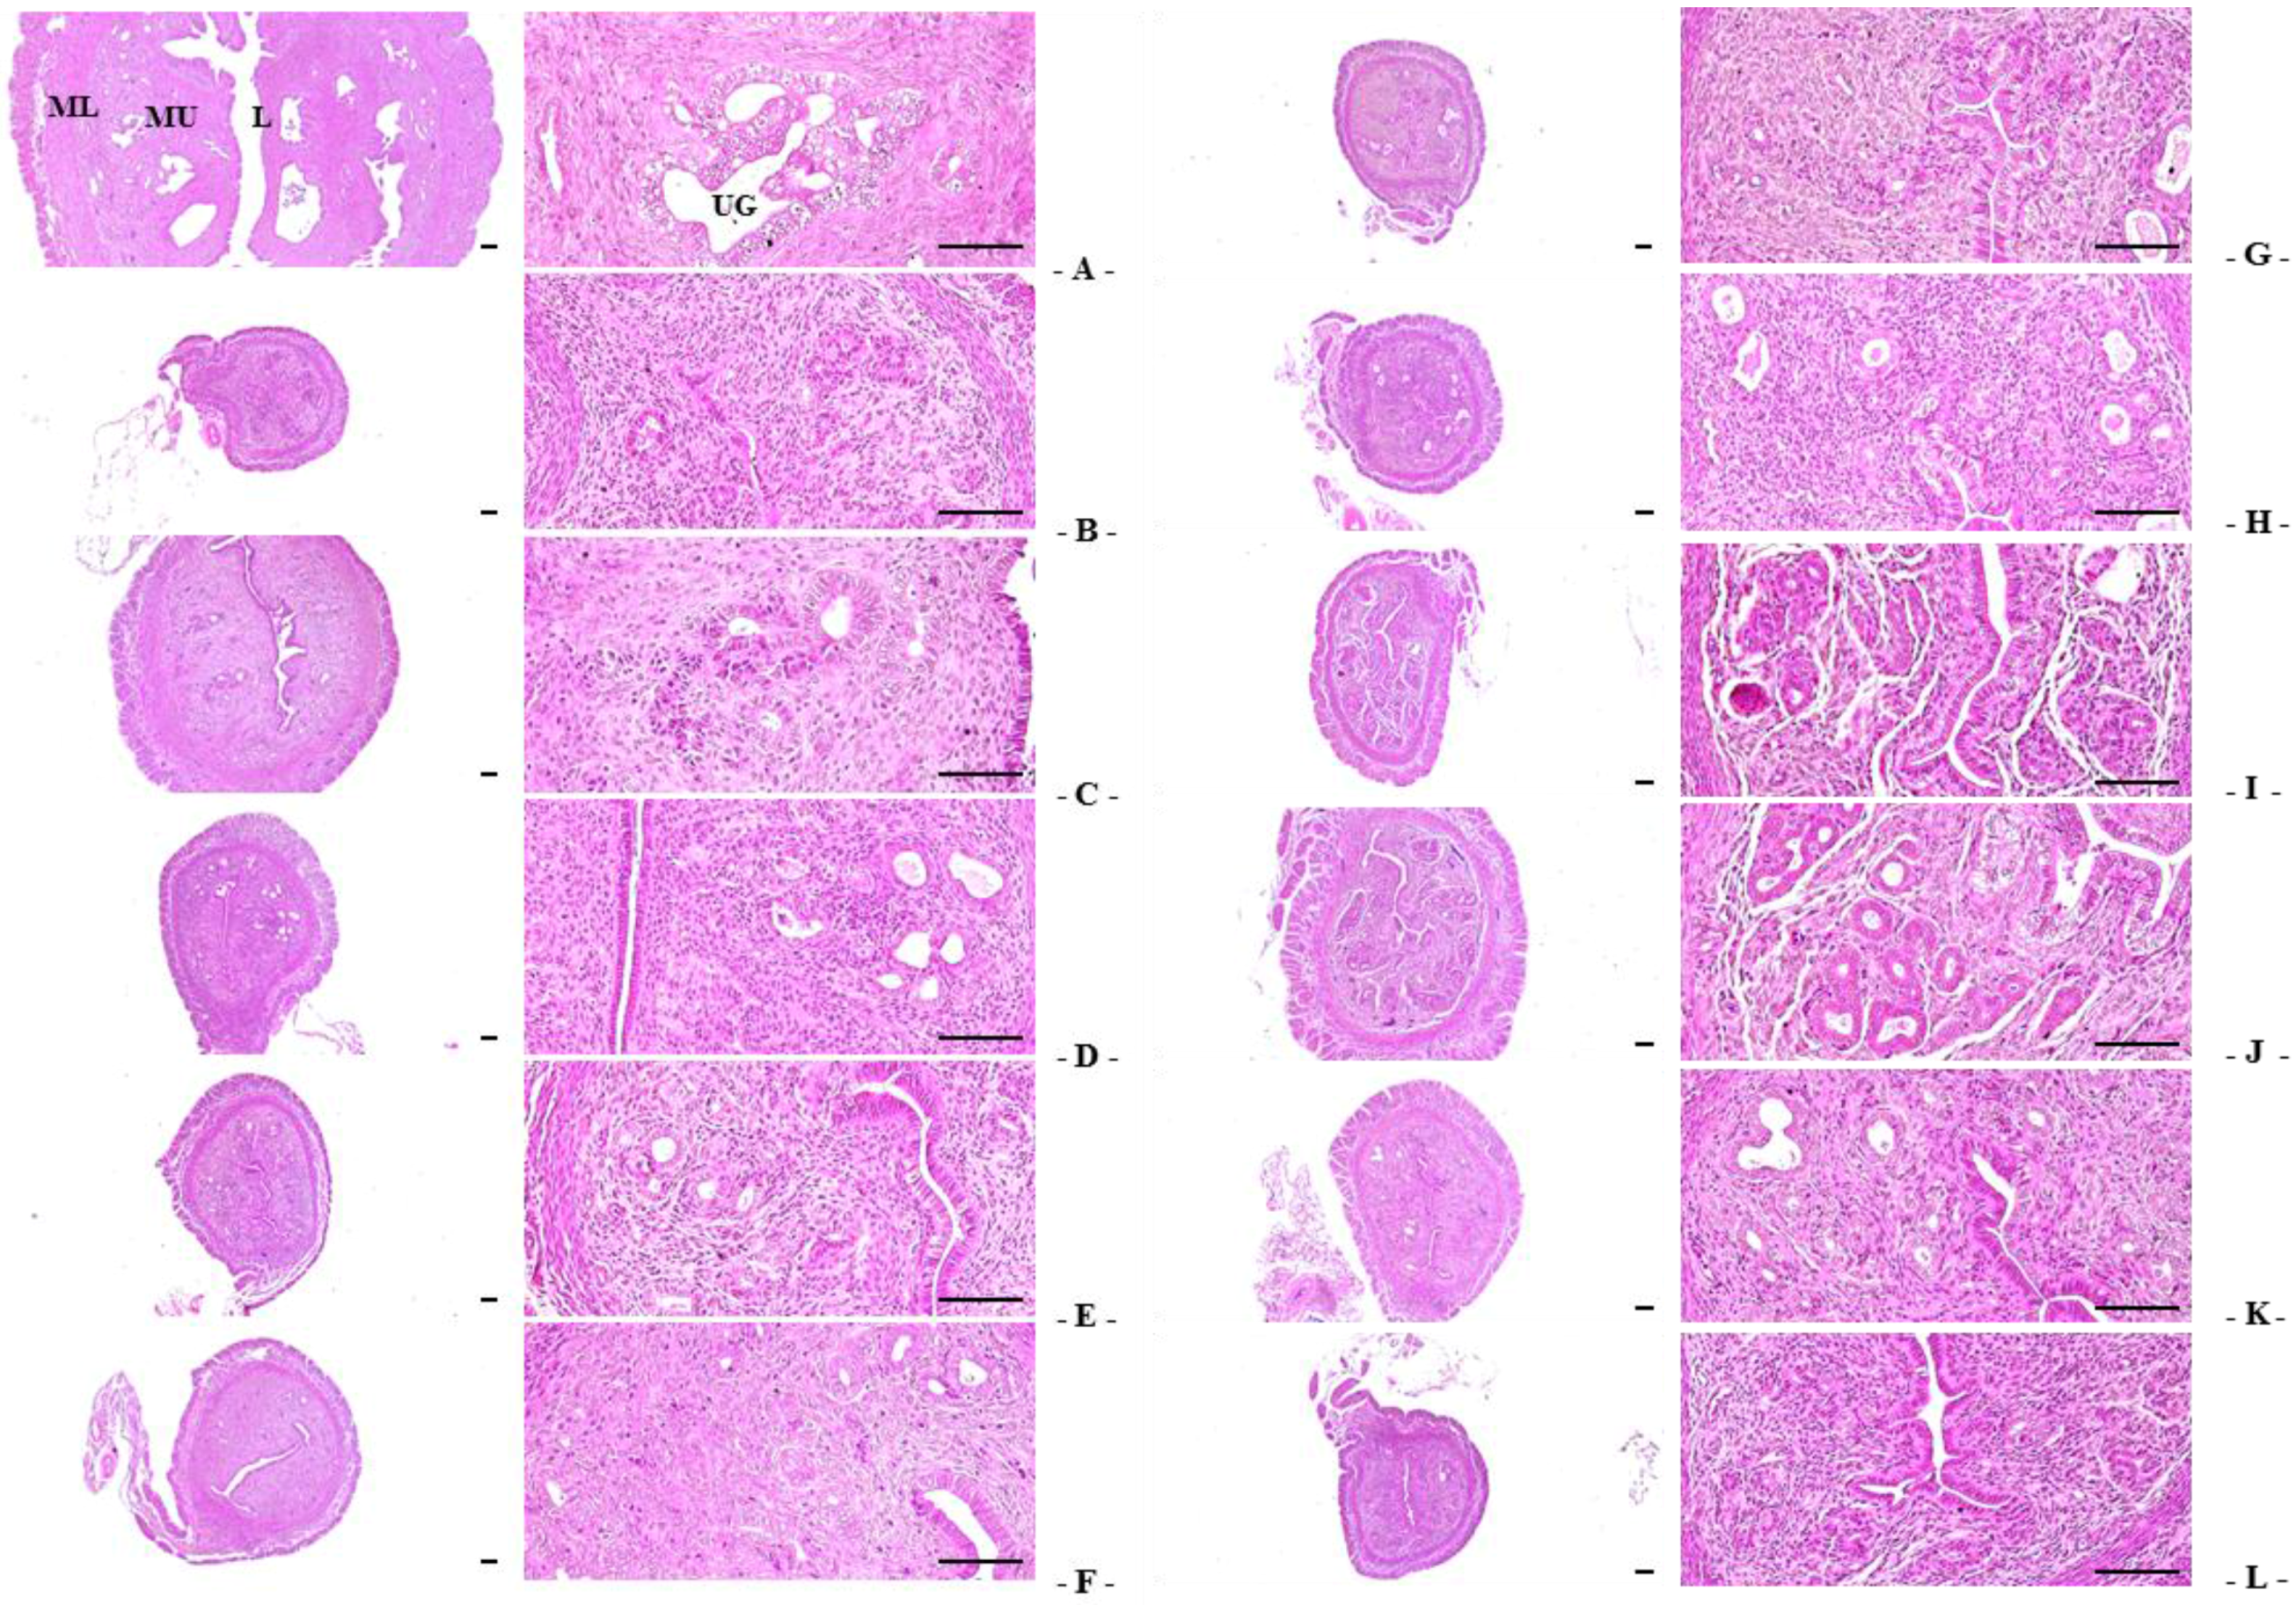
2.10. Abdominal Fat Pads, Uterus, and Liver Histological Procedures

Sampled tissues were fixed in 10% neutral buffered formalin (NBF). After paraffin embedding, 3–4 μm serial sections were prepared. Representative sections were stained with hematoxylin and eosin (H&E) for light microscopic examination. Alternatively, portions of liver that had been dehydrated in 30% sucrose solutions were sectioned by cryostat for staining the lipids with oil red [33]. The total thicknesses of abdominal fat pads were measured using an automated image analysis processor (iSolution FL; ver. 9.1, IMT i-solution Inc., Quebec, QC, Canada) as mm/mouse, and mean diameters of dorsal abdominal white adipocytes were calculated in restricted view fields on a computer monitor, using an automated image analysis processor, as μm. At least 10 white adipocytes per fat pad were considered for histomorphometrical analysis according to our previously established methods [29,33,34]. In addition, total full, mucosa, and epithelial thicknesses of the uterus (μm/uterus) were detected as percentages of uterine glands located in the mucosa (%/mucosa of uterus) using an automated image analyzer. To observe steatosis in the liver, the percentage of fatty change regions in hepatic parenchyma was calculated as percentages between 1 field of liver (%/mm2 of hepatic parenchyma) under oil red staining, and mean diameters of hepatocytes were calculated in restricted view fields on a computer monitor under H&E staining using an automated image analysis processor, as μm; at least 10 hepatocytes per liver were considered.

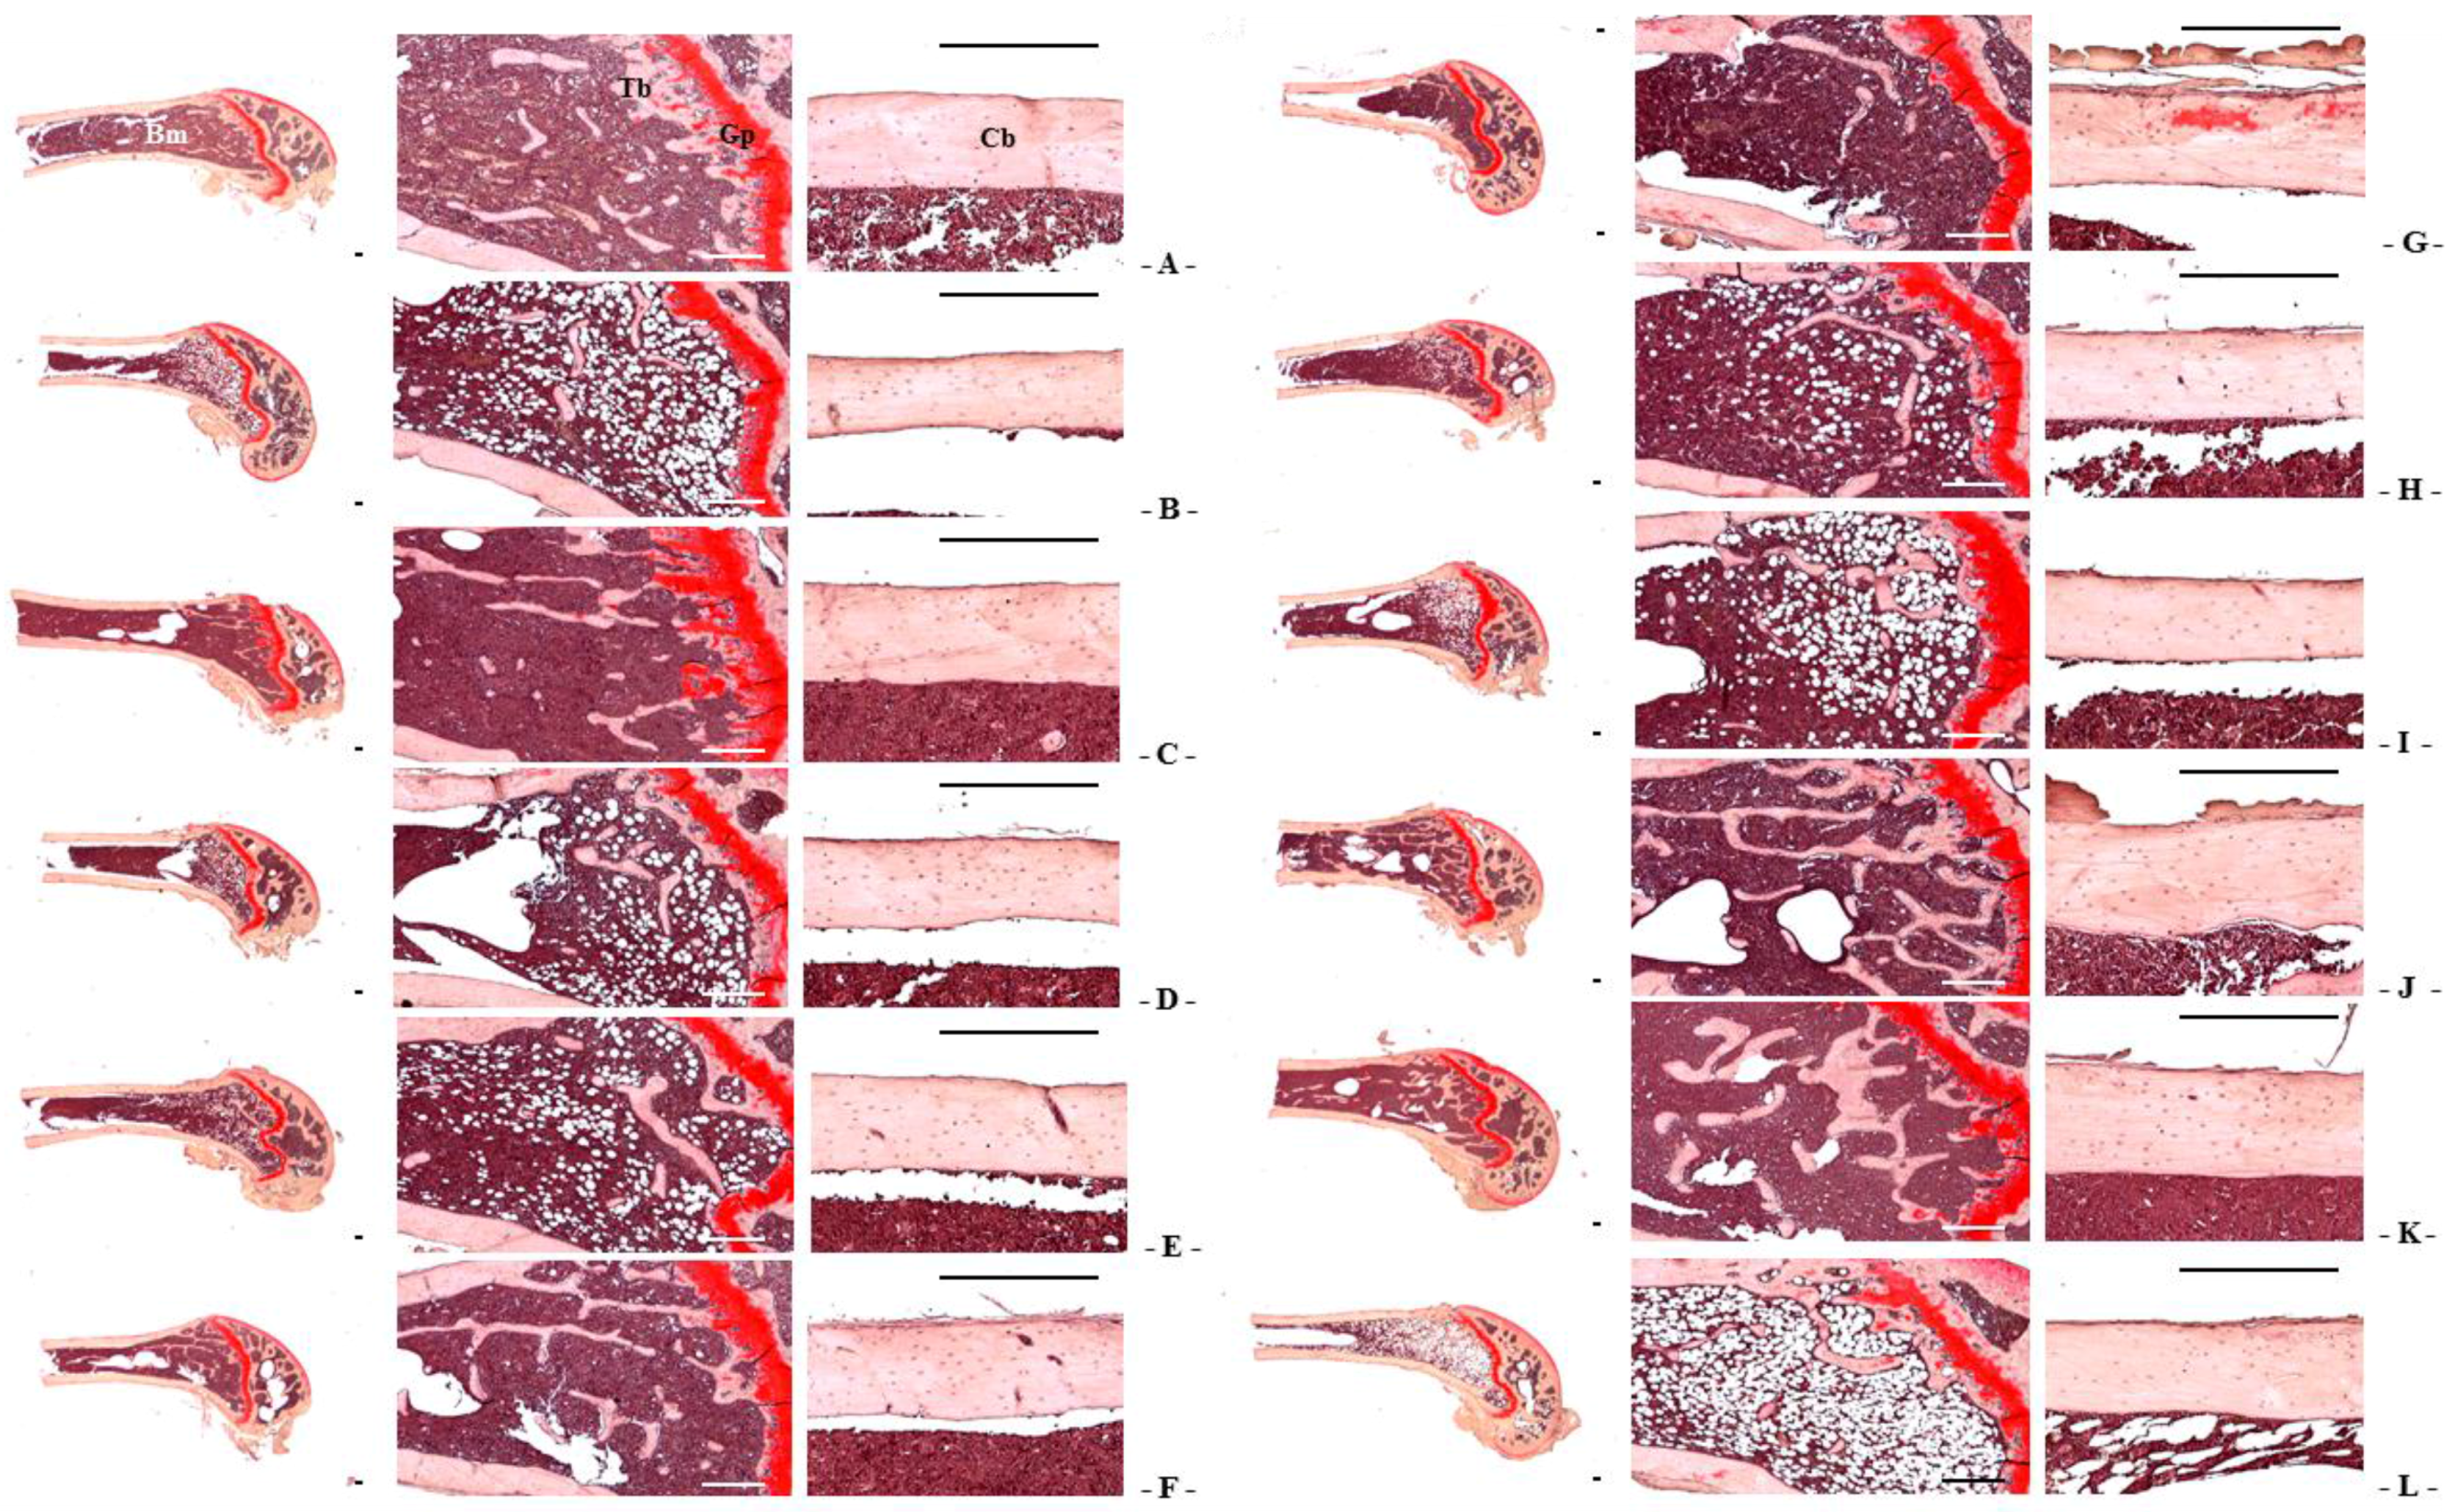
2.11. Bone Histological Procedures

The left sides of each mouse femur were separated and fixed in 10% NBF, after which they were decalcified in decalcifying solution (24.4% formic acid and 0.5 N sodium hydroxide) for 3 days (mixed decalcifying solution was exchanged once a day for 3 days). The samples were then embedded in paraffin, sectioned (3~4 μm), and stained with Safranin-O stain. In addition, bone histomorphometry was conducted using an automated image analyzer under microscopy (Nikon, Tokyo, Japan) to examine bone mass and structure with bone resorption in a uniform area of epiphyseal or cortical bone regions of the femur (growth plate regions were excluded). Cortical bone thickness was also measured in the mid-shaft regions of the femur. Trabecular bone volume (TV/BV, TBV; %), thickness of trabecular bone (Tbt; μm/trabecular bone), number (Tbn; mean numbers of trabecular bone/epiphyseal regions), length (Tbl; mm/trabecular bone), and cortical bone thickness (Cbt; μm/mid-shaft cortical bone) were measured for bone mass and structure, and osteoclast cell number (Ocn; mean osteoclast cell numbers/epiphyseal regions) and ratio (OS/BS; %) were measured for bone resorption as described previously [20,31,35].

2.12. Statistical Analyses

All values for the eight mice in this experiment were expressed as means ± SD. Multiple comparison tests were performed a two-tailed test for the different dose groups. Variance homogeneity was examined using the Levene test. If the Levene test indicated no significant deviations from variance homogeneity, the data were analyzed using the one-way ANOVA test followed by the least-significant differences test to determine which group comparisons were significantly different. When significant deviations from variance homogeneity were observed on the Levene test, the non-parametric the Kruskal-Wallis test was conducted. When a significant difference was observed on the Kruskal-Wallis test, the Mann-Whitney U test was conducted to determine the specific pairs of groups that were significantly different. Statistical analyses were conducted using the SPSS for Windows software package (ver. 14.0; SPSS Inc., Chicago, IL, USA).
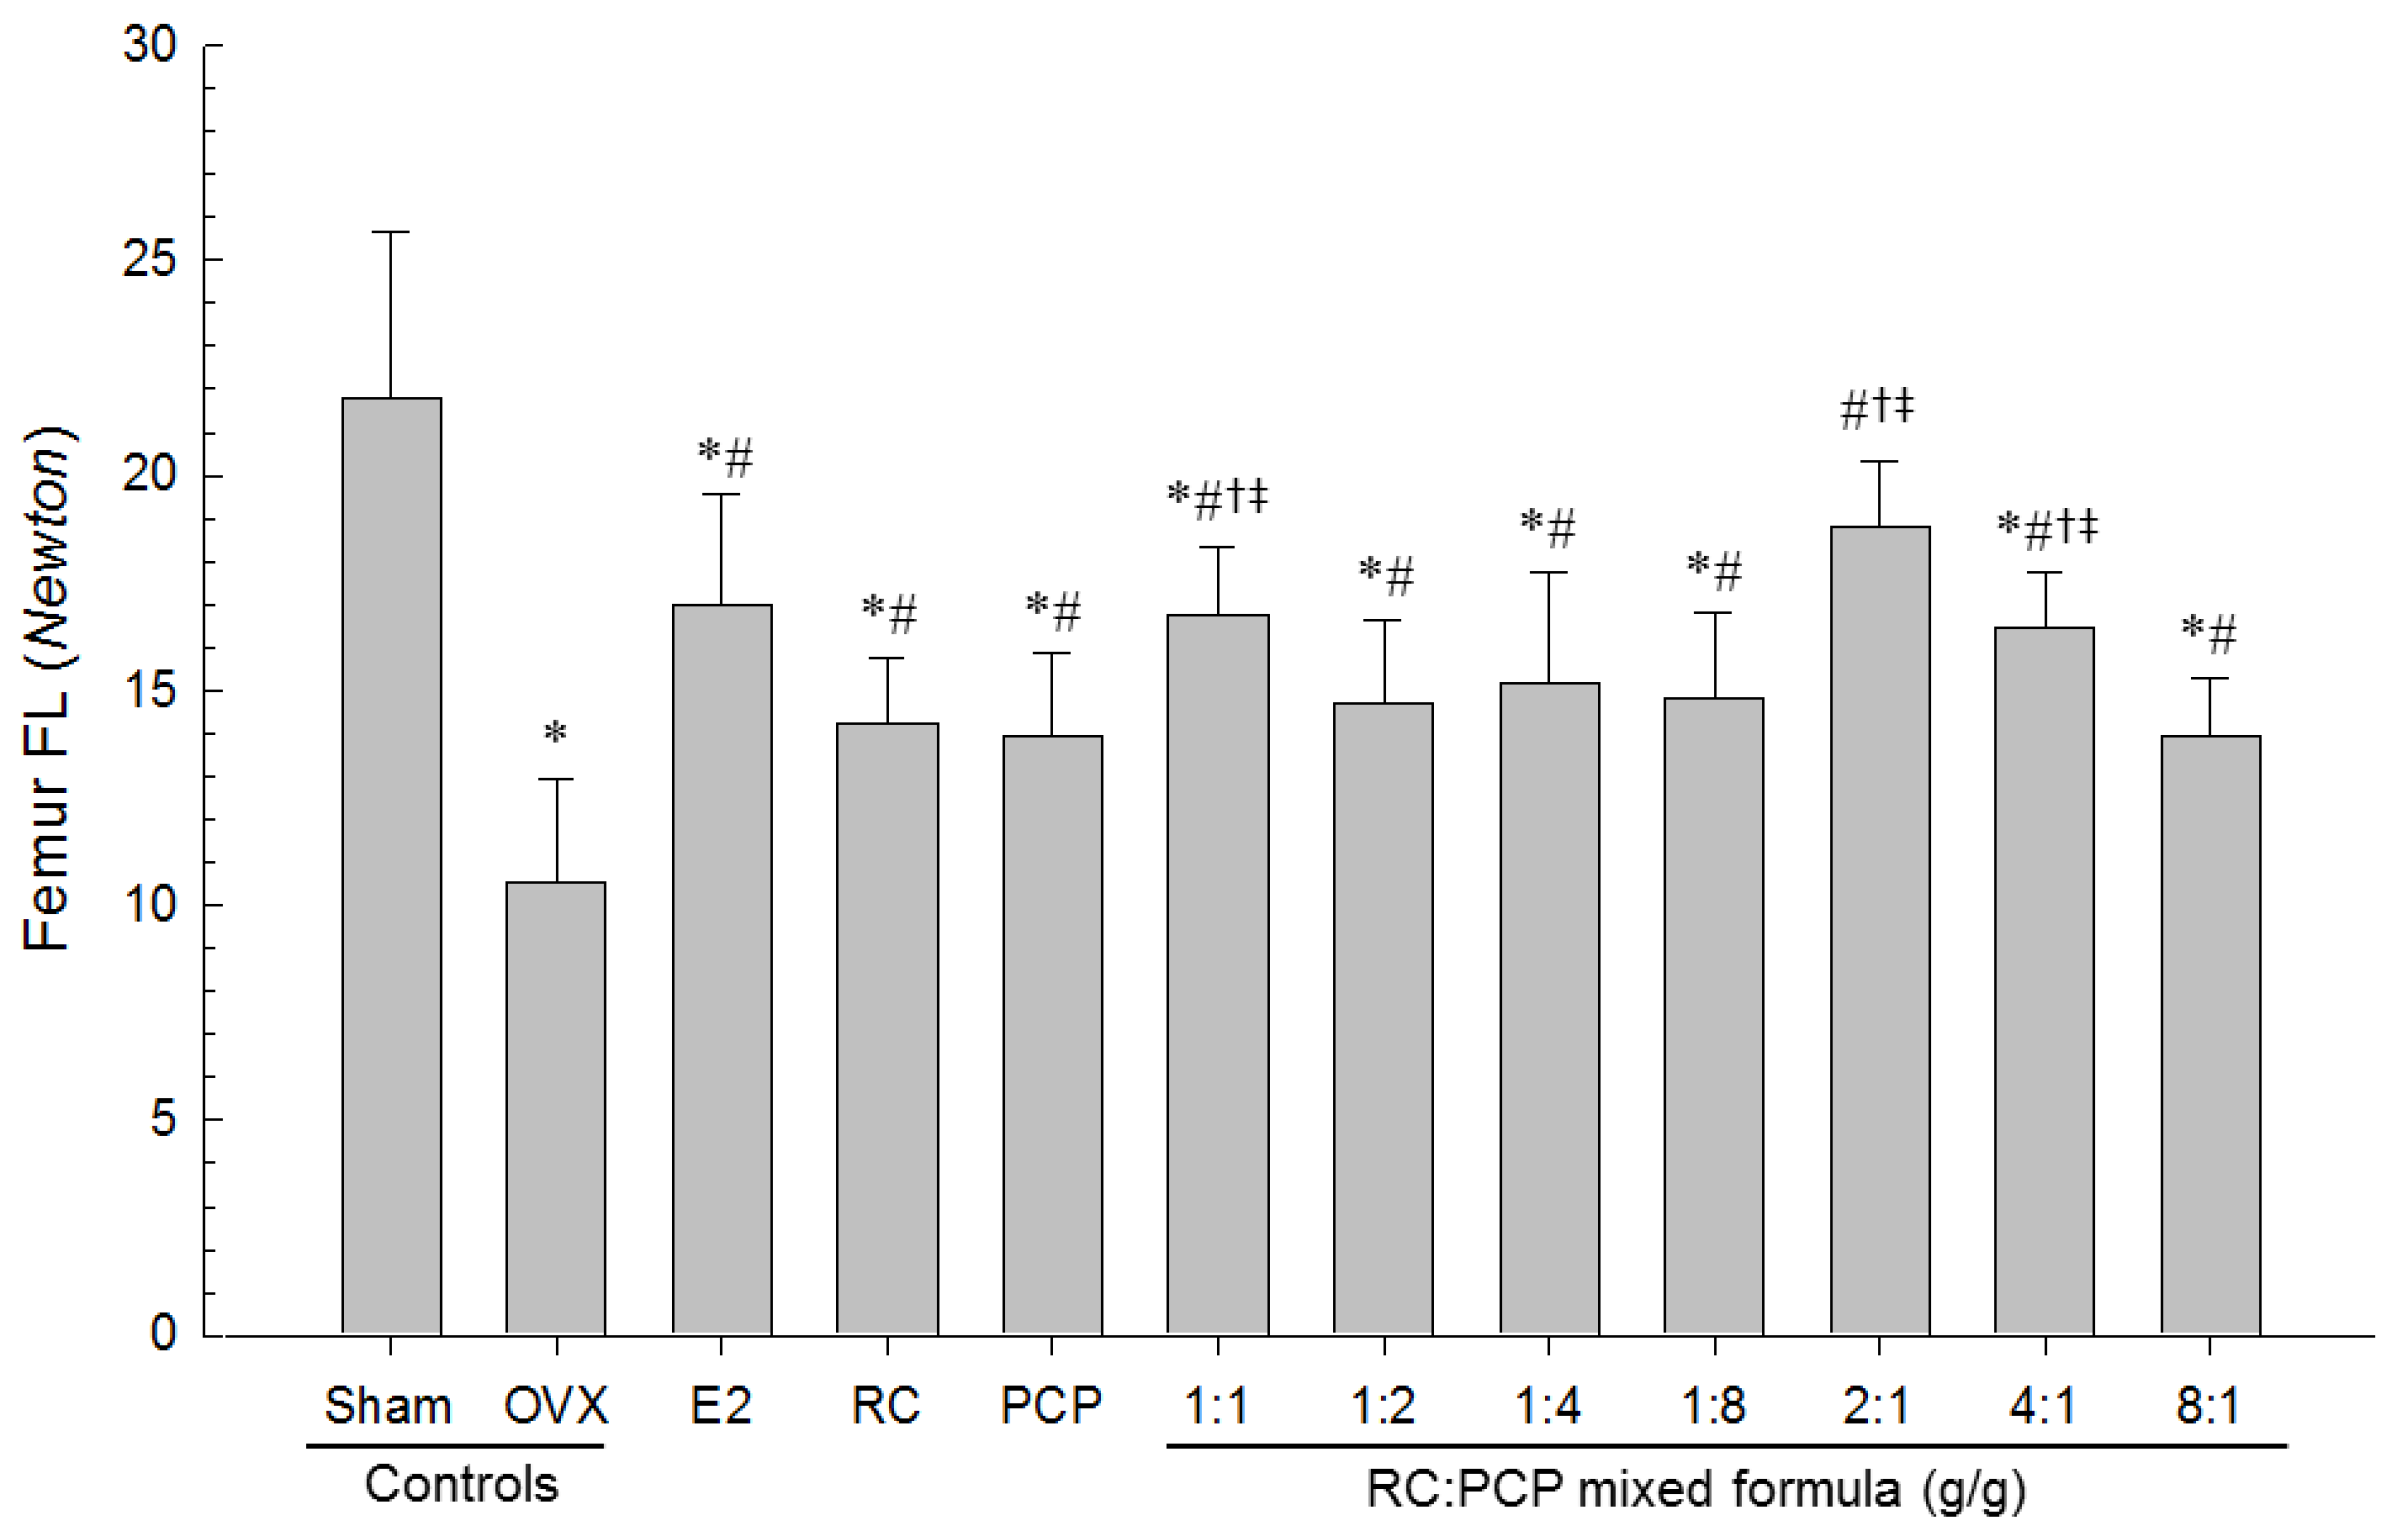
3. Results

3.1. Body Weight and Gains

Body weights were the higher in all OVX induced mice than in shame control mice, with significant increases in body weight gains during the 4-week OVX recovery/induction periods. In contrast, OVX-induced body weight increase was significantly prevented by all seven RC:PCP mixed formulae, from 14, 21, and 28 days after the initial treatment, compared with OVX control mice. Especially, the mice treated with 2:1, 1:1, and 4:1.
Mixtures had a lower body weight increase than that treated with RC or PCP alone on days 28, 42, and 49 after the initial treatment, in that order (Table 2, Appendix A).

3.2. Food Consumption

Compared with sham control mice at 1, 3, 7, 28, 56, and 83 days after initial administration, OVX-induced mice showed significant increases in food consumption. No significant change in daily food consumption was observed in the RC alone, PCP alone, or any of the seven RC:PCP mixed formula-treated mice, compared with OVX control mice (Appendix B).

3.3. Organ Weights

OVX-induced mice showed significant higher in relative abdominal fat pad weight deposited in the abdominal cavity compared with sham control mice. In contrast, uterus and liver relative weights were lower in OVX-induced mice than in sham control mice. However, these changes in abdominal fat, uterus and liver weights were prevented by estradiol, RC, PCP and RC:PCP treatments (Table 3). The mean relative weights of abdominal fat pads deposited into the abdominal cavity in OVX controls were changed by 1491.59%, compared with the sham control, and by −78.86%, −41.76%, −36.56%, −65.51%, −74.73%, and −62.83%, in the estradiol-, RC alone-, PCP alone-, and 1:1, 2:1, and 4:1 RC:PCP mixed formula-treated mice, respectively, compared with the OVX controls. The mean relative uterine weights of OVX were changed by −92.53%, compared with sham controls, and by 372.56%, 74.57%, 67.51%, 145.55%, 200.64%, and 142.46% in estradiol-, RC alone-, PCP alone-, and 1:1, 2:1, and 4:1 RC:PCP mixed formula-treated mice, respectively, compared with OVX controls.

3.4. Changes in Abdominal Fat Pad, Uterus, and Liver Histopathology

Significant increases in the thickness of abdominal fat pads deposited into the abdominal cavity and the mean adipocyte diameters were observed in OVX-induced mice due to the deposition in adipose tissues in the abdominal cavity and the hypertrophy of adipocytes, respectively. However, the thickness of abdominal fat pads and their mean diameters of adipocytes in all test substance-administrated mice (including estradiol treated mice) were the lower than in OVX control mice. Especially, RC:PCP 2:1, 1:1 and 4:1 mixed formula treated mice showed more inhibitory activities in the deposition in adipose tissues and the hypertrophy of adipocytes than compared with RC- or PCP-treated mice, in that orders, respectively (Table 4, Figure 2).
Significant decreases in total, mucosa, and epithelial thicknesses of the uterus, and in the percentages of uterine glands in the mucosa, were observed in OVX-induced mice due to estrogen depletion-related atrophic changes. However, total, mucosa, and epithelial thicknesses of the uterus, as well as in the percentages of uterine glands in the mucosain estradiol- and 1:1, 1:2, 1:4, 1:8, 2:1, 4:1, and 8:1 RC:PCP mixed formula-treated mice were the higher than in OVX control mice. Especially, significant normalization in OVX-induced uterine atrophic histopathological changes were detected in RC:PCP 2:1, 1:1 and 4:1 mixed formula treated mice compared with RC- or PCP-treated mice, in that orders, respectively (Table 5, Figure 3).
Significant increases in the percentage of fatty change regions and mean diameters of hepatocytes were observed in OVX-induced mice due to the deposition of lipids into hepatocytes and steatosis. However, the percentage of fatty change regions and mean diameters of hepatocytes in all test substance-administered mice (including estradiol-treated mice) were the lower than in OVX control mice. Especially, RC:PCP 2:1, 1:1 and 4:1 mixed formula treated mice showed more significant inhibition in hepatic steatosis—increases of the percentage of fatty change regions and mean diameters of hepatocytes induced by OVX than in RC- or PCP-treated mice, in that orders, respectively (Table 4, Figure 4).

3.5. Femur Weight

Femur relative wet-weights and absolute and relative dry and ash weights were the lower in OVX-induced mice than in sham control mice. However, the femur wet relative weight and dry and ash absolute and relative weights in all test substance-treated mice, including estradiol treated mice, were the higher than in OVX control mice. Especially, RC:PCP (2:1, 1:1, and 4:1)-treated mice were higher than in OVX control mice (Table 6).

3.6. Femur Histopathology

Although relatively well-developed trabecular and cortical bone were observed in the femur of sham control mice, classical osteoporotic histological profiles were observed in OVX-induced mice as significant decreases in trabecular and cortical bone masses and increases in connective tissues in periosteum of cortical bone resulting from resorption of osteoid tissues related to osteoclast activation. However, bone mass and structures, of both trabecular and cortical bones in all test substance-administered mice were the higher than in OVX control mice, which is related to their inhibitory activities on osteoclast cell activities. Especially, RC:PCP 2:1, 1:1 and 4:1 mixed formula treated mice showed the lower noticeable inhibition in the bone losses and osteoclast cell activations than RC- or PCP-treated mice, in that orders, respectively (Table 7 and Table 8, Figure 5).
TV/BV, Tbn, Tbt, Tbl, and Cbt were the higher in OVX-induced mice than in sham-operated control mice in the femur. However, bone mass and structures in estradiol and 1:1, 1:2, 1:4, 1:8, 2:1, 4:1, and 8:1 RC:PCP mixed formulae—treated mice were the lower than in OVX control mice, respectively (Table 7 and Table 8, Figure 5). Ocn and OS/BS were the higher in OVX-induced mice than in sham control mice, in the femur. However, these activations and increases in osteoclast cells were in all test substances including estradiol were the lower than in OVX control mice. Especially, RC:PCP 2:1, 1:1 and 4:1 mixed formula treated mice showed the lower in the inhibitory activity against bone mass depletion and destroy of structure induced by OVX than RC- or PCP-treated mice, in that orders, respectively (Table 8, Figure 5).

3.7. Biochemical Variable

Serum AST, ALT, TC, LDL, TG and osteocalcin levels were higher and serum HDL, estradiol and bALP levels were the lower in OVX-induced mice than in sham control mice. However, serum AST, ALT, TC, LDL, TG, and osteocalcin levels and serum HDL, estradiol and bALP levels in all test material-treated mice were the lower and higher than in OVX control mice, respectively. Especially, RC:PCP 2:1, 1:1 and 4:1 mixed formula treated mice showed the lower than in single formula of RC- or PCP-treated mice, in that orders, respectively (Table 9, Figure 6 and Figure 7).

3.8. Bone Mineral and Body Fat Density

Total body and femur mean BMDs were the lower and total body and abdominal fat densities were the higher in OVX-induced mice than in sham control mice. However, total body and femur mean BMD in estradiol- and all test material-administered mice were the higher than in OVX control mice, otherwise total body and abdominal fat densities were the lower in all material treated mice than OVX control mice. Especially, the RC:PCP 2:1, 1:1, and 4:1 mixtures showed the higher BMD and the lower fat densities than in RC or PCP alone-treated mice (Table 10).

3.9. Effects of RC/PCP Mixture on Bone Strength

The strengths (FL) of femur mid-shaft regions in OVX-induced mice were the lower than in sham control mice, but FL on the femur in all test substance-administrated mice including 1 mL/kg PCP-treated mice were the higher than in OVX control mice. Especially, RC:PCP 2:1, 1:1, and 4:1 mixtures showed the lower in FL in the femur mid-shaft regions than in RC- or PCP-treated mice, in that orders, respectively (Figure 8).

4. Discussion

In this study, we found that RC with PCP alleviated climacteric symptoms, such as obesity, hyperlipidemia, hepatic steatosis, and osteoporosis, in OVX mice. Our results indicated that RC:PCP mixed formulae (RC:PCP 2:1, 1:1, and 4:1) exerted enhanced pharmacological effects, compared with RC or PCP alone treatment. Large evidence suggested that pomegranate juice and pomegranate polyphenol extracts can protect women from many types of cancer, cardiovascular disease, diabetes, Alzheimer’s disease, arthritis, and colitis [25,36,37]. In addition, pomegranate seed oil and pomegranate juice including flavonoids and anthocyanidins possessed a strong antioxidant activity when compared to that in red wine or green tea extract [38,39]. Flavonoids can interact directly with estrogen receptors and regulate the activity of CYP19, which catalyzes the rate-limiting step in estrogen biosynthesis [40]. These property results in alterations of the overall hormonal balance, consequently leading to prevent bone loss and reducing osteoporotic effects and other menopausal symptoms [41]. These evidences support that the favorable effects of RC [14,22,23] and PCP [26,39] against OVX-induced symptoms are mainly associated with the antioxidant effects of isoflavonoids [15,27]. Therefore, appropriate mixtures consisting of RC and PCP may show greater protective effects by combination of isoflavonoids and ellagic acid [42,43]. The RC and PCP mixture may enhance direct free radical scavenging and indirectly induce antioxidative enzymes. It was thus assumed that appropriate RC:PCP mixtures may show more favorable synergistic anti-climacteric effects. Previously, no information to determine the optimal ranges of RC with PCP existed. Our results suggest that among the seven RC:PCP mixed formulae tested, RC:PCP 2:1 mixture showed the greatest inhibition against the climacteric symptoms induced by OVX in this experiment. Thus, our findings are interesting in that PCP exerted a potentially synergistic effect with other antioxidants, such as RC.
OVX induced marked increases in food consumption, body weight and gains, and abdominal fat deposition with adipocyte hypertrophy, which were inhibited significantly by 2:1, 1:1, and 4;1 RC:PCP mixed formulae. The RC:PCP 2:1 mixture showed the strongest inhibitory activities against obesity induced by OVX. Estrogen deficiency induced by OVX markedly accelerated food intake and changes in body fat deposition in the abdominal cavity. Additionally, an accumulation of fat deposition and cellular hypertrophy through expansion of intra-abdominal adipose tissue were observed in obesity-induced OVX mice. The correlation between estradiol and cholecystokinin (CCK) is well documented [44,45]. In addition, OVX models have been used to explain the mechanism of the operation of glucagon, because the activities of glucagon and glucagon antibodies on reduced and augmented meal sizes were both enhanced by estradiol [46]. Estradiol has been regarded as a modulator of eating and body weight by regulating the potency of the feedback signals that control meal size [46,47]. Under estradiol deficiency, eating and body weight are increased [48,49,50]. There is evidence of clinical relevance in that postmenopausal women show decreased estradiol levels; also, a high proportion of the obese population is represented by postmenopausal women [51]. It is assumed that the anti-obesity effects of the RC:PCP mixture may be related to estrogenic food intake effects, but more complex mechanisms are involved in the anti-obesity effects of PCP. Generally, enhanced digestive motility increases in fecal excretion, leading to a reduction in body weight in rodents [52,53].
OVX-induced mice showed a significant increase in serum TC, LDL, and TG levels, but decreased serum HDL contents. However, the hyperlipidemia resulting from OVX was inhibited significantly by RC:PCP 2:1, 1:1, and 4:1 mixed formulae. This finding is similar to previous reports showing a significant increase in TC, LDL, and TG, and low HDL levels, in postmenopausal women [54]; similar trends in serum lipids were observed in OVX induced mice [55]. The effects of estradiol on serum lipid profiles are believed to be mediated by inhibiting the activity of 3-hydroxy-3-methylglutaryl coenzyme A reductase (HMG-CoA) [56]. Because HMG-CoA is the rate-limiting enzyme involved in cholesterol synthesis, these effects may occur through the elevation of HMG-CoA activity, which is associated with cholesterol synthesis [56].
OVX-induced liver steatosis was observed, while 2:1, 1:1, and 4:1 RC:PCP mixed formulae inhibited OVX-induced hepatic steatosis significantly. As the liver is the major target organ of HMG-CoA reductase [34,57], AST and ALT activities were increased, and hypertrophy and fatty changes were observed in hepatocytes [58,59]. These are related to estrogen deficiency-mediated obesity and hyperlipidemia [34,59,60]. Estrogen deficiency is attributed to an atherogenic lipid profile, characterized by HDL-cholesterol, LDL-cholesterol, triglyceride levels [5], central adiposity [6], increased diastolic pressure [7], and increased insulin resistance [8].
Estrogen-deficiency osteoporosis induced by bilateral OVX was markedly inhibited by RC and PCP single formulae and by the RC:PCP 2:1, 1:1, 4:1 mixed formulae. These effects are related with the increased diversity of isoflavonoids in the mixtures, at least, under these experimental conditions. Previous studies reported that each single formula of RC [23,61] or PCP [26,39] has anti-osteoporotic effects. Bone loss is aggravated in menopausal women with aging, because of the loss of estrogen. Osteoporosis is a bone disease that occurs due to an imbalance between bone resorption and bone formation, which results in bone loss and structural deterioration of bone [62]. When determining anti-osteoporotic activities, the increase in bone weight is used as a good marker; however, it is difficult to evaluate anti-osteoporotic agents through changes in bone weight, with the exception of ash bone weight [63]. For an osteoporosis-related OVX model, bone turnover markers, including serum bALP content and osteocalcin levels, are appropriate [64,65,66], and BMD is considered a pivotal determinant of osteoporosis [67,68,69]. The observation of bone morphology using microscopy is good for evaluating anti-osteoporotic agents [31,35,70,71], especially, the trabecular and cortical bone changes significant in osteoporotic animals. In addition, some histomorphometric indices of bone mass and bone formation are decreased markedly, whereas histomorphometric indices of bone resorption are increased [31,35,72]. Thus, to evaluate the efficacy of various anti-osteoporosis agents, the histology of bones has been regard as an appropriate approach [31,35,71]. The RC:PCP mixed formulae evaluated here showed anti-osteoporotic activities similar to previous results [26,39].
OVX-induced uterine weight along with marked decreases in serum estradiol levels and related uterine atrophic changes, i.e., decreases in total, mucosa and epithelial thicknesses, and uterine glands in the mucosa were suppressed significantly by the RC:PCP mixed formulae. Loss of estrogen after menopause in women leads to climacteric symptoms [73,74], because estrogens affect numerous female target organs, such as the uterus, vagina, and skeletal and cardiovascular systems [75,76]. Recent study reported that soy isoflavone supplementation has no influence in endometrial thickness or in the rates of endometrial hyperplasia and female cancer in postmenopausal women [24]. In contrast, the other study reported that genistein (0.7 mg per day) had protective effect on trabecular bone loss in OVX control mice without hypertrophic effects on the uterus, while administration of genistein (5 mg per day) resulted in uterine hypertrophy. These data indicate that there is a marked difference between genistein dosages that prevent bone loss and those that induce uterine hypertrophy [77]. Genestein and specific ERβ agonist consumption may prevent the ileal and colonic epithelium from tumor development via modulation of tissue homeostasis [78]. Genistein enhanced the basal Toll like receptor 2 (TLR2) and reduced the viral component-induced TLR2 protein expression in human endometrial epithelial cells may suggest the potential role of this soy isoflavone in stimulating the uterine immune function and probably attenuating the inflammation of endometrium following pathogen [79]. Isoflavonoids increase in uterine masses via uterine water imbibition and/or cell proliferation [75,80], which are mediated by ERα [81,82,83]. However, there had limitation in this study that the increase of estradiol level was not explained clearly, more detail mechanism should be studied in future.

5. Conclusions

Taken together, our results indicate that an appropriate mixed formula consisting of RC and PCP (RC:PCP 2:1, 1:1, and 4:1 mixtures) synergistically increased the anti-climacteric effects—estrogenic, antiobesity, hypolipidemic, hepatoprotective, and antiosteoporotic effects—of RC- or PCP-alone in OVX induced mice. The RC:PCP 2:1 mixture, specifically, showed the most favorable inhibitory activities against estrogen-deficiency climacteric symptoms induced by OVX in this study. It is thus expected that the RC:PCP 2:1 mixture may have promise as a new potent protective agent for relieving climacteric symptoms, especially in terms of estrogen depletion, obesity, hyperlipidemia, hepatic steatosis, and osteoporosis, in menopausal women.

Acknowledgments

This work was supported by the National Research Foundation of Korea (NRF) grant funded by the Korea government (MSIP) (No. 2012R1A5A2A42671316).

Author Contributions

Sae Kwang Ku conceived the research design. Su Jin Kang, Chang Hyun Song, Young Joon Lee, and Sae Kwang Ku contributed to the experiment work, analysis of results, and drafting of the manuscript. Beom Rak Choi, Seung Hee Kim, Hae Yeon Yi, and Hye Rim Park prepared and supplied materials and analyzed the compositions of individual materials. All authors reviewed and confirmed the manuscript.

Conflicts of Interest

The authors declare no conflict of interest.

Appendix A. Body Weight Changes in Sham-Operated or OVX ddY Mice

Nutrients 08 00447 i001
Significant (p < 0.01) increases in body weight were detected in all OVX mice as compared with sham control mice, in this experiment (red arrow). However, significant decreases of body weights were demonstrated in estradiol, RC and PCP single formula treated mice from 14, 21 and 28 days after initial administration, and also from 14, 21 or 28 days after initial treatment in all nine types of RC:PCP 2:1 mixed formula (g/g) treated mice as compared with OVX control mice, respectively. In addition, all test substance treated mice showed significant decreases of body weight gains during 84 days of treatment periods as compared with OVX control (arrows). Especially, RC:PCP 2:1, 1:1 and 4:1 mixtures (g/g) treated OVX mice showed significant decreases of body weights as compared with each of single formula of RC and PCP treated mice from 28, 42 and 49 days after administration, respectively (dot arrows). Values are expressed mean ± S.D. of eight mice. OVX = Ovariectomy, RC = Red clover dry extracts, PCP = Pomegranate Concentrate Powder, RC:PCP = Mixed formulations consisted of RC and PCP (g/g). −1 means 1 day before start of administration at 27 days after OVX surgery, 0 means at start of administration, at 28 days after OVX, 84 means 84 days after start of administration, at sacrifice. All animals were overnight fasted before OVX, first administration and sacrifice, respectively.

Appendix B. Food Consumptions in Sham-Operated or OVX ddY Mice

Points GroupsFood Consumption (g/24 h/Mouse): Days after Initial Treatment
137285683
Controls
Sham7.20 ± 0.726.35 ± 0.676.29 ± 0.726.59 ± 0.777.31 ± 0.907.54 ± 0.78
OVX11.40 ± 1.44 *11.11 ± 0.98 *11.29 ± 1.03 *11.38 ± 1.33 *12.80 ± 1.41 *14.75 ± 1.57 *
Estradiol11.49 ± 1.41 *10.53 ± 0.93 *9.82 ± 0.93 *,#9.52 ± 1.01 *,#10.24 ± 0.98 *,#10.65 ± 1.54 *,#
RC11.26 ± 1.18 *11.01 ± 1.53 *11.06 ± 1.06 *11.11 ± 0.92 *12.66 ± 1.62 *14.60 ± 1.08 *
PCP11.91 ± 1.38 *11.36 ± 1.67 *11.52 ± 1.20 *11.26 ± 1.31 *12.87 ± 1.55 *14.67 ± 1.34 *
RC:PCP
1:111.46 ± 1.12 *10.98 ± 1.34 *11.13 ± 1.24 *11.29 ± 1.31 *12.43 ± 1.36 *14.52 ± 1.40 *
1:211.08 ± 1.19 *10.96 ± 1.25 *11.33 ± 1.25 *11.57 ± 1.19 *13.04 ± 0.91 *14.79 ± 1.35 *
1:411.24 ± 1.13 *11.34 ± 1.11 *11.58 ± 1.32 *11.84 ± 1.44 *12.45 ± 0.84 *14.38 ± 1.68 *
1:811.62 ± 1.01 *11.17 ± 1.40 *11.37 ± 1.55 *11.43 ± 1.35 *12.95 ± 0.92 *14.65 ± 2.04 *
2:111.66 ± 0.93 *11.25 ± 0.95 *11.04 ± 1.61 *11.31 ± 1.14 *12.90 ± 1.33 *14.59 ± 1.62 *
4:111.42 ± 1.46 *11.25 ± 0.99 *11.40 ± 1.26 *11.34 ± 1.26 *12.76 ± 1.17 *14.83 ± 1.23 *
8:111.34 ± 1.99 *11.13 ± 1.13 *11.37 ± 1.58 *11.46 ± 1.25 *12.86 ± 0.72 *14.89 ± 1.17 *
Values are expressed mean ± S.D. of eight mice. * p < 0.05 as compared with sham control, # p < 0.05 as compared with OVX control. OVX = Bilateral ovariectomy, RC = Red clover dry extracts, PCP = Pomegranate Concentrate Powder, RC:PCP = Mixed formulations consisted of RC and PCP (g/g).

References

  1. Speroff, L. The menopause: A signal for the future. In Treatment of the Postmenopausal Woman; Lobo, R.A., Ed.; Raven Press: New York, NY, USA, 2005; pp. 1–7. [Google Scholar]
  2. Dennerstein, L.; Lehert, P.; Guthrie, J. The effects of the menopausal transition and biopsychosocial factors on well-being. Arch. Womens Ment. Health 2002, 5, 15–22. [Google Scholar] [CrossRef] [PubMed]
  3. Van Seumeren, I. Weight gain and hormone replacement therapy: Are women’s fears justified? Maturitas 2000, 34 (Suppl. 1), S3–S8. [Google Scholar] [CrossRef]
  4. Choi, J.S.; Koh, I.U.; Song, J. Genistein reduced insulin resistance index through modulating lipid metabolism in ovariectomized rats. Nutr. Res. 2012, 32, 844–855. [Google Scholar] [CrossRef] [PubMed]
  5. Warren, M.P.; Halpert, S. Hormone replacement therapy: Controversies, pros and cons. Best Pract. Res. Clin. Endocrinol. Metab. 2004, 18, 317–332. [Google Scholar] [CrossRef] [PubMed]
  6. Augoulea, A.; Mastorakos, G.; Lambrinoudaki, I.; Christodoulakos, G.; Creatsas, G. Role of postmenopausal hormone replacement therapy on body fat gain and leptin levels. Gynecol. Endocrinol. 2005, 20, 227–235. [Google Scholar] [CrossRef] [PubMed]
  7. Reckelhoff, J.F. Basic research into the mechanisms responsible for postmenopausal hypertension. Int. J. Clin. Pract. Suppl. 2004, 139, 13–19. [Google Scholar] [PubMed]
  8. Wu, S.I.; Chou, P.; Tsai, S.T. The impact of years since menopause on the development of impaired glucose tolerance. J. Clin. Epidemiol. 2001, 54, 117–120. [Google Scholar] [CrossRef]
  9. Han, K.K.; Soares, J.M., Jr.; Haidar, M.A.; de Lima, G.R.; Baracat, E.C. Benefits of soy isoflavone therapeutic regimen on menopausal symptoms. Obstet. Gynecol. 2002, 99, 389–394. [Google Scholar] [CrossRef] [PubMed]
  10. Beral, V.; Bull, D.; Reeves, G.; Million Women Study, C. Endometrial cancer and hormone-replacement therapy in the million women study. Lancet 2005, 365, 1543–1551. [Google Scholar] [PubMed]
  11. Kaari, C.; Haidar, M.A.; Júnior, J.M.; Nunes, M.G.; Quadros, L.G.; Kemp, C.; Stavale, J.N.; Baracat, E.C. Randomized clinical trial comparing conjugated equine estrogens and isoflavones in postmenopausal women: A pilot study. Maturitas 2006, 53, 49–58. [Google Scholar] [CrossRef] [PubMed]
  12. Knight, D.C.; Eden, J.A. A review of the clinical effects of phytoestrogens. Obstet. Gynecol. 1996, 87, 897–904. [Google Scholar] [PubMed]
  13. Setchell, K.D. Phytoestrogens: The biochemistry, physiology, and implications for human health of soy isoflavones. Am. J. Clin. Nutr. 1998, 68, 1333S–1346S. [Google Scholar] [PubMed]
  14. Del Giorno, C.; Fonseca, A.M.; Bagnoli, V.R.; Assis, J.S.; Soares, J.M., Jr.; Baracat, E.C. Effects of Trifolium pratense on the climacteric and sexual symptoms in postmenopause women. Rev. Assoc. Med. Bras. 2010, 56, 558–562. [Google Scholar] [PubMed]
  15. Bachmann, G.A. Vasomotor flushes in menopausal women. Am. J. Obstet. Gynecol. 1999, 180, S312–S316. [Google Scholar] [CrossRef]
  16. Hedelin, M.; Klint, A.; Chang, E.T.; Bellocco, R.; Johansson, J.E.; Andersson, S.O.; Heinonen, S.M.; Adlercreutz, H.; Adami, H.O.; Grönberg, H.; et al. Dietary phytoestrogen, serum enterolactone and risk of prostate cancer: The cancer prostate Sweden study (Sweden). Cancer Causes Control 2006, 17, 169–180. [Google Scholar] [CrossRef] [PubMed]
  17. Taku, K.; Umegaki, K.; Sato, Y.; Taki, Y.; Endoh, K.; Watanabe, S. Soy isoflavones lower serum total and LDL cholesterol in humans: A meta-analysis of 11 randomized controlled trials. Am. J. Clin. Nutr. 2007, 85, 1148–1156. [Google Scholar] [PubMed]
  18. Ma, D.F.; Qin, L.Q.; Wang, P.Y.; Katoh, R. Soy isoflavone intake increases bone mineral density in the spine of menopausal women: Meta-analysis of randomized controlled trials. Clin. Nutr. 2008, 27, 57–64. [Google Scholar] [CrossRef] [PubMed]
  19. Henderson, B.E.; Feigelson, H.S. Hormonal carcinogenesis. Carcinogenesis 2000, 21, 427–433. [Google Scholar] [CrossRef] [PubMed]
  20. Choi, J.S.; Kim, J.W.; Kim, K.Y.; Cho, H.R.; Choi, I.S.; Ku, S.K. Antiosteoporotic effects of polycan in combination with calcium lactate-gluconate in ovariectomized rats. Exp. Ther. Med. 2014, 8, 957–967. [Google Scholar] [CrossRef] [PubMed]
  21. Ho, S.M. Estrogen, progesterone and epithelial ovarian cancer. Reprod. Biol. Endocrinol. 2003, 1, 73. [Google Scholar] [CrossRef] [PubMed] [Green Version]
  22. Vishali, N.; Kamakshi, K.; Suresh, S.; Prakash, S. Red clover Trifolium pratense (Linn.) isoflavones extract on the pain threshold of normal and ovariectomized rats—A long-term study. Phytother. Res. 2011, 25, 53–58. [Google Scholar] [CrossRef] [PubMed]
  23. Kawakita, S.; Marotta, F.; Naito, Y.; Gumaste, U.; Jain, S.; Tsuchiya, J.; Minelli, E. Effect of an isoflavones-containing red clover preparation and alkaline supplementation on bone metabolism in ovariectomized rats. Clin. Interv. Aging 2009, 4, 91–100. [Google Scholar] [PubMed]
  24. Quaas, A.M.; Kono, N.; Mack, W.J.; Hodis, H.N.; Felix, J.C.; Paulson, R.J.; Shoupe, D. Effect of isoflavone soy protein supplementation on endometrial thickness, hyperplasia, and endometrial cancer risk in postmenopausal women: A randomized controlled trial. Menopause 2013, 20, 840–844. [Google Scholar] [CrossRef] [PubMed]
  25. Wasila, H.; Li, X.; Liu, L.; Ahmad, I.; Ahmad, S. Peel effects on phenolic composition, antioxidant activity, and making of pomegranate juice and wine. J. Food Sci. 2013, 78, C1166–C1172. [Google Scholar] [CrossRef] [PubMed]
  26. Spilmont, M.; Leotoing, L.; Davicco, M.J.; Lebecque, P.; Mercier, S.; Miot-Noirault, E.; Pilet, P.; Rios, L.; Wittrant, Y.; Coxam, V. Pomegranate and its derivatives can improve bone health through decreased inflammation and oxidative stress in an animal model of postmenopausal osteoporosis. Eur. J. Nutr. 2014, 53, 1155–1164. [Google Scholar] [CrossRef] [PubMed]
  27. Baber, R.J.; Templeman, C.; Morton, T.; Kelly, G.E.; West, L. Randomized placebo-controlled trial of an isoflavone supplement and menopausal symptoms in women. Climacteric 1999, 2, 85–92. [Google Scholar] [CrossRef] [PubMed]
  28. Sreeja, S.; Santhosh Kumar, T.R.; Lakshmi, B.S.; Sreeja, S. Pomegranate extract demonstrate a selective estrogen receptor modulator profile in human tumor cell lines and in vivo models of estrogen deprivation. J. Nutr. Biochem. 2012, 23, 725–732. [Google Scholar] [CrossRef] [PubMed]
  29. Jung, Y.M.; Lee, S.H.; Lee, D.S.; You, M.J.; Chung, I.K.; Cheon, W.H.; Kwon, Y.S.; Lee, Y.J.; Ku, S.K. Fermented garlic protects diabetic, obese mice when fed a high-fat diet by antioxidant effects. Nutr. Res. 2011, 31, 387–396. [Google Scholar] [CrossRef] [PubMed]
  30. Food and Drug Administration (FDA). Fda Guidelines for Preclinical and Clinical Evaluation of Agents for the Treatment or Prevention of Postmenopausal Osteoporosis; FDA: Rockville, MD, USA, 1994. [Google Scholar]
  31. Shin, H.D.; Yang, K.J.; Park, B.R.; Son, C.W.; Jang, H.J.; Ku, S.K. Antiosteoporotic effect of polycan, beta-glucan from aureobasidium, in ovariectomized osteoporotic mice. Nutrition 2007, 23, 853–860. [Google Scholar] [CrossRef] [PubMed]
  32. Kim, C.M.; Yi, S.J.; Cho, I.J.; Ku, S.K. Red-koji fermented red ginseng ameliorates high fat diet-induced metabolic disorders in mice. Nutrients 2013, 5, 4316–4332. [Google Scholar] [CrossRef] [PubMed]
  33. Kang, S.J.; Lee, J.E.; Lee, E.K.; Jung, D.H.; Song, C.H.; Park, S.J.; Choi, S.H.; Han, C.H.; Ku, S.K.; Lee, Y.J. Fermentation with aquilariae lignum enhances the anti-diabetic activity of green tea in type II diabetic db/db mouse. Nutrients 2014, 6, 3536–3571. [Google Scholar] [CrossRef] [PubMed]
  34. Lim, D.W.; Kim, J.G.; Kim, Y.T. Effects of dietary isoflavones from puerariae radix on lipid and bone metabolism in ovariectomized rats. Nutrients 2013, 5, 2734–2746. [Google Scholar] [CrossRef] [PubMed]
  35. Han, S.Y.; Lee, J.R.; Kwon, Y.K.; Jo, M.J.; Park, S.J.; Kim, S.C.; Lee, H.S.; Ku, S.K. Ostreae testa prevent ovariectomy-induced bone loss in mice by osteoblast activations. J. Ethnopharmacol. 2007, 114, 400–405. [Google Scholar] [CrossRef] [PubMed]
  36. Zahin, M.; Aqil, F.; Ahmad, I. Broad spectrum antimutagenic activity of antioxidant active fraction of Punica granatum l. Peel extracts. Mutat. Res. 2010, 703, 99–107. [Google Scholar] [CrossRef] [PubMed]
  37. Landete, J. Ellagitannins, ellagic acid and their derived metabolites: A review about source, metabolism, functions and health. Food Res. Int. 2011, 44, 1150–1160. [Google Scholar] [CrossRef]
  38. Singh, R.P.; Chidambara Murthy, K.N.; Jayaprakasha, G.K. Studies on the antioxidant activity of pomegranate (Punica granatum) peel and seed extracts using in vitro models. J. Agric. Food Chem. 2002, 50, 81–86. [Google Scholar] [CrossRef] [PubMed]
  39. Mori-Okamoto, J.; Otawara-Hamamoto, Y.; Yamato, H.; Yoshimura, H. Pomegranate extract improves a depressive state and bone properties in menopausal syndrome model ovariectomized mice. J. Ethnopharmacol. 2004, 92, 93–101. [Google Scholar] [CrossRef] [PubMed]
  40. Lee, Y.S.; Lorenzo, B.J.; Koufis, T.; Reidenberg, M.M. Grapefruit juice and its flavonoids inhibit 11 beta-hydroxysteroid dehydrogenase. Clin. Pharmacol. Ther. 1996, 59, 62–71. [Google Scholar] [CrossRef]
  41. Hodek, P.; Trefil, P.; Stiborova, M. Flavonoids-potent and versatile biologically active compounds interacting with cytochromes P450. Chem. Biol. Interact. 2002, 139, 1–21. [Google Scholar] [CrossRef]
  42. Valko, M.; Leibfritz, D.; Moncol, J.; Cronin, M.T.; Mazur, M.; Telser, J. Free radicals and antioxidants in normal physiological functions and human disease. Int. J. Biochem. Cell Biol. 2007, 39, 44–84. [Google Scholar] [CrossRef] [PubMed]
  43. Ahmed, M.M.; Samir, E.S.; El-Shehawi, A.M.; Alkafafy, M.E. Anti-obesity effects of taif and egyptian pomegranates: Molecular study. Biosci. Biotechnol. Biochem. 2015, 79, 598–609. [Google Scholar] [CrossRef] [PubMed]
  44. Asarian, L.; Geary, N. Estradiol enhances cholecystokinin-dependent lipid-induced satiation and activates estrogen receptor-alpha-expressing cells in the nucleus tractus solitarius of ovariectomized rats. Endocrinology 2007, 148, 5656–5666. [Google Scholar] [CrossRef] [PubMed]
  45. Thammacharoen, S.; Lutz, T.A.; Geary, N.; Asarian, L. Hindbrain administration of estradiol inhibits feeding and activates estrogen receptor-a-expressing cells in the nucleus tractus solitarius of ovariectomized rats. Endocrinology 2008, 149, 1609–1617. [Google Scholar] [CrossRef] [PubMed] [Green Version]
  46. Geary, N.; Asarian, L. Estradiol increases glucagon’s satiating potency in ovariectomized rats. Am. J. Physiol. Regul. Integr. Comp. Physiol. 2001, 281, R1290–R1294. [Google Scholar] [PubMed]
  47. Asarian, L.; Geary, N. Modulation of appetite by gonadal steroid hormones. Philos. Trans. R. Soc. Lond. B Biol. Sci. 2006, 361, 1251–1263. [Google Scholar] [CrossRef] [PubMed]
  48. Eckel, L.A. Estradiol: A rhythmic, inhibitory, indirect control of meal size. Physiol. Behav. 2004, 82, 35–41. [Google Scholar] [CrossRef] [PubMed]
  49. Geary, N. The estrogenic inhibition of eating. In Neurobiology of Food and Fluid Intake; Stricker, E.M., Woods, S., Eds.; Springer US: New York, NY, USA, 2004; Volume 14, pp. 307–345. [Google Scholar]
  50. Butera, P.C. Estradiol and the control of food intake. Physiol. Behav. 2010, 99, 175–180. [Google Scholar] [CrossRef] [PubMed]
  51. Lutz, T.A. Amylin may offer (more) help to treat postmenopausal obesity. Endocrinology 2011, 152, 1–3. [Google Scholar] [CrossRef] [PubMed]
  52. Bertrand, R.L.; Senadheera, S.; Markus, I.; Liu, L.; Howitt, L.; Chen, H.; Murphy, T.V.; Sandow, S.L.; Bertrand, P.P. A western diet increases serotonin availability in rat small intestine. Endocrinology 2011, 152, 36–47. [Google Scholar] [CrossRef] [PubMed]
  53. Snedeker, S.M.; Hay, A.G. Do interactions between gut ecology and environmental chemicals contribute to obesity and diabetes? Environ. Health Perspect. 2012, 120, 332–339. [Google Scholar] [CrossRef] [PubMed]
  54. Kim, H.M.; Park, J.; Ryu, S.Y.; Kim, J. The effect of menopause on the metabolic syndrome among korean women: The korean national health and nutrition examination survey, 2001. Diabetes Care 2007, 30, 701–706. [Google Scholar] [CrossRef] [PubMed]
  55. Chiba, H.; Uehara, M.; Wu, J.; Wang, X.; Masuyama, R.; Suzuki, K.; Kanazawa, K.; Ishimi, Y. Hesperidin, a citrus flavonoid, inhibits bone loss and decreases serum and hepatic lipids in ovariectomized mice. J. Nutr. 2003, 133, 1892–1897. [Google Scholar] [PubMed]
  56. Di Croce, L.; Bruscalupi, G.; Trentalance, A. Independent behavior of rat liver LDL receptor and hmgcoa reductase under estrogen treatment. Biochem. Biophys. Res. Commun. 1996, 224, 345–350. [Google Scholar] [CrossRef] [PubMed]
  57. Wang, J.F.; Guo, Y.X.; Niu, J.Z.; Liu, J.; Wang, L.Q.; Li, P.H. Effects of radix puerariae flavones on liver lipid metabolism in ovariectomized rats. World J. Gastroenterol. 2004, 10, 1967–1970. [Google Scholar] [CrossRef] [PubMed]
  58. Radi, Z.A.; Koza-Taylor, P.H.; Bell, R.R.; Obert, L.A.; Runnels, H.A.; Beebe, J.S.; Lawton, M.P.; Sadis, S. Increased serum enzyme levels associated with kupffer cell reduction with no signs of hepatic or skeletal muscle injury. Am. J. Pathol. 2011, 179, 240–247. [Google Scholar] [CrossRef] [PubMed]
  59. Kanaya, N.; Vonderfecht, S.; Chen, S. Androgen (dihydrotestosterone)-mediated regulation of food intake and obesity in female mice. J. Steroid Biochem. Mol. Biol. 2013, 138, 100–106. [Google Scholar] [CrossRef] [PubMed]
  60. Zhang, L.; Zhou, M.; Fang, G.; Tang, Y.; Chen, Z.; Liu, X. Hypocholesterolemic effect of capsaicinoids by increased bile acids excretion in ovariectomized rats. Mol. Nutr. Food Res. 2013, 57, 1080–1088. [Google Scholar] [CrossRef] [PubMed]
  61. Allred, C.D.; Allred, K.F.; Ju, Y.H.; Clausen, L.M.; Doerge, D.R.; Schantz, S.L.; Korol, D.L.; Wallig, M.A.; Helferich, W.G. Dietary genistein results in larger mnu-induced, estrogen-dependent mammary tumors following ovariectomy of sprague-dawley rats. Carcinogenesis 2004, 25, 211–218. [Google Scholar] [CrossRef] [PubMed]
  62. Sakai, A.; Nishida, S.; Okimoto, N.; Okazaki, Y.; Hirano, T.; Norimura, T.; Suda, T.; Nakamura, T. Bone marrow cell development and trabecular bone dynamics after ovariectomy in ddy mice. Bone 1998, 23, 443–451. [Google Scholar] [CrossRef]
  63. Yamamoto, M.; Fisher, J.E.; Gentile, M.; Seedor, J.G.; Leu, C.T.; Rodan, S.B.; Rodan, G.A. The integrin ligand echistatin prevents bone loss in ovariectomized mice and rats. Endocrinology 1998, 139, 1411–1419. [Google Scholar] [CrossRef] [PubMed]
  64. Cui, Y.; Bhandary, B.; Marahatta, A.; Lee, G.H.; Li, B.; Kim, D.S.; Chae, S.W.; Kim, H.R.; Chae, H.J. Characterization of salvia miltiorrhiza ethanol extract as an anti-osteoporotic agent. BMC Complement Altern. Med. 2011, 11, 120. [Google Scholar] [CrossRef] [PubMed]
  65. Farley, J.R.; Chesnut, C.H., 3rd; Baylink, D.J. Improved method for quantitative determination in serum of alkaline phosphatase of skeletal origin. Clin. Chem. 1981, 27, 2002–2007. [Google Scholar] [PubMed]
  66. Li, J.Y.; Tawfeek, H.; Bedi, B.; Yang, X.; Adams, J.; Gao, K.Y.; Zayzafoon, M.; Weitzmann, M.N.; Pacifici, R. Ovariectomy disregulates osteoblast and osteoclast formation through the t-cell receptor CD40 ligand. Proc. Natl. Acad. Sci. USA 2011, 108, 768–773. [Google Scholar] [CrossRef] [PubMed]
  67. Bilston, L.E.; Little, D.G.; Smith, N.C.; Williams, P.; Briody, J. Zoledronic acid improves the mechanical properties of normal and healing bone. Clin. Biomech. (Bristol, Avon) 2002, 17, 716–718. [Google Scholar] [CrossRef]
  68. Diez, F. Guidelines for the diagnosis of osteoporosis by densitometric methods. J. Manip. Physiol. Ther. 2002, 25, 403–415. [Google Scholar] [CrossRef]
  69. Syed, Z.; Khan, A. Bone densitometry: Applications and limitations. J. Obstet. Gynaecol. Can. 2002, 24, 476–484. [Google Scholar] [CrossRef]
  70. Yamaguchi, K.; Yada, M.; Tsuji, T.; Kuramoto, M.; Uemura, D. Suppressive effect of norzoanthamine hydrochloride on experimental osteoporosis in ovariectomized mice. Biol. Pharm. Bull. 1999, 22, 920–924. [Google Scholar] [CrossRef] [PubMed]
  71. Heikkinen, T.; Puolivali, J.; Tanila, H. Effects of long-term ovariectomy and estrogen treatment on maze learning in aged mice. Exp. Gerontol. 2004, 39, 1277–1283. [Google Scholar] [CrossRef] [PubMed]
  72. Glatt, M.; Pataki, A.; Evans, G.P.; Hornby, S.B.; Green, J.R. Loss of vertebral bone and mechanical strength in estrogen-deficient rats is prevented by long-term administration of zoledronic acid. Osteoporos. Int. 2004, 15, 707–715. [Google Scholar] [CrossRef] [PubMed]
  73. Turner, R.T.; Riggs, B.L.; Spelsberg, T.C. Skeletal effects of estrogen. Endocr. Rev. 1994, 15, 275–300. [Google Scholar] [PubMed]
  74. Versi, E.; Harvey, M.A.; Cardozo, L.; Brincat, M.; Studd, J.W. Urogenital prolapse and atrophy at menopause: A prevalence study. Int. Urogynecol. J. Pelvic Floor Dysfunct. 2001, 12, 107–110. [Google Scholar] [CrossRef] [PubMed]
  75. Couse, J.F.; Korach, K.S. Estrogen receptor null mice: What have we learned and where will they lead us? Endocr. Rev. 1999, 20, 358–417. [Google Scholar] [CrossRef] [PubMed]
  76. Korach, K.S.; Migliaccio, S.; Davis, V.L. Estrogens. In Principles of Pharmacology: Basic Concepts and Clinical Applications; Munson, P.L., Mueller, R.A., Breese, G.R., Eds.; Chapman & Hall: New York, NY, USA, 1995; pp. 809–825. [Google Scholar]
  77. Ishimi, Y.; Arai, N.; Wang, X.; Wu, J.; Umegaki, K.; Miyaura, C.; Takeda, A.; Ikegami, S. Difference in effective dosage of genistein on bone and uterus in ovariectomized mice. Biochem. Biophys. Res. Commun. 2000, 274, 697–701. [Google Scholar] [CrossRef] [PubMed]
  78. Schleipen, B.; Hertrampf, T.; Fritzemeier, K.H.; Kluxen, F.M.; Lorenz, A.; Molzberger, A.; Velders, M.; Diel, P. Erb-specific agonists and genistein inhibit proliferation and induce apoptosis in the large and small intestine. Carcinogenesis 2011, 32, 1675–1683. [Google Scholar] [CrossRef] [PubMed]
  79. Buathong, N.; Poonyachoti, S.; Deachapunya, C. Isoflavone genistein modulates the protein expression of toll-like receptors in cancerous human endometrial cells. J. Med. Assoc. Thail. 2015, 98 (Suppl. 9), S31–S38. [Google Scholar]
  80. Hewitt, S.C.; Deroo, B.J.; Hansen, K.; Collins, J.; Grissom, S.; Afshari, C.A.; Korach, K.S. Estrogen receptor-dependent genomic responses in the uterus mirror the biphasic physiological response to estrogen. Mol. Endocrinol. 2003, 17, 2070–2083. [Google Scholar] [CrossRef] [PubMed]
  81. Akiyama, T.; Ishida, J.; Nakagawa, S.; Ogawara, H.; Watanabe, S.; Itoh, N.; Shibuya, M.; Fukami, Y. Genistein, a specific inhibitor of tyrosine-specific protein kinases. J. Biol. Chem. 1987, 262, 5592–5595. [Google Scholar] [PubMed]
  82. Kuiper, G.G.; Carlsson, B.; Grandien, K.; Enmark, E.; Haggblad, J.; Nilsson, S.; Gustafsson, J.A. Comparison of the ligand binding specificity and transcript tissue distribution of estrogen receptors a and b. Endocrinology 1997, 138, 863–870. [Google Scholar] [CrossRef] [PubMed]
  83. Cornwell, T.; Cohick, W.; Raskin, I. Dietary phytoestrogens and health. Phytochemistry 2004, 65, 995–1016. [Google Scholar] [CrossRef] [PubMed]
Figure 1. Experimental designs used in this study. OVX = Bilateral ovariectomy, RC = Red clover dry extracts, PCP = Pomegranate Concentrate Powder, RC:PCP = Mixed formulations consisted of RC and PCP (g/g).
Nutrients 08 00447 g001
Figure 2. Representative histological images of the adipocytes, taken from sham-operated or OVX ddY mice abdominal fat pads deposited in abdominal cavity. (A) Sham vehicle control mice; (B) OVX control mice; (C) 17β-estradiol OVX induced mice; (D) RC alone administered OVX induced mice; (E) PCP alone administered OVX induced mice; (FL) RC:PCP 1:1, 1:2, 1:4, 1:8, 2:1, 4:1, and 8:1 mixtures administered OVX-induced mice, respectively. OVX = Ovariectomy; RC = Red clover dry extracts; PCP = Pomegranate Concentrate Powder; RC:PCP = Mixed formulations consisted of RC and PCP (g/g). All H&E stain. Scale bars = 120 μm.
Nutrients 08 00447 g002
Figure 3. Representative histological images of the left uterus horn, taken from sham-operated or OVX ddY mice. (A) Sham vehicle control mice; (B) OVX control mice; (C) 17β-estradiol OVX induced mice; (D) RC alone administered OVX induced mice; (E) PCP alone administered OVX induced mice; (FL) RC:PCP 1:1, 1:2, 1:4, 1:8, 2:1, 4:1, and 8:1 mixtures administered OVX-induced mice, respectively. OVX = Ovariectomy; RC = Red clover dry extracts; PCP = Pomegranate Concentrate Powder; RC:PCP = Mixed formulations consisted of RC and PCP (g/g); L = Lumen; MU = Mucosa; ML = Muscular layer; UG = Uterine gland. All H&E stain. Scale bars = 120 μm.
Nutrients 08 00447 g003
Figure 4. Representative histological images of the left lateral lobes of liver, taken from sham-operated or OVX ddY mice. (A) Sham vehicle control mice; (B) OVX control mice; (C) 17β-estradiol OVX induced mice; (D) RC alone administered OVX induced mice; (E) PCP alone administered OVX induced mice; (FL) RC:PCP 1:1, 1:2, 1:4, 1:8, 2:1, 4:1, and 8:1 mixtures administered OVX-induced mice, respectively. OVX = Ovariectomy; RC = Red clover dry extracts; PCP = Pomegranate Concentrate Powder; RC:PCP = Mixed formulations consisted of RC and PCP (g/g); CV = Central vein; PT = Portal Triad. Scale bars = 120 μm.
Nutrients 08 00447 g004
Figure 5. Representative histological profiles of the left femur, taken from sham-operated or OVX ddY mice. (A) Sham vehicle control mice; (B) OVX control mice; (C) 17β-estradiol OVX induced mice; (D) RC alone administered OVX induced mice; (E) PCP alone administered OVX induced mice; (FL) RC:PCP 1:1, 1:2, 1:4, 1:8, 2:1, 4:1, and 8:1 mixtures administered OVX-induced mice, respectively. OVX = Ovariectomy; RC = Red clover dry extracts; PCP = Pomegranate Concentrate Powder; RC:PCP = Mixed formulations consisted of RC and PCP (g/g); Cb = cortical bone; Tb = trabecular bone; Bm = bone marrow; Gp = growth plate. All Safranin O stain. Scale bars = 240 μm.
Nutrients 08 00447 g005
Figure 6. Serum Estradiol Levels in Sham-operated or OVX ddY Mice. Values are expressed mean ± S.D. of eight mice. OVX = Ovariectomy; RC = Red clover dry extracts; PCP = Pomegranate Concentrate Powder; RC:PCP = Mixed formulations consisted of RC and PCP (g/g). * p < 0.05 as compared with sham control; # p < 0.05 as compared with OVX control; p < 0.05 as compared with RC single formula treated mice; p < 0.05 as compared with PCP single formula treated mice.
Nutrients 08 00447 g006
Figure 7. Serum (a) Osteocalcin and (b) bALP Levels in Sham-operated or OVX ddY Mice. Values are expressed mean ± S.D. of eight mice. OVX = Ovariectomy; E2 = 17β-estradiol; RC = Red clover dry extracts; PCP = Pomegranate Concentrate Powder; RC:PCP = Mixed formulations consisted of RC and PCP (g/g). * p < 0.05 as compared with sham control; # p < 0.05 as compared with OVX control; p < 0.05 as compared with RC single formula treated mice; p < 0.05 as compared with PCP single formula treated mice.
Nutrients 08 00447 g007
Figure 8. Femur FL in Sham-operated or OVX ddY mice. Values are expressed mean ± S.D. of eight mice. OVX = Ovariectomy; E2 = 17β-estradiol; RC = Red clover dry extracts; PCP = Pomegranate Concentrate Powder; RC:PCP = Mixed formulations consisted of RC and PCP (g/g); FL = Failure load, bone strength. * p < 0.05 as compared with sham control; # p < 0.05 as compared with OVX control; p < 0.05 as compared with RC single formula treated mice; p < 0.05 as compared with PCP single formula treated mice.
Nutrients 08 00447 g008
Table 1. Ingredient of diets used in this study.
Ingredient (g/kg Diet)
Casein200
l-Cystein3
Corn starch150
Sucrose500
Cellulose50
Soybean oil50
Lard0
Mineral mixture35
Vitamin mixture10
Choline bitartrate2
Energy (kcal/g)4.00
Protein (% kcal)20
Carbohydrate (% kcal)64
Fat (% kcal)16
Table 2. Body weight gains in Sham-operated or OVX ddY Mice.
Periods GroupsBody Weights (g)Body Weight Gains During Treatment (g)
At OVX aAt Initial Treatment aAt Sacrifice a
Controls
Sham23.61 ± 1.6424.75 ± 1.8128.00 ± 2.233.25 ± 1.92
OVX24.21 ± 1.4730.78 ± 2.12 *42.90 ± 2.28 *14.68 ± 2.88 *
Estradiol24.65 ± 0.9928.71 ± 1.61 *35.68 ± 2.19 *,#6.96 ± 1.21 *,#
RC23.93 ± 1.4728.98 ± 1.73 *36.44 ± 1.52 *,#8.15 ± 0.95 *,#
PCP24.60 ± 1.1928.78 ± 2.02 *37.30 ± 2.38 *,#8.53 ± 1.31 *,#
RC:PCP
1:124.41 ± 0.9728.53 ± 1.65 *33.26 ± 1.85 *,#,†,‡4.74 ± 1.55 #,†,‡
1:224.69 ± 1.3328.56 ± 1.78 *35.24 ± 2.54 *,#6.68 ± 2.55 *,#
1:424.40 ± 0.9728.44 ± 1.52 *35.59 ± 2.05 *,#7.15 ± 1.86 *,#
1:824.66 ± 1.1128.69 ± 1.31 *35.69 ± 1.95 *,#7.00 ± 2.58 *,#
2:124.58 ± 1.0828.50 ± 1.54 *32.29 ± 2.53 *,#,†,‡3.79 ± 2.28 #,†,‡
4:124.31 ± 1.8628.41 ± 0.88 *33.64 ± 1.45 *,#,†,‡5.23 ± 1.80 #,†,‡
8:124.61 ± 1.7728.73 ± 1.12 *36.86 ± 4.74 *,#8.14 ± 4.99 *,#
Values are expressed mean ± S.D. of eight mice. a All animals were overnight fasted; * p < 0.01 as compared with sham control; # p < 0.05 as compared with OVX control; p < 0.05 as compared with RC single formula treated mice; p < 0.01 as compared with PCP single formula treated mice; OVX = Bilateral ovariectomy; RC = Red clover dry extracts; PCP = Pomegranate Concentrate Powder; RC:PCP = Mixed formulations consisted of RC and PCP (g/g).
Table 3. Abdominal fat pad, uterus and liver weights in sham-operated or OVX ddY mice.
Organs GroupsRelative Wet-Weight (% of Body Weight)
Abdominal Fat PadUterusLiver
Controls
Sham0.492 ± 0.3900.858 ± 0.2864.291 ± 0.819
OVX7.835 ± 0.814 *0.064 ± 0.022 *2.929 ± 0.369 *
Estradiol1.656 ± 1.432 *,#0.303 ± 0.124 *,#3.724 ± 0.307 #
RC4.563 ± 1.417 *,#0.112 ± 0.018 *,#3.571 ± 0.429 #
PCP4.970 ± 1.163 *,#0.107 ± 0.013 *,#3.552 ± 0.388 #
RC:PCP
1:10.157 ± 0.010 *,#,†,‡4.166 ± 0.165 #,†,‡1.386 ± 0.095
1:20.118 ± 0.022 *,#3.508 ± 0.525 *,#1.234 ± 0.192
1:40.111 ± 0.020 *,#3.549 ± 0.576 #1.254 ± 0.140
1:80.111 ± 0.014 *,#3.590 ± 0.487 #1.275 ± 0.131
2:10.193 ± 0.032 *,#,†,‡4.392 ± 0.428 #,†,‡1.411 ± 0.092
4:10.155 ± 0.028 *,#,†,‡4.174 ± 0.286 #,†,‡1.404 ± 0.107
8:10.116 ± 0.029 *,#3.456 ± 0.352 *,#1.263 ± 0.103
Values are expressed mean ± S.D. of eight mice. * p < 0.05 as compared with sham control; # p < 0.05 as compared with OVX control; p < 0.05 as compared with RC single formula treated mice; p < 0.05 as compared with PCP single formula treated mice; OVX = Bilateral ovariectomy; RC = Red clover dry extracts; PCP = Pomegranate Concentrate Powder; RC:PCP = Mixed formulations consisted of RC and PCP (g/g).
Table 4. Histopathology-Histomorphometry for the Abdominal Fat Pads and Liver in Sham-operated or OVX ddY Mice.
Items GroupsAbdominal Fat PadsHepatic Tissues
Total Thickness (μm)Mean Adipocyte Diameters (μm)Steatosis Regions (%)Mean Hepatocyte Diameters (μm)
Controls
Sham1.41 ± 0.4535.05 ± 10.2513.08 ± 3.169.83 ± 3.34
OVX6.04 ± 0.75 *129.93 ± 24.06 *78.58 ± 6.76 *31.93 ± 4.92 *
Estradiol2.89 ± 0.27 *,#67.49 ± 14.77 *,#43.43 ± 6.53 *,#18.45 ± 3.66 *,#
RC4.48 ± 0.51 *,#92.85 ± 12.70 *,#59.42 ± 7.08 *,#23.47 ± 3.83 *,#
PCP4.70 ± 0.63 *,#97.27 ± 15.68 *,#62.01 ± 7.82 *,#23.66 ± 3.59 *,#
RC:PCP
1:13.58 ± 0.49 *,#,†,‡55.57 ± 12.55 *,#,†,‡44.63 ± 6.94 *,#,†,‡16.00 ± 3.73 *,#,†,‡
1:24.59 ± 0.45 *,#88.91 ± 15.64 *,#58.37 ± 7.54 *,#22.28 ± 4.15 *,#
1:44.55 ± 0.65 *,#89.01 ± 13.89 *,#59.80 ± 6.51 *,#22.34 ± 2.75 *,#
1:84.67 ± 0.61 *,#95.77 ± 18.09 *,#61.13 ± 10.91 *,#23.83 ± 2.67 *,#
2:12.71 ± 0.93 *,#,†,‡47.17 ± 10.84 #,†,‡37.84 ± 9.05 *,#,†,‡14.24 ± 4.07 *,#,†,‡
4:13.69 ± 0.50 *,#,†,‡62.87 ± 14.30 *,#,†,‡45.99 ± 8.44 *,#,†,‡17.53 ± 3.43 *,#,†,‡
8:14.47 ± 0.75 *,#94.54 ± 14.59 *,#59.98 ± 7.88 *,#23.41 ± 4.31 *,#
Values are expressed mean ± S.D. of eight mice. * p < 0.05 as compared with sham control; # p < 0.01 as compared with OVX control; p < 0.05 as compared with RC single formula treated mice; p < 0.01 as compared with PCP single formula treated mice; OVX = Bilateral ovariectomy; RC = Red clover dry extracts; PCP = Pomegranate Concentrate Powder; RC:PCP = Mixed formulations consisted of RC and PCP (g/g).
Table 5. Histopathology-Histomorphometry for the uterus in sham-operated or OVX ddY mice.
Items GroupsLeft Uterine Horn Tissues
Total Thickness (μm)Epithelium Thickness (μm)Mucosa Layer Thickness (μm)Uterine Gland Regions (%)
Controls
Sham2177.82 ± 573.1934.58 ± 6.17951.22 ± 242.8653.94 ± 12.02
OVX566.47 ± 128.78 *7.68 ± 1.26 *202.25 ± 46.58 *12.46 ± 3.07 *
Estradiol1593.32 ± 371.85 *,#20.75 ± 4.52 *,#598.74 ± 153.51 *,#34.93 ± 4.60 *,#
RC776.35 ± 97.07 *,#11.62 ± 3.02 *,#295.40 ± 45.06 *,#24.03 ± 6.13 *,#
PCP739.04 ± 84.66 *,#11.06 ± 2.72 *,#282.10 ± 37.26 *,#22.47 ± 4.28 *,#
RC:PCP
1:11003.98 ± 173.11 *,#,†,‡17.96 ± 4.26 *,#,†,‡409.30 ± 31.93 *,#,†,‡32.91 ± 3.70 *,#,†,‡
1:2789.85 ± 116.09 *,#13.16 ± 4.17 *,#314.95 ± 79.42 *,#26.10 ± 6.70 *,#
1:4776.76 ± 98.02 *,#12.46 ± 3.50 *,#297.63 ± 45.24 *,#23.88 ± 3.85 *,#
1:8746.54 ± 64.96 *,#11.22 ± 2.41 *,#285.57 ± 40.39 *,#22.54 ± 4.56 *,#
2:11124.93 ± 125.59 *,#,†,‡23.46 ± 4.93 *,#,†,‡455.64 ± 92.39 *,#,†,‡35.65 ± 6.07 *,#,†,‡
4:1917.42 ± 54.64 *,#,†,‡16.87 ± 4.11 *,#,†,‡372.29 ± 44.26 *,#,†,‡32.37 ± 4.67 *,#,†,‡
8:1796.67 ± 146.28 *,#12.11 ± 3.99 *,#309.44 ± 44.82 *,#24.71 ± 4.22 *,#
Values are expressed mean ± S.D. of eight mice. * p < 0.05 as compared with sham control; # p < 0.05 as compared with OVX control; p < 0.05 as compared with RC single formula treated mice; p < 0.01 as compared with PCP single formula treated mice. OVX = Bilateral ovariectomy; RC = Red clover dry extracts; PCP = Pomegranate Concentrate Powder; RC:PCP = Mixed formulations consisted of RC and PCP (g/g).
Table 6. Right femur weights in sham-operated or OVX ddY mice.
Items GroupsAbsolute Weight (g)Relative Weight (% of Body Weight)
WetDryAshWetDryAsh
Controls
Sham0.092 ± 0.0050.064 ± 0.0030.039 ± 0.0030.331 ± 0.0280.213 ± 0.0250.139 ± 0.019
OVX0.089 ± 0.0060.050 ± 0.003 *0.025 ± 0.003 *0.207 ± 0.013 *0.118 ± 0.010 *0.059 ± 0.007 *
Estradiol0.094 ± 0.0070.058 ± 0.004 *,#0.033 ± 0.002 *,#0.264 ± 0.032 *,#0.162 ± 0.016 *,#0.092 ± 0.007 *,#
RC0.090 ± 0.0040.055 ± 0.002 *,#0.031 ± 0.003 *,#0.246 ± 0.015 *,#0.151 ± 0.011 *,#0.084 ± 0.010 *,#
PCP0.091 ± 0.0050.055 ± 0.002 *,#0.030 ± 0.003 *,#0.244 ± 0.019 *,#0.147 ± 0.010 *,#0.081 ± 0.008 *,#
RC:PCP
1:10.092 ± 0.0030.059 ± 0.003 *,#,†,‡0.035 ± 0.001 *,#,†,‡0.277 ± 0.017 *,#,†,‡0.177 ± 0.006 *,#,†,‡0.105 ± 0.006 *,#,†,‡
1:20.089 ± 0.0050.056 ± 0.004 *,#0.031 ± 0.004 *,#0.254 ± 0.021 *,#0.159 ± 0.018 *,#0.088 ± 0.009 *,#
1:40.089 ± 0.0050.056 ± 0.003 *,#0.032 ± 0.004 *,#0.251 ± 0.022 *,#0.156 ± 0.014 *,#0.089 ± 0.016 *,#
1:80.088 ± 0.0070.055 ± 0.005 *0.031 ± 0.004 *,#0.247 ± 0.021 *,#0.155 ± 0.015 *,#0.086 ± 0.011 *,#
2:10.093 ± 0.0030.061 ± 0.002 *,#,†,‡0.038 ± 0.002 #,†,‡0.289 ± 0.021 *,#,†,‡0.189 ± 0.016 *,#,†,‡0.118 ± 0.012 *,#,†,‡
4:10.092 ± 0.0050.059 ± 0.003 *,#,†,‡0.034 ± 0.003 *,#,†,‡0.272 ± 0.016 *,#,†,‡0.175 ± 0.012 *,#,†,‡0.102 ± 0.010 *,#,†,‡
8:10.089 ± 0.0070.055 ± 0.005 *0.031 ± 0.003 *,#0.245 ± 0.029 *,#0.152 ± 0.021 *,#0.084 ± 0.014 *,#
Values are expressed mean ± S.D. of eight mice. * p < 0.05 as compared with sham control; # p < 0.05 as compared with OVX control; p < 0.05 as compared with RC single formula treated mice; p < 0.05 as compared with PCP single formula treated mice. OVX = Bilateral ovariectomy; RC = Red clover dry extracts; PCP = Pomegranate Concentrate Powder; RC:PCP = Mixed formulations consisted of RC and PCP (g/g).
Table 7. Histopathology-Histomorphometry for the femur in sham-operated or OVX ddY mice: trabecular bones.
Items GroupsLeft Femur Tissues
TV/BVTbnTblTbt
Controls
Sham37.28 ± 5.0412.63 ± 1.691029.36 ± 145.5573.44 ± 11.98
OVX17.28 ± 2.91 *5.13 ± 0.64 *478.99 ± 80.94 *32.45 ± 7.07 *
Estradiol29.89 ± 5.24 *,#9.88 ± 1.36 *,#905.51 ± 146.34 #55.34 ± 8.99 *,#
RC22.89 ± 2.05 *,#7.50 ± 0.93 *,#592.13 ± 35.08 *,#44.03 ± 3.97 *,#
PCP21.69 ± 1.85 *,#7.00 ± 1.20 *,#578.99 ± 39.41 *,#43.25 ± 2.49 *,#
RC:PCP
1:127.63 ± 2.47 *,#,†,‡10.38 ± 1.30 *,#,†,‡859.44 ± 173.38 *,#,†,‡66.28 ± 14.40 #,†,‡
1:222.65 ± 2.58 *,#7.50 ± 0.76 *,#610.56 ± 60.98 *,#46.85 ± 8.26 *,#
1:422.55 ± 2.72 *,#7.38 ± 0.92 *,#606.29 ± 36.21 *,#46.62 ± 8.71 *,#
1:821.84 ± 1.57 *,#6.88 ± 0.83 *,#580.37 ± 66.93 *,#43.80 ± 5.38 *,#
2:131.40 ± 4.14 *,#,†,‡12.25 ± 1.04 *,#,†,‡954.18 ± 140.48 #,†,‡74.33 ± 14.63 #,†,‡
4:127.39 ± 3.68 *,#,†,‡10.13 ± 1.89 *,#,†,‡827.11 ± 142.28 *,#,†,‡65.30 ± 11.84 #,†,‡
8:122.59 ± 3.67 *,#7.50 ± 0.93 *,#594.17 ± 49.46 *,#44.64 ± 3.53 *,#
Values are expressed mean ± S.D. of eight mice. * p < 0.05 as compared with sham control; # p < 0.05 as compared with OVX control; p < 0.01 as compared with RC single formula treated mice; p < 0.01 as compared with PCP single formula treated mice. OVX = Bilateral ovariectomy; RC = Red clover dry extracts; PCP = Pomegranate Concentrate Powder; RC:PCP = Mixed formulations consisted of RC and PCP (g/g); TV/BV = Trabecular bone volume (%); Tbn = Trabecular bone number (N/epiphyseal); Tbl = Trabecular bone length (Longitudinal thickness; mm); Tbt = Trabecular bone thickness (Cross thickness; μm).
Table 8. Histopathology-Histomorphometry for the femur in sham-operated or OVX ddY mice: cortical bones and osteoclast cells.
Items GroupsLeft Femur Tissues
CbtOcnOS/BS
Controls
Sham209.33 ± 18.145.50 ± 0.938.52 ± 1.57
OVX151.14 ± 11.14 *17.00 ± 2.00 *21.00 ± 2.39 *
Estradiol184.17 ± 8.40 *,#7.63 ± 1.06 *,#13.12 ± 1.41 *,#
RC175.49 ± 4.41 *,#13.75 ± 1.49 *,†17.16 ± 1.89 *,#
PCP172.05 ± 8.17 *,#14.13 ± 1.64 *,†17.75 ± 1.46 *,#
RC:PCP
1:1189.27 ± 7.10 *,#,†,‡9.13 ± 1.13 *,#,†,‡13.46 ± 1.88 *,#,†,‡
1:2179.81 ± 8.89 *,#13.00 ± 1.85 *,#16.63 ± 1.74 *,#
1:4176.39 ± 9.83 *,#13.50 ± 1.51 *,#17.08 ± 1.65 *,#
1:8173.84 ± 9.20 *,#13.88 ± 1.89 *,#16.77 ± 3.23 *,#
2:1197.13 ± 9.00 #,†,‡7.00 ± 0.76 #,†,‡11.46 ± 1.37 *,#,†,‡
4:1187.92 ± 10.08 *,#,†,‡9.38 ± 1.30 *,#,†,‡13.64 ± 1.99 *,#,†,‡
8:1172.30 ± 6.68 *,#13.63 ± 2.33 *,#17.82 ± 0.98 *,#
Values are expressed mean ± S.D. of eight mice. * p < 0.05 as compared with sham control; # p < 0.05 as compared with OVX control; p < 0.01 as compared with RC single formula treated mice; p < 0.01 as compared with PCP single formula treated mice. OVX = Bilateral ovariectomy; RC = Red clover dry extracts; PCP = Pomegranate Concentrate Powder; RC:PCP = Mixed formulations consisted of RC and PCP (g/g); Cbt = Cortical bone thickness (Cross thickness; μm); Ocn = Osteoclast cell number (N/epiphyseal); OS/BS = Osteoclast cell surface/bone surface (%).
Table 9. Serum biochemistry: AST, ALT, TC, LDL, HDL and TG levels in sham-operated or OVX ddY mice.
Items GroupsSerum Biochemistrical Values
AST (U/L)ALT (U/L)TC (mg/dL)LDL (mg/dL)HDL (mg/dL)TG (mg/dL)
Controls
Sham84.38 ± 13.9537.88 ± 11.9889.63 ± 16.8762.88 ± 10.1196.38 ± 11.7837.00 ± 10.39
OVX162.35 ± 15.84 *76.00 ± 10.54 *179.25 ± 21.41 *181.88 ± 17.94 *47.75 ± 11.20 *150.13 ± 20.90 *
Estradiol107.13 ± 12.43 *,#52.00 ± 10.03 *,#132.75 ± 21.06 *,#133.00 ± 10.54 *,#72.63 ± 11.04 *,#97.88 ± 18.16 *,#
RC139.63 ± 8.86 *,#63.00 ± 5.66 *,#143.38 ± 10.80 *,#154.63 ± 13.05 *,#65.50 ± 5.10 *,#123.13 ± 9.11 *,#
PCP141.88 ± 7.64 *,#63.63 ± 4.84 *,#147.25 ± 12.28 *,#160.13 ± 7.41 *,#63.63 ± 6.05 *,#124.50 ± 9.38 *,#
RC:PCP
1:1118.88 ± 13.26 *,#,†,‡51.88 ± 7.26 *,#,†,‡127.50 ± 10.85 *,#,†,‡133.00 ± 13.60 *,#,†,‡6.88 ± 8.25 *,#,†,‡102.75 ± 12.96 *,#,†,‡
1:2139.38 ± 10.72 *,#63.25 ± 7.46 *,#142.25 ± 10.35 *,#155.38 ± 16.23 *,#65.38 ± 9.55 *,#120.88 ± 14.80 *,#
1:4140.00 ± 10.00 *,#61.50 ± 11.33 *,#143.50 ± 12.36 *,#157.50 ± 11.63 *,#63.50 ± 6.59 *,#121.63 ± 11.59 *,#
1:8142.50 ± 9.44 *,#62.63 ± 6.72 *,#147.88 ± 13.88 *,#160.00 ± 9.96 *,#64.00 ± 9.70 *,#123.50 ± 12.14 *,#
2:1109.25 ± 7.74 *,#,†,‡7.75 ± 11.31 *,#,†,‡114.13 ± 12.93 *,#,†,‡115.50 ± 11.15 *,#,†,‡89.63 ± 7.13 #,†,‡84.75 ± 13.64 #,†,‡
4:1120.13 ± 15.07 *,#,†,‡52.88 ± 6.10 *,#,†,‡131.13 ± 8.24 *,#,†,‡138.75 ± 8.81 *,#,†,‡76.13 ± 9.75 *,#,†,‡107.25 ± 9.85 *,#,†,‡
8:1141.00 ± 8.35 *,#62.13 ± 11.01 *,#144.38 ± 14.81 *,#144.50 ± 12.24 *,#64.13 ± 10.43 *,#122.75 ± 9.68 *,#
Values are expressed mean ± S.D. of eight mice. * p < 0.05 as compared with sham control; # p < 0.01 as compared with OVX control; p < 0.05 as compared with RC single formula treated mice; p < 0.05 as compared with PCP single formula treated mice. OVX = Bilateral ovariectomy; RC = Red clover dry extracts; PCP = Pomegranate Concentrate Powder; RC:PCP = Mixed formulations consisted of RC and PCP (g/g); ALT = Alanine aminotransferase; AST = Aspartate aminotransferase; LDL = Low density lipoprotein; TC = Total cholesterol; TG = Triglyceride; HDL = High density lipoprotein.
Table 10. Bone mineral density and body fat density in sham-operated or OVX ddY mice.
Items GroupsBone Mineral Density (mg/cm2)Fat Density (% of Body Mass)
Total BodyRight FemurTotal BodyAbdominal Cavity
Controls
Sham24.71 ± 0.5926.78 ± 0.5811.16 ± 2.1510.85 ± 1.50
OVX21.56 ± 0.30 *23.41 ± 0.43 *34.97 ± 3.52 *41.15 ± 4.55 *
Estradiol23.69 ± 0.44 *,#25.94 ± 0.79 *,#23.42 ± 4.24 *,#26.75 ± 4.22 *,#
RC22.51 ± 0.49 *,#24.64 ± 0.45 *,#29.65 ± 1.99 *,#34.06 ± 4.04 *,#
PCP22.31 ± 0.37 *,#24.63 ± 0.32 *,#30.35 ± 2.21 *,#34.80 ± 2.81 *,#
RC:PCP
1:123.29 ± 0.48 *,#,†,‡25.57 ± 0.72 *,#,†,‡24.11 ± 4.25 *,#,†,‡26.62 ± 4.66 *,#,†,‡
1:222.66 ± 0.55 *,#24.99 ± 1.09 *,#27.92 ± 5.30 *,#33.49 ± 4.25 *,#
1:422.49 ± 0.27 *,#24.80 ± 0.67 *,#29.49 ± 2.00 *,#33.93 ± 4.26 *,#
1:822.38 ± 0.63 *,#24.68 ± 0.90 *,#30.10 ± 2.58 *,#34.80 ± 3.48 *,#
2:123.90 ± 0.53 *,#,†,‡26.11 ± 0.89 #,†,‡18.68 ± 3.99 *,#,†,‡23.17 ± 3.39 *,#,†,‡
4:123.16 ± 0.37 *,#,†,‡25.51 ± 0.70 *,#,†,‡25.32 ± 3.08 *,#,†,‡27.94 ± 3.74 *,#,†,‡
8:122.68 ± 0.82 *,#24.59 ± 0.75 *,#29.61 ± 2.64 *,#33.88 ± 3.55 *,#
Values are expressed mean ± S.D. of eight mice. * p < 0.05 as compared with sham control; # p < 0.01 as compared with OVX control; p < 0.05 as compared with RC single formula treated mice; p < 0.05 as compared with PCP single formula treated mice. OVX = Bilateral ovariectomy; RC = Red clover dry extracts; PCP = Pomegranate Concentrate Powder; RC:PCP = Mixed formulations consisted of RC and PCP (g/g).

