Article

Impact of Diabetes-Specific Nutritional Formulas versus Oatmeal on Postprandial Glucose, Insulin, GLP-1 and Postprandial Lipidemia

1
Joslin Diabetes Center, Boston, MA 02215, USA
2
Department of Nutrition and Dietetics, Faculty of Medicine and Health Sciences, Universiti Putra Malaysia, Selangor 43400, Malaysia
*
Authors to whom correspondence should be addressed.
Nutrients 2016, 8(7), 443; https://doi.org/10.3390/nu8070443
Submission received: 2 May 2016 / Revised: 24 June 2016 / Accepted: 19 July 2016 / Published: 22 July 2016

Abstract

:
Diabetes-specific nutritional formulas (DSNFs) are frequently used as part of medical nutrition therapy for patients with diabetes. This study aims to evaluate postprandial (PP) effects of 2 DSNFs; Glucerna (GL) and Ultra Glucose Control (UGC) versus oatmeal (OM) on glucose, insulin, glucagon-like peptide-1 (GLP-1), free fatty acids (FFA) and triglycerides (TG). After an overnight fast, 22 overweight/obese patients with type 2 diabetes were given 200 kcal of each of the three meals on three separate days in random order. Blood samples were collected at baseline and at 30, 60, 90, 120, 180 and 240 min. Glucose area under the curve (AUC0–240) after GL and UGC was lower than OM (p < 0.001 for both). Insulin positive AUC0–120 after UGC was higher than after OM (p = 0.02). GLP-1 AUC0–120 and AUC0–240 after GL and UGC was higher than after OM (p < 0.001 for both). FFA and TG levels were not different between meals. Intake of DSNFs improves PP glucose for 4 h in comparison to oatmeal of similar caloric level. This is achieved by either direct stimulation of insulin secretion or indirectly by stimulating GLP-1 secretion. The difference between their effects is probably related to their unique blends of amino acids, carbohydrates and fat.

Graphical Abstract

1. Introduction

Lifestyle changes through diet and increased physical activity are recommended as the first line therapy for patients with type 2 diabetes [1]. In 1994, the American Dietetic Association used the term “Medical Nutrition Therapy” (MNT) to encompass the utilization of proper nutrition for diabetes management [2]. It has been shown that use of diabetes-specific nutritional formulas (DSNFs) as part of MNT was associated with improved postprandial glycemic control [3]. In addition, DSNFs offer structured nutritional alternative that enhances adherence to lifestyle interventions and subsequently lead to meaningful reduction in hemoglobin A1C and body weight [4,5].
Glucagon-like peptide-1 (GLP-1) is an incretin hormone secreted by the intestinal L-cells in response to food consumption [6]. It plays a major role in glucose homeostasis through stimulating pancreatic β-cells secretion of insulin and inhibiting α-cells secretion of glucagon [6]. It also slows gastric emptying and induces satiety [7,8]. Previous studies showed that patients with type 2 diabetes have lower postprandial GLP-1 level in comparison to healthy individuals [9]. Increasing GLP-1 level by incretin-based therapies has become a therapeutic option for patients with type 2 diabetes [10,11,12].
While DSNFs have been shown to improve postprandial glycemic response and increase GLP-1 secretion [13,14], no head-to head comparison was done between commercially available DSNFs versus oatmeal (OM). OM has long been recognized as a healthy breakfast choice for patients with diabetes for having high fiber content [15], which is known to improve glycemic control and enhance insulin response in patients with type 2 diabetes [16,17].
This study was designed to evaluate the effects of two commercially available DSNFs; Glucerna (Abbott Nutrition Inc., Columbus, OH, USA) and Ultra Glucose Control (Metagenics Inc., Aliso Viejo, CA, USA) versus OM (Quaker Oats Co., Chicago, IL, USA) on PP plasma glucose, serum insulin, serum active GLP-1 hormone, serum free fatty acids (FFA) and serum triglycerides (TG) in overweight and obese patients with type 2 diabetes.

2. Experimental Section

2.1. Study Design and Subjects

This was a cross-over, three-way and open-label clinical study conducted at Joslin Diabetes Center, Boston, MA, USA. The institution’s Committee on Human Studies approved the study protocol and participants signed its informed consent prior to enrollment. Trial Registration: NCT02691481 clinicaltrials.gov. Eligible participants were patients diagnosed with type 2 diabetes for ≥3 months, between age 18 and 75 years, BMI ≥ 25 kg/m2, hemoglobin A1C ≥ 6.5% and doses of anti-hyperglycemic or lipid lowering medications have to be stable for ≥3 months. Major study exclusion criteria included use of insulin or GLP-1 analogues for diabetes management, history of bariatric surgery, gastroparesis, malabsorption syndromes and pregnancy or lactation. Thirty-two patients with type 2 diabetes were assessed for eligibility. Five were ineligible due to the use of insulin and/or GLP-1 analogues or having a BMI < 25 kg/m2. Twenty-seven met our inclusion criteria from which 2 refused participation prior to signing the informed consent form. Twenty-five participants were enrolled, from which 22 participants completed all study visits (Figure 1). One participant dropped-out due to personal reasons prior to attending any study visit. Two participants dropped-out due to finding visit length and frequent blood drawing inconvenient, after each completing 1 study visit. Data from the three dropped-outs were excluded from our analysis. The mean age ± standard deviation (SD) of the 22 participants was 62.3 ± 6.8 years. Participants’ mean A1C ± SD was 6.8% ± 0.7% and mean diabetes duration ± SD was 9.5 ± 9.8 years. Demographic data of the study participants are shown in Table 1.

2.2. Study Procedures

Participants underwent the study procedures on three separate visits. Visits were conducted in the morning after an overnight fast of at least 8 h. The sequence of the three meals was randomly assigned with a washout period of at least two days between visits. Study visits were completed within a three-week window starting from the day of the first visit. This was done to minimize any variability in dietary and exercise patterns. The background diet of the participants was not controlled. However, a 24-h food log was reviewed by a registered dietitian at each visit to confirm the consistency of dietary patterns. Participants were instructed come fasting for at least 8 h and to withhold their anti-hyperglycemic and lipid lowering medications on the morning of the visit. Those treated with dipeptidyl peptidase-4 inhibitors (DPP-4 inhibitors) were asked not to take them for two days prior to each visit. One of three meals (GL, UGC and OM) was served for breakfast at each visit. All meals were equal in caloric content (200 kcal/meal). UGC was prepared by dissolving its powder in 10 fl oz (296 mL) of water; GL was served in the form of 8 fl oz bottles; and OM was prepared by adding 8 fl oz (237 mL) of water to 56 grams of dry oats (Quaker Old Fashioned Oats, Quaker Oats Co., Chicago, IL, USA) then cooking it on a stove for 5–10 min. No milk, sugar or flavoring was added to the oatmeal. Macronutrient composition of each meal is shown in Table 2 and amino acids composition is shown in Table 3.
To ensure safety, participants were asked to check their blood glucose level before coming to each study visit. If it was <70 mg/dL or >300 mg/dL; participants were asked to break their fast, take their diabetes medications then call the study team to reschedule the visit. In addition, blood pressure and capillary blood glucose were measured at the beginning of the visit for safety. If blood glucose was between 70 and 300 mg/dL, a venous line was inserted and a baseline blood sample was drawn. This was followed by consumption of the breakfast meal within 3–5 min. Blood samples were collected at 30, 60, 90, 120, 180 and 240 min from the start of the meal. Blood samples were used to measure plasma glucose; serum insulin, serum active GLP-1, serum free fatty acids and serum triglycerides. After collection of the last sample, participants were given a snack to eat and were instructed to resume their regular diabetes medications.

2.3. Statistical Analyses

Values for measured variables are presented as mean ± standard error of mean (SEM) unless otherwise specified. All study quantitative, qualitative and clinical data were collected in a single database for statistical analysis. Data analysis was done using SPSS statistical software (SPSS Institute Inc., Cary, NC, USA). Per-protocol analysis was performed using repeated measures analysis of variance with treatment and time as fixed effects and subject as random effect. Pairwise differences of the treatment means were tested using Tukey-Kramer p-value adjustments. If the parametric approach is determined to be inappropriate by the result of Shapiro-Wilk test, then three pairwise treatment differences were analyzed using signed rank test with stepdown Bonferroni p-value adjustments. Outcomes were defined as area under the curve between 0 and 120 min and between 0 and 240 min for measured variables over time (AUC0–120 and AUC0–240) calculated using the trapezoidal formula [18]. Positive AUC was calculated using the same formula but representing the area above the fasting level. The primary endpoint was postprandial blood glucose area under the curve between 0 and 240 min (AUC0–240).

2.4. Sample-Size Calculation

In order to detect a mean difference of 20% (SD equal to the magnitude of the difference) in the glucose AUC0–240 with power of 0.90 and assuming a significance level of 0.025 and a modest correlation (0.60) among repeated measurements within subjects, we estimated that a sample size of 20 participants was required for this study. Anticipating a 25% attrition rate, we recruited 25 participants.

3. Results

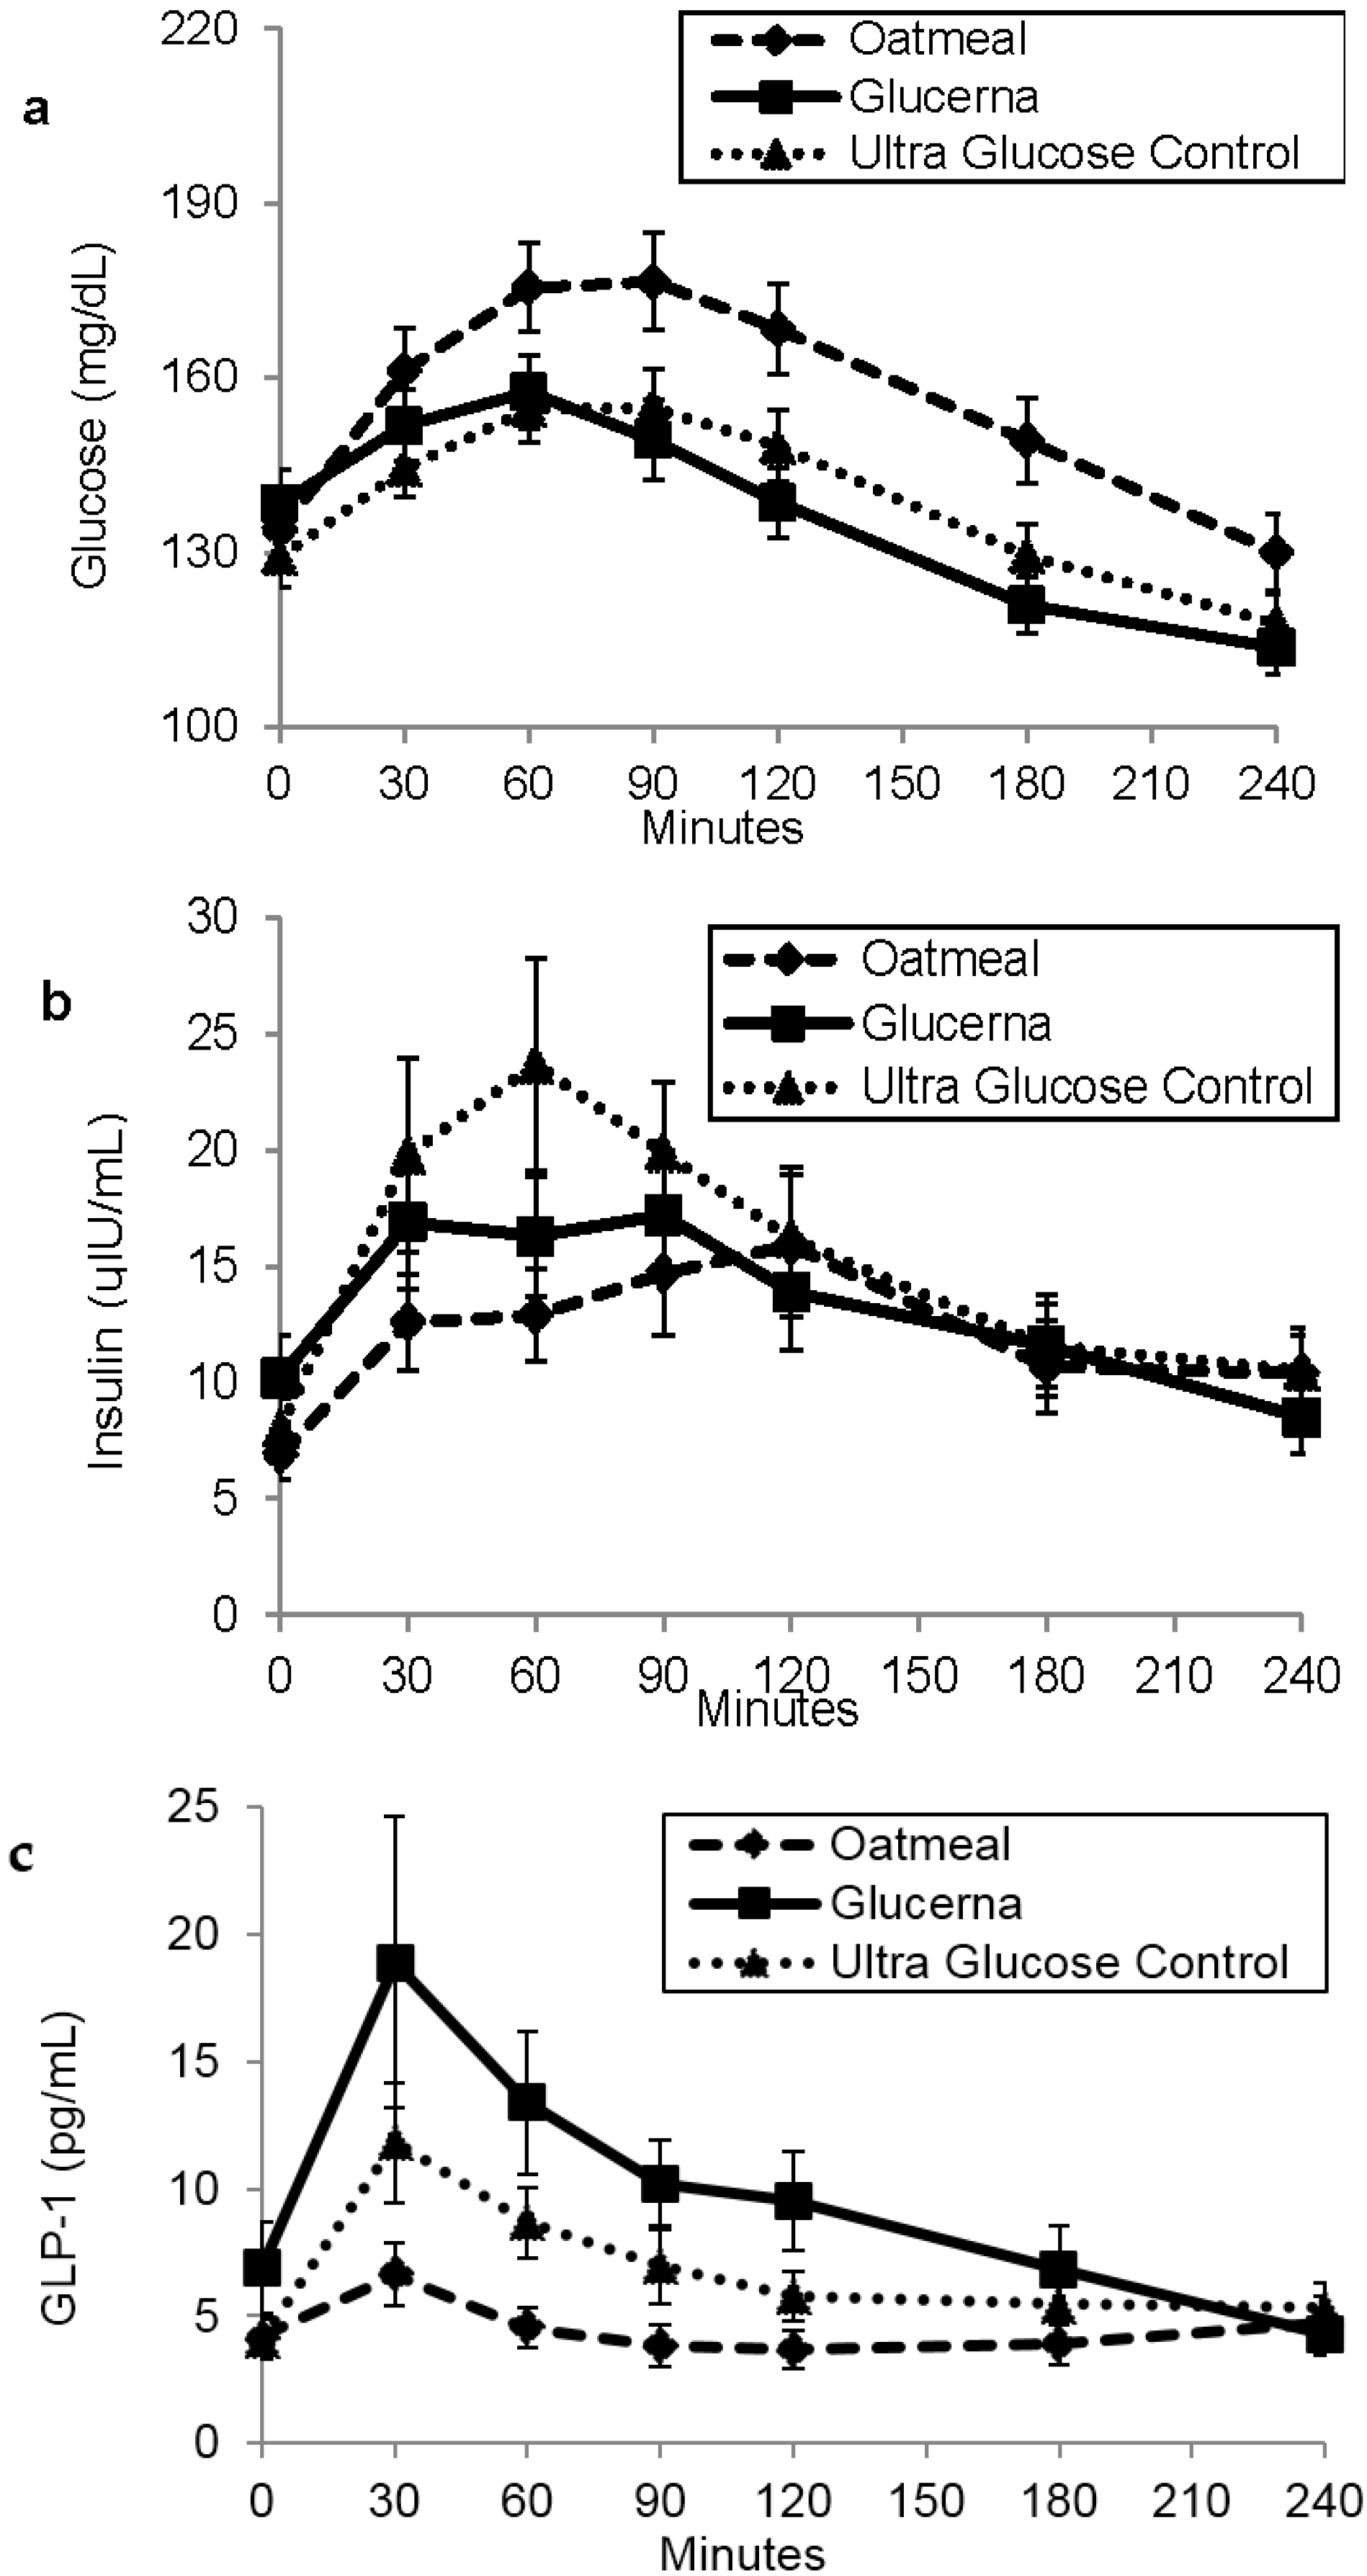
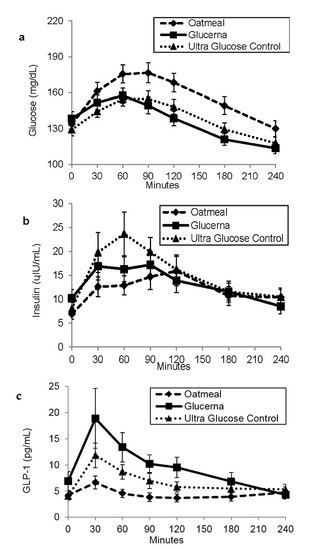
Mean fasting plasma glucose levels at baseline for OM, GL and UGC were comparable (133.8 ± 6.6, 138.4 ± 5.9 and 129.2 ± 5.1 mg/dL respectively) (Figure 2a). Glucose AUC0–120 and AUC0–240 for GL and UGC were significantly lower than that of OM (p < 0.001 for all) (Table 4). There was no significant difference in glucose AUC0–120 or AUC0–240 when comparing GL to UGC (p = 0.98 and p = 0.18 respectively). Glucose positive AUC0–120 and positive AUC0–240 for GL were significantly lower than OM and UGC (p < 0.001 for all). Glucose positive AUC0–120 and positive AUC0–240 for UGC was significantly lower than OM (p < 0.001 for both).
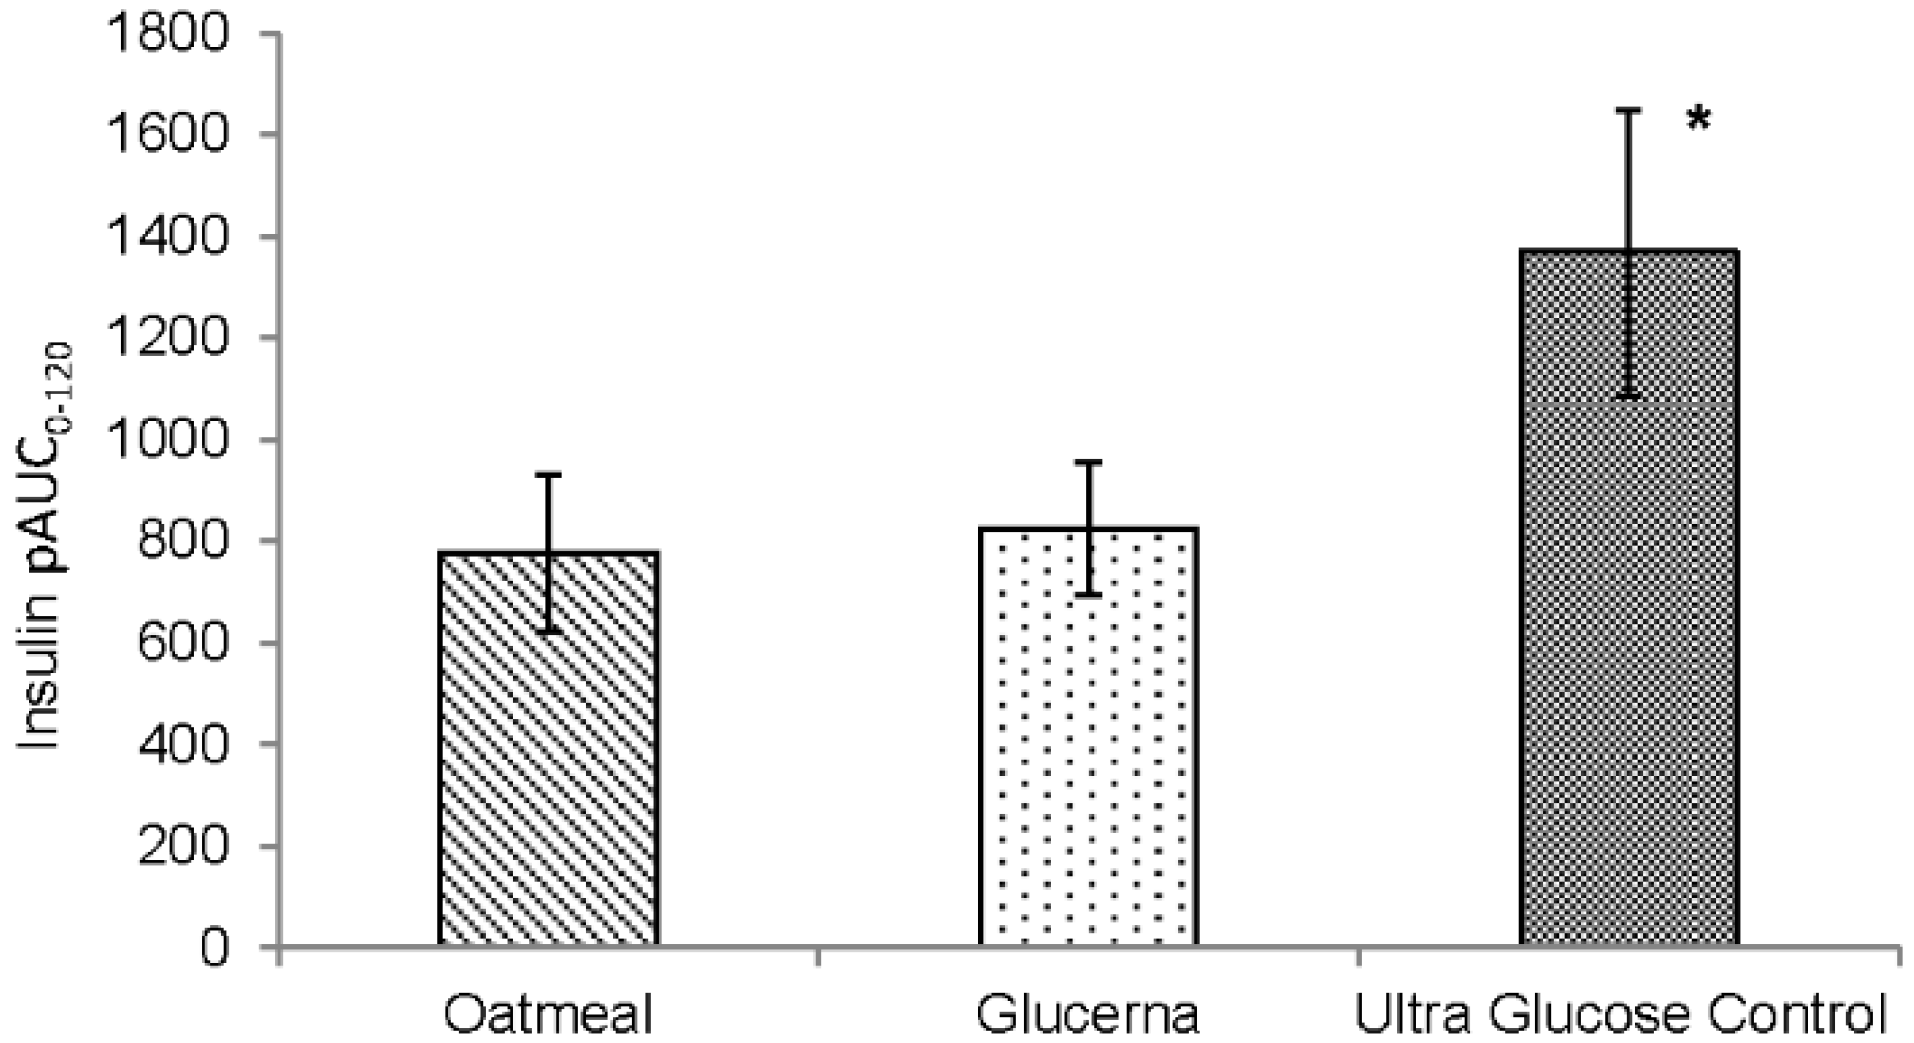
Mean baseline fasting serum insulin levels before OM, GL and UGC were also comparable (6.9 ± 1.1, 10.2 ± 1.2 and 8.0 ± 1.3 µIU/mL respectively) (Figure 2b). Insulin AUC0–120 and AUC0–240 showed no significant difference between any of the breakfast meals. However, insulin positive AUC0–120 for UGC was significantly higher than that of OM (p = 0.02) while there was no significant difference between GL and OM, or between GL and UGC (Figure 3). Insulin positive AUC0–240 showed no significant difference between any of the breakfast meals (Table 4).
Mean baseline fasting values for serum active GLP-1 before OM, GL and UGC were comparable (4.18 ± 0.81, 6.91 ± 1.77 and 4.08 ± 0.78 pg/mL, respectively) (Figure 2c). Serum active GLP-1 AUC0–120 and AUC0–240 after GL was significantly higher than after OM (p < 0.001 for both) and after UGC (p = 0.009 and p = 0.024, respectively). GLP-1 AUC0–120 and AUC0–240 for UGC was also higher than after OM (p < 0.001 for both).
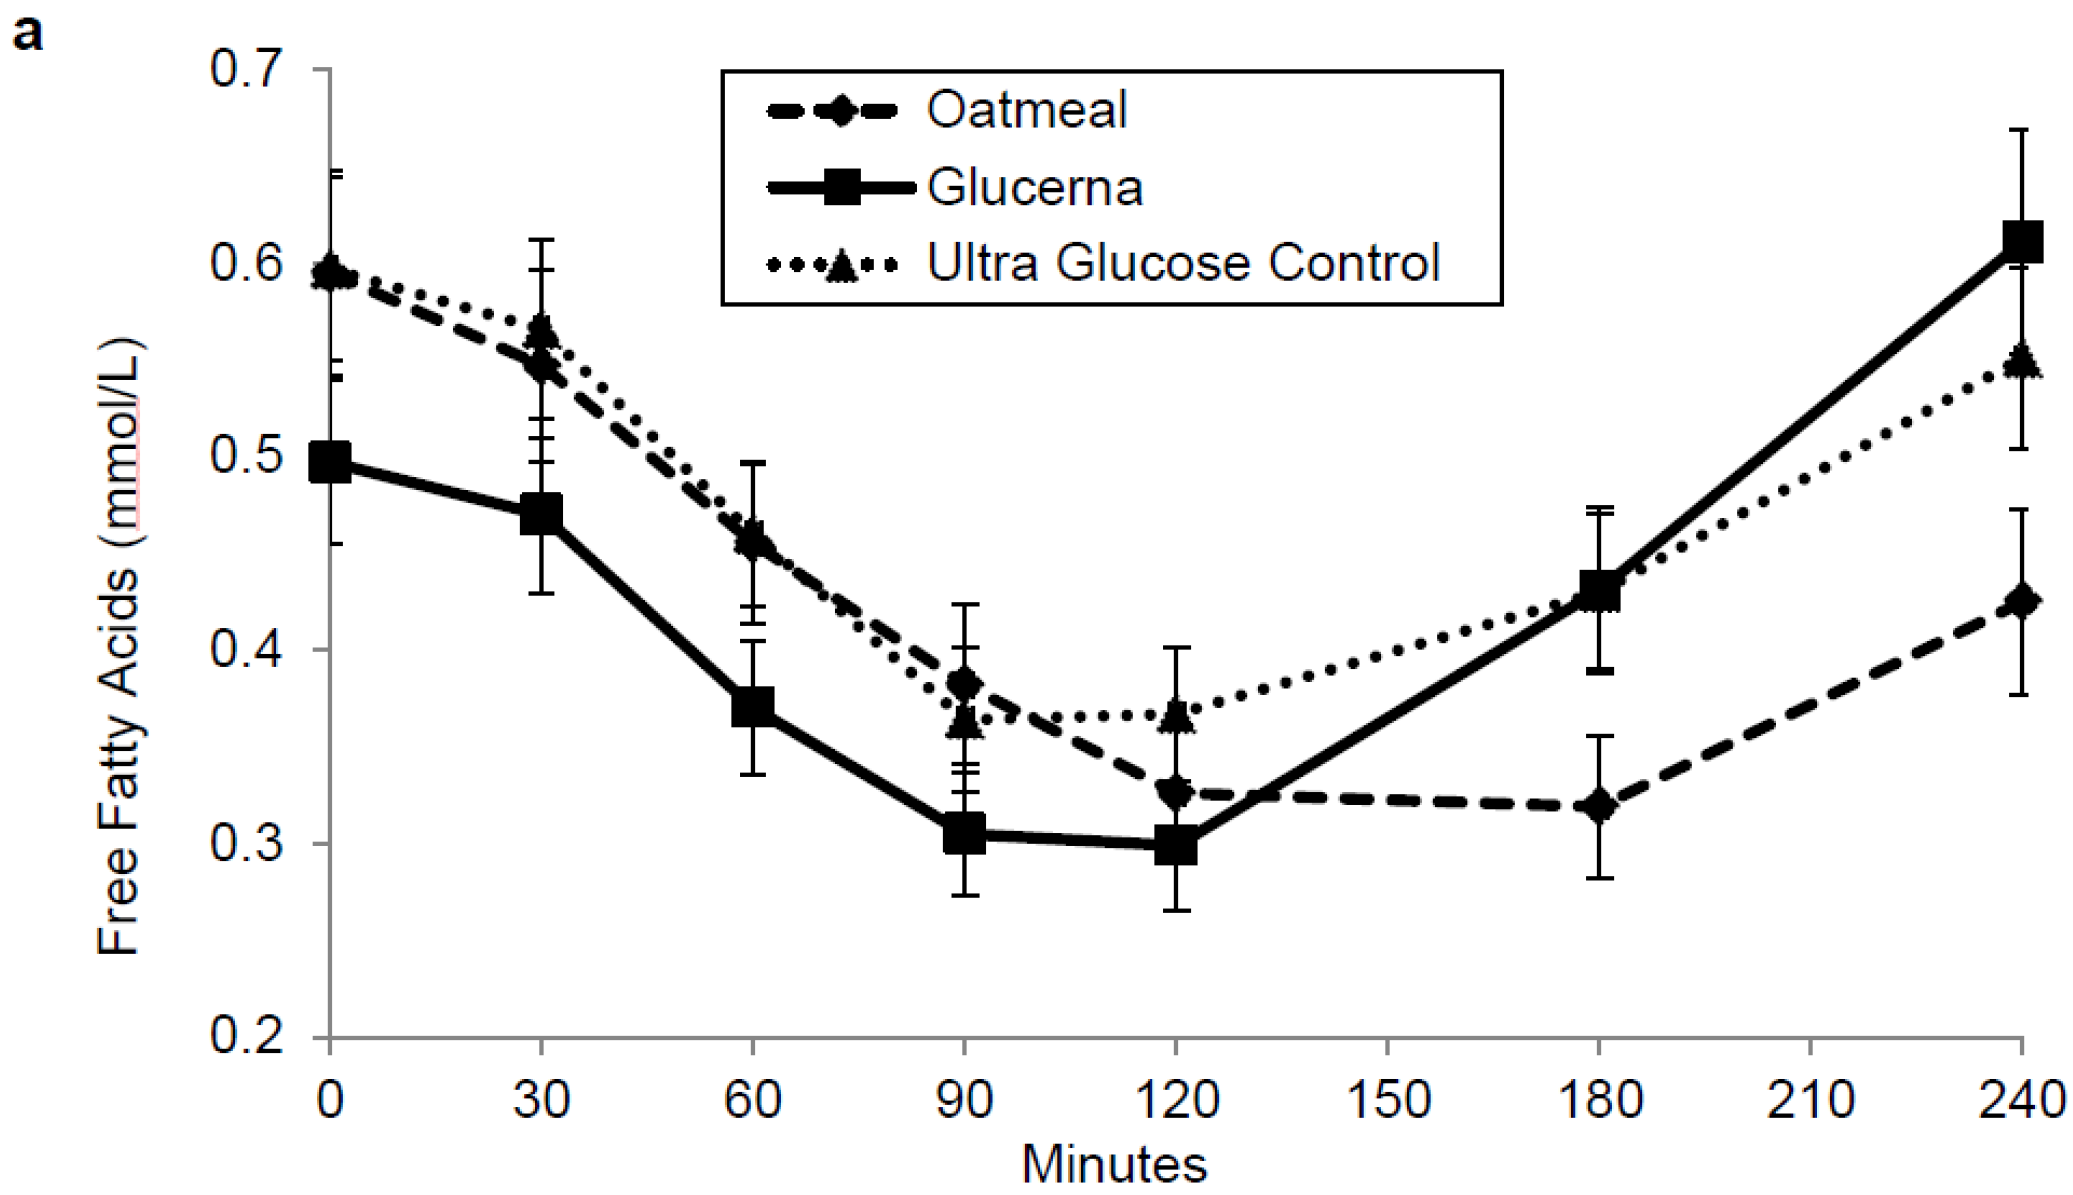
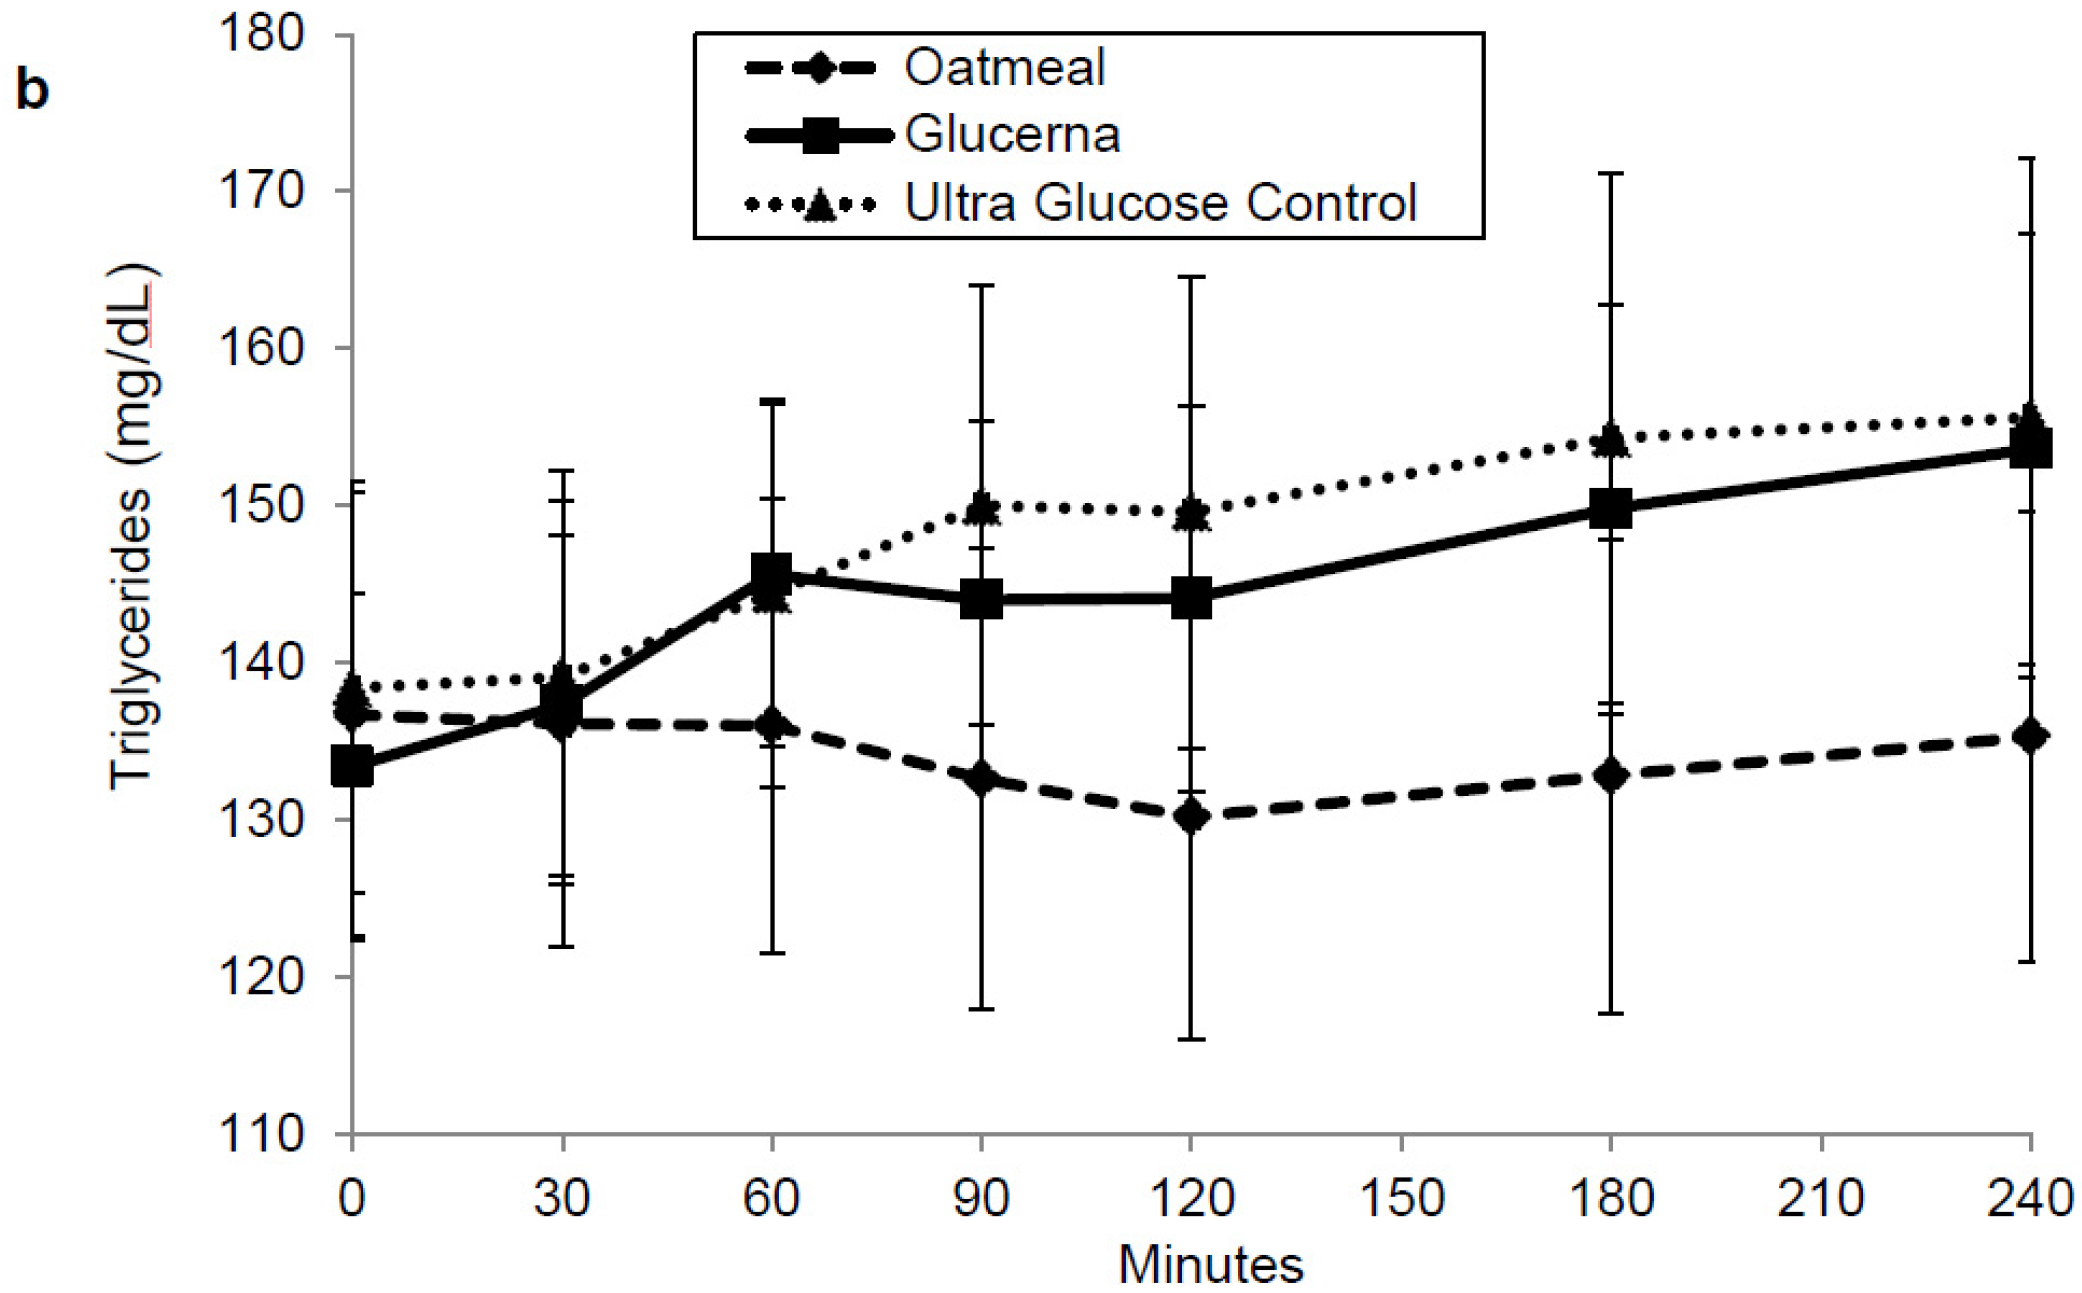
Mean baseline fasting serum free fatty acid before OM, GL and UGC at baseline were comparable (0.6 ± 0.05, 0.5 ± 0.04 and 0.6 ± 0.05 mg/dL, respectively). Free fatty acids AUC0–120 and AUC0–240 showed no significant difference between any of the breakfast meals (Figure 4a). Mean baseline fasting serum triglycerides before OM, GL and UGC at baseline were comparable (136.7 ± 14.1, 133.4 ± 11.0 and 138.4 ± 13.1 mg/dL, respectively). Triglycerides AUC0–120 and AUC0–240 showed no significant difference between any of the breakfast meals (Figure 4b).

4. Discussion

This study shows that postprandial plasma glucose is significantly lower after either of the two DSNFs in comparison to OM. This observation is in line with previous studies which used similar formulas [13,14,19]. The low glycemic index of most DSNFs partially contributes to this effect [14,20]. Lowering postprandial glucose was shown to reduce the need for anti-hyperglycemic medications [1] and was associated with reduced risk of diabetes complications [21,22].
OM is frequently recommended for patients with diabetes for being rich in polysaccharide β-glucan, which was found to reduce postprandial plasma glucose levels. This makes it an ideal breakfast for patients with diabetes [16,17,23]. However, this study showed that plasma glucose returns back to baseline within a shorter period following DSNFs in comparison to OM. This was achieved within 120 min after GL, 180 min after UGC and within 240 min after OM breakfast (Figure 2a). This effect is particularly important in diabetes management since prolonged excursion of postprandial plasma glucose was shown to be associated with overproduction of oxygen free radicals, vasoconstriction and increased circulating levels of pro-inflammatory cytokines that may contribute to cardiovascular complications [24,25]. The amount of β-glucan in the commonly served OM breakfast, similar to the amount tested in this study, is relatively low (1.3 g per serving). A previous study showed that 6 grams of β-glucan is required to induce a 10% reduction in postprandial glycemic responses [17].
Protein intake was shown to increase postprandial insulin levels especially during its early phase of secretion [26,27]. First phase insulin secretion, which is frequently reduced or lost in patients with long standing type 2 diabetes, is critical in reducing postprandial glucose exertion [28]. Both DSNFs contain higher amount of protein with some differences in their amino acids ratio. This study showed that insulin secretion is significantly higher for 120 min after UGC in comparison to OM. This difference was not seen between GL and OM. This observation may be explained by the difference in amount and type of branched chain amino acids between the two formulas (Table 3). Leucine and phenylalanine, which are higher in UGC, are among amino acids with the highest insulinotropic effect [27,29] (Table 3). This finding is particularly important since reduced early phase insulin secretion leads to prolonged PP hyperglycemia in patients with type 2 diabetes [28,30]. It was presumed that β-cells response to ingested nutrients is either lost or significantly weakened in patients with long duration of type 2 diabetes, as in the case of this study’s participants. However, this study showed that pancreatic β-cells retained their response to specific amino acids.
GLP-1 secretion in response to a meal is directly related to its macronutrient composition, notably its content of carbohydrate and fat [6]. This study showed that active GLP-1 AUC0–120 is significantly higher after GL in comparison to OM and UGC and after UGC in comparison to OM. It was previously shown that high dietary monounsaturated fat (MUFA) increases postprandial GLP-1 levels without a significant effect on insulin levels [31,32]. MUFA content of GL is higher than that of UGC and OM (Table 2). This difference might explain the difference in GLP-1 response. It also confirms previous observations that the amount and the type of fat and carbohydrates play important role in promoting GLP-1 secretion [13,14].
Postprandial FFA levels are usually reduced by lowering glycemic load of a meal (amount of carbohydrate × glycemic index) [30]. Although glycemic load of both DSNFs is much lower than that of OM, there were no significant differences in postprandial FFA levels between the three meals. Similarly, there was no difference in postprandial serum triglycerides response to the three meals. These observations are most probably related to the higher fat content of DSNFs, which possibly muted the benefit of their low glycemic load on postprandial lipidemia.
We should be cautious in interpreting the results of this study as it has several limitations. As shown, it was primarily conducted to evaluate the mechanisms of action of DSNFs. Its cross-sectional design limits the value of its positive results from suggesting any long-term benefits of DSNFs in improving A1C or body weight. A longitudinal randomized controlled clinical study is needed to prove that these beneficial postprandial effects may be translated into a meaningful long-term glycemic control and/or weight reduction. Due to major difference in texture between OM and DSNFs, we were not able to blind participants to the three meals. However, we think non-blinded approach has a minimal effect on this study’s results. While oatmeal used in this study was prepared with water only, many may prepare and/or consume it with different foods/beverages. How these ingredients may affect postprandial metabolic parameters warrants further investigation. This study did not control the background diets of its participants. While the implication of this on the primary endpoint is unknown, we sought to minimize variability by having participants fast for at least 8 h prior to each visit in addition to having each participant complete all study visits within a three-week window. We acknowledge that most study participants were on anti-hyperglycemic medications of which seven were on DPP-4 inhibitors. Since this study had a cross-over design, participants served as their own control; therefore, it is unlikely that medications have unequally affected the study outcomes. Lastly, while caloric content was equal between the three tested meals; carbohydrate content was different (Table 2). Both DSNFs have similar carbohydrate content but is much lower than that of OM. Another study may be needed to evaluate the differences between DSNFs and OM when glycemic load is equal. However, this study may support the concept that macronutrient composition is much important than the caloric value of a meal and that insulin and GLP-1 secretions can be induced at lower glycemic load.

5. Conclusions

This study shows that DSNFs are superior to the common American breakfast of OM in reducing postprandial glucose response in overweight and obese patients with type 2 diabetes. This effect is achieved either through direct stimulation of insulin secretion from pancreatic β-cells or indirectly through stimulation of GLP-1 production. The differences between their effects on insulin and GLP-1 hormones are probably related to their unique blends of amino acids, carbohydrates and fat content, which warrants further investigation.

Acknowledgments

This was supported by a grant from Metagenics, Inc.; however, Metagenics had no role in the study design, conduct, analysis or presentation. Data from this study were presented at the 75th American Diabetes Association Meeting. We would like to thank staff of the Joslin Clinical Research Center for their efforts, Harvard Catalyst for statistical consultation, Haya Raef and Rani Polak for their assistance in conducting study visits and data entry.

Author Contributions

A.M., and O.H.: contributed to the design and analysis of the study, wrote the manuscript, were the guarantors of this work and, as such, had full access to all of the data in the study and took responsibility for the integrity of the data and the accuracy of the data analysis; B.-N.M.-Y., M.S., and J.M.: interpreted the results, reviewed and edited the manuscript; D.M.P.: was involved in the statistical analysis and reviewed the manuscript. All authors read and approved the final manuscript.

Conflicts of Interest

O.H. is on the advisory board of Novo-Nordisk, Metagenics Inc., Astra Zeneca Inc., and Boeringher Inglehiem Inc., and is a consultant to Merck Inc., A.M., B.-N.M.-Y., M.S., D.M.P., and J.M. report no competing interests related to this work.

Abbreviations

The following abbreviations are used in this manuscript:
AUCarea under the curve
DSNFsdiabetes-specific nutritional formulas
FFAfree fatty acids
GLP-1glucagon-like peptide-1
GLGlucerna
MNTmedical nutrition therapy
MUFAmonounsaturated fatty acids
OMoatmeal
PPpostprandial
SEMstandard error of mean
TGtriglycerides
UGCUltra Glucose Control

References

  1. Nathan, D.M.; Buse, J.B.; Davidson, M.B.; Ferrannini, E.; Holman, R.R.; Sherwin, R.; Zinman, B. American Diabetes A, European Association for the Study of D: Medical management of hyperglycaemia in type 2 diabetes mellitus: A consensus algorithm for the initiation and adjustment of therapy: A consensus statement from the American Diabetes Association and the European Association for the Study of Diabetes. Diabetologia 2009, 52, 17–30. [Google Scholar] [PubMed]
  2. Morris, S.F.; Wylie-Rosett, J. Medical nutrition therapy: A key to diabetes management and prevention. Clin. Diabetes 2010, 28, 12. [Google Scholar] [CrossRef]
  3. Elia, M.; Ceriello, A.; Laube, H.; Sinclair, A.J.; Engfer, M.; Stratton, R.J. Enteral Nutritional Support and Use of Diabetes-Specific Formulas for Patients with Diabetes: A systematic review and meta-analysis. Diabetes Care 2005, 28, 2267–2279. [Google Scholar] [CrossRef] [PubMed]
  4. Wadden, T.A.; West, D.S.; Neiberg, R.H.; Wing, R.R.; Ryan, D.H.; Johnson, K.C.; Foreyt, J.P.; Hill, J.O.; Trence, D.L.; Vitolins, M.Z.; et al. One-year weight losses in the Look AHEAD study: Factors associated with success. Obesity 2009, 17, 713–722. [Google Scholar] [CrossRef] [PubMed]
  5. Wadden, T.A.; Neiberg, R.H.; Wing, R.R.; Clark, J.M.; Delahanty, L.M.; Hill, J.O.; Krakoff, J.; Otto, A.; Ryan, D.H.; Vitolins, M.Z.; et al. Four-year weight losses in the Look AHEAD study: Factors associated with long-term success. Obesity 2011, 19, 1987–1998. [Google Scholar] [CrossRef] [PubMed]
  6. Drucker, D.J. The biology of incretin hormones. Cell Metab. 2006, 3, 153–165. [Google Scholar] [CrossRef] [PubMed]
  7. Flint, A.; Raben, A.; Astrup, A.; Holst, J.J. Glucagon-like peptide 1 promotes satiety and suppresses energy intake in humans. J. Clin. Investig. 1998, 101, 515. [Google Scholar] [CrossRef] [PubMed]
  8. Dailey, M.J.; Moran, T.H. Glucagon-like peptide 1 and appetite. Trends Endocrinol. Metab. 2013, 24, 85–91. [Google Scholar] [CrossRef] [PubMed]
  9. Vilsbøll, T.; Krarup, T.; Deacon, C.F.; Madsbad, S.; Holst, J.J. Reduced postprandial concentrations of intact biologically active glucagon-like peptide 1 in type 2 diabetic patients. Diabetes 2001, 50, 609–613. [Google Scholar] [CrossRef] [PubMed]
  10. Nauck, M.; Holst, J.J.; Willms, B.; Schmiegel, W. Glucagon-like peptide 1 (GLP-1) as a new therapeutic approach for type 2-diabetes. Exp. Clin. Endocrinol. Diabetes 1996, 105, 187–195. [Google Scholar] [CrossRef] [PubMed]
  11. Ahrén, B. Glucagon-like peptide-1 (GLP-1): A gut hormone of potential interest in the treatment of diabetes. Bioessays 1998, 20, 642–651. [Google Scholar] [CrossRef]
  12. Ahrén, B.; Schmitz, O. GLP-1 receptor agonists and DPP-4 inhibitors in the treatment of type 2 diabetes. Horm. Metab. Res. 2003, 36, 867–876. [Google Scholar] [CrossRef] [PubMed]
  13. Devitt, A.; Jeffery Oliver, S.; Refaat Hegazi, A.; Mustad, V. Glycemia Targeted Specialized Nutrition (GTSN) improves postprandial glycemia and GLP-1 with similar appetitive responses compared to a healthful whole food breakfast in persons with type 2 diabetes: A randomized, controlled trial. J. Diabetes Res. Clin. Metab. 2012, 1, 20. [Google Scholar] [CrossRef]
  14. Voss, A.C.; Maki, K.C.; Garvey, W.T.; Hustead, D.S.; Alish, C.; Fix, B.; Mustad, V.A. Effect of two carbohydrate-modified tube-feeding formulas on metabolic responses in patients with type 2 diabetes. Nutrition 2008, 24, 990–997. [Google Scholar] [CrossRef] [PubMed]
  15. Sadiq Butt, M.; Tahir-Nadeem, M.; Khan, M.K.; Shabir, R.; Butt, M.S. Oat: Unique among the cereals. Eur. J. Nutr. 2008, 47, 68–79. [Google Scholar] [CrossRef] [PubMed]
  16. Tapola, N.; Karvonen, H.; Niskanen, L.; Mikola, M.; Sarkkinen, E. Glycemic responses of oat bran products in type 2 diabetic patients. Nutr. Metab. Cardiovasc. Dis. 2005, 15, 255–261. [Google Scholar] [CrossRef] [PubMed]
  17. Tappy, L.; Gügolz, E.; Würsch, P. Effects of breakfast cereals containing various amounts of β-glucan fibers on plasma glucose and insulin responses in NIDDM subjects. Diabetes Care 1996, 19, 831–834. [Google Scholar] [CrossRef] [PubMed]
  18. Pruessner, J.C.; Kirschbaum, C.; Meinlschmid, G.; Hellhammer, D.H. Two formulas for computation of the area under the curve represent measures of total hormone concentration versus time-dependent change. Psychoneuroendocrinology 2003, 28, 916–931. [Google Scholar] [CrossRef]
  19. Gonzalez-Ortiz, M.; Martinez-Abundis, E.; Hernandez-Salazar, E.; Kam-Ramos, A.M.; Robles-Cervantes, J.A. Effect of a nutritional liquid supplement designed for the patient with diabetes mellitus (Glucerna SR) on the postprandial glucose state, insulin secretion and insulin sensitivity in healthy subjects. Diabetes Obes. Metab. 2006, 8, 331–335. [Google Scholar] [CrossRef] [PubMed]
  20. Devitt, A.A.; Williams, J.A.; Choe, Y.S.; Hustead, D.S.; Mustad, V.A. Glycemic responses to glycemia-targeted specialized-nutrition beverages with varying carbohydrates compared to a standard nutritional beverage in adults with type 2 diabetes. Adv. Biosci. Biotechnol. 2013, 4, 1. [Google Scholar] [CrossRef]
  21. Heine, R.; Dekker, J. Beyond postprandial hyperglycaemia: Metabolic factors associated with cardiovascular disease. Diabetologia 2002, 45, 461–475. [Google Scholar] [CrossRef] [PubMed]
  22. Nalysnyk, L.; Hernandez-Medina, M.; Krishnarajah, G. Glycaemic variability and complications in patients with diabetes mellitus: Evidence from a systematic review of the literature. Diabetes Obes. Metab. 2010, 12, 288–298. [Google Scholar] [CrossRef] [PubMed]
  23. Bao, L.; Cai, X.; Xu, M.; Li, Y. Effect of oat intake on glycaemic control and insulin sensitivity: A meta-analysis of randomised controlled trials. Br. J. Nutr. 2014, 112, 457–466. [Google Scholar] [CrossRef] [PubMed]
  24. Sottero, B.; Gargiulo, S.; Russo, I.; Barale, C.; Poli, G.; Cavalot, F. Postprandial Dysmetabolism and Oxidative Stress in Type 2 Diabetes: Pathogenetic Mechanisms and Therapeutic Strategies. Med. Res. Rev. 2015, 35, 968–1031. [Google Scholar] [CrossRef] [PubMed]
  25. Ceriello, A.; Davidson, J.; Hanefeld, M.; Leiter, L.; Monnier, L.; Owens, D.; Tajima, N.; Tuomilehto, J. International Prandial Glucose Regulation Study G: Postprandial hyperglycaemia and cardiovascular complications of diabetes: An update. Nutr. Metab. Cardiovasc. Dis. 2006, 16, 453–456. [Google Scholar] [CrossRef] [PubMed]
  26. Nuttall, F.Q.; Mooradian, A.D.; Gannon, M.C.; Billington, C.; Krezowski, P. Effect of protein ingestion on the glucose and insulin response to a standardized oral glucose load. Diabetes Care 1984, 7, 465–470. [Google Scholar] [CrossRef] [PubMed]
  27. Van Loon, L.J.; Kruijshoop, M.; Menheere, P.P.; Wagenmakers, A.J.; Saris, W.H.; Keizer, H.A. Amino acid ingestion strongly enhances insulin secretion in patients with long-term type 2 diabetes. Diabetes Care 2003, 26, 625–630. [Google Scholar] [CrossRef] [PubMed]
  28. Flier, J.S.; Underhill, L.H.; Polonsky, K.S.; Sturis, J.; Bell, G.I. Non-insulin-dependent diabetes mellitus—A genetically programmed failure of the beta cell to compensate for insulin resistance. N. Engl. J. Med. 1996, 334, 777–783. [Google Scholar] [CrossRef] [PubMed]
  29. Manders, R.J.; Wagenmakers, A.J.; Koopman, R.; Zorenc, A.H.; Menheere, P.P.; Schaper, N.C.; Saris, W.H.; van Loon, L.J. Co-ingestion of a protein hydrolysate and amino acid mixture with carbohydrate improves plasma glucose disposal in patients with type 2 diabetes. Am. J. Clin. Nutr. 2005, 82, 76–83. [Google Scholar] [PubMed]
  30. Wolever, T.M.; Bentum-Williams, A.; Jenkins, D.J. Physiological modulation of plasma free fatty acid concentrations by diet: Metabolic implications in nondiabetic subjects. Diabetes Care 1995, 18, 962–970. [Google Scholar] [CrossRef] [PubMed]
  31. Thomsen, C.; Storm, H.; Holst, J.J.; Hermansen, K. Differential effects of saturated and monounsaturated fats on postprandial lipemia and glucagon-like peptide 1 responses in patients with type 2 diabetes. Am. J. Clin. Nutr. 2003, 77, 605–611. [Google Scholar] [PubMed]
  32. Rocca, A.S.; LaGreca, J.; Kalitsky, J.; Brubaker, P.L. Monounsaturated Fatty Acid Diets Improve Glycemic Tolerance through Increased Secretion of Glucagon-Like Peptide-1. Endocrinology 2001, 142, 1148–1155. [Google Scholar] [PubMed]
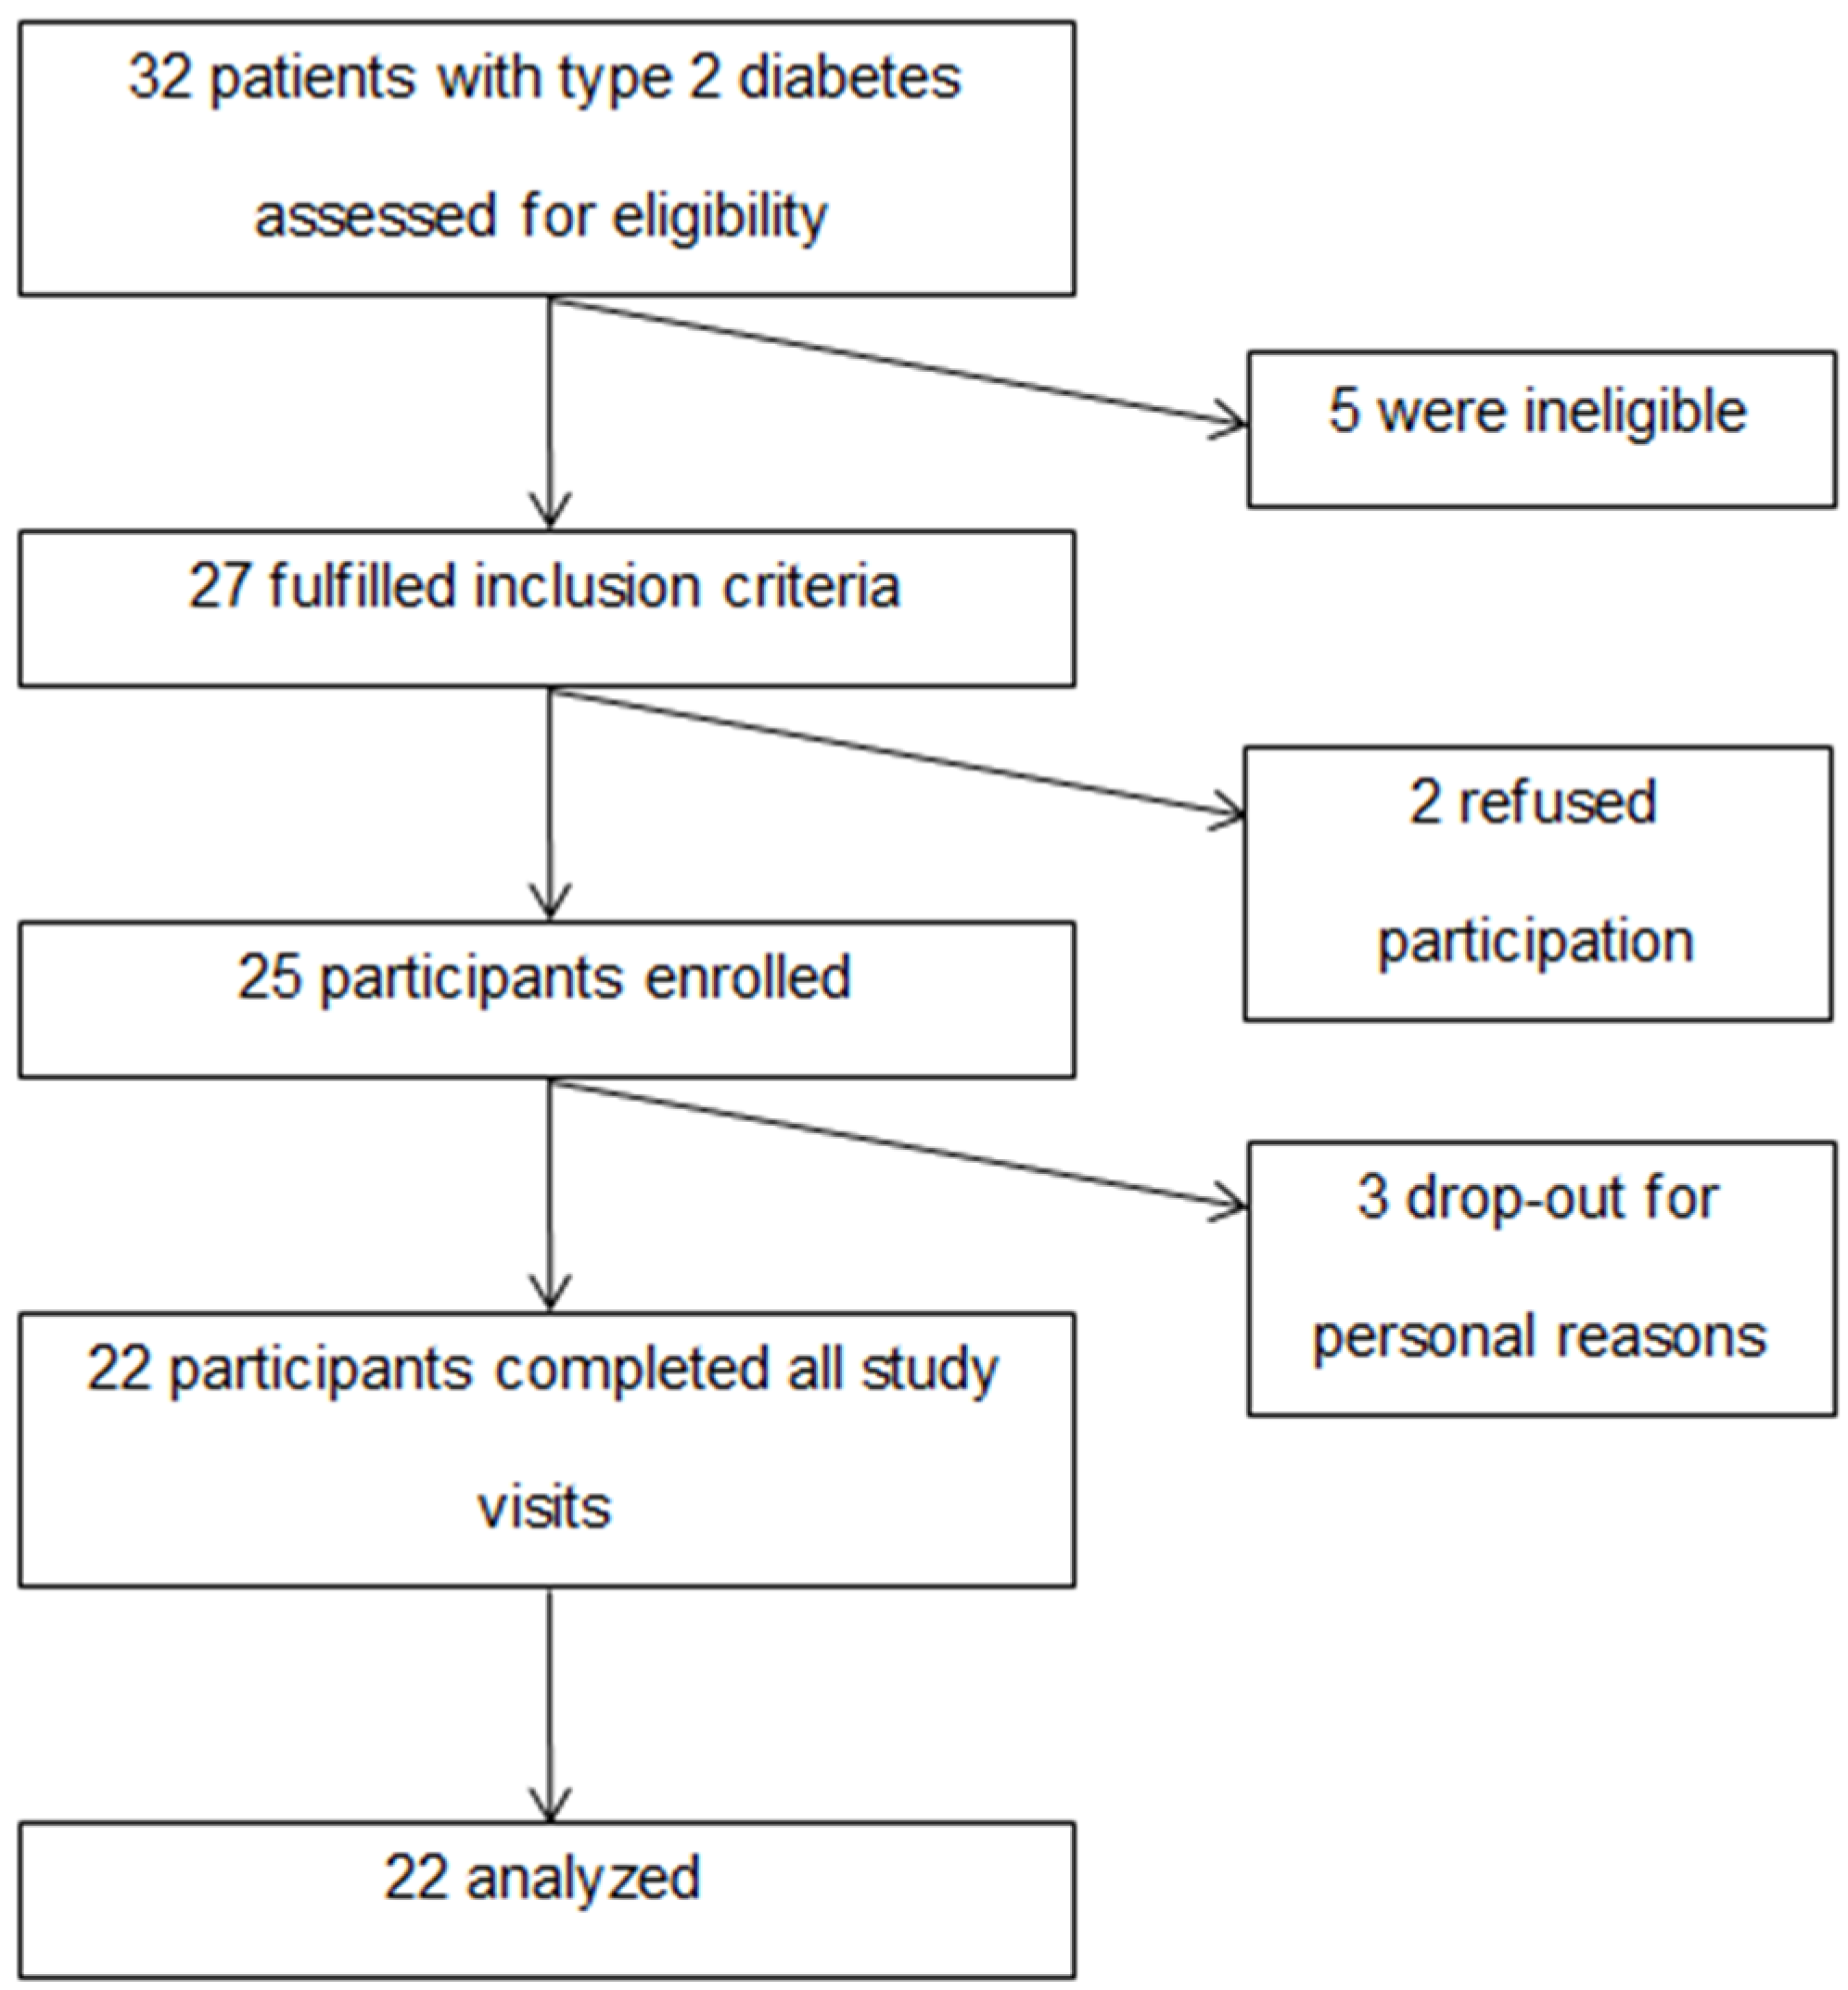
Figure 1. Flow diagram of study enrollment.
Nutrients 08 00443 g001
Figure 2. Postprandial glucose (a); insulin (b); GLP-1 (c) levels in response to the breakfast meals. Values are mean ± SEM.
Nutrients 08 00443 g002
Figure 3. Postprandial insulin positive area under the curve 0–120 min (pAUC0–120) in response to the breakfast meals. Values are mean ± SEM. * p < 0.05 compared to oatmeal.
Nutrients 08 00443 g003
Figure 4. Postprandial free fatty acids (a) and triglycerides (b) in response to the breakfast meals. Values are mean ± SEM.
Nutrients 08 00443 g004aNutrients 08 00443 g004b
Table 1. Characteristics of study participants (n = 22).
Gender
 Male12 (54.6%)
 Female10 (45.5%)
Age (years)62.3 ± 6.8
Height (cm)171.1 ± 8.9
Weight (kg)97.4 ± 21.3
BMI (kg/m2)33.2 ± 5.9
Diabetes duration (years)9.5 ± 9.8
HbA1c (%)6.8 ± 0.7
Participants using diabetes medications (n)19
Participants using DPP-4 inhibitors6
Participants using lipid lowering medications15
Gender n (%). Values are mean ± standard deviation. Dipeptidyl peptidase-4 inhibitors (DPP-4 inhibitors).
Table 2. Nutrition information of the three breakfast meals.
Oatmeal (OM)Glucerna (GL)Ultra Glucose Control (UGC)
Amount% DVAmount% DVAmount% DV
Serving Size53.3 (g)NA8 (fl oz)NA56 (g)NA
Energy (kcal)200102001020010
Total Fat (g)46.7711711
 % Energy18-32-32-
Saturated Fat (g)000.5315
Monounsaturated Fat (g)1.3-5.2-4.5-
Total Carbohydrates (g)3612269279
 % Energy72-52-54-
Dietary Fiber (g)5.320312312
Protein (g)6.7NA10201530
 % Energy13-20-30-
% DV: percentage daily values were calculated based on a 2000 kcal diet. Oatmeal (OM, Quaker Oats Co., Chicago, IL, USA); Glucerna (GL, Abbott Nutrition Inc., Columbus, OH, USA); Ultra Glucose Control (UGC, Metagenics Inc., Aliso Viejo, CA, USA).
Table 3. Amino acids composition of the three breakfast meals.
Amino AcidOatmeal aGlucerna bUltra Glucose Control b
Histidine0.1640.3270.329
Isoleucine0.2950.6031.119
Leucine0.5671.1691.850
Lysine0.2900.9460.872
Methionine0.1310.3120.175
Phenylalanine0.3910.6100.731
Threonine0.2590.6550.518
Tryptophan-0.1540.145
Valine0.3980.7331.183
Alanine0.3540.4420.613
Arginine0.4910.4731.167
Aspartic acid0.6021.0271.492
Cystine0.2080.0760.160
Glutamic acid1.6352.6502.261
Glycine0.3670.2740.560
Proline0.4051.1260.604
Serine0.3670.7100.698
Tyrosine0.2570.5440.540
Values are in grams per serving. a Source: Amino-Acid Content of Foods and Biological Data on Proteins, Food and Agriculture Organization of the United Nations reference profile; b Source: direct communication with the manufacturers.
Table 4. Area under the curve 0–240 min for the different variables in response to the meals.
Oatmeal (OM)Glucerna (GL)Ultra Glucose Control (UGC)
Glucose (mg·min/dL)37,828.6 ± 1678.732,747.0 ± 1287.7 *33,538.6 ± 1266.5 *
Insulin (IU·min/mL)2995.1 ± 442.43247.3 ± 538.93799.6 ± 620.9
Active GLP-1 (pg·min/mL)1055.5 ± 187.32347.7 ± 464.2 *1631.5 ± 246.8 *
Free fatty acids (mmol·min/L)97.023 ± 8.799.2 ± 8.5108.4 ± 9.0
Triglyceride (mg·min/dL)32,077.5 ± 3517.634,887.3 ± 2857.035,739.5 ± 3438.4
Values are mean ± SEM. * p < 0.001 compared to oatmeal.