Protein Supplementation Does Not Further Increase Latissimus Dorsi Muscle Fiber Hypertrophy after Eight Weeks of Resistance Training in Novice Subjects, but Partially Counteracts the Fast-to-Slow Muscle Fiber Transition

 ,
, 

Abstract
:
1. Introduction
2. Subjects and Methods
2.1. Subjects
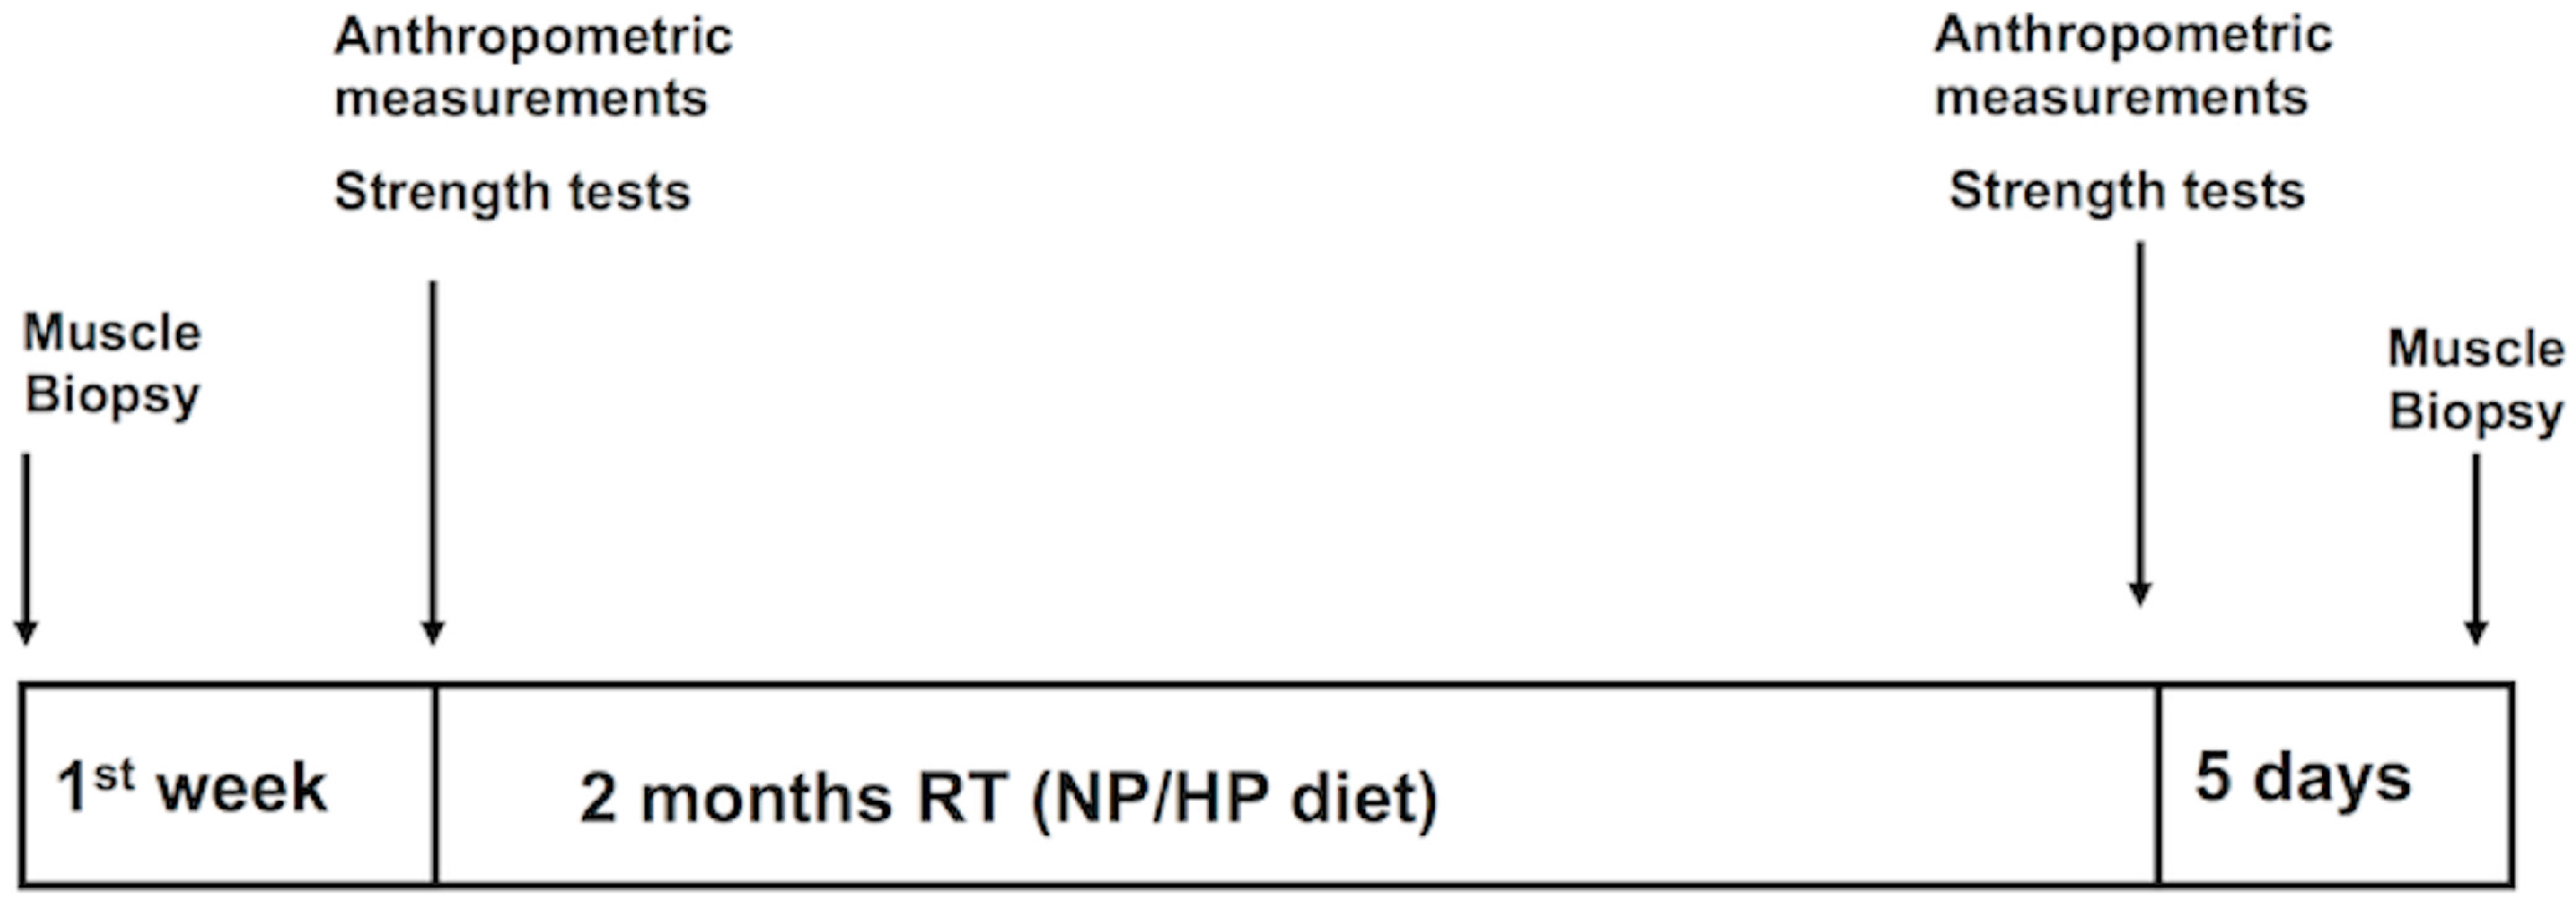
2.2. Study Design
2.3. Resistance Training Protocol
2.4. Nutritional Assessment
2.5. Exercise Testing
2.6. Anthropometric Measurements
2.7. Muscle Biopsy and Muscle Fiber Analysis
2.8. Immunofluorescence
2.9. Statistical Analysis
3. Results
3.1. Diet and Training Compliance
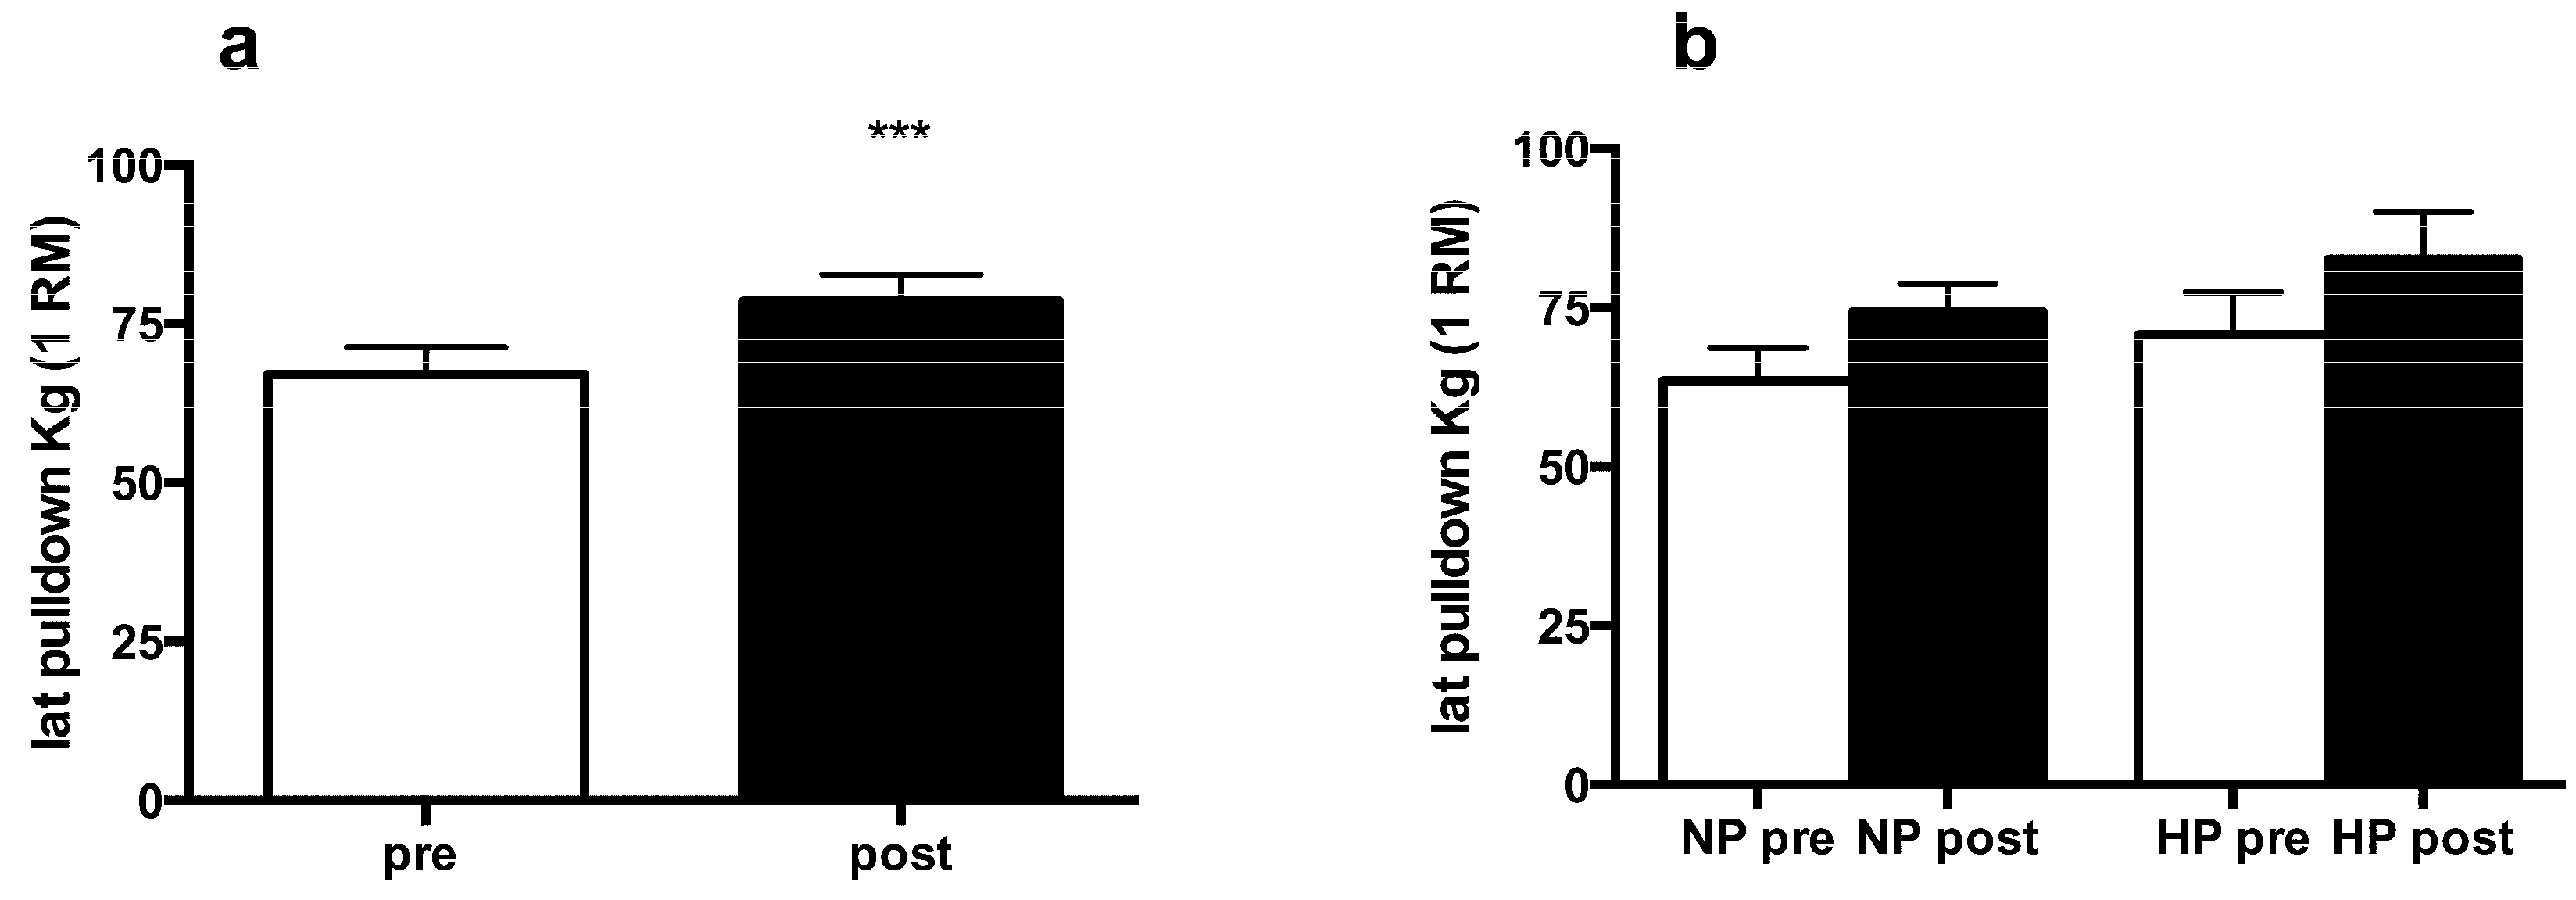
3.2. Muscle Strength and Body Composition
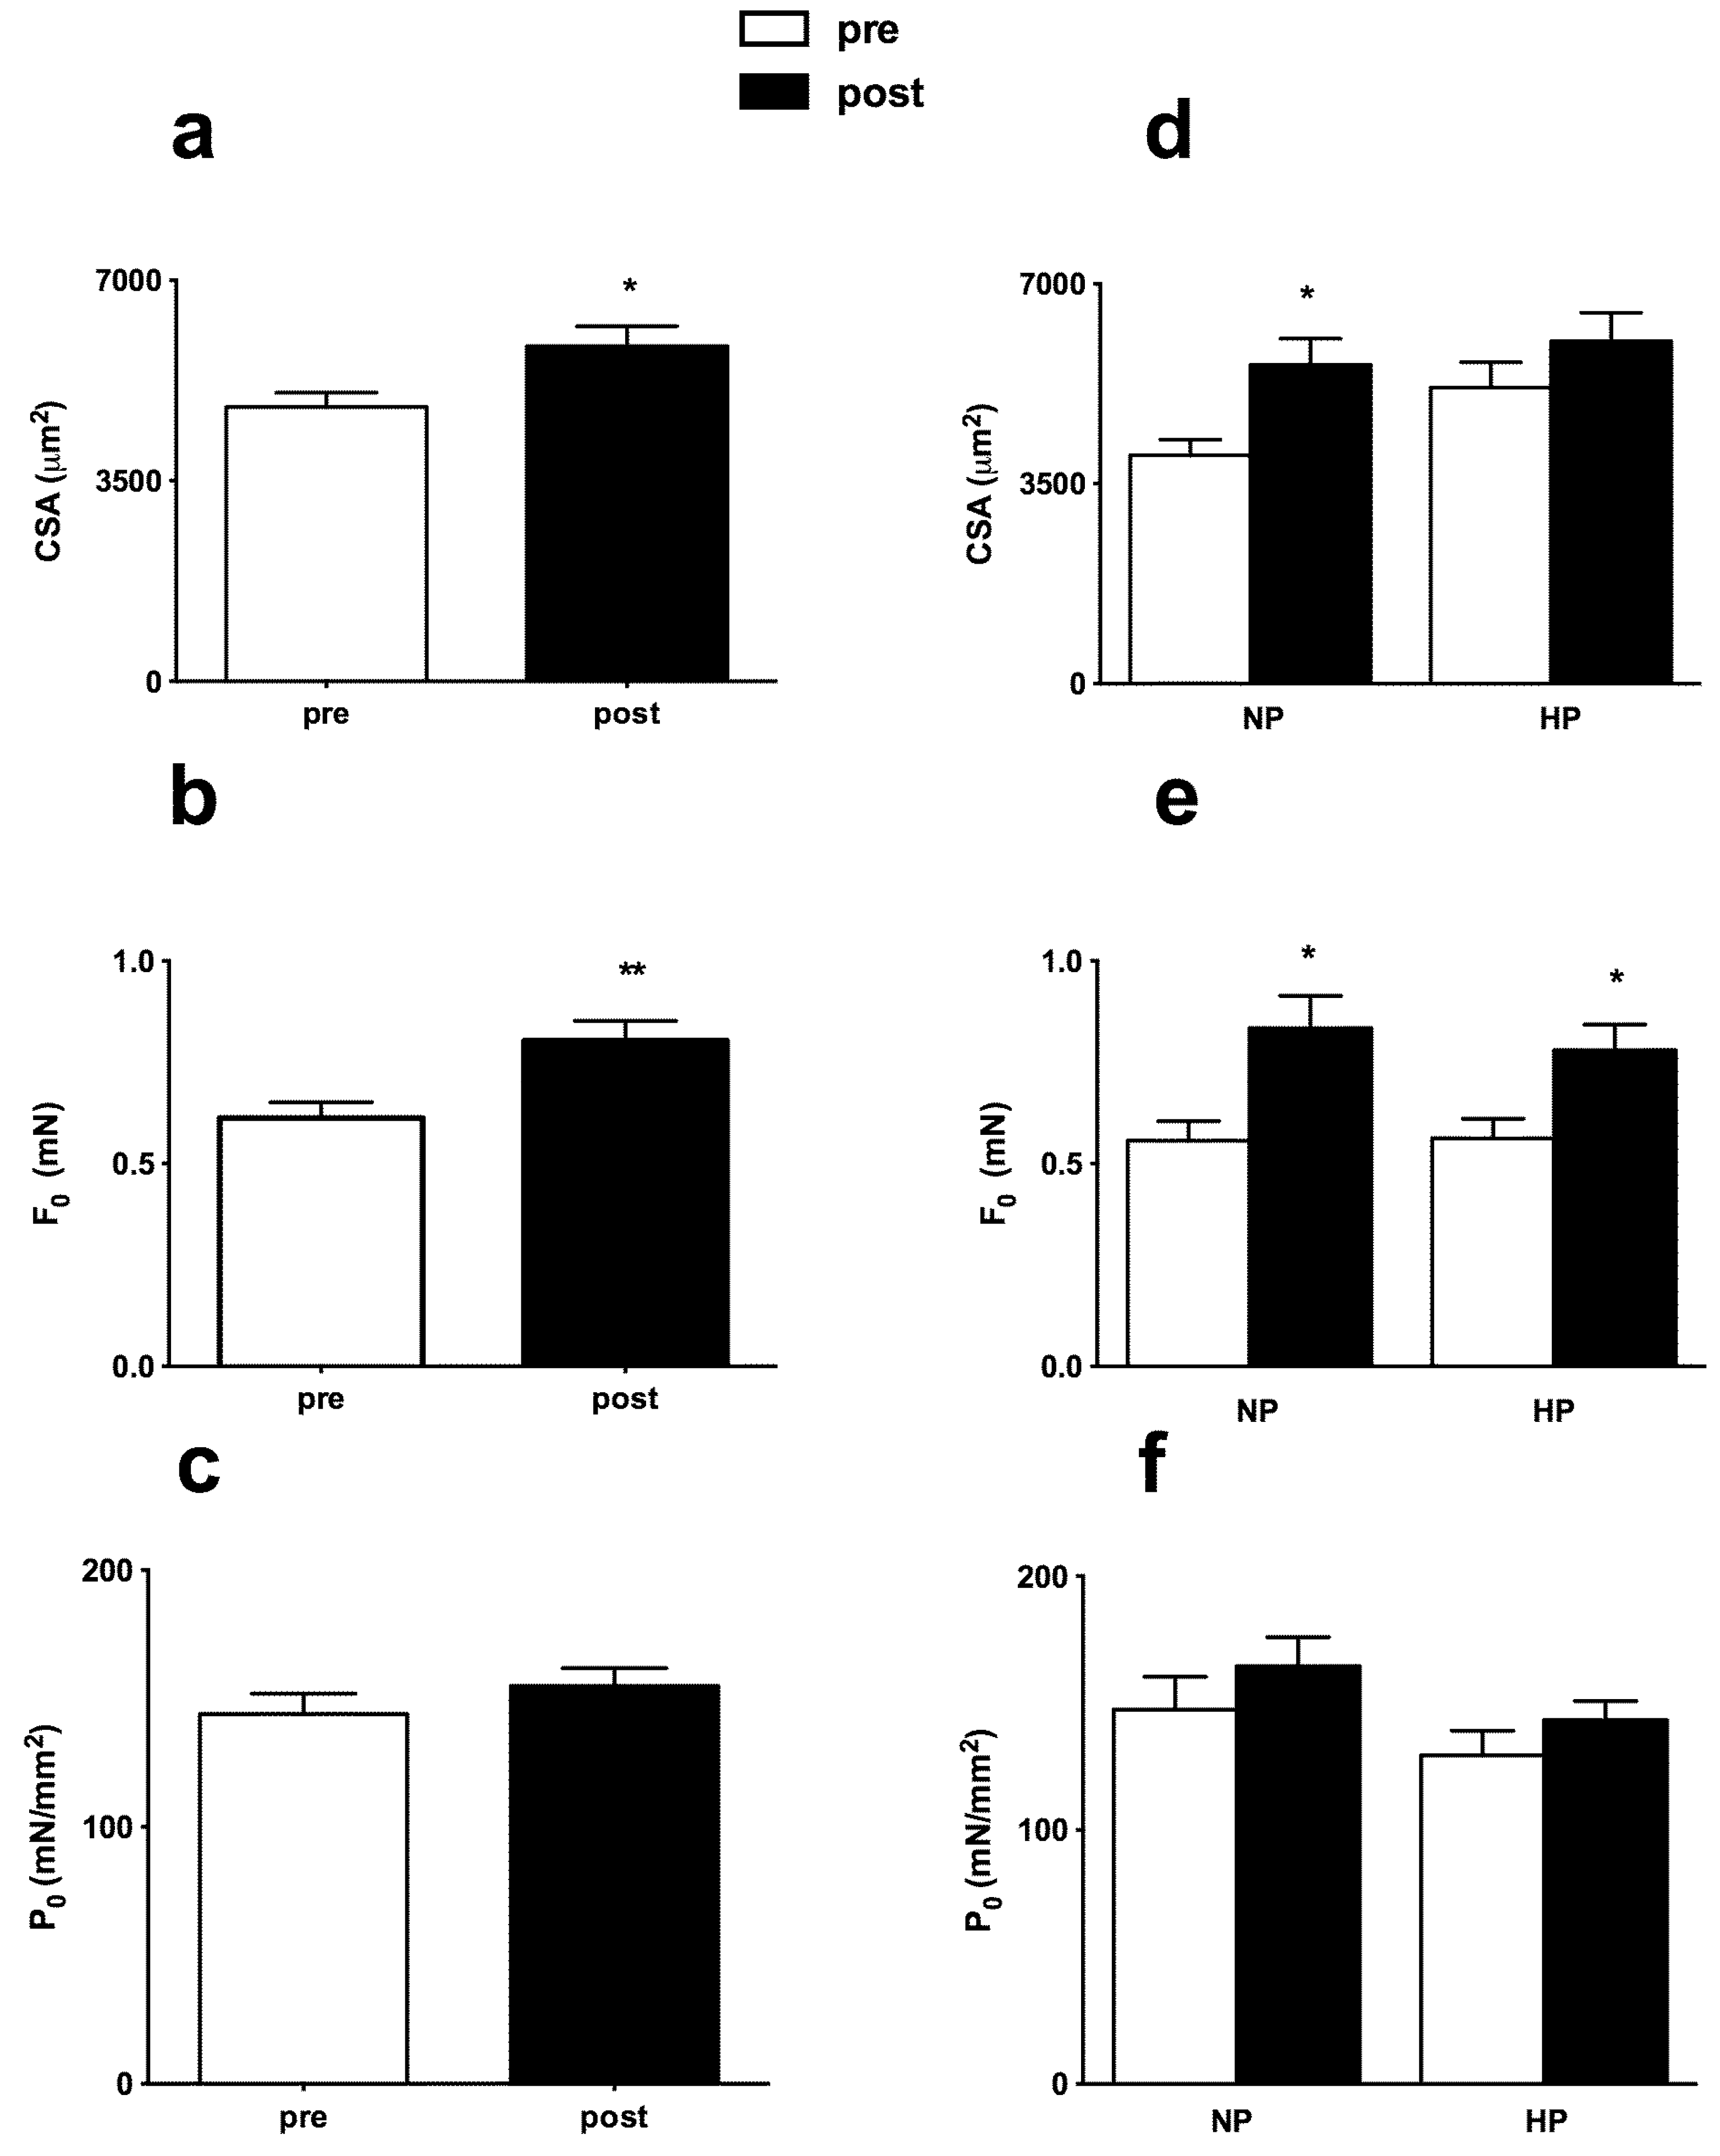
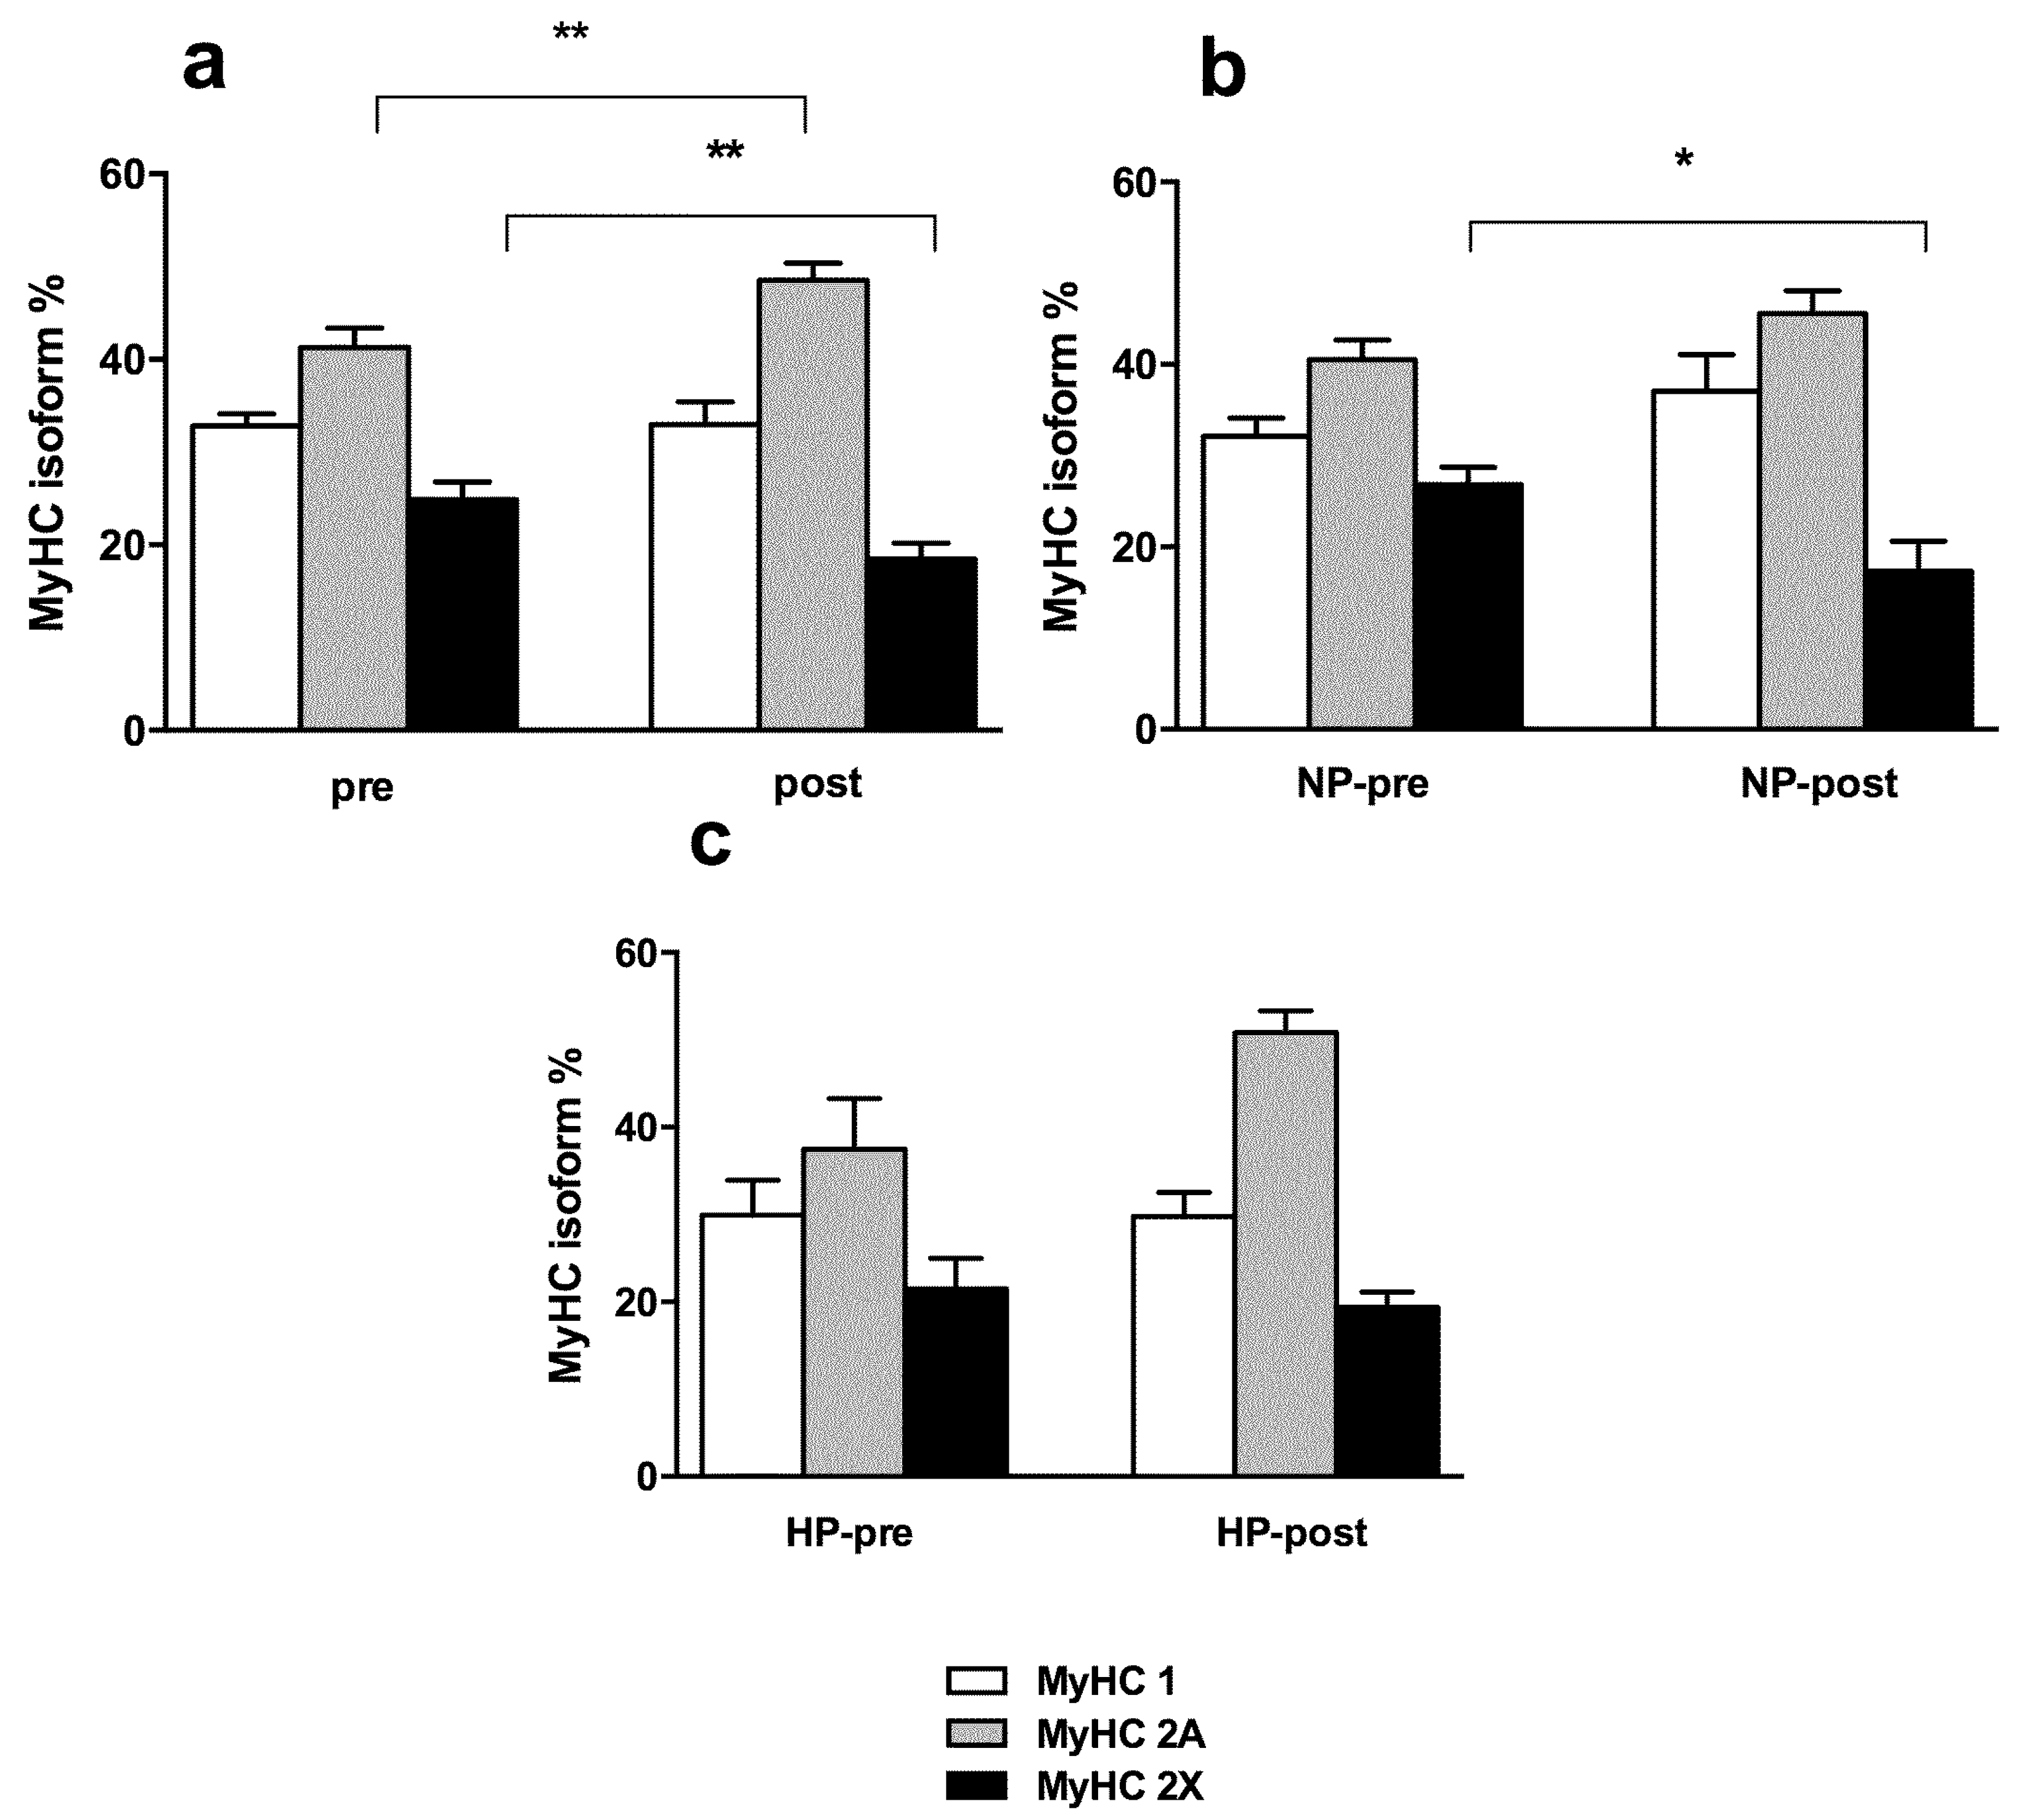
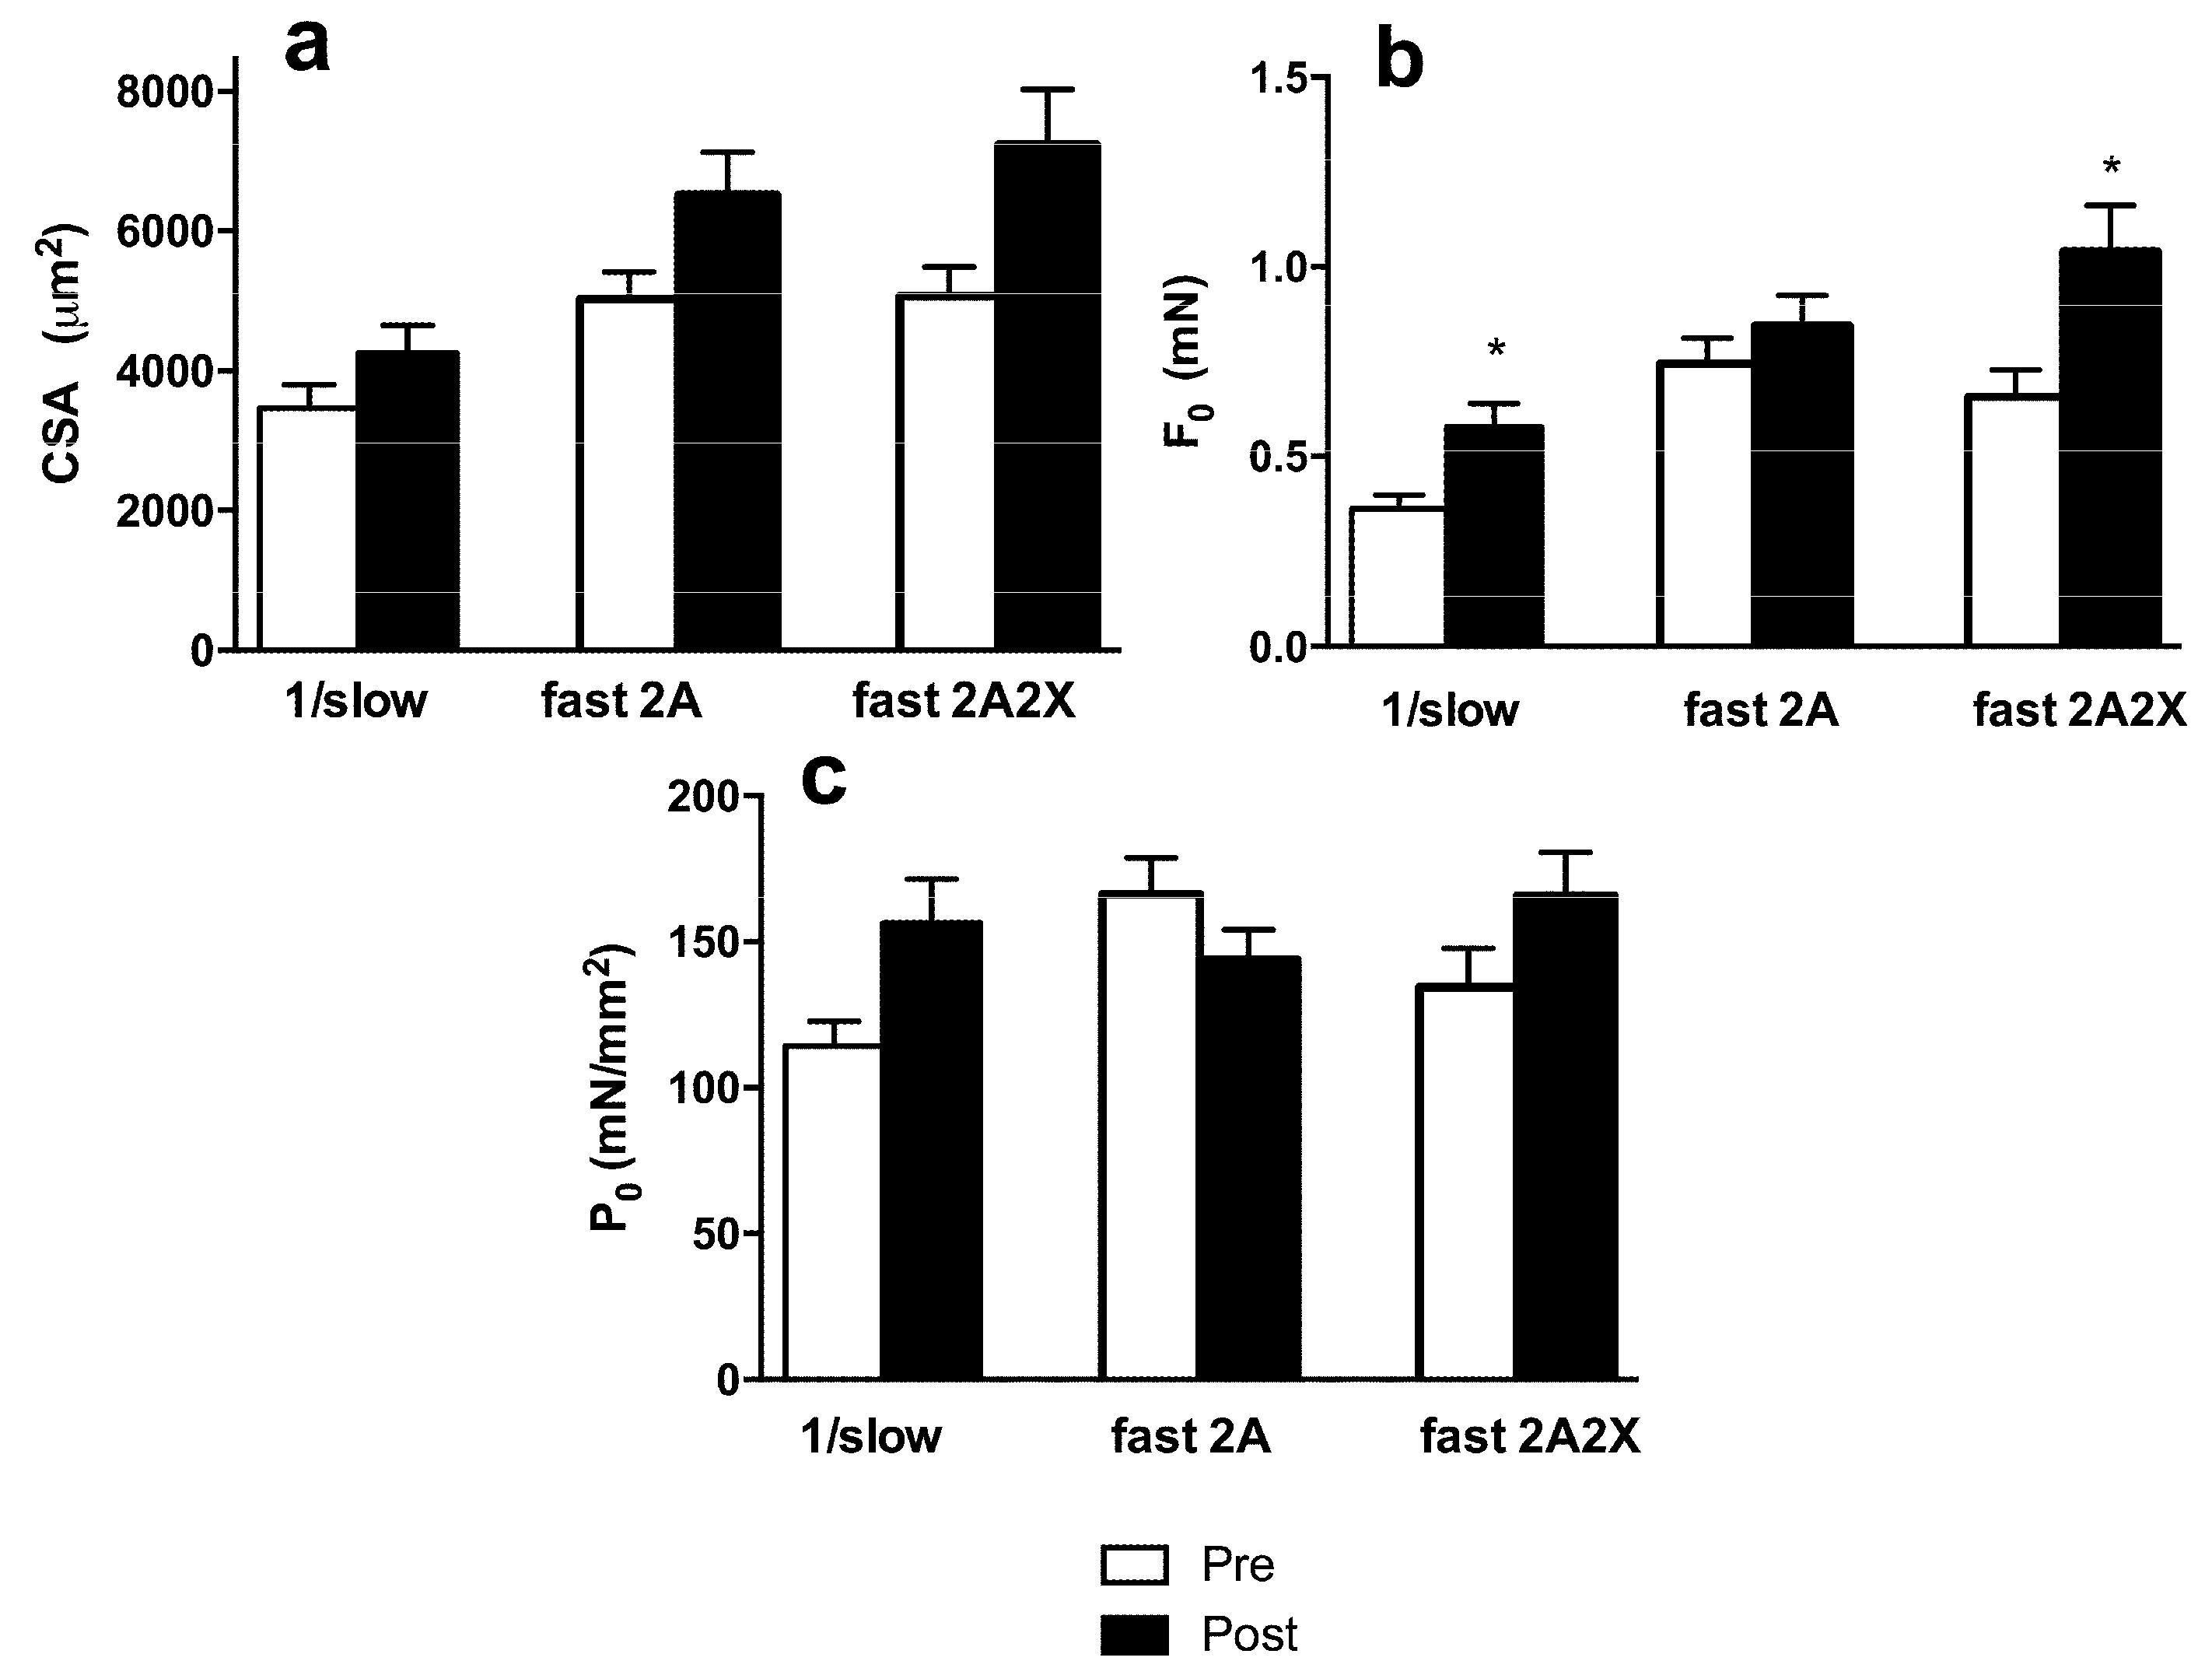
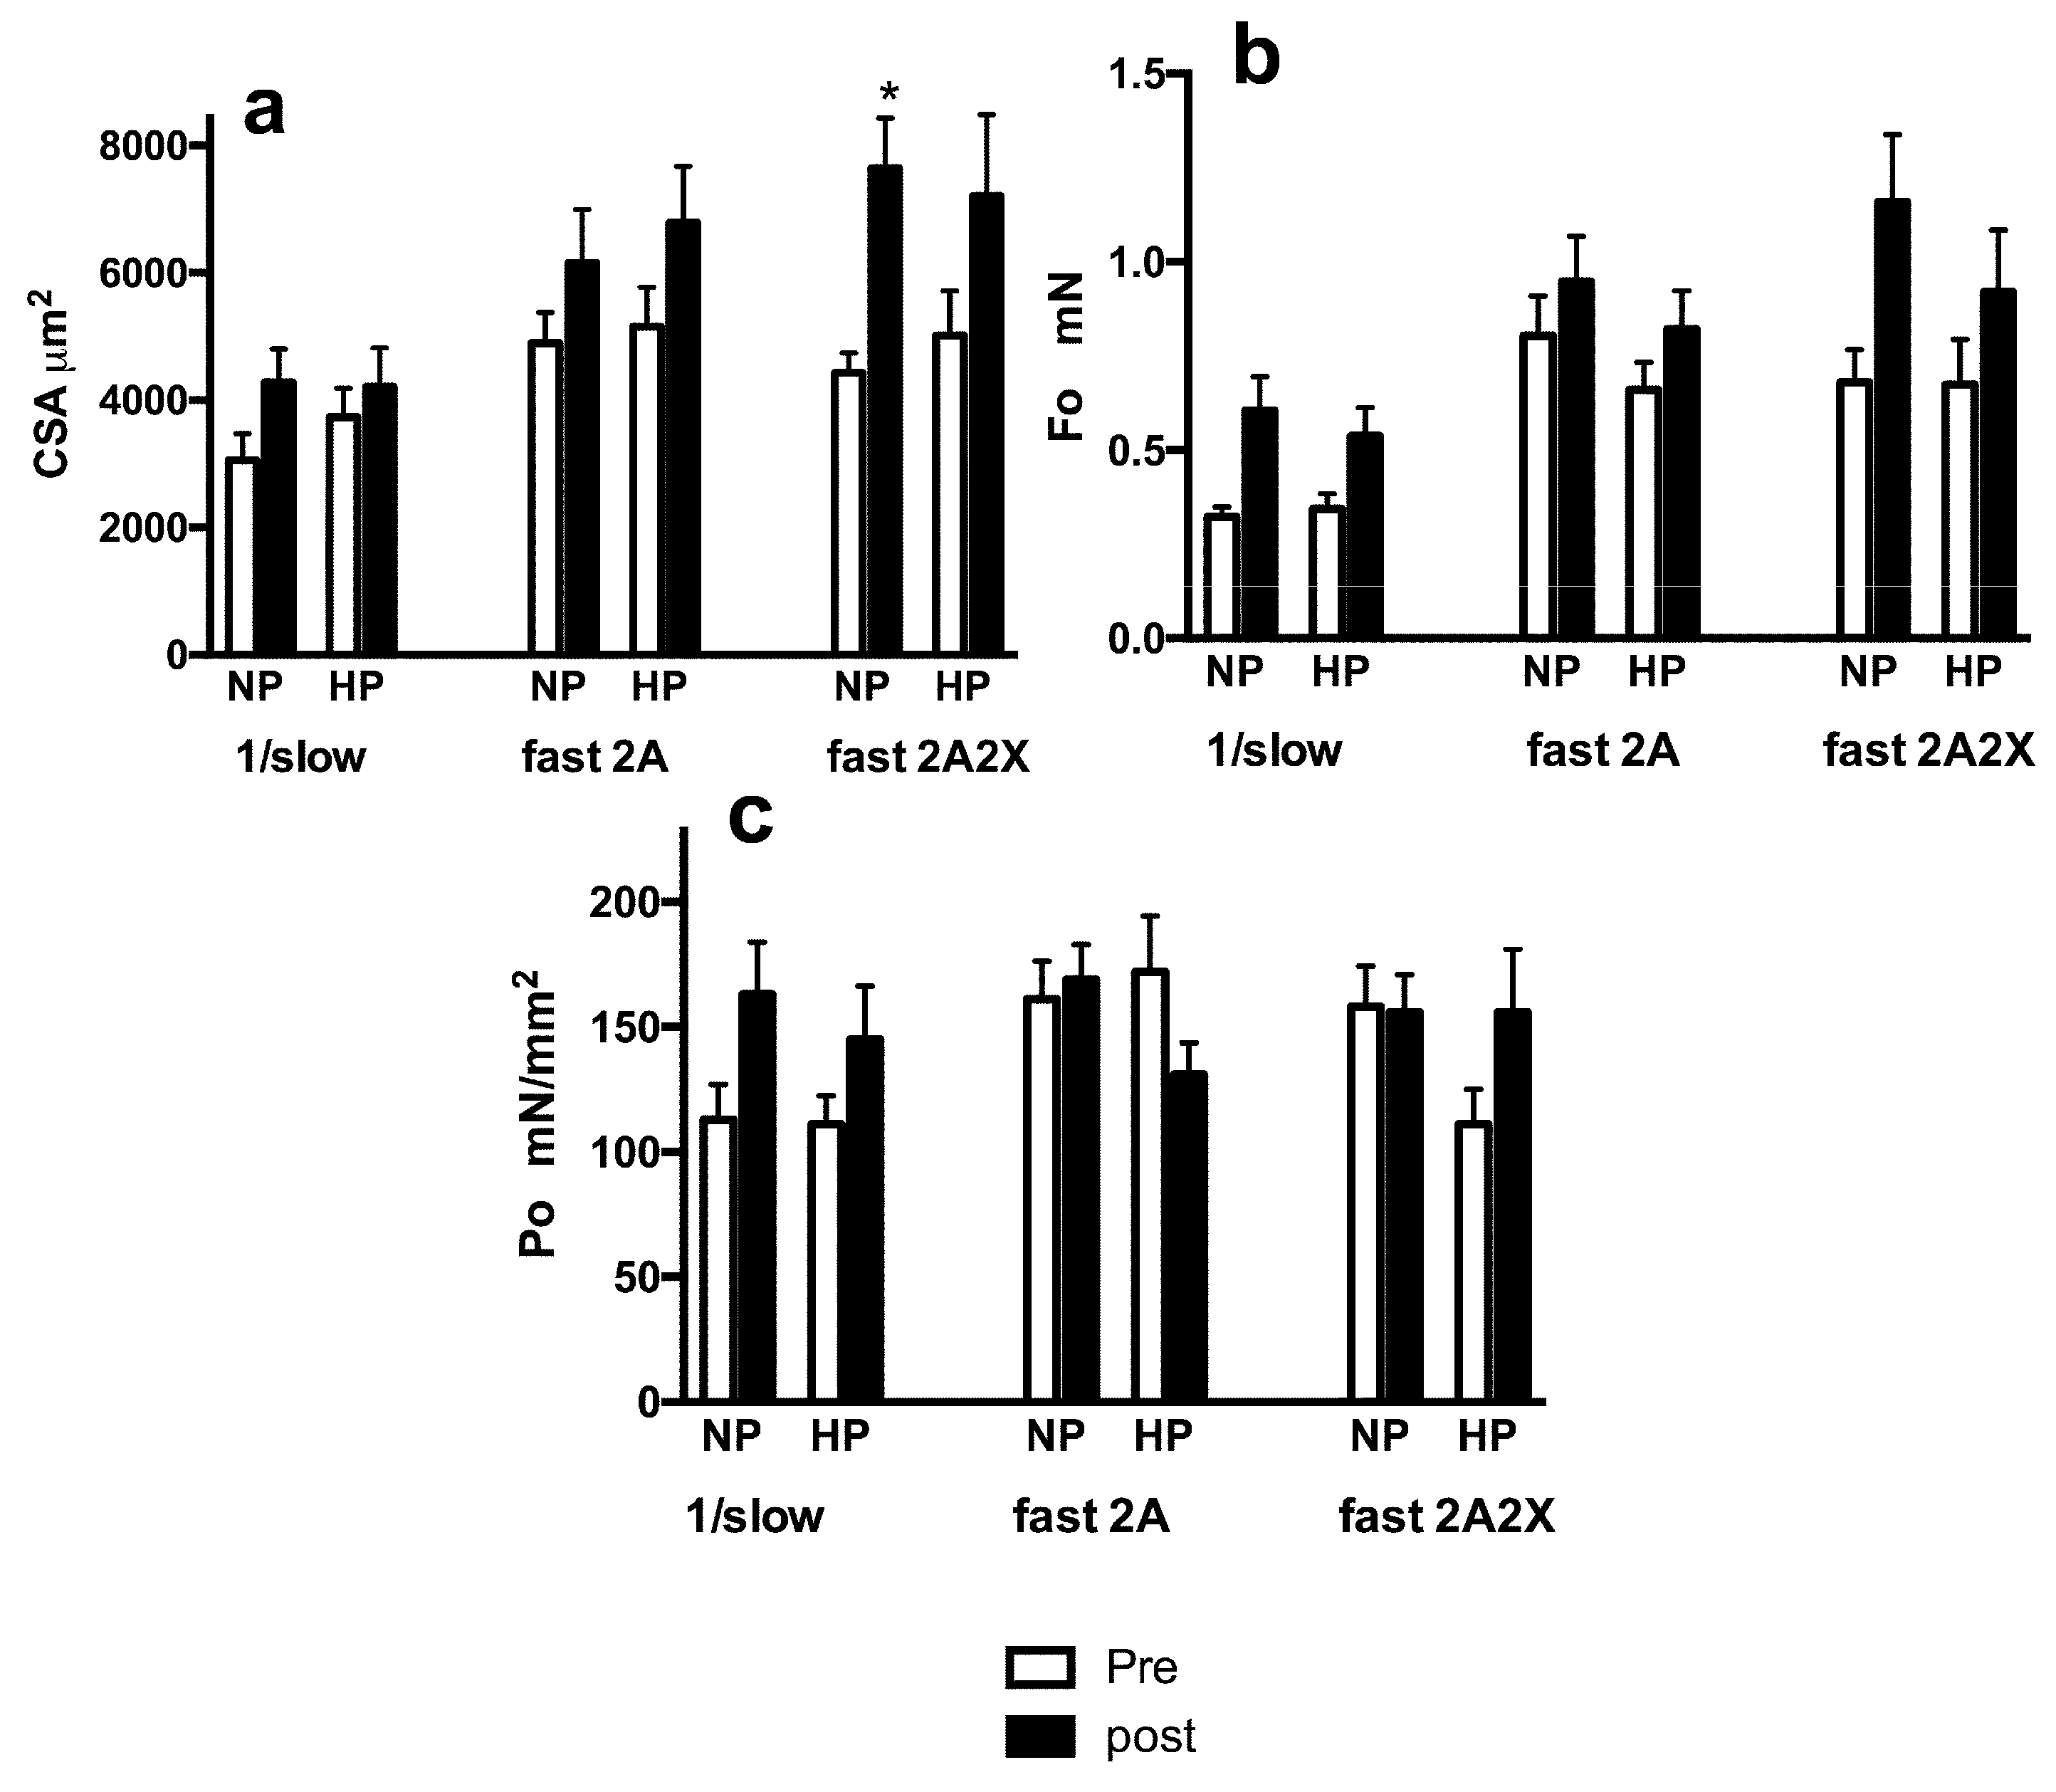
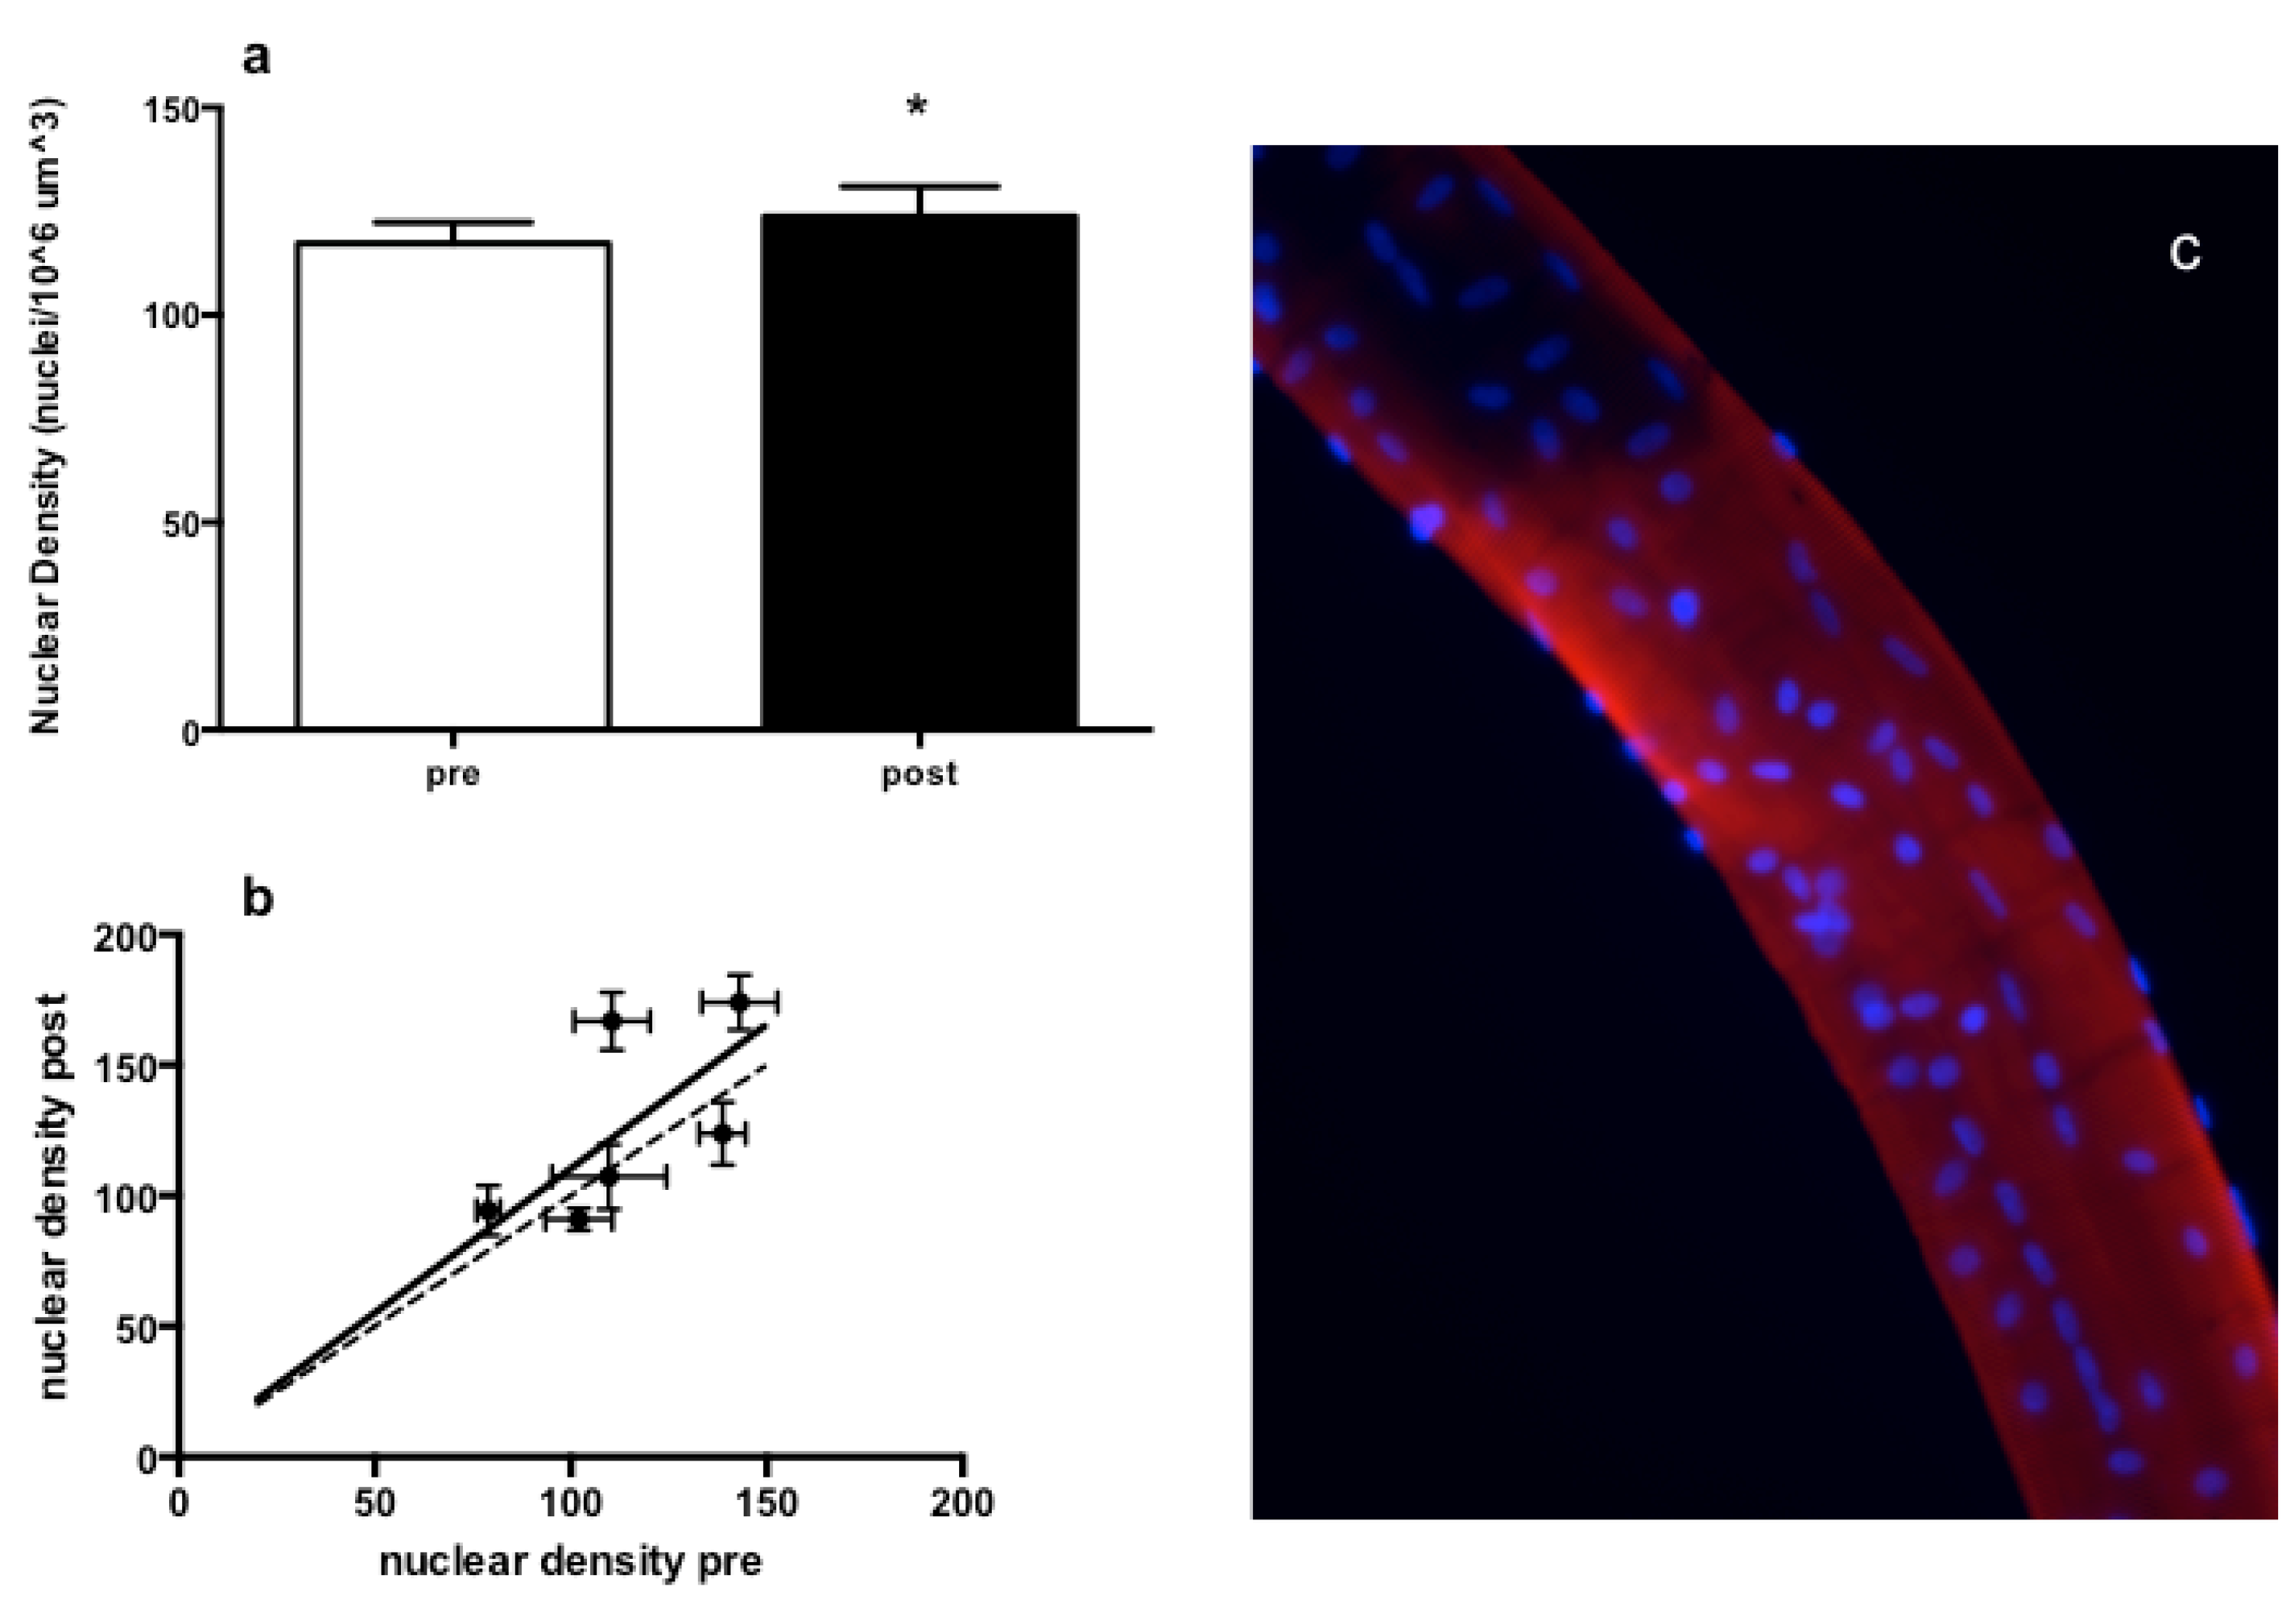
3.3. Muscle Fiber Type Composition and Muscle Fiber Mechanics
4. Discussion
Acknowledgments
Authors Contribution
Conflicts of Interest
References
- Cureton, K.J.; Collins, M.A.; Hill, D.W.; McElhannon, F.M., Jr. Muscle hypertrophy in men and women. Med. Sci. Sports Exerc. 1988, 20, 338–344. [Google Scholar] [CrossRef] [PubMed]
- MacDougall, J.D.; Sale, D.G.; Elder, G.C.; Sutton, J.R. Muscle ultrastructural characteristics of elite powerlifters and bodybuilders. Eur. J. Appl. Physiol. Occup. Physiol. 1982, 48, 117–126. [Google Scholar] [CrossRef] [PubMed]
- Staron, R.S.; Leonardi, M.J.; Karapondo, D.L.; Malicky, E.S.; Falkel, J.E.; Hagerman, F.C.; Hikida, R.S. Strength and skeletal muscle adaptations in heavy-resistance-trained women after detraining and retraining. J. Appl. Physiol. 1991, 70, 631–640. [Google Scholar] [PubMed]
- Tesch, P.A.; Thorsson, A.; Kaiser, P. Muscle capillary supply and fiber type characteristics in weight and power lifters. J. Appl. Physiol. Respir. Environ. Exerc. Physiol. 1984, 56, 35–38. [Google Scholar] [PubMed]
- Phillips, S.M. A brief review of critical processes in exercise-induced muscular hypertrophy. Sports Med. 2014, 44, S71–S77. [Google Scholar] [CrossRef] [PubMed]
- Schiaffino, S.; Reggiani, C. Fiber types in mammalian skeletal muscles. Physiol. Rev. 2011, 91, 1447–1531. [Google Scholar] [CrossRef] [PubMed]
- Moore, D.R.; Tang, J.E.; Burd, N.A.; Rerecich, T.; Tarnopolsky, M.A.; Phillips, S.M. Differential stimulation of myofibrillar and sarcoplasmic protein synthesis with protein ingestion at rest and after resistance exercise. J. Physiol. 2009, 587, 897–904. [Google Scholar] [CrossRef] [PubMed]
- Thalacker-Mercer, A.E.; Petrella, J.K.; Bamman, M.M. Does habitual dietary intake influence myofiber hypertrophy in response to resistance training? A cluster analysis. Appl. Physiol. Nutr. Metab. 2009, 34, 632–639. [Google Scholar] [CrossRef] [PubMed]
- Tipton, K.D.; Elliott, T.A.; Ferrando, A.A.; Aarsland, A.A.; Wolfe, R.R. Stimulation of muscle anabolism by resistance exercise and ingestion of leucine plus protein. Appl. Physiol. Nutr. Metab. 2009, 34, 151–161. [Google Scholar] [CrossRef] [PubMed]
- Glover, E.I.; Phillips, S.M. Resistance exercise and appropriate nutrition to counteract muscle wasting and promote muscle hypertrophy. Curr. Opin. Clin. Nutr. Metab. Care 2010, 13, 630–634. [Google Scholar] [CrossRef] [PubMed]
- Hulmi, J.J.; Lockwood, C.M.; Stout, J.R. Effect of protein/essential amino acids and resistance training on skeletal muscle hypertrophy: A case for whey protein. Nutr. Metab. 2010, 7, 51. [Google Scholar] [CrossRef] [PubMed]
- Phillips, S.M. The science of muscle hypertrophy: Making dietary protein count. Proc. Nutr. Soc. 2011, 70, 100–103. [Google Scholar] [CrossRef] [PubMed]
- Dreyer, H.C.; Drummond, M.J.; Pennings, B.; Fujita, S.; Glynn, E.L.; Chinkes, D.L.; Dhanani, S.; Volpi, E.; Rasmussen, B.B. Leucine-enriched essential amino acid and carbohydrate ingestion following resistance exercise enhances mtor signaling and protein synthesis in human muscle. Am. J. Physiol. Endocrinol. Metab. 2008, 294, E392–E400. [Google Scholar] [CrossRef] [PubMed]
- Tipton, K.D.; Borsheim, E.; Wolf, S.E.; Sanford, A.P.; Wolfe, R.R. Acute response of net muscle protein balance reflects 24-h balance after exercise and amino acid ingestion. Am. J. Physiol. Endocrinol. Metab. 2003, 284, E76–E89. [Google Scholar] [CrossRef] [PubMed]
- Cermak, N.M.; Res, P.T.; de Groot, L.C.; Saris, W.H.; van Loon, L.J. Protein supplementation augments the adaptive response of skeletal muscle to resistance-type exercise training: A meta-analysis. Am. J. Clin. Nutr. 2012, 96, 1454–1464. [Google Scholar] [CrossRef] [PubMed]
- Shepstone, T.N.; Tang, J.E.; Dallaire, S.; Schuenke, M.D.; Staron, R.S.; Phillips, S.M. Short-term high- vs. low-velocity isokinetic lengthening training results in greater hypertrophy of the elbow flexors in young men. J. Appl. Physiol. 2005, 98, 1768–1776. [Google Scholar] [CrossRef] [PubMed]
- Paoli, A.; Pacelli, Q.F.; Cancellara, P.; Toniolo, L.; Moro, T.; Canato, M.; Miotti, D.; Reggiani, C. Myosin isoforms and contractile properties of single fibers of human latissimus dorsi muscle. BioMed. Res. Int. 2013, 2013, 249398. [Google Scholar] [CrossRef] [PubMed][Green Version]
- Paoli, A.; Moro, T.; Marcolin, G.; Neri, M.; Bianco, A.; Palma, A.; Grimaldi, K. High-intensity interval resistance training (hirt) influences resting energy expenditure and respiratory ratio in non-dieting individuals. J. Transl. Med. 2012, 10, 237. [Google Scholar] [CrossRef] [PubMed]
- Shackelford, L.C.; LeBlanc, A.D.; Driscoll, T.B.; Evans, H.J.; Rianon, N.J.; Smith, S.M.; Spector, E.; Feeback, D.L.; Lai, D. Resistance exercise as a countermeasure to disuse-induced bone loss. J. Appl. Physiol. 2004, 97, 119. [Google Scholar] [CrossRef] [PubMed]
- Frankenfield, D.; Roth-Yousey, L.; Compher, C. Comparison of predictive equations for resting metabolic rate in healthy nonobese and obese adults: A systematic review. J. Am. Diet. Assoc. 2005, 105, 775–789. [Google Scholar] [CrossRef] [PubMed]
- Wang, Z.; Heshka, S.; Gallagher, D.; Boozer, C.N.; Kotler, D.P.; Heymsfield, S.B. Resting energy expenditure-fat-free mass relationship: New insights provided by body composition modeling. Am. J. Physiol. Endocrinol. Metab. 2000, 279, E539–E545. [Google Scholar] [PubMed]
- Tracy, B.L.; Byrnes, W.C.; Enoka, R.M. Strength training reduces force fluctuations during anisometric contractions of the quadriceps femoris muscles in old adults. J. Appl. Physiol. 2004, 96, 1530–1540. [Google Scholar] [CrossRef] [PubMed]
- Eston, R.G.; Rowlands, A.V.; Charlesworth, S.; Davies, A.; Hoppitt, T. Prediction of dxa-determined whole body fat from skinfolds: Importance of including skinfolds from the thigh and calf in young, healthy men and women. Eur. J. Clin. Nutr. 2005, 59, 695–702. [Google Scholar] [CrossRef] [PubMed]
- Hume, P.; Marfell-Jones, M. The importance of accurate site location for skinfold measurement. J. Sports Sci. 2008, 26, 1333–1340. [Google Scholar] [CrossRef] [PubMed]
- Oppliger, R.A.; Nielsen, D.H.; Shetler, A.C.; Crowley, E.T.; Albright, J.P. Body composition of collegiate football players: Bioelectrical impedance and skinfolds compared to hydrostatic weighing. J. Orthop. Sports Phys. Ther. 1992, 15, 187–192. [Google Scholar] [CrossRef] [PubMed]
- Paoli, A.; Pacelli, F.; Bargossi, A.M.; Marcolin, G.; Guzzinati, S.; Neri, M.; Bianco, A.; Palma, A. Effects of three distinct protocols of fitness training on body composition, strength and blood lactate. J. Sports Med. Phys. Fit. 2010, 50, 43–51. [Google Scholar]
- Lohman, T.G.; Roche, A.F.; Martorell, R. Anthropometric Standardization Reference Manual; Human Kinetics Books: Champaign, IL, USA, 1991. [Google Scholar]
- Heyward, V. Asep methods recommendation: Body composition assessment. J. Exerc. Physiol. 2001, 4, 1–12. [Google Scholar]
- Paoli, A.; Pacelli, Q.F.; Toniolo, L.; Miotti, D.; Reggiani, C. Latissimus dorsi fine needle muscle biopsy: A novel and efficient approach to study proximal muscles of upper limbs. J. Surg. Res. 2010, 164, e257–e263. [Google Scholar] [CrossRef] [PubMed]
- Toniolo, L.; Maccatrozzo, L.; Patruno, M.; Pavan, E.; Caliaro, F.; Rossi, R.; Rinaldi, C.; Canepari, M.; Reggiani, C.; Mascarello, F. Fiber types in canine muscles: Myosin isoform expression and functional characterization. Am. J. Physiol. Cell Physiol. 2007, 292, C1915–C1926. [Google Scholar] [CrossRef] [PubMed]
- Doria, C.; Toniolo, L.; Verratti, V.; Cancellara, P.; Pietrangelo, T.; Marconi, V.; Paoli, A.; Pogliaghi, S.; Fano, G.; Reggiani, C.; et al. Improved VO2 uptake kinetics and shift in muscle fiber type in high-altitude trekkers. J. Appl. Physiol. 2011, 111, 1597–1605. [Google Scholar] [CrossRef] [PubMed]
- Talmadge, R.J.; Roy, R.R. Electrophoretic separation of rat skeletal muscle myosin heavy-chain isoforms. J. Appl. Physiol. 1993, 75, 2337–2340. [Google Scholar] [PubMed]
- Mantilla, C.B.; Sill, R.V.; Aravamudan, B.; Zhan, W.Z.; Sieck, G.C. Developmental effects on myonuclear domain size of rat diaphragm fibers. J. Appl. Physiol. 2008, 104, 787–794. [Google Scholar] [CrossRef] [PubMed]
- Liu, J.X.; Hoglund, A.S.; Karlsson, P.; Lindblad, J.; Qaisar, R.; Aare, S.; Bengtsson, E.; Larsson, L. Myonuclear domain size and myosin isoform expression in muscle fibres from mammals representing a 100,000-fold difference in body size. Exp. Physiol. 2009, 94, 117–129. [Google Scholar] [CrossRef] [PubMed]
- Tawil, R.; Van Der Maarel, S.M. Facioscapulohumeral muscular dystrophy. Muscle Nerve 2006, 34, 1–15. [Google Scholar] [CrossRef] [PubMed]
- Mitsuhashi, S.; Kang, P.B. Update on the genetics of limb girdle muscular dystrophy. Semin. Pediatr. Neurol. 2012, 19, 211–218. [Google Scholar] [CrossRef] [PubMed]
- Baker, S.J.; Hardy, L. Effects of high intensity canoeing training on fibre area and fibre type in the latissimus dorsi muscle. Br. J. Sports Med. 1989, 23, 23–26. [Google Scholar] [CrossRef] [PubMed]
- Scelsi, R.; Poggi, P.; Lo Russo, R.; de Fabritiis, F. Effect of preoperative training on latissimus dorsi muscle for cardiomyoplasty. A morphometric study. In Vivo (Athens, Greece) 1993, 7, 353–355. [Google Scholar]
- Cannon, J.; Marino, F.E. Early-phase neuromuscular adaptations to high- and low-volume resistance training in untrained young and older women. J. Sports Sci. 2010, 28, 1505–1514. [Google Scholar] [CrossRef] [PubMed]
- Shoepe, T.C.; Stelzer, J.E.; Garner, D.P.; Widrick, J.J. Functional adaptability of muscle fibers to long-term resistance exercise. Med. Sci. Sports Exerc. 2003, 35, 944–951. [Google Scholar] [CrossRef] [PubMed]
- Widrick, J.J.; Stelzer, J.E.; Shoepe, T.C.; Garner, D.P. Functional properties of human muscle fibers after short-term resistance exercise training. Am. J. Physiol. Regul. Integr. Comp. Physiol. 2002, 283, R408–R416. [Google Scholar] [CrossRef] [PubMed]
- Pansarasa, O.; Rinaldi, C.; Parente, V.; Miotti, D.; Capodaglio, P.; Bottinelli, R. Resistance training of long duration modulates force and unloaded shortening velocity of single muscle fibres of young women. J. Electromyogr. Kinesiol. 2009, 19, e290–300. [Google Scholar] [CrossRef] [PubMed]
- Canepari, M.; Rossi, R.; Pellegrino, M.A.; Orrell, R.W.; Cobbold, M.; Harridge, S.; Bottinelli, R. Effects of resistance training on myosin function studied by the in vitro motility assay in young and older men. J. Appl. Physiol. 2005, 98, 2390–2395. [Google Scholar] [CrossRef] [PubMed]
- Parente, V.; D’Antona, G.; Adami, R.; Miotti, D.; Capodaglio, P.; de Vito, G.; Bottinelli, R. Long-term resistance training improves force and unloaded shortening velocity of single muscle fibres of elderly women. Eur. J. Appl. Physiol. 2008, 104, 885–893. [Google Scholar] [CrossRef] [PubMed]
- Verdijk, L.B.; Jonkers, R.A.; Gleeson, B.G.; Beelen, M.; Meijer, K.; Savelberg, H.H.; Wodzig, W.K.; Dendale, P.; van Loon, L.J. Protein supplementation before and after exercise does not further augment skeletal muscle hypertrophy after resistance training in elderly men. Am. J. Clin. Nutr. 2009, 89, 608–616. [Google Scholar] [CrossRef] [PubMed]
- Boone, C.H.; Stout, J.R.; Beyer, K.S.; Fukuda, D.H.; Hoffman, J.R. Muscle strength and hypertrophy occur independently of protein supplementation during short-term resistance training in untrained men. Appl. Physiol. Nutr. Metab. 2015, 1–6. [Google Scholar] [CrossRef] [PubMed]
- Andersen, L.L.; Tufekovic, G.; Zebis, M.K.; Crameri, R.M.; Verlaan, G.; Kjaer, M.; Suetta, C.; Magnusson, P.; Aagaard, P. The effect of resistance training combined with timed ingestion of protein on muscle fiber size and muscle strength. Metabolism 2005, 54, 151–156. [Google Scholar] [CrossRef] [PubMed]
- Willoughby, D.S.; Stout, J.R.; Wilborn, C.D. Effects of resistance training and protein plus amino acid supplementation on muscle anabolism, mass, and strength. Amino Acids 2007, 32, 467–477. [Google Scholar] [CrossRef] [PubMed]
- Hulmi, J.J.; Kovanen, V.; Selanne, H.; Kraemer, W.J.; Hakkinen, K.; Mero, A.A. Acute and long-term effects of resistance exercise with or without protein ingestion on muscle hypertrophy and gene expression. Amino Acids 2009, 37, 297–308. [Google Scholar] [CrossRef] [PubMed]
- Sandri, M.; Barberi, L.; Bijlsma, A.Y.; Blaauw, B.; Dyar, K.A.; Milan, G.; Mammucari, C.; Meskers, C.G.M.; Pallafacchina, G.; Paoli, A.; et al. Signalling pathways regulating muscle mass in ageing skeletal muscle. The role of the igf1-akt-mtor-foxo pathway. Biogerontology 2013, 14, 303–323. [Google Scholar] [CrossRef] [PubMed]
- Bird, S.P.; Tarpenning, K.M.; Marino, F.E. Independent and combined effects of liquid carbohydrate/essential amino acid ingestion on hormonal and muscular adaptations following resistance training in untrained men. Eur. J. Appl. Physiol. 2006, 97, 225–238. [Google Scholar] [CrossRef] [PubMed]
- Kerksick, C.M.; Rasmussen, C.J.; Lancaster, S.L.; Magu, B.; Smith, P.; Melton, C.; Greenwood, M.; Almada, A.L.; Earnest, C.P.; Kreider, R.B. The effects of protein and amino acid supplementation on performance and training adaptations during ten weeks of resistance training. J. Strength Cond. Res. Natl. Strength Cond. Assoc. 2006, 20, 643–653. [Google Scholar] [CrossRef]
- Candow, D.G.; Chilibeck, P.D.; Facci, M.; Abeysekara, S.; Zello, G.A. Protein supplementation before and after resistance training in older men. Eur. J. Appl. Physiol. 2006, 97, 548–556. [Google Scholar] [CrossRef] [PubMed]
- Wilborn, C.D.; Willoughby, D.S. The role of dietary protein intake and resistance training on Myosin heavy chain expression. J. Int. Soc. Sports Nutr. 2004, 31, 27–34. [Google Scholar] [CrossRef] [PubMed]
- Brodsky, I.G.; Suzara, D.; Hornberger, T.A.; Goldspink, P.; Yarasheski, K.E.; Smith, S.; Kukowski, J.; Esser, K.; Bedno, S. Isoenergetic dietary protein restriction decreases myosin heavy chain IIx fraction and myosin heavy chain production in humans. J. Nutr. 2004, 134, 328–334. [Google Scholar] [PubMed]
- Pellegrino, M.A.; Brocca, L.; Dioguardi, F.; Bottinelli, R.; D’Antona, G. Effects of voluntary wheel running and amino acid supplementation on skeletal muscle of mice. Eur. J. Appl. Physiol. 2005, 93, 655–664. [Google Scholar] [CrossRef] [PubMed]
- Bottinelli, R.; Reggiani, C. Human skeletal muscle fibres: Molecular and functional diversity. Prog. Biophys. Mol. Biol. 2000, 73, 195–262. [Google Scholar] [CrossRef]


| Total Daily Calories Kcal | HP | NP |
|---|---|---|
| 2226.5 ± 60.2 | 2207.5 ± 41.7 | |
| CHO g | 261.6 ± 7.1 | 333.7 ± 6.3 |
| FAT g | 61.8 ± 1.7 | 61.3 ± 1.2 |
| PRO g | 155.9 ± 4.2 | 80.1 ± 6.2 |
| CHO kcal | 1046.4 ± 28.3 | 1335.1 ± 25.1 |
| FAT kcal | 556.6 ± 15 | 551.7 ± 10.7 |
| PRO kcal | 623.4 ± 16.7 | 320.2 ± 25.1 |
| CHO % | 47 ± 2 | 62 ± 3 |
| FAT % | 25 ± 1 | 25 ± 2 |
| PRO % | 28 ± 1 | 13 ± 1 |
| Variable | Pre | Post | Significance |
|---|---|---|---|
| Total body FM Kg | 12.46 ± 5.62 | 12.54 ± 4.47 | n.s. |
| Total body MM Kg | 33.77 ± 6.23 | 35.5 ± 6.67 | p = 0.0003 |
| Upper limb MA cm2 | 45.13 ± 3.3 | 47.94 ± 4.4 | p = 0.024 |
© 2016 by the authors; licensee MDPI, Basel, Switzerland. This article is an open access article distributed under the terms and conditions of the Creative Commons Attribution (CC-BY) license (http://creativecommons.org/licenses/by/4.0/).
Share and Cite
Paoli, A.; Pacelli, Q.F.; Cancellara, P.; Toniolo, L.; Moro, T.; Canato, M.; Miotti, D.; Neri, M.; Morra, A.; Quadrelli, M.; et al. Protein Supplementation Does Not Further Increase Latissimus Dorsi Muscle Fiber Hypertrophy after Eight Weeks of Resistance Training in Novice Subjects, but Partially Counteracts the Fast-to-Slow Muscle Fiber Transition. Nutrients 2016, 8, 331. https://doi.org/10.3390/nu8060331
Paoli A, Pacelli QF, Cancellara P, Toniolo L, Moro T, Canato M, Miotti D, Neri M, Morra A, Quadrelli M, et al. Protein Supplementation Does Not Further Increase Latissimus Dorsi Muscle Fiber Hypertrophy after Eight Weeks of Resistance Training in Novice Subjects, but Partially Counteracts the Fast-to-Slow Muscle Fiber Transition. Nutrients. 2016; 8(6):331. https://doi.org/10.3390/nu8060331
Chicago/Turabian StylePaoli, Antonio, Quirico F. Pacelli, Pasqua Cancellara, Luana Toniolo, Tatiana Moro, Marta Canato, Danilo Miotti, Marco Neri, Aldo Morra, Marco Quadrelli, and et al. 2016. "Protein Supplementation Does Not Further Increase Latissimus Dorsi Muscle Fiber Hypertrophy after Eight Weeks of Resistance Training in Novice Subjects, but Partially Counteracts the Fast-to-Slow Muscle Fiber Transition" Nutrients 8, no. 6: 331. https://doi.org/10.3390/nu8060331
APA StylePaoli, A., Pacelli, Q. F., Cancellara, P., Toniolo, L., Moro, T., Canato, M., Miotti, D., Neri, M., Morra, A., Quadrelli, M., & Reggiani, C. (2016). Protein Supplementation Does Not Further Increase Latissimus Dorsi Muscle Fiber Hypertrophy after Eight Weeks of Resistance Training in Novice Subjects, but Partially Counteracts the Fast-to-Slow Muscle Fiber Transition. Nutrients, 8(6), 331. https://doi.org/10.3390/nu8060331