Dietary Protein Sources and Incidence of Breast Cancer: A Dose-Response Meta-Analysis of Prospective Studies


Abstract
:1. Introduction
2. Materials and Methods
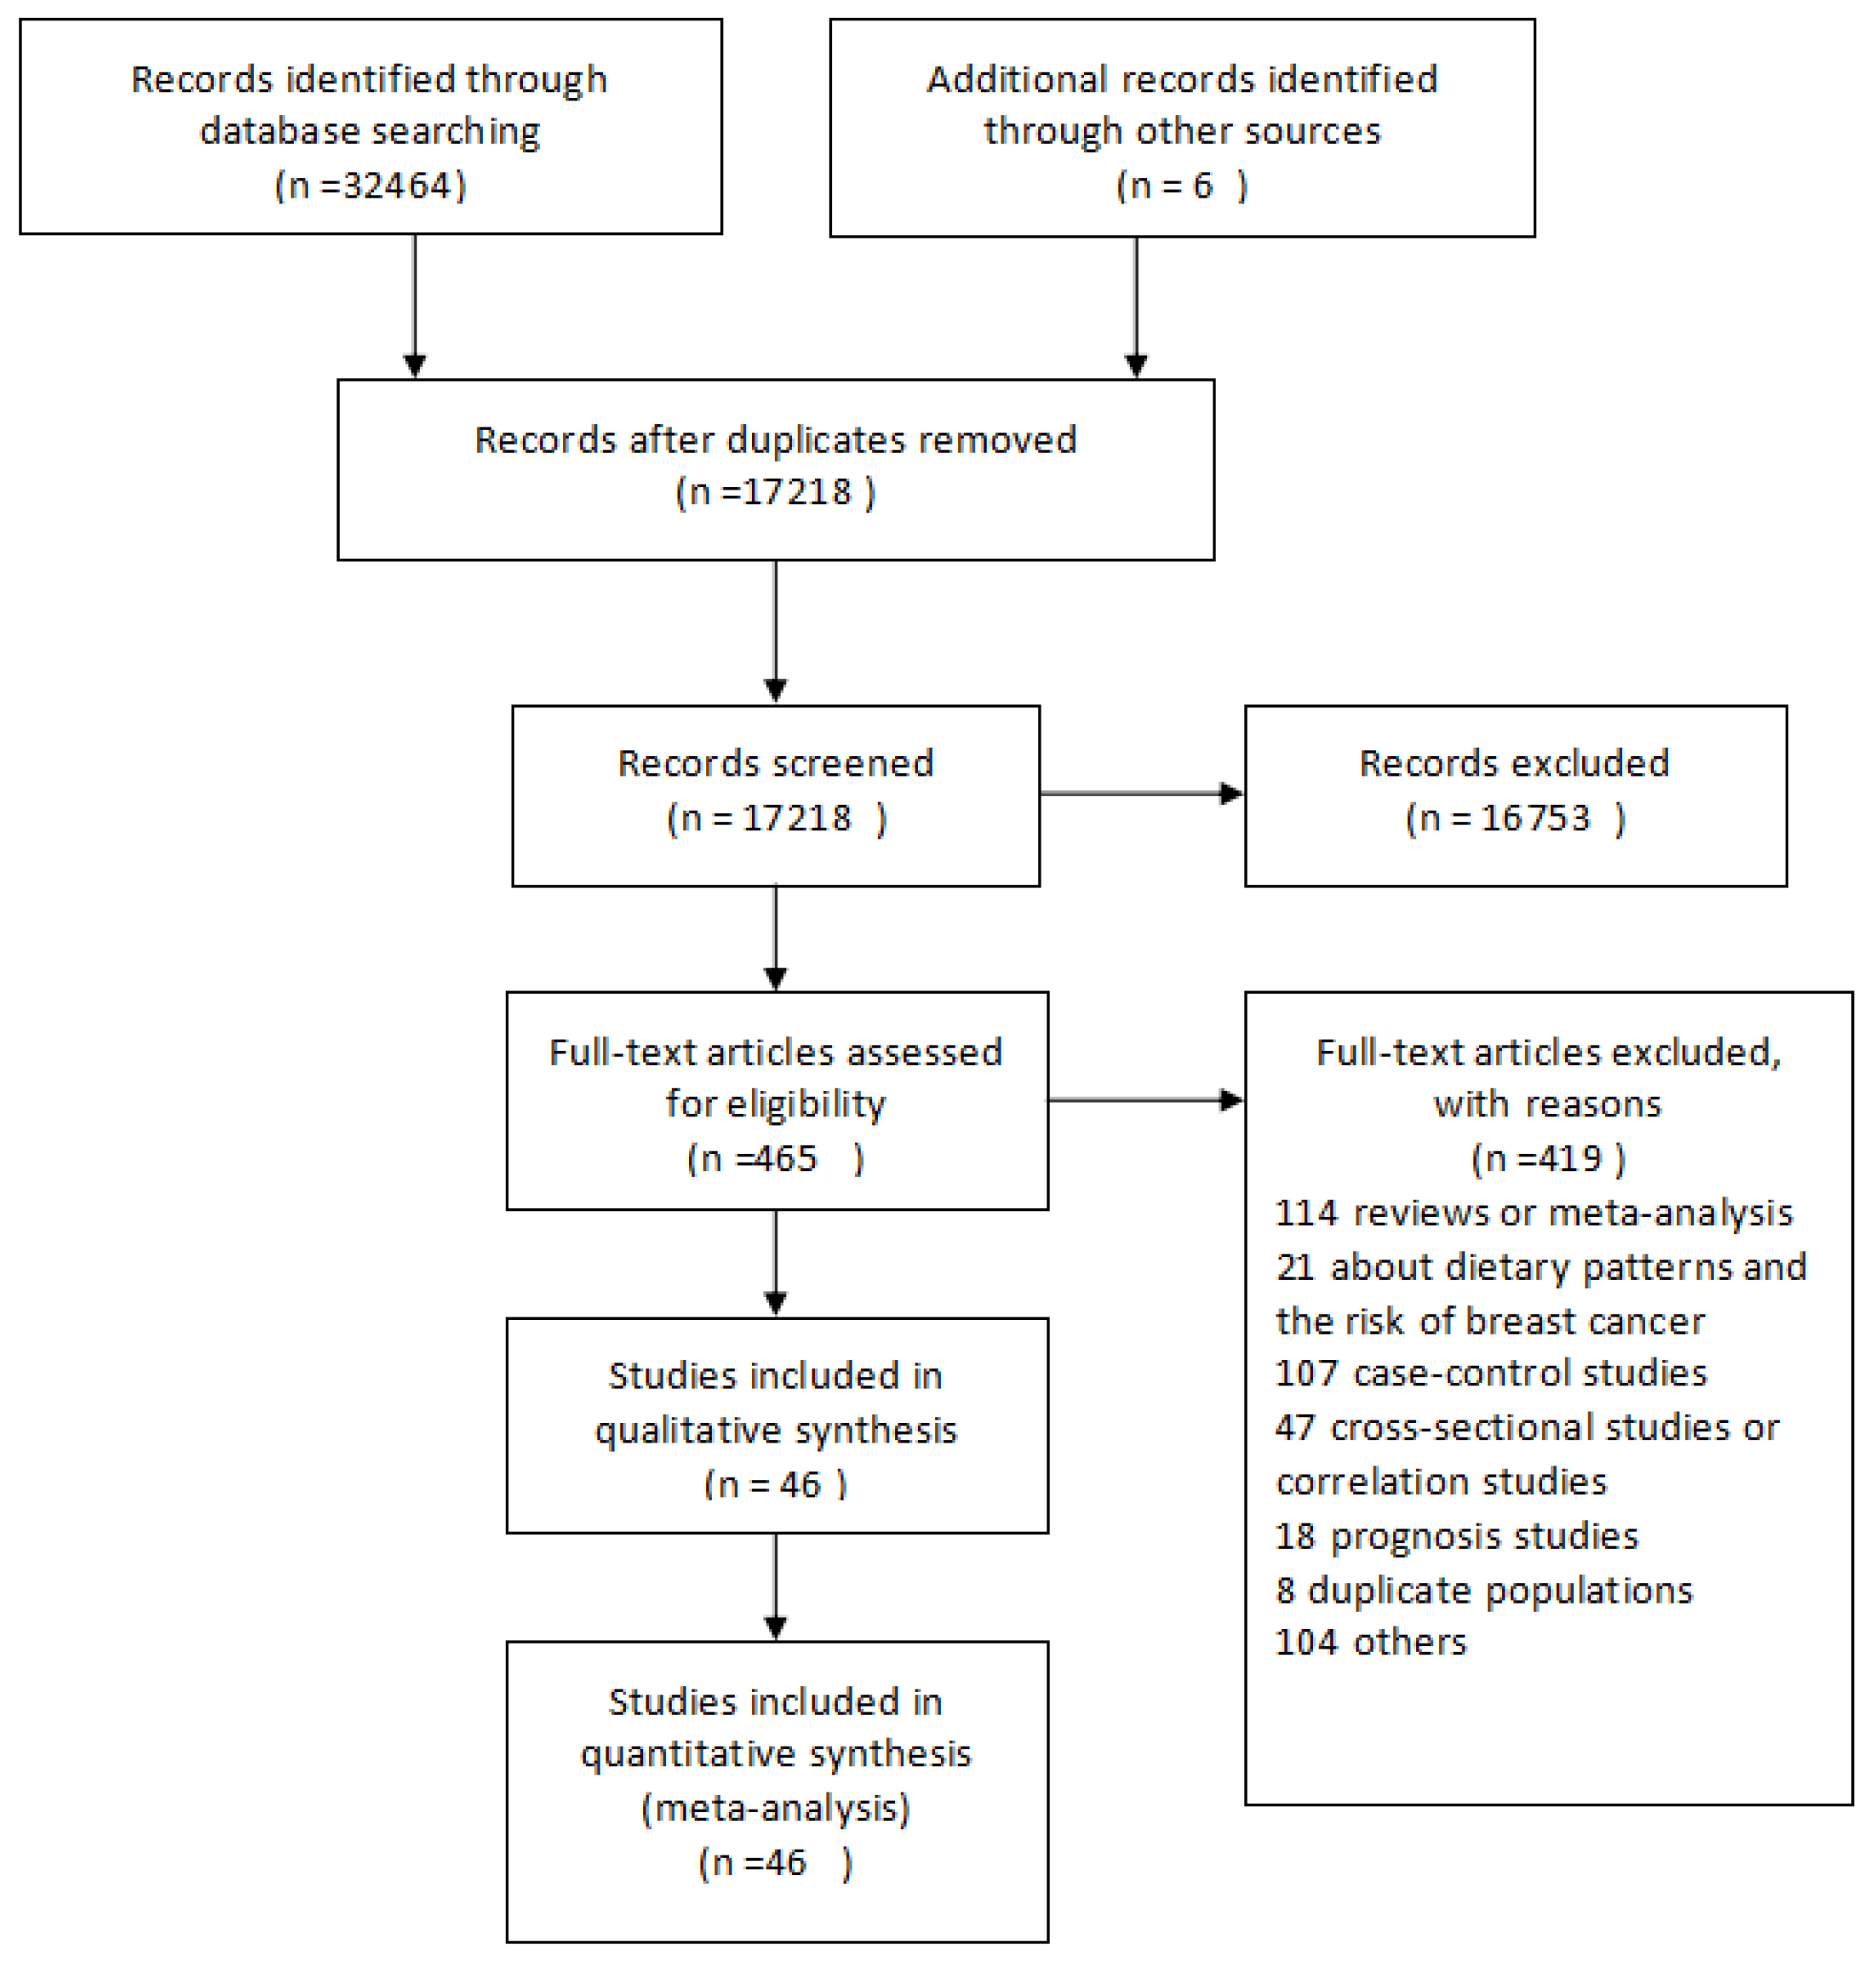
2.1. Search Strategy and Selection Criteria
2.2. Data Extraction
2.3. Statistical Analysis
3. Results
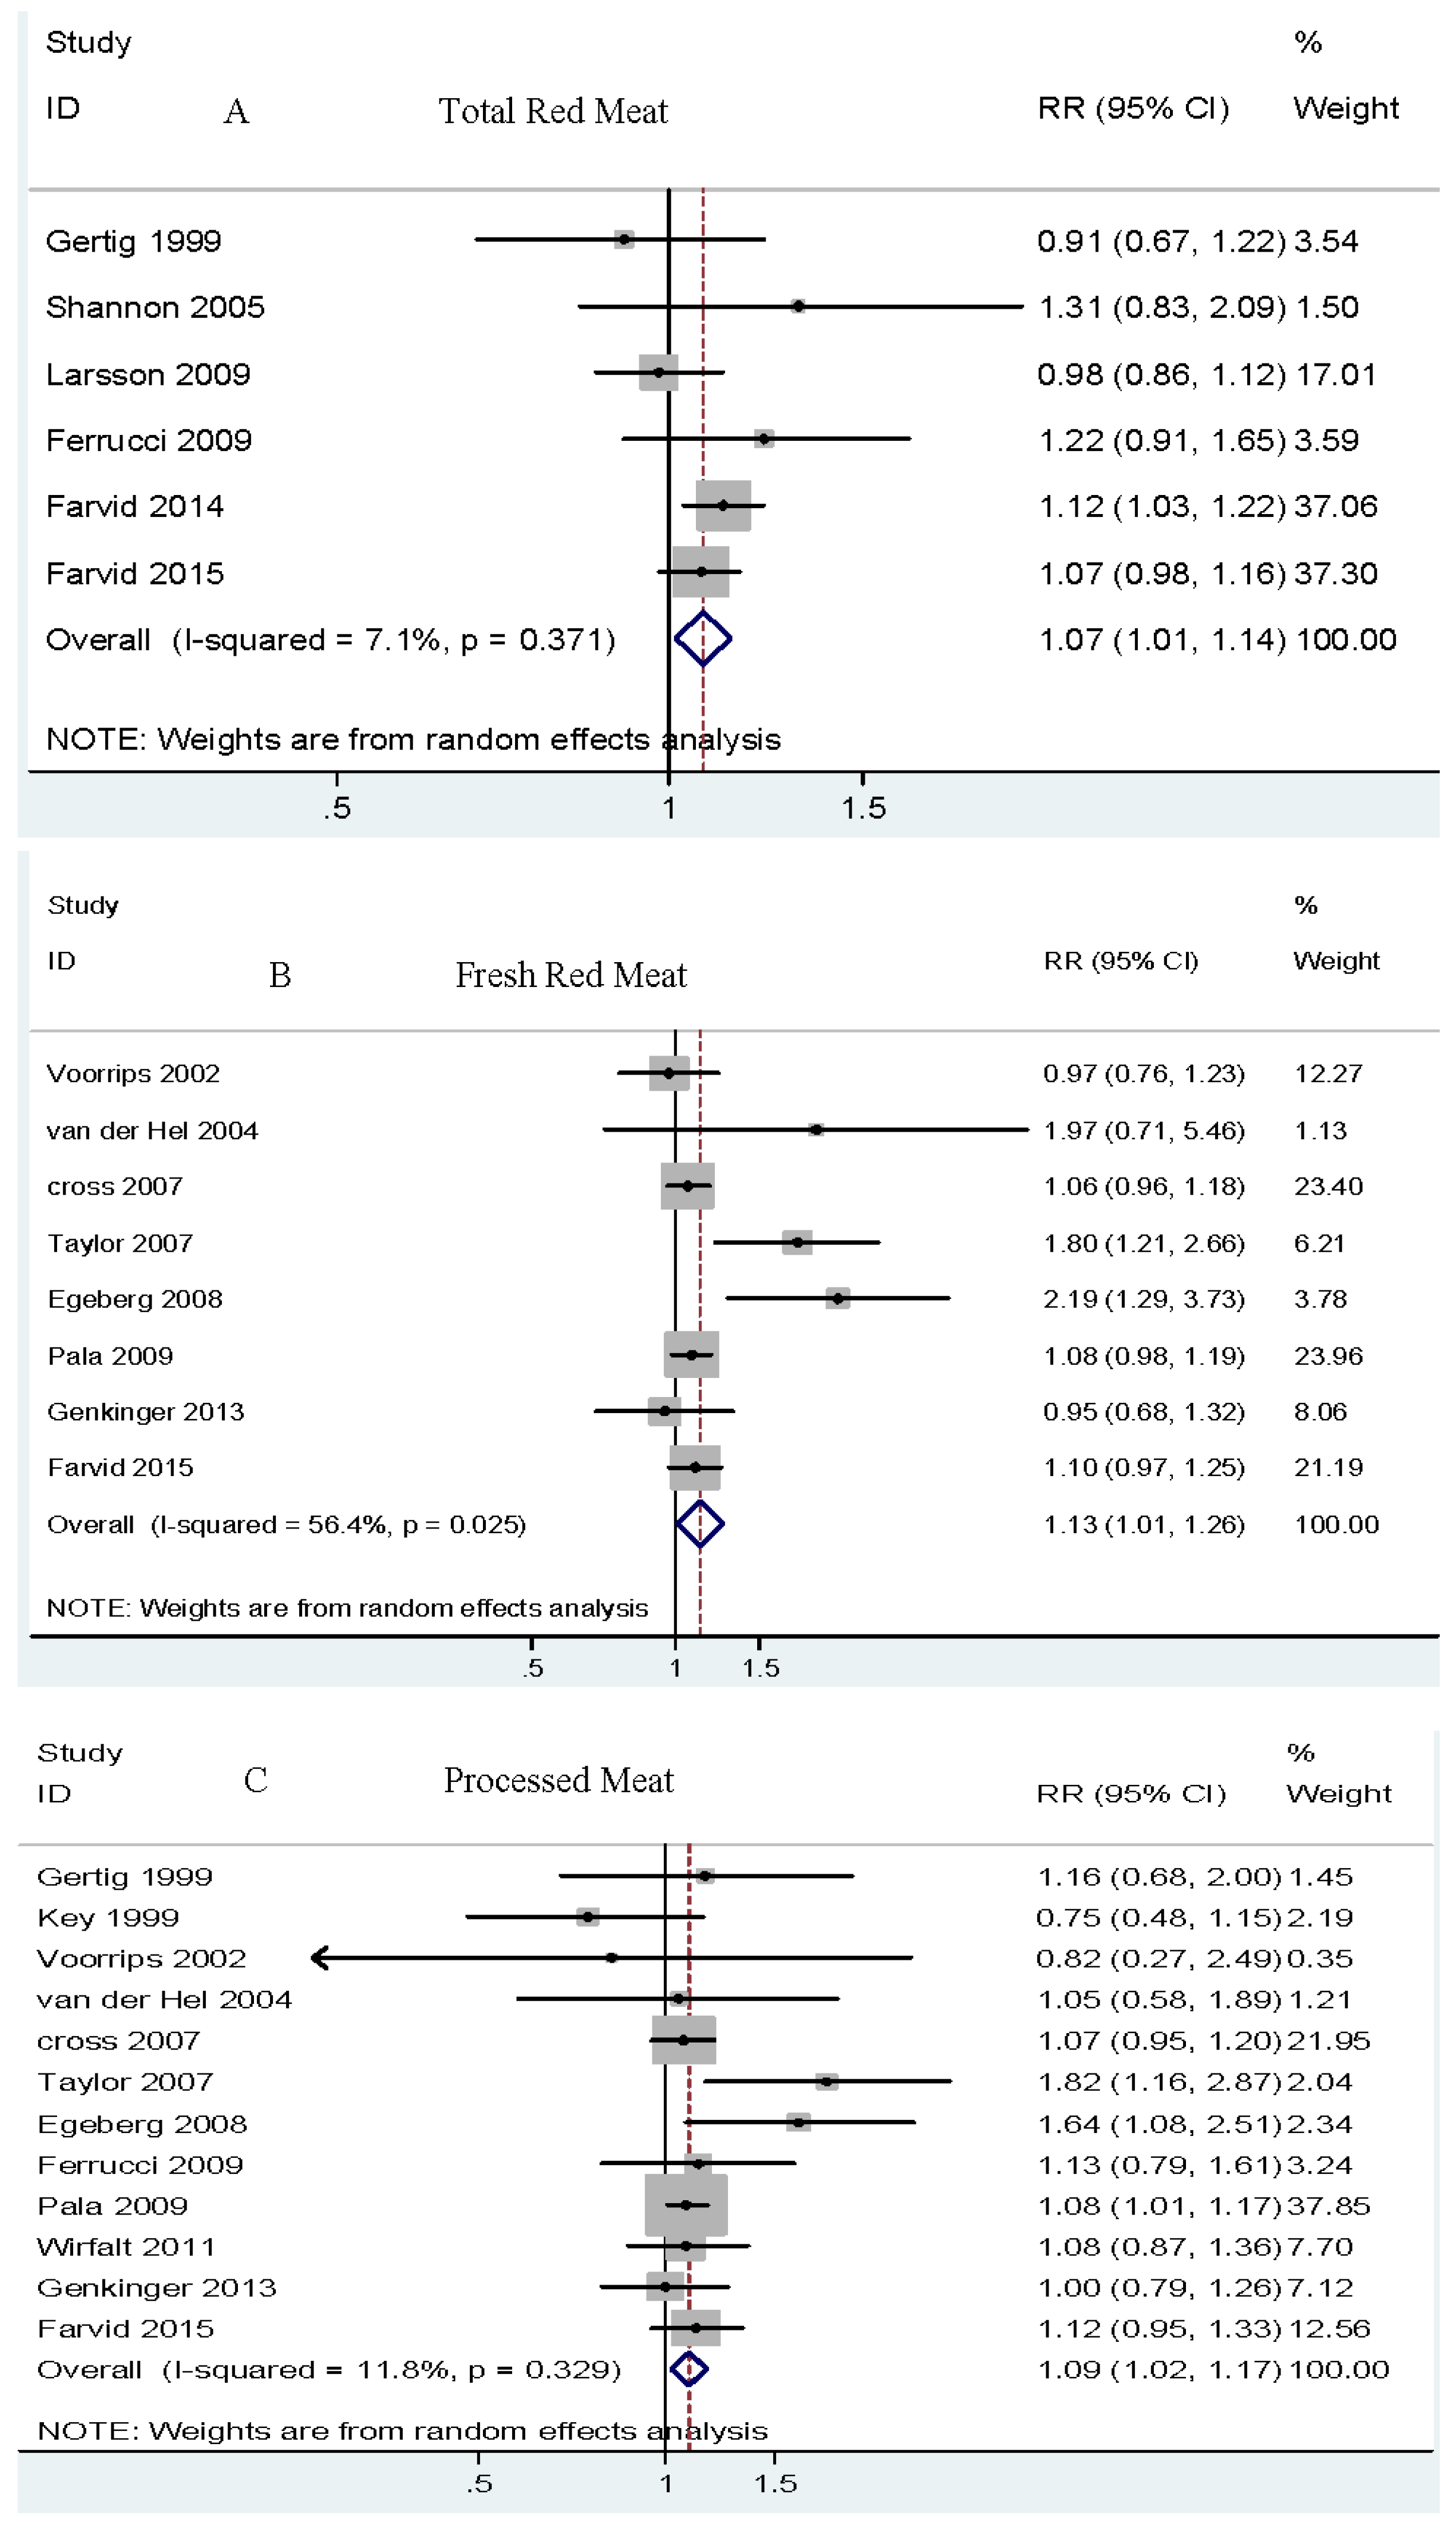
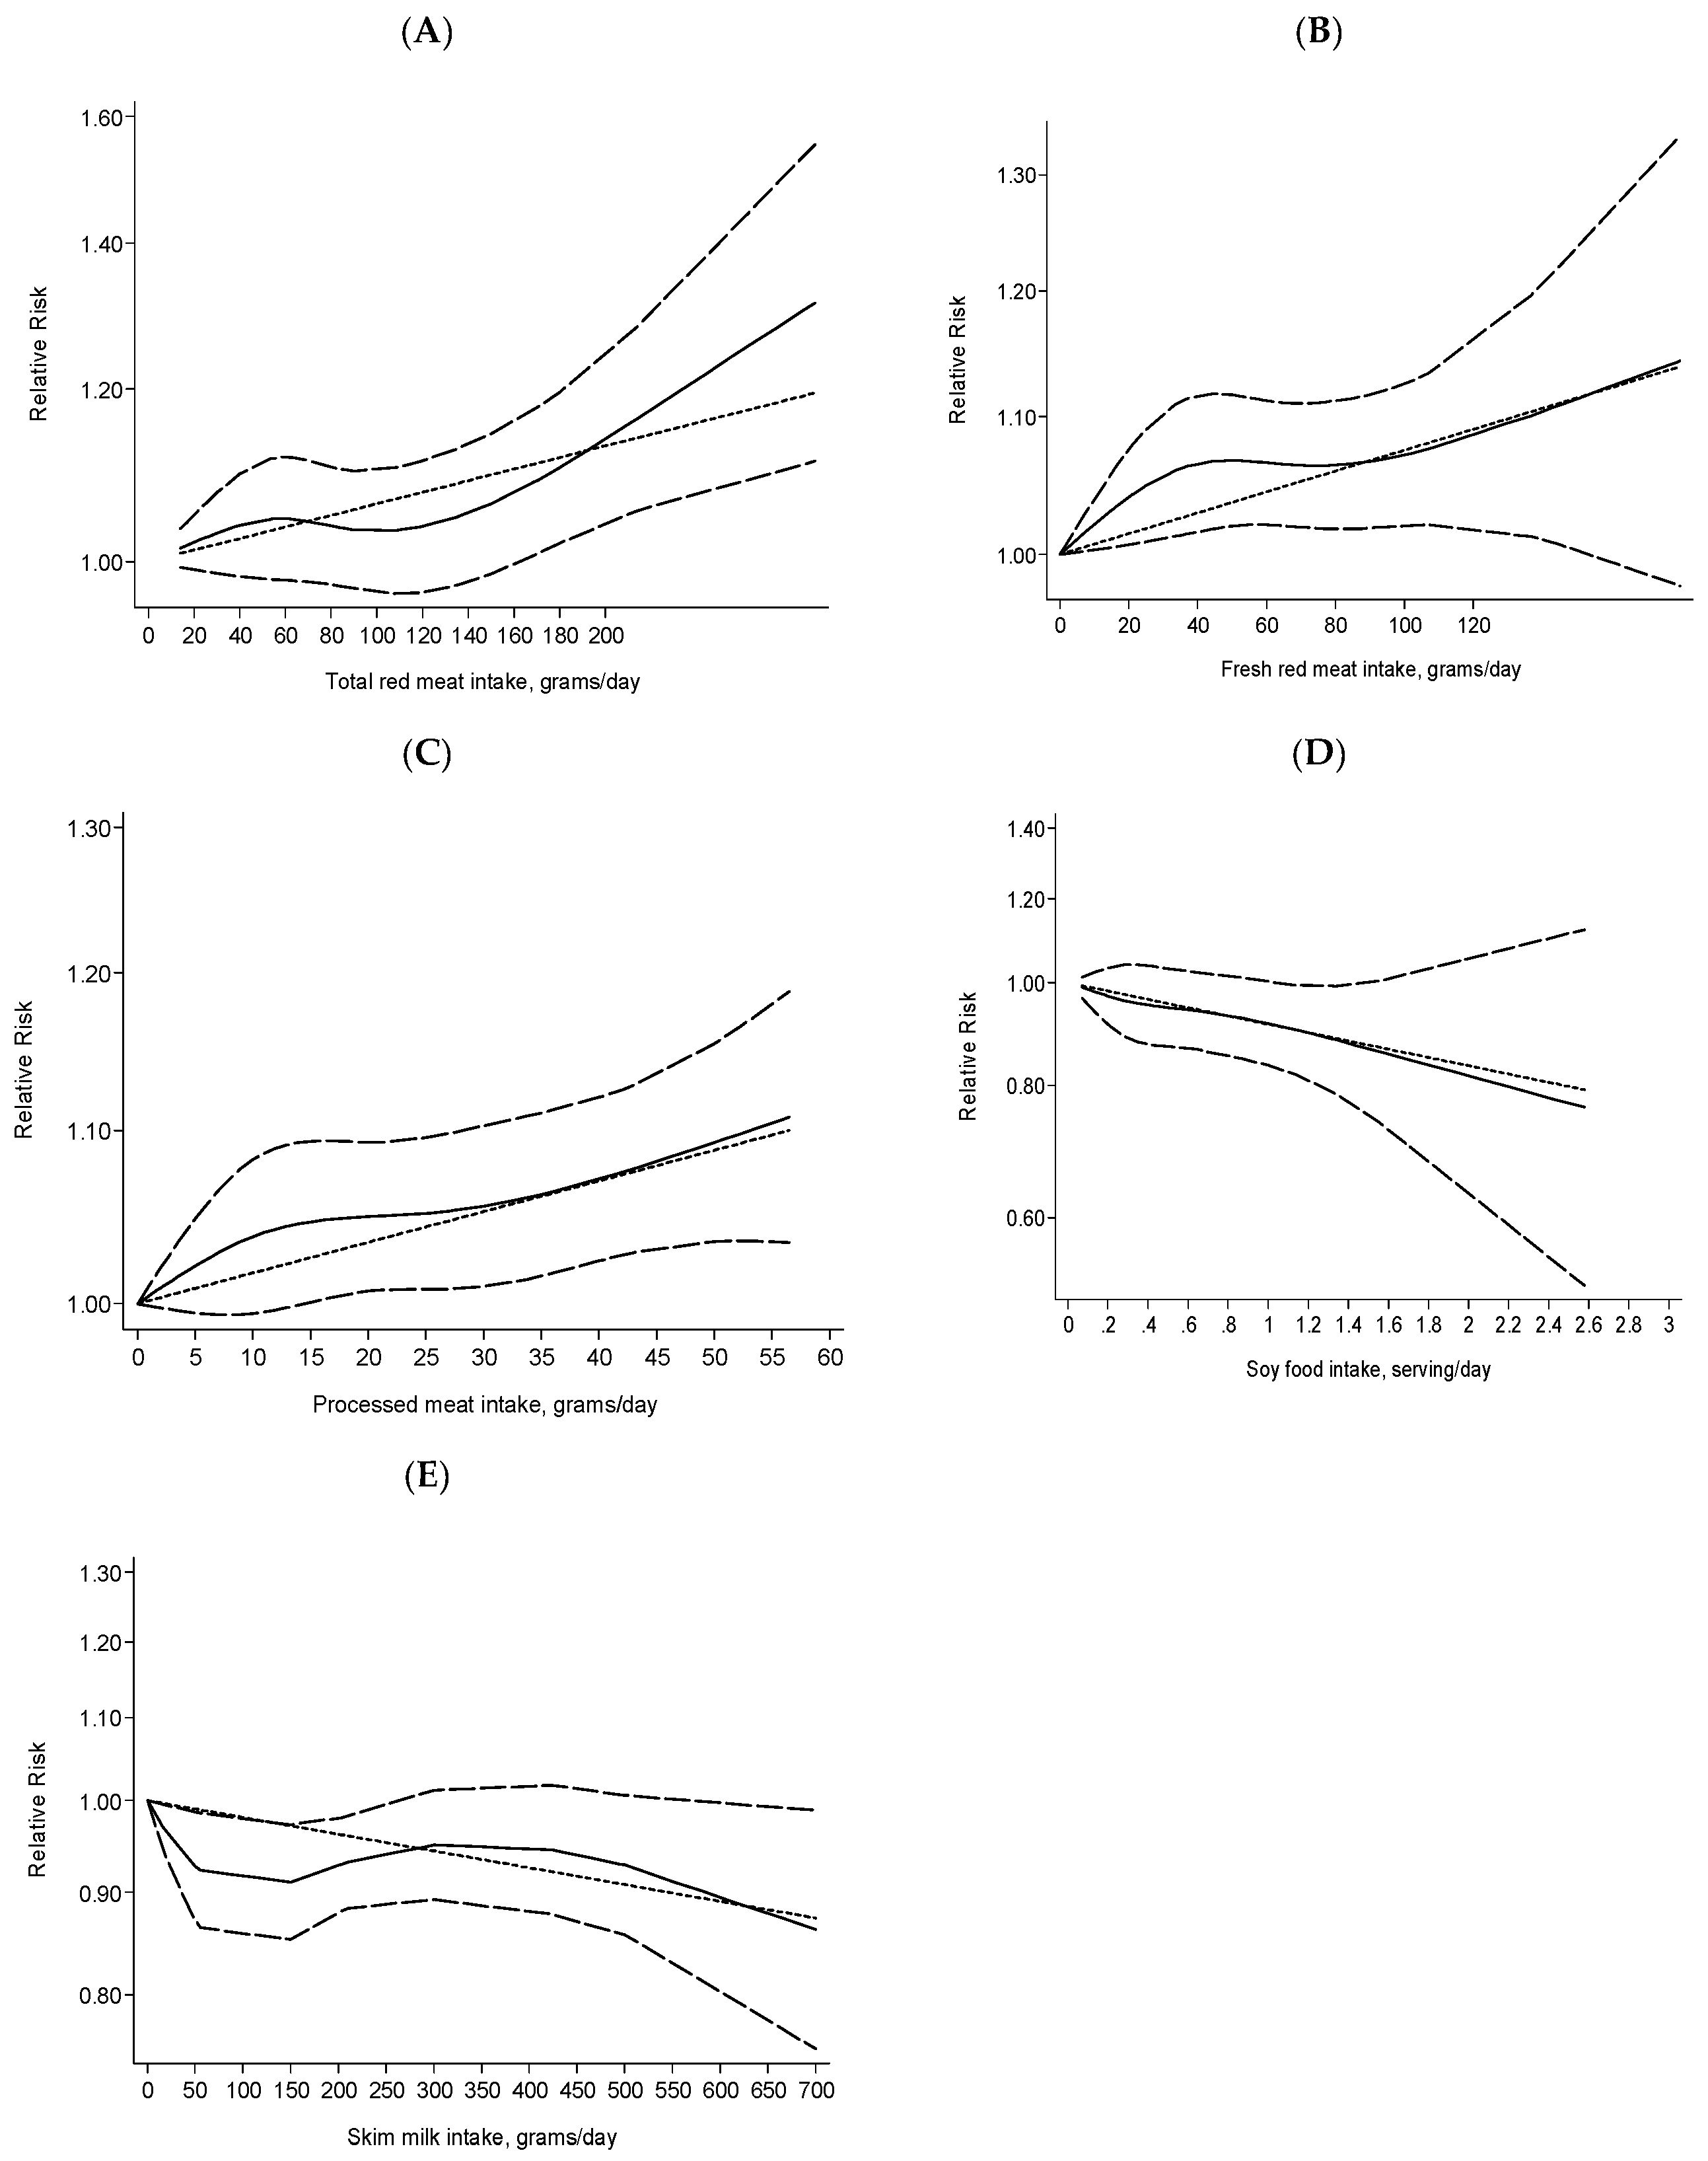
3.1. Total Red Meat (Fresh Red Meat and Processed Meats) and Risk of Breast Cancer
3.2. Fresh Red Meat and Risk of Breast Cancer
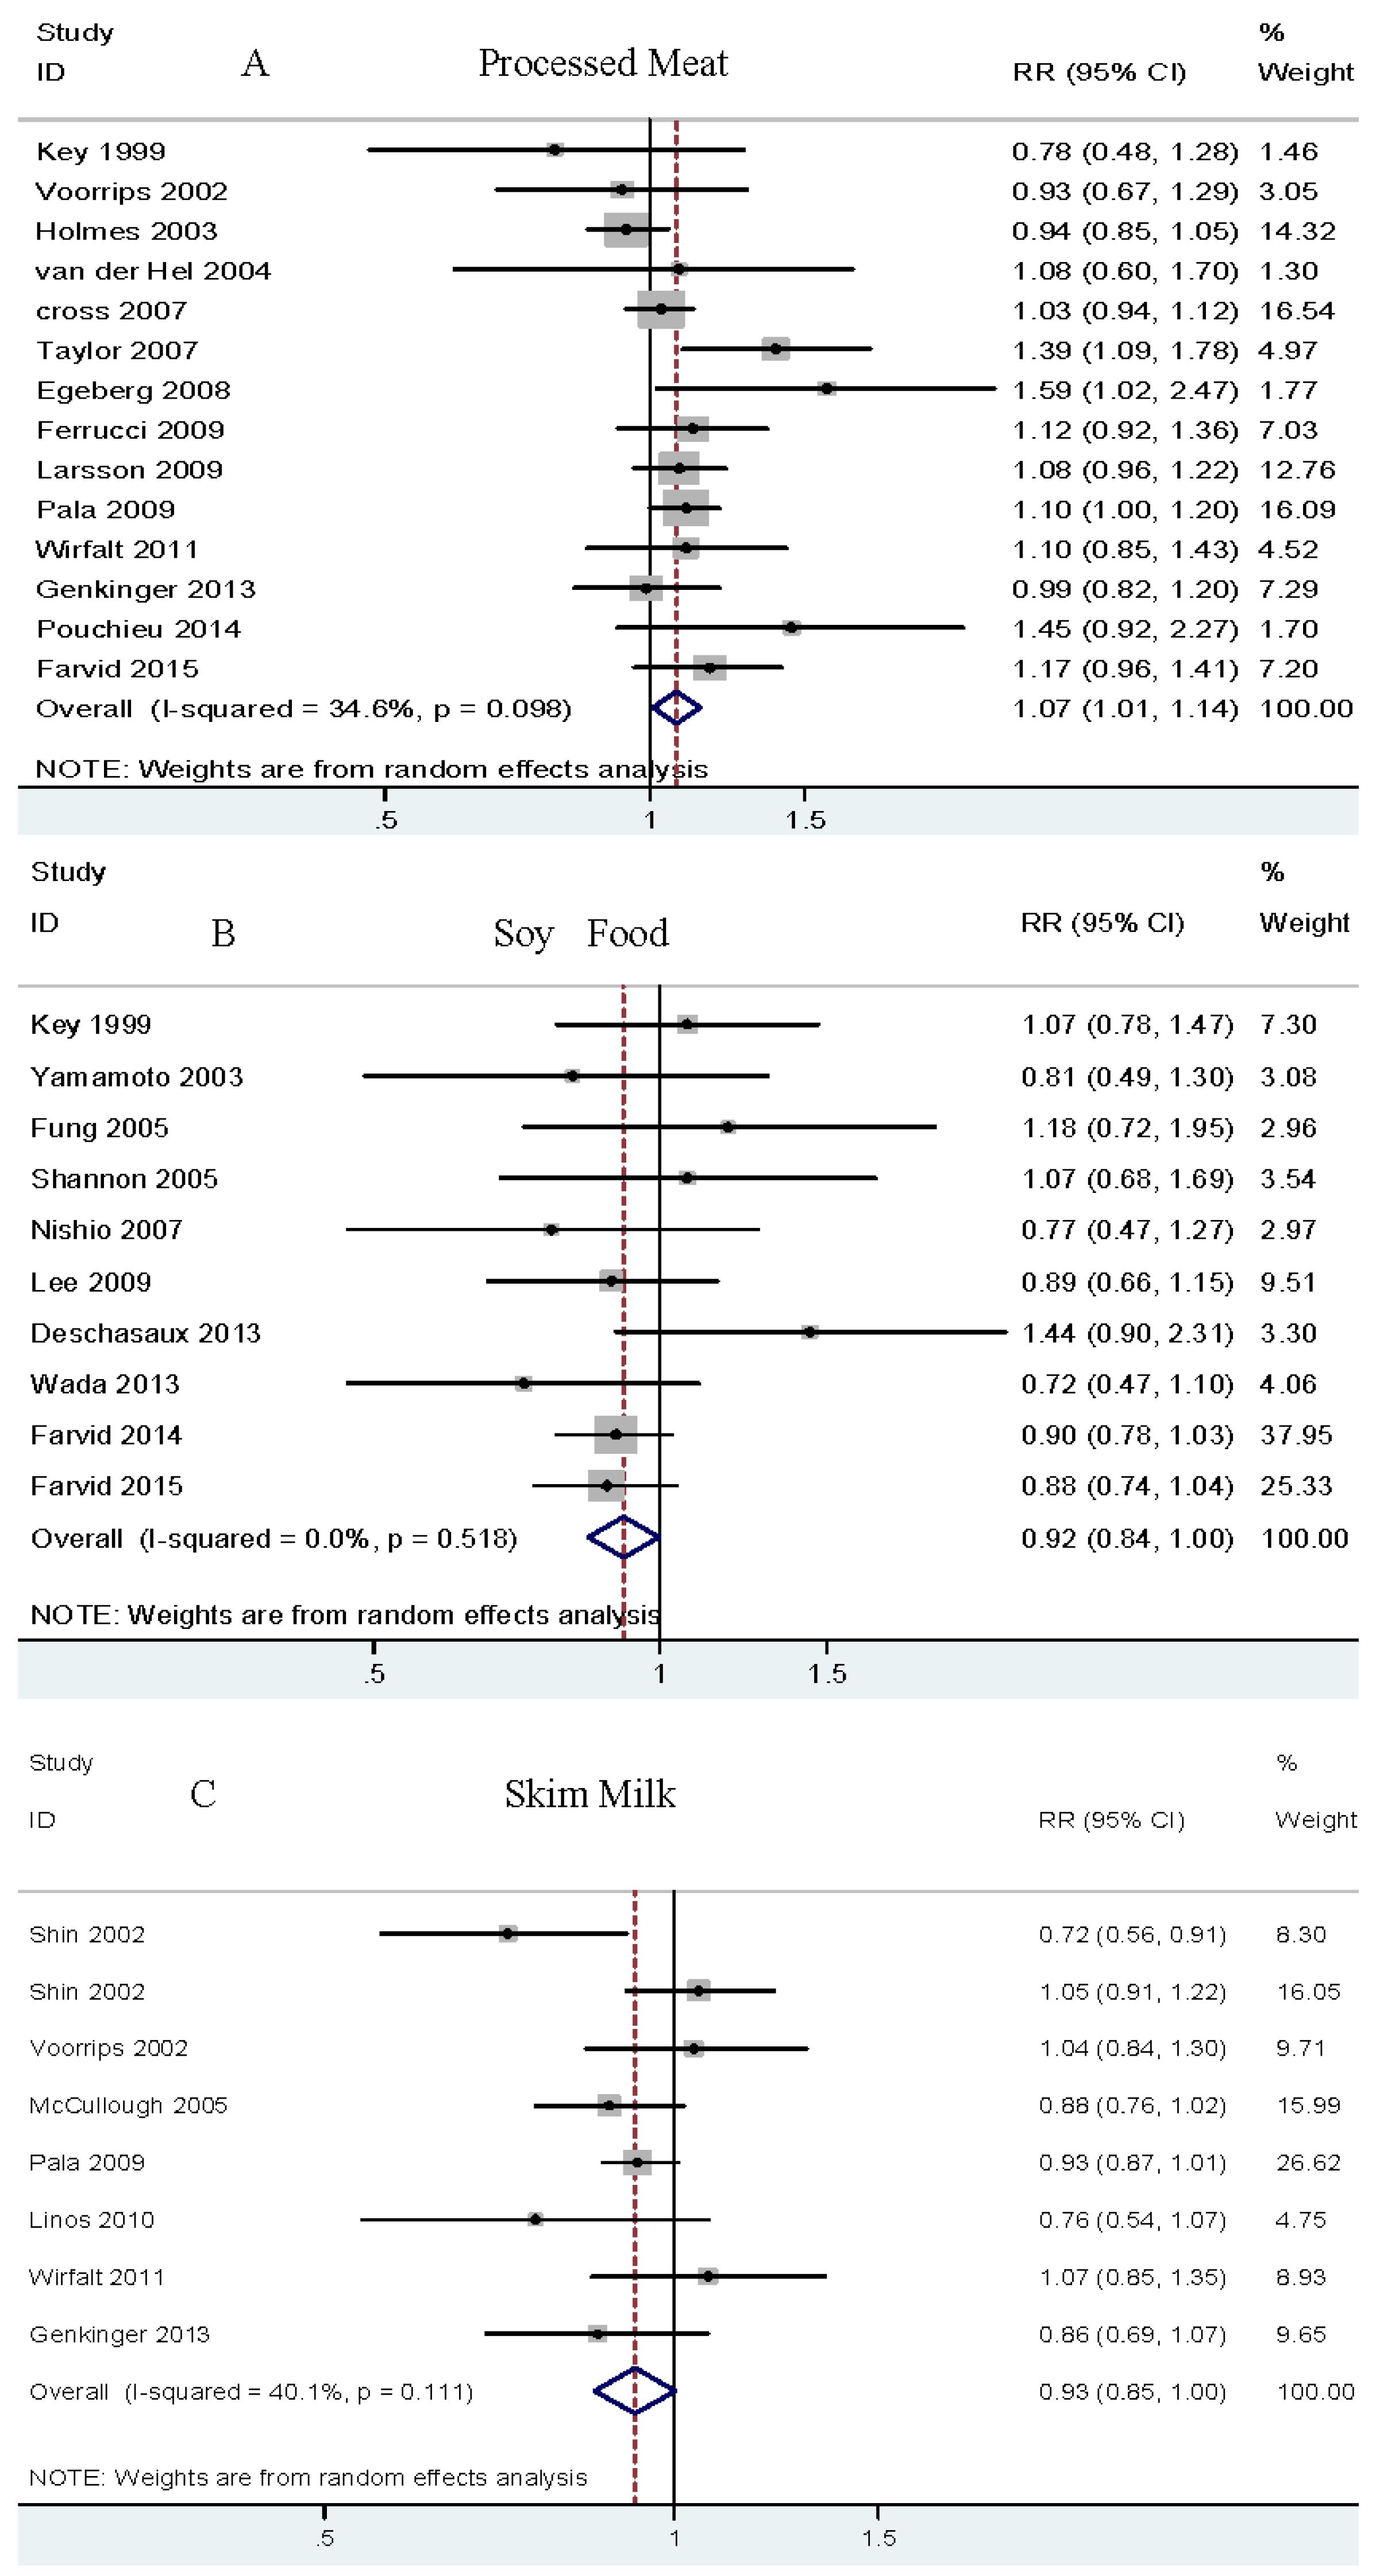
3.3. Processed Meat and Risk of Breast Cancer
3.4. Poultry and Risk of Breast Cancer
3.5. Fish and Risk of Breast Cancer
3.6. Egg and Risk of Breast Cancer
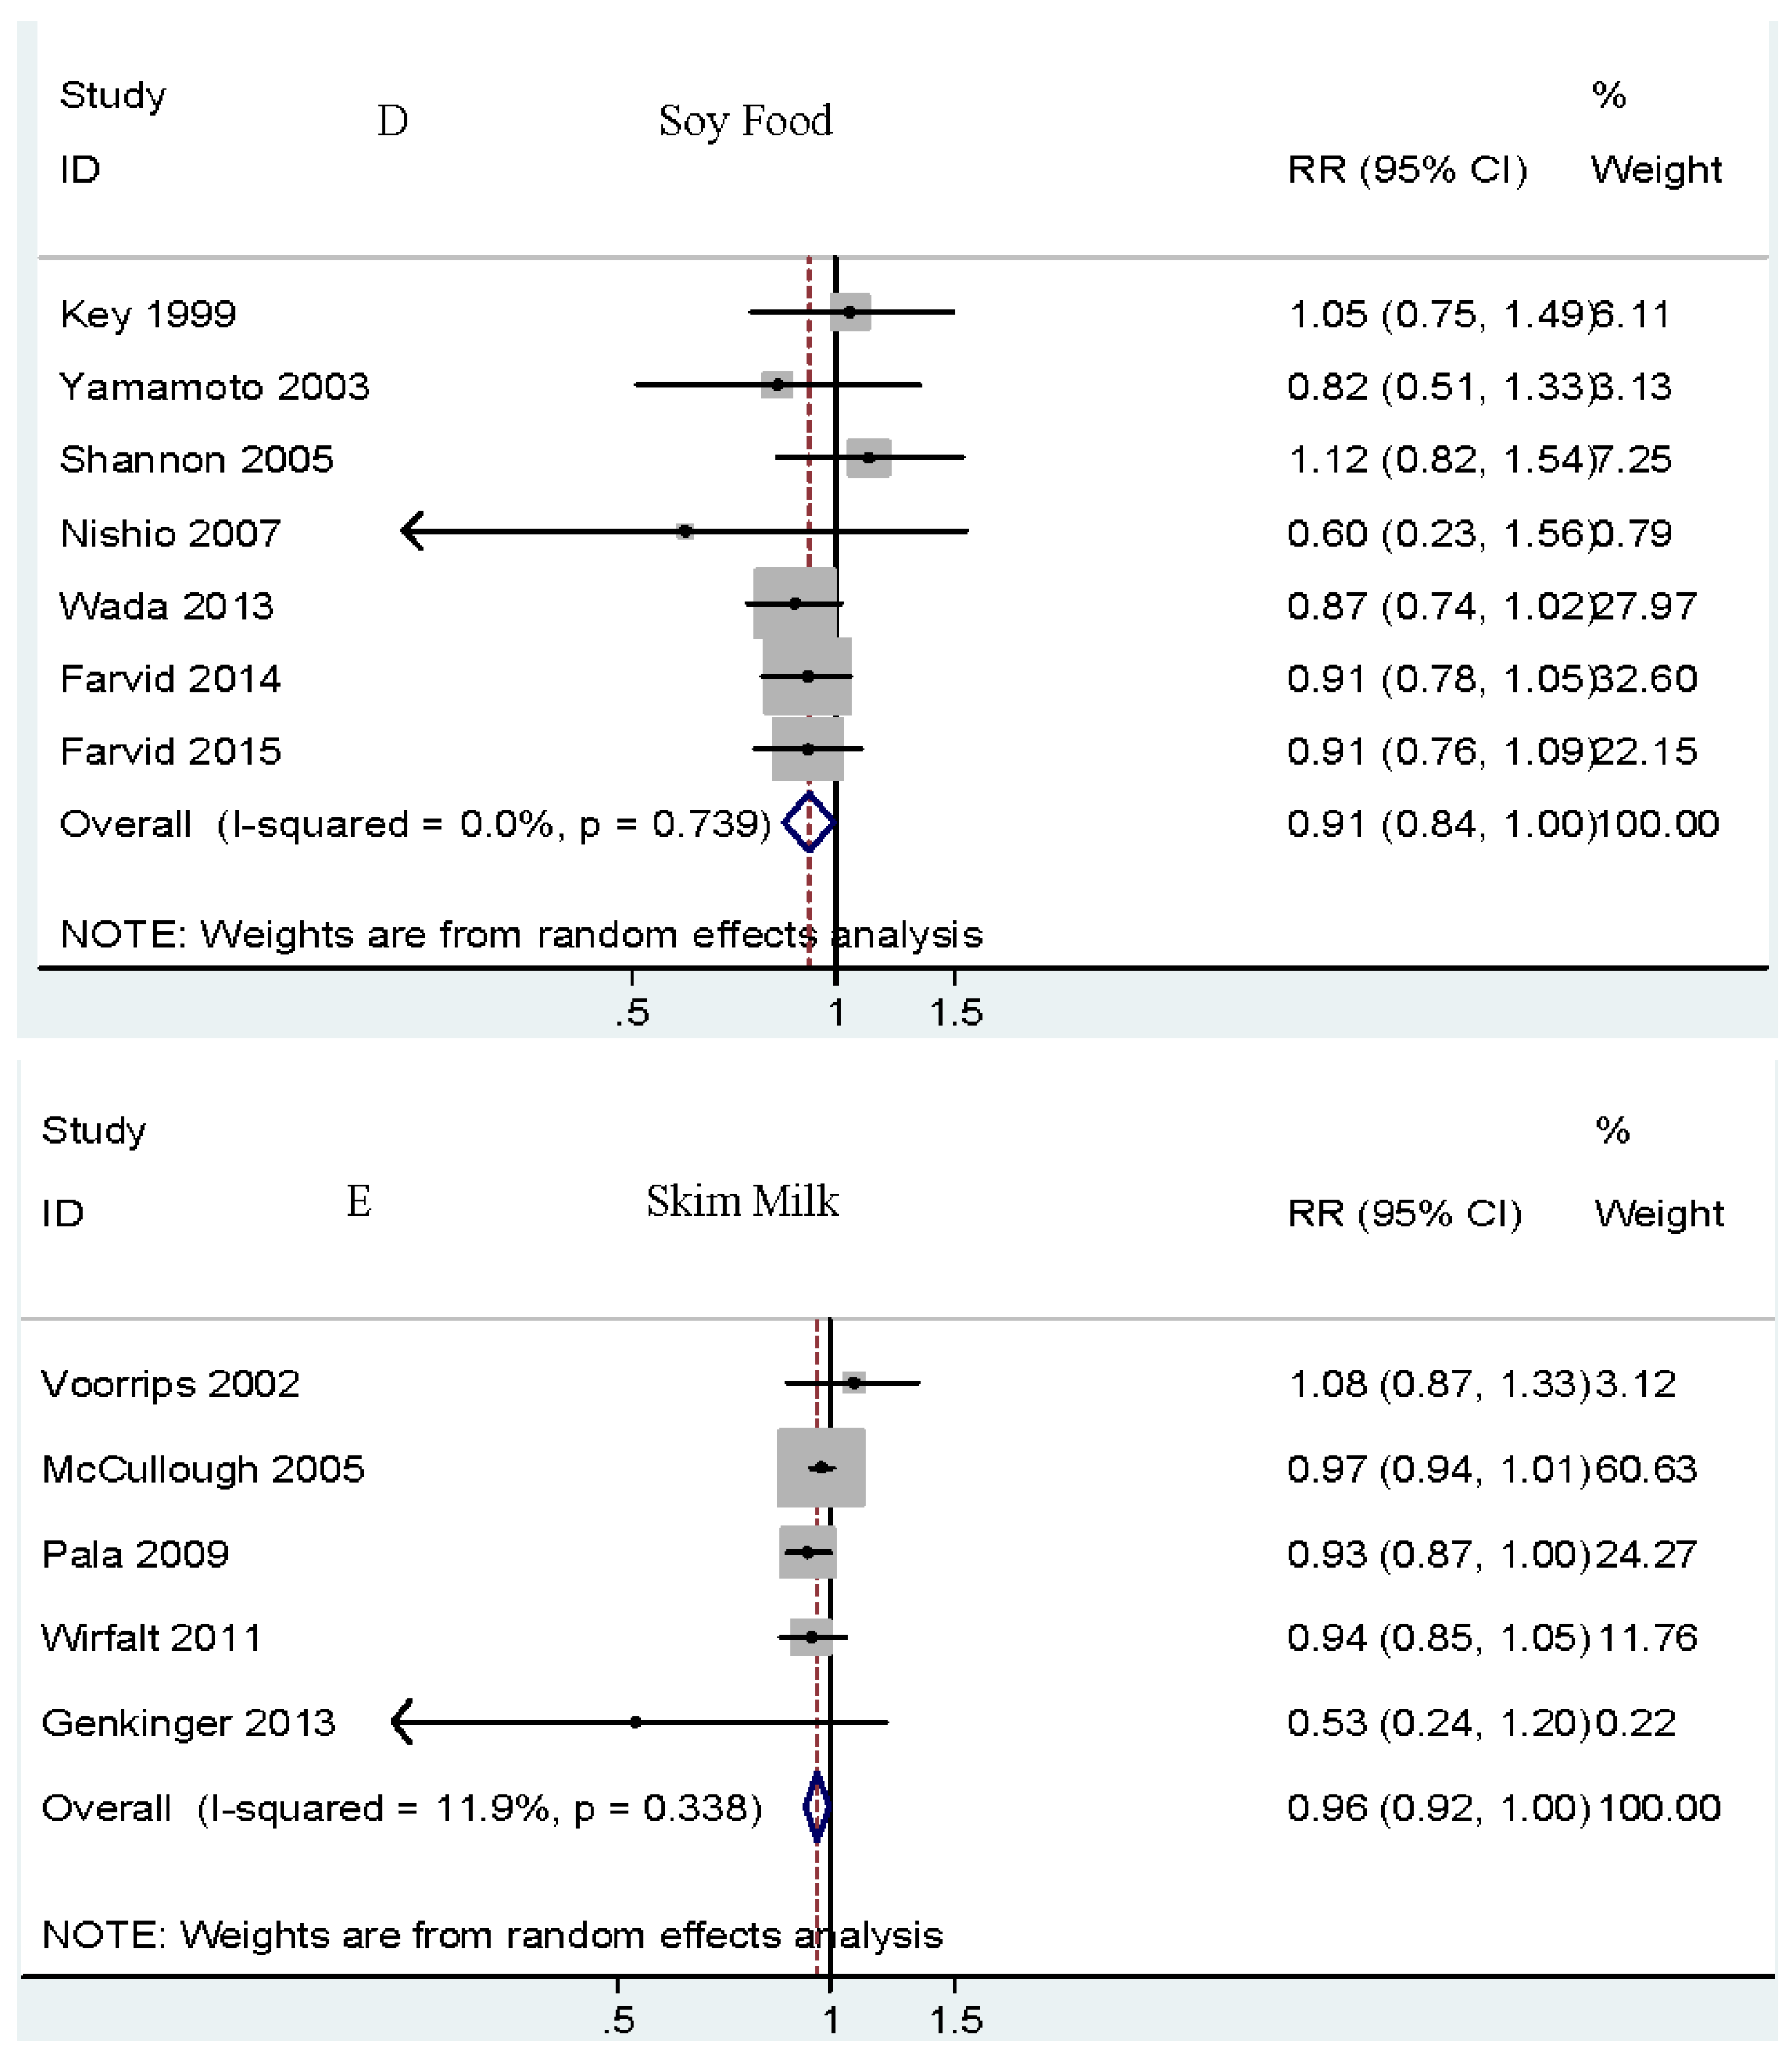
3.7. Soy Food and Risk of Breast Cancer
3.8. Nuts and Risk of Breast Cancer
3.9. Total Milk and Risk of Breast Cancer
3.10. Whole Milk and Risk of Breast Cancer
3.11. Skim Milk and Risk of Breast Cancer
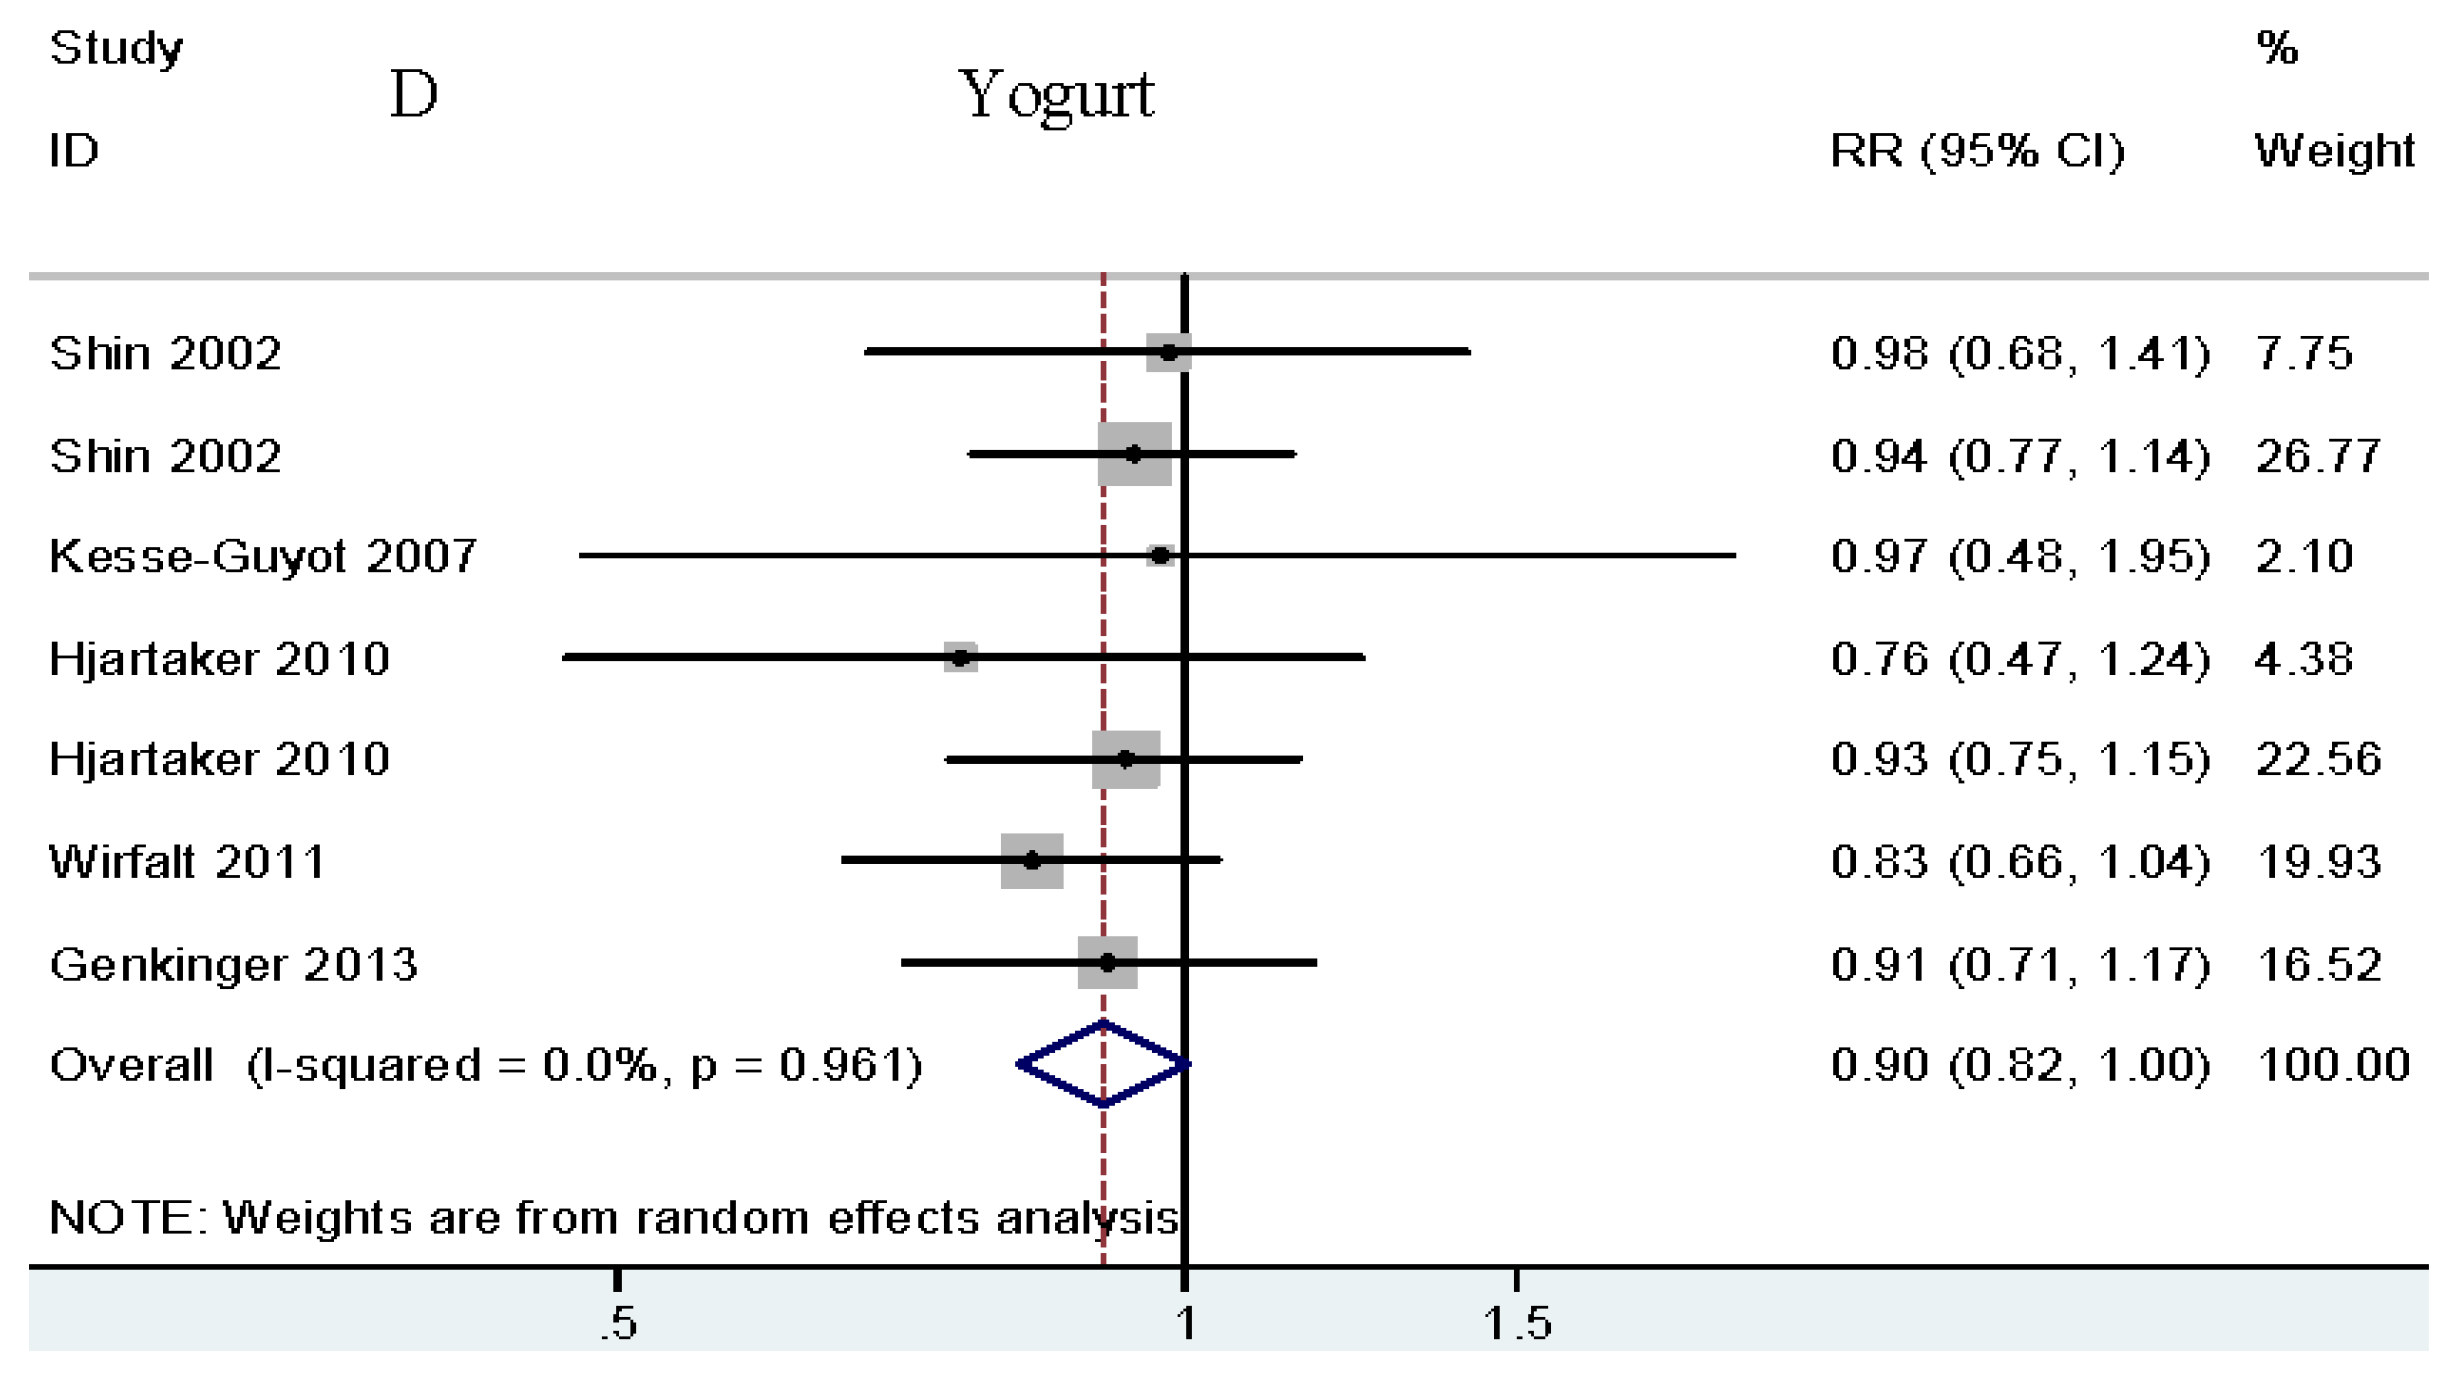
3.12. Yogurt and Risk of Breast Cancer
3.13. Subgroup and Sensitivity Analysis
4. Discussion
5. Conclusions
Supplementary Materials
Acknowledgments
Author Contributions
Conflicts of Interest
References
- Wolfe, R.R. Update on protein intake: Importance of milk proteins for health status of the elderly. Nutr. Rev. 2015, 73, 41–47. [Google Scholar] [CrossRef] [PubMed]
- Moughan, P.J. Dietary protein for human health Preface. Br. J. Nutr. 2012, 108, S1–S2. [Google Scholar] [CrossRef] [PubMed]
- Lauber, S.N.; Ali, S.; Gooderham, N.J. The cooked food derived carcinogen 2-amino-1-methyl-6-phenylimidazo[4,5-b] pyridine is a potent oestrogen: A mechanistic basis for its tissue-specific carcinogenicity. Carcinogenesis 2004, 25, 2509–2517. [Google Scholar] [CrossRef] [PubMed]
- Steck, S.E.; Gaudet, M.M.; Eng, S.M.; Britton, J.A.; Teitelbaum, S.L.; Neugut, A.I.; Santella, R.M.; Gammon, M.D. Cooked meat and risk of breast cancer—Lifetime versus recent dietary intake. Epidemiology 2007, 18, 373–382. [Google Scholar] [CrossRef] [PubMed]
- Egeberg, R.; Olsen, A.; Autrup, H.; Christensen, J.; Stripp, C.; Tetens, I.; Overvad, K.; Tjønneland, A. Meat consumption, N-acetyl transferase 1 and 2 polymorphism and risk of breast cancer, in Danish postmenopausal women. Eur. J. Cancer Prev. 2008, 17, 39–47. [Google Scholar] [CrossRef] [PubMed]
- Taylor, E.F.; Burley, V.J.; Greenwood, D.C.; Cade, J.E. Meat consumption and risk of breast cancer in the UK Women’s Cohort Study. Br. J. Cancer 2007, 96, 1139–1146. [Google Scholar] [CrossRef] [PubMed]
- Farvid, M.S.; Cho, E.; Chen, W.Y.; Eliassen, A.H.; Willett, W.C. Adolescent meat intake and breast cancer risk. Int. J. Cancer 2015, 136, 1909–1920. [Google Scholar] [CrossRef] [PubMed]
- Farvid, M.S.; Cho, E.; Chen, W.Y.; Eliassen, A.H.; Willett, W.C. Dietary protein sources in early adulthood and breast cancer incidence: Prospective cohort study. BMJ 2014, 348. [Google Scholar] [CrossRef] [PubMed]
- Moher, D.; Liberati, A.; Tetzlaff, J.; Altman, D.G.; The PRISMA Group. Preferred reporting items for systematic reviews and meta-analyses: The PRISMA statement. BMJ 2009, 339. [Google Scholar] [CrossRef] [PubMed]
- Wells, G.A.; Shea, B.; O’connell, D.; Peterson, J.; Welch, V.; Losos, M.; Tugwell, P. The Newcastle-Ottawa Scale (NOS) for Assessing Thequality of Nonrandomized Studies in Meta-Analysis; Ottawa Health Research Institute: Ottawa, ON, Canada, 2015. [Google Scholar]
- DerSimonian, R.; Laird, N. Meta-analysis in clinical trials. Controll. Clin. Trials 1986, 7, 177–188. [Google Scholar] [CrossRef]
- Greenland, S.; Longnecker, M.P. Methods for trend estimation from summarized dose-response data, with applications to meta-analysis. Am. J. Epidemiol. 1992, 135, 1301–1309. [Google Scholar] [PubMed]
- Food Standards Agency. Food Portion Sizes, 3rd ed.The Stationery Office (TSO): London, UK, 2005.
- Norat, T.; Lukanova, A.; Ferrari, P.; Riboli, E. Meat consumption and colorectal cancer risk: Dose-response meta-analysis of epidemiological studies. Int. J. Cancer 2002, 98, 241–256. [Google Scholar] [CrossRef] [PubMed]
- Keum, N.; Lee, D.H.; Marchand, N.; Oh, H.; Liu, H.; Aune, D.; Greenwood, D.C.; Giovannucci, E.L. Egg intake and cancers of the breast, ovary and prostate: A dose-response meta-analysis of prospective observational studies. Br. J. Nutr. 2015, 114, 1099–1107. [Google Scholar] [CrossRef] [PubMed]
- Bao, Y.; Hu, F.B.; Giovannucci, E.L.; Wolpin, B.M.; Stampfer, M.J.; Willett, W.C.; Fuchs, C.S. Nut consumption and risk of pancreatic cancer in women. Br. J. Cancer 2013, 109, 2911–2916. [Google Scholar] [CrossRef] [PubMed]
- Ferrucci, L.M.; Cross, A.J.; Graubard, B.I.; Brinton, L.A.; McCarty, C.A.; Ziegler, R.G.; Ma, X.; Mayne, S.T.; Sinha, R. Intake of meat, meat mutagens, and iron and the risk of breast cancer in the Prostate, Lung, Colorectal, and Ovarian Cancer Screening Trial. Br. J. Cancer 2009, 101, 178–184. [Google Scholar] [CrossRef] [PubMed]
- Cross, A.J.; Leitzmann, M.F.; Gail, M.H.; Hollenbeck, A.R.; Schatzkin, A.; Sinha, R. A prospective study of red and processed meat intake in relation to cancer risk. PLoS Med. 2007, 4, e325. [Google Scholar] [CrossRef] [PubMed]
- Higgins, J.P.; Thompson, S.G.; Deeks, J.J.; Altman, D.G. Measuring inconsistency in meta-analyses. BMJ (Clin. Res. Ed.) 2003, 327, 557–560. [Google Scholar] [CrossRef] [PubMed] [Green Version]
- Deeks, J.J.; Higgins, J.P.T.; Altman, D.G. Cochranehandbook for Systematic Reviews of Interventions; Higgins, J., Green, S., Eds.; The Cochrane Collaboration: Oxford, UK, 2008. [Google Scholar]
- Mills, P.K.; Beeson, W.L.; Phillips, R.L.; Fraser, G.E. Dietary habits and breast cancer incidence among Seventh-day Adventists. Cancer 1989, 64, 582–590. [Google Scholar] [CrossRef]
- Ursin, G.; Bjelke, E.; Heuch, I.; Vollset, S.E. Milk consumption and cancer incidence: A Norwegian prospective study. Br. J. Cancer 1990, 61, 454–459. [Google Scholar] [CrossRef] [PubMed]
- Vatten, L.J.; Solvoll, K.; Loken, E.B. Frequency of meat and fish intake and risk of breast cancer in a prospective study of 14,500 Norwegian women. Int. J. Cancer 1990, 46, 12–15. [Google Scholar] [CrossRef] [PubMed]
- Toniolo, P.; Riboli, E.; Shore, R.E.; Pasternack, B.S. Consumption of meat, animal products, protein, and fat and risk of breast cancer: A prospective cohort study in New York. Epidemiology 1994, 5, 391–397. [Google Scholar] [CrossRef] [PubMed]
- Gaard, M.; Tretli, S.; Loken, E.B. Dietary fat and the risk of breast cancer: A prospective study of 25,892 Norwegian women. Int. J. Cancer 1995, 63, 13–17. [Google Scholar] [CrossRef] [PubMed]
- Byrne, C.; Ursin, G.; Ziegler, R.G. A comparison of food habit and food frequency data as predictors of breast cancer in the NHANES I/NHEFS cohort. J. Nutr. 1996, 126, 2757–2764. [Google Scholar] [PubMed]
- Knekt, P.; Jarvinen, R.; Seppanen, R.; Pukkala, E.; Aromaa, A. Intake of dairy products and the risk of breast cancer. Br. J. Cancer 1996, 73, 687–691. [Google Scholar] [CrossRef] [PubMed]
- Key, T.J.; Sharp, G.B.; Appleby, P.N.; Beral, V.; Goodman, M.T.; Soda, M.; Mabuchi, K. Soya foods and breast cancer risk: A prospective study in Hiroshima and Nagasaki, Japan. Br. J. Cancer 1999, 81, 1248–1256. [Google Scholar] [CrossRef] [PubMed]
- Hjartaker, A.; Laake, P.; Lund, E. Childhood and adult milk consumption and risk of premenopausal breast cancer in a cohort of 48,844 women—The Norwegian women and cancer study. Int. J. Cancer 2001, 93, 888–893. [Google Scholar] [CrossRef] [PubMed]
- Missmer, S.A.; Smith-Warner, S.A.; Spiegelman, D.; Yaun, S.-S.; Adami, H.-O.; Beeson, W.L.; van den Brandt, P.A.; Fraser, G.E.; Freudenheim, J.L.; Goldbohm, R.A.; et al. Meat and dairy food consumption and breast cancer: A pooled analysis of cohort studies. Int. J. Epidemiol. 2002, 31, 78–85. [Google Scholar] [CrossRef] [PubMed]
- Shin, M.H.; Holmes, M.D.; Hankinson, S.E.; Wu, K.; Colditz, G.A.; Willett, W.C. Intake of dairy products, calcium, and vitamin d and risk of breast cancer. J. Natl. Cancer Inst. 2002, 94, 1301–1311. [Google Scholar] [CrossRef] [PubMed]
- Voorrips, L.E.; Brants, H.A.M.; Kardinaal, A.F.M.; Hiddink, G.J.; van den Brandt, P.A.; Goldbohm, R.A. Intake of conjugated linoleic acid, fat, and other fatty acids in relation to postmenopausal breast cancer: The Netherlands Cohort Study on Diet and Cancer. Am. J. Clin. Nutr. 2002, 76, 873–882. [Google Scholar] [PubMed]
- Gago-Dominguez, M.; Yuan, J.M.; Sun, C.L.; Lee, H.P.; Yu, M.C. Opposing effects of dietary n-3 and n-6 fatty acids on mammary carcinogenesis: The Singapore Chinese Health Study. Br. J. Cancer 2003, 89, 1686–1692. [Google Scholar] [CrossRef] [PubMed]
- Holmes, M.D.; Colditz, G.A.; Hunter, D.J.; Hankinson, S.E.; Rosner, B.; Speizer, F.E.; Willett, W.C. Meat, fish and egg intake and risk of breast cancer. Int. J. Cancer 2003, 104, 221–227. [Google Scholar] [CrossRef] [PubMed]
- Stripp, C.; Overvad, K.; Christensen, J.; Thomsen, B.L.; Olsen, A.; Moller, S.; Tjønneland, A. Fish intake is positively associated with breast cancer incidence rate. J. Nutr. 2003, 133, 3664–3669. [Google Scholar] [PubMed]
- Yamamoto, S.; Sobue, T.; Kobayashi, M.; Sasaki, S.; Tsugane, S.; Japan Public Health Center-Based Prospective Study on Cancer Cardiovascular Diseases Group. Soy, isoflavones, and breast cancer risk in Japan. J. Natl. Cancer Inst. 2003, 95, 906–913. [Google Scholar] [CrossRef] [PubMed]
- Folsom, A.R.; Demissie, Z. Fish intake, marine omega-3 fatty acids, and mortality in a cohort of postmenopausal women. Am. J. Epidemiol. 2004, 160, 1005–1010. [Google Scholar] [CrossRef] [PubMed]
- Van der Hel, O.L.; Peeters, P.H.; Hein, D.W.; Doll, M.A.; Grobbee, D.E.; Ocke, M.; Bueno de Mesquita, H.B. GSTM1 null genotype, red meat consumption and breast cancer risk (The Netherlands). Cancer Causes Control 2004, 15, 295–303. [Google Scholar] [CrossRef] [PubMed]
- Fung, T.T.; Hu, F.B.; Holmes, M.D.; Rosner, B.A.; Hunter, D.J.; Colditz, G.A.; Willett, W.C. Dietary patterns and the risk of postmenopausal breast cancer. Int. J. Cancer 2005, 116, 116–121. [Google Scholar] [CrossRef] [PubMed]
- McCullough, M.L.; Rodriguez, C.; Diver, W.R.; Feigelson, H.S.; Stevens, V.L.; Thun, M.J.; Calle, E.E. Dairy, calcium, and vitamin D intake and postmenopausal breast cancer risk in the Cancer Prevention Study II Nutrition Cohort. Cancer Epidemiol. Biomark. Prev. 2005, 14, 2898–2904. [Google Scholar] [CrossRef] [PubMed]
- Shannon, J.; Ray, R.; Wu, C.; Nelson, Z.; Gao, D.L.; Li, W.; Hu, W.; Lampe, J.; Horner, N.; Satia, J.; et al. Food and botanical groupings and risk of breast cancer: A case–control study in Shanghai, China. Cancer Epidemiol. Biomark. Prev. 2005, 14, 81–90. [Google Scholar]
- Wakai, K.; Tamakoshi, K.; Date, C.; Fukui, M.; Suzuki, S.; Lin, Y.S.; Niwa, Y.; Nishio, K.; Yatsuya, H.; Kondo, T.; et al. Dietary intakes of fat and fatty acids and risk of breast cancer: A prospective study in Japan. Cancer Sci. 2005, 96, 590–599. [Google Scholar] [CrossRef] [PubMed]
- Engeset, D.; Alsaker, E.; Lund, E.; Welch, A.; Khaw, K.T.; Clavel-Chapelon, F.; Thiebaut, A.; Chajes, V.; Key, T.J.; Allen, N.E.; et al. Fish consumption and breast cancer risk. The European Prospective Investigation into Cancer and Nutrition (EPIC). Int. J. Cancer 2006, 119, 175–182. [Google Scholar] [CrossRef] [PubMed]
- Kesse-Guyot, E.; Bertrais, S.; Duperray, B.; Arnault, N.; Bar-Hen, A.; Galan, P.; Hercberg, S. Dairy products, calcium and the risk of breast cancer: Results of the French SU.VI.MAX prospective study. Ann. Nutr. Metab. 2007, 51, 139–145. [Google Scholar] [CrossRef] [PubMed]
- Nishio, K.; Niwa, Y.; Toyoshima, H.; Tamakoshi, K.; Kondo, T.; Yatsuya, H.; Yamamoto, A.; Suzuki, S.; Tokudome, S.; Lin, Y.; et al. Consumption of soy foods and the risk of breast cancer: Findings from the Japan Collaborative Cohort (JACC) Study. Cancer Causes Control 2007, 18, 801–808. [Google Scholar] [CrossRef] [PubMed]
- Van der Pols, J.C.; Bain, C.; Gunnell, D.; Smith, G.D.; Frobisher, C.; Martin, R.M. Childhood dairy intake and adult cancer risk: 65-y follow-up of the Boyd Orr cohort. Am. J. Clin. Nutr. 2007, 86, 1722–1729. [Google Scholar] [PubMed]
- Sonestedt, E.; Borgquist, S.; Ericson, U.; Gullberg, B.; Landberg, G.; Olsson, H.; Wirfält, E. Plant foods and oestrogen receptor alpha- and beta-defined breast cancer: Observations from the Malmo Diet and Cancer cohort. Carcinogenesis 2008, 29, 2203–2209. [Google Scholar] [CrossRef] [PubMed]
- Larsson, S.C.; Bergkvist, L.; Wolk, A. Long-term meat intake and risk of breast cancer by oestrogen and progesterone receptor status in a cohort of Swedish women. Eur. J. Cancer 2009, 45, 3042–3046. [Google Scholar] [CrossRef] [PubMed]
- Lee, S.-A.; Shu, X.-O.; Li, H.; Yang, G.; Cai, H.; Wen, W.; Ji, B.T.; Gao, J.; Gao, Y.T.; Zheng, W. Adolescent and adult soy food intake and breast cancer risk: Results from the Shanghai Women’s Health Study. Am. J. Clin. Nutr. 2009, 89, 1920–1926. [Google Scholar] [CrossRef] [PubMed]
- Pala, V.; Krogh, V.; Berrino, F.; Sieri, S.; Grioni, S.; Tjonneland, A.; Olsen, A.; Jakobsen, M.U.; Overvad, K.; Clavel-Chapelon, F.; et al. Meat, eggs, dairy products, and risk of breast cancer in the European Prospective Investigation into Cancer and Nutrition (EPIC) cohort. Am. J. Clin. Nutr. 2009, 90, 602–612. [Google Scholar] [CrossRef] [PubMed]
- Hjartaker, A.; Thoresen, M.; Engeset, D.; Lund, E. Dairy consumption and calcium intake and risk of breast cancer in a prospective cohort: The Norwegian Women and Cancer study. Cancer Causes Control 2010, 21, 1875–1885. [Google Scholar] [CrossRef] [PubMed] [Green Version]
- Linos, E.; Willett, W.C.; Cho, E.; Frazier, L. Adolescent diet in relation to breast cancer risk among premenopausal women. Cancer Epidemiol. Biomark. Prev. 2010, 19, 689–696. [Google Scholar] [CrossRef] [PubMed]
- Wirfalt, E.; Li, C.; Manjer, J.; Ericson, U.; Sonestedt, E.; Borgquist, S.; Landberg, G.; Olsson, H.; Gullberg, B. Food Sources of Fat and Sex Hormone Receptor Status of Invasive Breast Tumors in Women of the Malmo Diet and Cancer Cohort. Nutr. Cancer Int. J. 2011, 63, 722–733. [Google Scholar] [CrossRef] [PubMed]
- Deschasaux, M.; Zelek, L.; Pouchieu, C.; His, M.; Hercberg, S.; Galan, P.; Latino-Martel, P.; Touvier, M. Prospective Association between Dietary Fiber Intake and Breast Cancer Risk. PLoS ONE 2013, 8, e79718. [Google Scholar] [CrossRef] [PubMed]
- Genkinger, J.M.; Makambi, K.H.; Palmer, J.R.; Rosenberg, L.; Adams-Campbell, L.L. Consumption of dairy and meat in relation to breast cancer risk in the Black Women’s Health Study. Cancer Causes Control 2013, 24, 675–684. [Google Scholar] [CrossRef] [PubMed]
- Wada, K.; Nakamura, K.; Tamai, Y.; Tsuji, M.; Kawachi, T.; Hori, A.; Takeyama, N.; Tanabashi, S.; Matsushita, S.; Tokimitsu, N.; et al. Soy isoflavone intake and breast cancer risk in Japan: From the Takayama study. Int. J. Cancer 2013, 133, 952–960. [Google Scholar] [CrossRef] [PubMed]
- Pouchieu, C.; Deschasaux, M.; Hercberg, S.; Druesne-Pecollo, N.; Latino-Martel, P.; Touvier, M. Prospective association between red and processed meat intakes and breast cancer risk: Modulation by an antioxidant supplementation in the SU.VI.MAX randomized controlled trial. Int. J. Epidemiol. 2014, 43, 1583–1592. [Google Scholar] [CrossRef] [PubMed]
- Wie, G.-A.; Cho, Y.-A.; Kang, H.-H.; Ryu, K.-A.; Yoo, M.-K.; Kim, Y.-A.; Jung, K.W.; Kim, J.; Lee, J.H.; Joung, H. Red meat consumption is associated with an increased overall cancer risk: A prospective cohort study in Korea. Br. J. Nutr. 2014, 112, 238–247. [Google Scholar] [CrossRef] [PubMed]
- Kiyabu, G.Y.; Inoue, M.; Saito, E.; Abe, S.K.; Sawada, N.; Ishihara, J.; Iwasaki, M.; Yamaji, T.; Shimazu, T.; Sasazuki, S.; et al. Fish, n-3 polyunsaturated fatty acids and n-6 polyunsaturated fatty acids intake and breast cancer risk: The Japan Public Health Center-based prospective study. Int. J. Cancer 2015, 137, 2915–2926. [Google Scholar] [CrossRef] [PubMed]
- Gertig, D.M.; Hankinson, S.E.; Hough, H.; Spiegelman, D.; Colditz, G.A.; Willett, W.C.; Kelsey, K.T.; Hunter, D.J. N-acetyl transferase 2 genotypes, meat intake and breast cancer risk. Int. J. Cancer 1999, 80, 13–17. [Google Scholar] [CrossRef]
- Daniel, C.R.; Cross, A.J.; Koebnick, C.; Sinha, R. Trends in meat consumption in the USA. Public Health Nutr. 2011, 14, 575–583. [Google Scholar] [CrossRef] [PubMed]
- Zheng, W.; Lee, S.A. Well-done meat intake, heterocyclic amine exposure, and cancer risk. Nutr. Cancer 2009, 61, 437–446. [Google Scholar] [CrossRef] [PubMed]
- Farvid, M.S.; Cho, E.; Chen, W.Y.; Eliassen, A.H.; Willett, W.C. Premenopausal dietary fat in relation to pre- and post-menopausal breast cancer. Breast Cancer Res. Treat. 2014, 145, 255–265. [Google Scholar] [CrossRef] [PubMed]
- Fonseca-Nunes, A.; Jakszyn, P.; Agudo, A. Iron and cancer risk—A systematic review and meta-analysis of the epidemiological evidence. Cancer Epidemiol. Biomark. Prev. 2014, 23, 12–31. [Google Scholar] [CrossRef] [PubMed]
- Samraj, A.N.; Pearce, O.M.; Laubli, H.; Crittenden, A.N.; Bergfeld, A.K.; Banda, K.; Gregg, C.J.; Bingman, A.E.; Secrest, P.; Diaz, S.L.; et al. A red meat-derived glycan promotes inflammation and cancer progression. Proc. Natl. Acad. Sci. USA 2015, 112, 542–547. [Google Scholar] [CrossRef] [PubMed]
- Andersson, A.M.; Skakkebaek, N.E. Exposure to exogenous estrogens in food: Possible impact on human development and health. Eur. J. Endocrinol. 1999, 140, 477–485. [Google Scholar] [CrossRef] [PubMed]
- Anderson, L.N.; Cotterchio, M.; Vieth, R.; Knight, J.A. Vitamin D and calcium intakes and breast cancer risk in pre- and postmenopausal women. Am. J. Clin. Nutr. 2010, 91, 1699–1707. [Google Scholar] [CrossRef] [PubMed]
- Cui, Y.; Rohan, T.E. Vitamin D calcium, and breast cancer risk: A review. Cancer Epidemiol. Biomark. Prev. 2006, 15, 1427–1437. [Google Scholar] [CrossRef] [PubMed]
- Sergeev, I.N. Vitamin D and cellular Ca2+ signaling in breast cancer. Anticancer Res. 2012, 32, 299–302. [Google Scholar] [PubMed]
- Kelley, N.S.; Hubbard, N.E.; Erickson, K.L. Conjugated linoleic acid isomers and cancer. J. Nutr. 2007, 137, 2599–2607. [Google Scholar] [PubMed]
- Key, T.J.; Appleby, P.N.; Cairns, B.J.; Luben, R.; Dahm, C.C.; Akbaraly, T.; Brunner, E.J.; Burley, V.; Cade, J.E.; Greenwood, D.C.; et al. Dietary fat and breast cancer: Comparison of results from food diaries and food-frequency questionnaires in the UK Dietary Cohort Consortium. Am. J. Clin. Nutr. 2011, 94, 1043–1052. [Google Scholar] [CrossRef] [PubMed]
- Kruk, J.; Marchlewicz, M. Dietary Fat and Physical Activity in Relation to Breast Cancer among Polish Women. Asian Pac. J. Cancer Prev. 2013, 14, 2495–2502. [Google Scholar] [CrossRef] [PubMed]
- Boeke, C.E.; Eliassen, A.H.; Chen, W.Y.; Cho, E.; Holmes, M.D.; Rosner, B.; Willett, W.C.; Tamimi, R.M. Dietary fat intake in relation to lethal breast cancer in two large prospective cohort studies. Breast Cancer Res. Treat. 2014, 146, 383–392. [Google Scholar] [CrossRef] [PubMed]
- Dong, J.Y.; Zhang, L.; He, K.; Qin, L.Q. Dairy consumption and risk of breast cancer: A meta-analysis of prospective cohort studies. Breast Cancer Res. Treat. 2011, 127, 23–31. [Google Scholar] [CrossRef] [PubMed]
- Taylor, V.H.; Misra, M.; Mukherjee, S.D. Is red meat intake a risk factor for breast cancer among premenopausal women? Breast Cancer Res. Treat. 2009, 117, 1–8. [Google Scholar] [CrossRef] [PubMed]
- Zheng, J.-S.; Hu, X.-J.; Zhao, Y.-M.; Yang, J.; Li, D. Intake of fish and marine n-3 polyunsaturated fatty acids and risk of breast cancer: Meta-analysis of data from 21 independent prospective cohort studies. BMJ 2013, 346. [Google Scholar] [CrossRef] [PubMed]
- Alexander, D.D.; Morimoto, L.M.; Mink, P.J.; Cushing, C.A. A review and meta-analysis of red and processed meat consumption and breast cancer. Nutr. Res. Rev. 2010, 23, 349–365. [Google Scholar] [CrossRef] [PubMed]
- Guo, J.; Wei, W.; Zhan, L. Red and processed meat intake and risk of breast cancer: A meta-analysis of prospective studies. Breast Cancer Res. Treat. 2015, 151, 191–198. [Google Scholar] [CrossRef] [PubMed]


| Topic | Search Strategy |
|---|---|
| Breast Cancer | “Breast Neoplasms” OR “Breast Cancer” |
| Study | “Cohort” OR “Nested Case–control” OR “Case–cohort” OR “Prospective” |
| Dietary Protein Sources | |
| (1) Red Meat | “Meat” OR “Red Meat” OR “Pork” OR “Beef” OR “Veal” OR “Mutton” OR “Lamb” |
| (2) Processed Meat | “Meat” OR “Processed Meat” OR “Preserved Meat” OR “Ham” OR “ Sausage” OR “Bacon” OR “Hot Dogs” |
| (3) Poultry | “Poultry” OR “Chicken” OR “Turkey” |
| (4) Fish | “Fish” OR “Seafood” OR “Shellfish” OR ” Tuna” OR “Salmon” OR “Sardines” OR “Bluefish” |
| (5) Egg | “Ovum” OR “Ova” OR “Egg” |
| (6) Legumes | “Soy” OR “Soy Food” OR “ Soy Protein” OR “ Regular Tofu” OR “ Fried Tofu” OR “Soybeans” OR “String Beans” OR “Beans” OR “Lentils” OR “ Peas” OR “Lima Beans” |
| (7) Nuts | “Nut” OR “Peanut” OR “Almonds” OR “Pecans” OR “Pistachios” OR “Cashews” |
| (8) Milks | “Milk” OR “Dietary Products” OR “Whole Milk” OR “Skim Milk” OR “Fermented Milk” OR “Yogurt” |
| High vs. Low | Dose-Response | Serving | |||
|---|---|---|---|---|---|
| RR | 95% CI | RR | 95% CI | ||
| Total red meat | 1.05 | (0.95–1.16) | 1.07 | (1.01–1.14) | 120 g |
| Fresh red meat | 1.07 | (0.98–1.17) | 1.13 | (1.01–1.26) | 120 g |
| Processed meat | 1.07 | (1.01–1.14) | 1.09 | (1.02–1.17) | 50 g |
| Poultry | 1.01 | (0.93–1.11) | 0.97 | (0.85–1.11) | 120 g |
| Fish | 1.04 | (0.97–1.12) | 1.07 | (0.94–1.21) | 120 g |
| Egg | 1.04 | (0.98–1.11) | 1.04 | (0.94–1.15) | 50 g |
| Soy food | 0.92 | (0.84–1.00) | 0.91 | (0.84–1.00) | Serving |
| Nuts | 0.96 | (0.88–1.06) | 0.96 | (0.84–1.09) | 28 g |
| Total milk | 0.92 | (0.84–1.02) | 0.97 | (0.93–1.01) | 200 g |
| Whole milk | 0.99 | (0.87–1.12) | 1.02 | (0.92–1.13) | 200 g |
| Skim milk | 0.93 | (0.85–1.00) | 0.96 | (0.92–1.00) | 200 g |
| Yogurt | 0.90 | (0.82–1.00) | 0.87 | (0.72–1.06) | 200 g |
| Fresh Red Meat | Processed Meat | Poultry | Fish | ||||||||||
| n | RR (95% CI) | I2 | n | RR (95% CI) | I2 | n | RR (95% CI) | I2 | n | RR (95% CI) | I2 | ||
| Overall | 8 | 1.13 (1.01–1.26) | 56.4 | 12 | 1.09 (1.02–1.17) | 11.8 | 10 | 0.97 (0.85–1.11) | 33.2 | 13 | 1.07 (0.94–1.21) | 33.3 | |
| Menopausal status: | |||||||||||||
| Premenopausal | 4 | 1.07 (0.88–1.31) | 45.5 | 4 | 1.09 (0.94–1.26) | 21.5 | 5 | 0.91 (0.79–1.04) | 0.0 | 6 | 1.07 (0.89–1.27) | 0.0 | |
| Postmenopausal | 7 | 1.09 (0.96–1.25) | 47.2 | 7 | 1.10 (0.97–1.26) | 34.7 | 6 | 1.02 (0.80–1.31) | 60.2 | 7 | 1.02 (0.91–1.14) | 0.0 | |
| Regions: | |||||||||||||
| Asian | 0 | - | - | 1 | 0.75 (0.48–1.15) | - | 1 | 0.98 (0.10–9.53) | - | 3 | 1.01 (0.82–1.25) | 34.6 | |
| US | 3 | 1.09 (1.01–1.17) | 0.0 | 5 | 1.08 (0.99–1.17) | 0.0 | 6 | 0.91 (0.80–1.04) | 20.4 | 7 | 1.13 (0.94–1.35) | 0.0 | |
| Europe | 5 | 1.34 (1.02–1.76) | 72.9 | 6 | 1.20 (1.01–1.43) | 47.2 | 3 | 1.46 (0.78–2.74) | 43.4 | 3 | 1.17 (0.73–1.86) | 63.2 | |
| Duration of follow-up | |||||||||||||
| ≤10 years | 6 | 1.19 (1.01–1.39) | 65.5 | 8 | 1.12 (1.02–1.23) | 27.9 | 6 | 0.91 (0.79–1.03) | 15.5 | 6 | 1.38 (0.91–2.10) | 65.0 | |
| >10 years | 2 | 1.11 (1.00–1.23) | 0.0 | 4 | 1.05 (0.92–1.19) | 4.5 | 4 | 1.11 (0.84–1.46) | 32.2 | 7 | 1.01 (0.90–1.14) | 0.0 | |
| Study type: | |||||||||||||
| Cohort | 5 | 1.11 (1.01–1.21) | 47.3 | 9 | 1.10 (1.01–1.20) | 38.1 | 8 | 0.96 (0.84–1.11) | 39.1 | 11 | 1.05 (0.94–1.18) | 24.1 | |
| Nested case–control | 2 | 2.14 (1.34–3.43) | 0.0 | 2 | 1.11 (0.74–1.65) | 0.0 | 2 | 1.35 (0.45–4.12) | 42.6 | 2 | 1.87 (0.42–8.32) | 76.3 | |
| Case–cohort | 1 | 0.97 (0.76–1.23) | - | 1 | 0.82 (0.27–2.49) | - | 0 | - | - | 0 | - | - | |
| Study quality: | |||||||||||||
| Score > 7 | 5 | 1.06 (0.99–1.13) | 0.0 | 6 | 1.19 (1.01–1.13) | 0.0 | 3 | 1.04 (0.90–1.19) | 0.0 | 6 | 1.08 (0.89–1.31) | 43.3 | |
| Score ≤ 7 | 3 | 1.56 (1.01–2.42) | 80.3 | 6 | 1.19 (0.97–1.45) | 55.9 | 7 | 0.95 (0.74–1.21) | 39.5 | 7 | 1.06 (0.88–1.30) | 33.4 | |
| Unit | |||||||||||||
| g/day | 5 | 1.37 (1.01–1.86) | 72.1 | 5 | 1.21 (0.98–1.50) | 60.3 | 4 | 1.08 (0.83–1.41) | 39.5 | 4 | 1.11 (0.92–1.35) | 37.8 | |
| Serving/day | 2 | 1.17 (0.89–1.54) | 11.3 | 6 | 1.08 (0.96–1.21) | 0.0 | 5 | 0.97 (0.84–1.11) | 44.7 | 9 | 1.04 (0.87–1.25) | 36.3 | |
| Adjustment for confounders: | |||||||||||||
| Age at menarche | Yes | 4 | 1.08 (0.97–1.21) | 8.0 | 6 | 1.08 (0.96–1.22) | 0.0 | 6 | 0.91 (0.80–1.04) | 20.4 | 8 | 1.04 (0.91–1.19) | 26.5 |
| No | 4 | 1.24 (1.03–1.51) | 77.1 | 6 | 1.13 (0.99–1.28) | 59.2 | 4 | 1.26 (0.89–1.89) | 15.3 | 5 | 1.16 (0.84–1.61) | 51.1 | |
| Age at first birth | Yes | 5 | 1.16 (0.93–1.43) | 58.5 | 7 | 1.12 (1.00–1.26) | 0.0 | 6 | 0.91 (0.80–1.04) | 20.4 | 10 | 1.05 (0.90–1.22) | 39.9 |
| No | 3 | 1.14 (0.98–1.32) | 69.4 | 5 | 1.09 (0.97–1.23) | 53.4 | 4 | 1.26 (0.89–1.89) | 15.3 | 3 | 1.15 (0.87–1.53) | 19.0 | |
| Fat | Yes | 0 | - | - | 1 | 1.13 (0.79–1.61) | - | 1 | 0.90 (0.67–1.20) | - | 2 | 1.76 (0.37–8.41) | 81.6 |
| No | 8 | 1.36 (1.08–1.79) | 56.4 | 11 | 1.10 (1.01–1.18) | 24.2 | 9 | 0.99 (0.84–1.16) | 39.9 | 11 | 1.09 (0.94–1.25) | 41.7 | |
| Smoking | Yes | 7 | 1.10 (1.01–1.19) | 38.8 | 7 | 1.09 (1.02–1.16) | 10.6 | 5 | 0.97 (0.83–1.14) | 54.2 | 5 | 0.98 (0.86–1.12) | 0.0 |
| No | 1 | 2.19 (1.29–3.73) | - | 5 | 1.13 (0.90–1.38) | 38.2 | 5 | 1.02 (0.69–1.52) | 15.8 | 8 | 1.22 (0.94–1.58) | 52.2 | |
| Alcohol | Yes | 6 | 1.10 (0.97–1.26) | 50.9 | 7 | 1.09 (1.01–1.89) | 0.0 | 4 | 0.92 (0.73–1.17) | 46.4 | 7 | 1.06 (0.94–1.19) | 7.2 |
| No | 2 | 1.34 (0.82–2.21) | 83.6 | 5 | 1.14 (0.89–1.45) | 52.7 | 6 | 1.01 (0.85–1.21) | 27.3 | 6 | 1.13 (0.84–1.52) | 56.6 | |
| BMI | Yes | 7 | 1.17 (1.01–1.36) | 63.0 | 10 | 1.12 (1.03–1.22) | 11.3 | 6 | 1.01 (0.85–1.19) | 30.4 | 10 | 1.03 (0.86–1.23) | 39.0 |
| No | 1 | 1.08 (0.98–1.09) | 62 | 2 | 1.09 (0.67–1.76) | 0.0 | 4 | 0.94 (0.74–1.20) | 40.3 | 3 | 1.12 (0.99–1.27) | 0.0 | |
| BMI + Alcohol | Yes | 6 | 1.10 (0.97–1.26) | 50.9 | 7 | 1.09 (1.01–1.89) | 0.0 | 4 | 0.92 (0.73–1.17) | 46.4 | 6 | 1.03 (0.86–1.25) | 18.5 |
| No | 2 | 1.34 (0.82–2.21) | 83.6 | 5 | 1.14 (0.89–1.45) | 52.7 | 6 | 1.01 (0.85–1.21) | 27.3 | 7 | 1.09 (0.91–1.32) | 46.3 | |
| Energy | Yes | 6 | 1.09 (0.97–1.22) | 45.9 | 7 | 1.09 (1.01–1.17) | 9.4 | 5 | 1.05 (0.92–1.21) | 0.0 | 6 | 1.08 (0.97–1.20) | 0.0 |
| No | 2 | 1.49 (0.79–2.83) | 82.5 | 4 | 1.11 (0.93–1.32) | 38.3 | 5 | 0.90 (0.71–1.13) | 40.6 | 7 | 1.10 (0.83–1.46) | 60.0 | |
| OC use | Yes | 4 | 1.13 (0.93–1.38) | 62.1 | 4 | 1.17 (0.93–1.47) | 52.3 | 4 | 0.94 (0.77–1.16) | 54.6 | 4 | 1.02 (0.95–1.09) | 0 |
| No | 4 | 1.15 (0.98–1.35) | 63.6 | 8 | 1.08 (1.02–1.15) | 0.0 | 6 | 1.03 (0.87–1.22) | 4.7 | 9 | 1.07 (0.95–1.19) | 57.7 | |
| Hormone therapy | Yes | 4 | 1.35 (0.99–1.84) | 74.7 | 9 | 1.23 (1.01–1.49) | 54.1 | 6 | 0.96 (0.84–1.09) | 43.6 | 7 | 1.05 (0.94–1.17) | 7.4 |
| No | 4 | 1.13 (1.01–1.26) | 57.3 | 5 | 1.07 (1.01–1.14) | 0.0 | 4 | 1.07 (0.90–1.27) | 0.0 | 6 | 1.14 (0.81–1.59) | 59.6 | |
| Egg | Total milk | Whole milk | Skim milk | ||||||||||
| n | RR (95% CI) | I2 | n | RR (95% CI) | I2 | n | RR (95% CI) | I2 | n | RR (95% CI) | I2 | ||
| Overall | 8 | 1.04 (0.94–1.15) | 26.9 | 11 | 0.97 (0.93–1.01) | 36.4 | 5 | 1.02 (0.92–1.13) | 32.8 | 5 | 0.96 (0.92–1.00) | 11.9 | |
| Menopausal status: | |||||||||||||
| Premenopausal | 3 | 1.08 (0.91–1.27) | 0.0 | 2 | 0.98 (0.92–1.04) | 0.0 | 2 | 1.09 (0.90–1.32) | 0.0 | 2 | 0.75 (0.38–1.48) | 44.1 | |
| Postmenopausal | 3 | 1.06 (0.97–1.17) | 0.0 | 4 | 1.00 (0.96–1.03) | 42.4 | 3 | 0.97 (0.89–1.06) | 0.0 | 4 | 0.97 (0.94–1.01) | 0.0 | |
| Regions: | |||||||||||||
| Asia | 2 | 0.79 (0.46–1.35) | 74.4 | 3 | 0.97 (0.77–1.23) | 0.0 | 1 | 0.95 (0.35–2.54) | - | 1 | 0.53 (0.24–1.20) | - | |
| US | 3 | 1.03 (0.84–1.22) | 0.0 | 1 | 0.97 (0.94–1.01) | 29.4 | 1 | 1.04 (0.94–1.16) | - | 1 | 0.97 (0.94–1.01) | - | |
| Europe | 3 | 1.09 (1.00–1.19) | 0.0 | 7 | 0.95 (0.87–1.03) | 60.1 | 3 | 1.04 (0.90–1.19) | 64.0 | 3 | 0.94 (0.89–1.00) | 0.0 | |
| Duration of follow-up | |||||||||||||
| ≤10 years | 4 | 1.02 (0.81–1.28) | 65.9 | 7 | 0.96 (0.91–1.01) | 60.5 | 3 | 0.99 (0.92–1.06) | 0.0 | 4 | 0.96 (0.93–0.99) | 0.0 | |
| >10 years | 4 | 1.02 (0.89–1.17) | 0.0 | 4 | 1.01 (0.84–1.21) | 0.0 | 2 | 1.30 (0.98–1.73) | 0.0 | 1 | 0.53 (0.24–1.20) | - | |
| Study type: | |||||||||||||
| Cohort | 8 | 1.04 (0.94–1.15) | 26.9 | 10 | 0.97 (0.92–1.01) | 42.2 | 4 | 1.06 (0.96–1.17) | 1.1 | 4 | 0.96 (0.92–0.99) | 10.7 | |
| Nested case–control | 0 | - | - | 0 | - | - | 0 | - | - | 0 | - | - | |
| Case–cohort | 0 | - | — | 1 | 0.96 (0.86–1.07) | - | 1 | 0.94 (0.85–1.05) | - | 1 | 1.08 (0.87–1.33) | - | |
| Study quality: | |||||||||||||
| Score > 7 | 2 | 1.07 (0.97–1.19) | 0.0 | 7 | 0.98 (0.96–1.01) | 0.0 | 4 | 0.99 (0.92–1.06) | 0.0 | 4 | 0.96 (0.91–1.01) | 31.1 | |
| Score ≤ 7 | 6 | 1.01 (0.87–1.18) | 46.6 | 4 | 0.89 (0.69–1.17) | 66.8 | 1 | 1.34 (1.00–1.81) | - | 1 | 0.94 (0.85–1.05) | - | |
| Unit | |||||||||||||
| g/day | 5 | 1.37 (1.01–1.86) | 72.1 | 7 | 0.99 (0.97–1.02) | 0.0 | 4 | 1.03 (0.91–1.16) | 46.1 | 3 | 0.96 (0.81–1.13) | 45.7 | |
| Serving/day | 2 | 1.17 (0.89–1.54) | 11.3 | 4 | 0.88 (0.69–1.10) | 73.0 | 1 | 0.94 (0.66–1.32) | - | 2 | 0.97 (0.93–1.00) | 0.0 | |
| Adjustment for confounders: | |||||||||||||
| Age at menarche | Yes | 3 | 1.03 (0.84–1.22) | 0.0 | 4 | 0.97 (0.94–1.00) | 0.0 | 3 | 0.94 (0.85–1.04) | 0.0 | 3 | 0.98 (0.86–1.12) | 36.3 |
| No | 5 | 1.03 (0.88–1.20) | 55.0 | 7 | 0.94 (0.81–1.09) | 56.8 | 2 | 1.14 (0.90–1.44) | 59.9 | 2 | 0.93 (0.88–0.99) | 0.0 | |
| Age at first birth | Yes | 3 | 1.03 (0.84–1.22) | 0.0 | 4 | 0.97 (0.94–1.00) | 0.0 | 3 | 0.94 (0.85–1.04) | 0.0 | 3 | 0.98 (0.86–1.12) | 36.3 |
| No | 5 | 1.03 (0.88–1.20) | 55.0 | 7 | 0.94 (0.81–1.09) | 56.8 | 2 | 1.14 (0.90–1.44) | 59.9 | 2 | 0.93 (0.88–0.99) | 0.0 | |
| Fat | Yes | 0 | - | - | 0 | - | - | 0 | - | - | 0 | - | - |
| No | 8 | 1.04 (0.94–1.15) | 26.9 | 11 | 0.97 (0.93–1.01) | 36.4 | 5 | 1.02 (0.92–1.13) | 5 | 5 | 0.96 (0.93–0.99) | 11.9 | |
| Smoking | Yes | 3 | 1.06 (0.97–1.16) | 0.0 | 4 | 1.00 (0.97–1.03) | 0.0 | 3 | 0.99 (0.92–1.07) | 0.0 | 3 | 0.96 (0.81–1.13) | 45.7 |
| No | 5 | 1.00 (0.79–1.25) | 55.1 | 7 | 0.93 (0.85–1.02) | 49.3 | 2 | 1.14 (0.80–1.61) | 56.9 | 2 | 0.97 (0.93–1.00) | 0.0 | |
| Alcohol | Yes | 1 | 1.08 (0.84–1.38) | - | 5 | 0.97 (0.94–1.00) | 0.0 | 3 | 0.94 (0.85–1.04) | 0.0 | 3 | 0.98 (0.86–1.12) | 36.3 |
| No | 7 | 1.03 (0.91–1.16) | 37.1 | 6 | 0.92 (0.77–1.09) | 62.6 | 2 | 1.14 (0.90–1.44) | 59.9 | 2 | 0.93 (0.88–0.99) | 0.0 | |
| BMI | Yes | 3 | 1.16 (1.00–1.36) | 0.0 | 6 | 0.93 (0.86–1.01) | 57.9 | 3 | 0.94 (0.85–1.04) | 0.0 | 4 | 0.97 (0.92–1.02) | 13.9 |
| No | 5 | 0.98 (0.84–1.13) | 43.5 | 5 | 1.00 (0.97–1.03) | 0.0 | 2 | 1.14 (0.90–1.44) | 59.9 | 1 | 0.93 (0.87–1.00) | - | |
| BMI + Alcohol | Yes | 1 | 1.08 (0.84–1.38) | - | 3 | 0.95 (0.89–1.02) | 0.0 | 2 | 0.96 (0.91–1.02) | 0.0 | 2 | 0.85 (0.44–1.64) | 64.4 |
| No | 7 | 1.03 (0.91–1.16) | 37.1 | 8 | 0.97 (0.91–1.03) | 53.2 | 3 | 1.08 (0.93–1.26) | 30.3 | 3 | 0.96 (0.93–0.99) | 0.0 | |
| Energy | Yes | 2 | 0.83 (0.46–1.47) | 85.2 | 6 | 1.00 (0.97–1.03) | 0.0 | 3 | 0.99 (0.92–1.07) | 0.0 | 2 | 0.97 (0.93–1.00) | 0.0 |
| No | 6 | 1.08 (0.97–1.21) | 0.0 | 5 | 0.92 (0.83–1.03) | 65.8 | 2 | 1.14 (0.80–1.61) | 56.9 | 3 | 0.98 (0.86–1.12) | 36.3 | |
| OC use | Yes | 2 | 1.02 (0.85–1.21) | 0.0 | 2 | 0.95 (0.89–1.02) | 0.0 | 1 | 0.94 (0.85–1.05) | - | 1 | 1.08 (0.87–1.33) | - |
| No | 6 | 1.04 (0.90–1.20) | 44.0 | 9 | 0.97 (0.91–1.03) | 46.7 | 4 | 1.06 (0.96–1.17) | 1.1 | 4 | 0.96 (0.91–1.01) | 31.1 | |
| Hormone therapy | Yes | 2 | 1.02 (0.85–1.21) | 0.0 | 3 | 0.97 (0.94–1.01) | 0.0 | 1 | 0.95 (0.35–2.54) | - | 2 | 0.82 (0.49–1.39) | 53.8 |
| No | 6 | 1.04 (0.90–1.20) | 44.0 | 8 | 0.95 (0.88–1.02) | 51.7 | 4 | 1.02 (0.91–1.15) | 47.4 | 3 | 0.94 (0.89–1.00) | 0.0 | |
© 2016 by the authors; licensee MDPI, Basel, Switzerland. This article is an open access article distributed under the terms and conditions of the Creative Commons Attribution (CC-BY) license (http://creativecommons.org/licenses/by/4.0/).
Share and Cite
Wu, J.; Zeng, R.; Huang, J.; Li, X.; Zhang, J.; Ho, J.C.-M.; Zheng, Y. Dietary Protein Sources and Incidence of Breast Cancer: A Dose-Response Meta-Analysis of Prospective Studies. Nutrients 2016, 8, 730. https://doi.org/10.3390/nu8110730
Wu J, Zeng R, Huang J, Li X, Zhang J, Ho JC-M, Zheng Y. Dietary Protein Sources and Incidence of Breast Cancer: A Dose-Response Meta-Analysis of Prospective Studies. Nutrients. 2016; 8(11):730. https://doi.org/10.3390/nu8110730
Chicago/Turabian StyleWu, Jing, Rong Zeng, Junpeng Huang, Xufeng Li, Jiren Zhang, James Chung-Man Ho, and Yanfang Zheng. 2016. "Dietary Protein Sources and Incidence of Breast Cancer: A Dose-Response Meta-Analysis of Prospective Studies" Nutrients 8, no. 11: 730. https://doi.org/10.3390/nu8110730