Ageing Is Associated with Decreases in Appetite and Energy Intake—A Meta-Analysis in Healthy Adults

 ,
, 


Abstract
:1. Introduction
2. Experimental Section
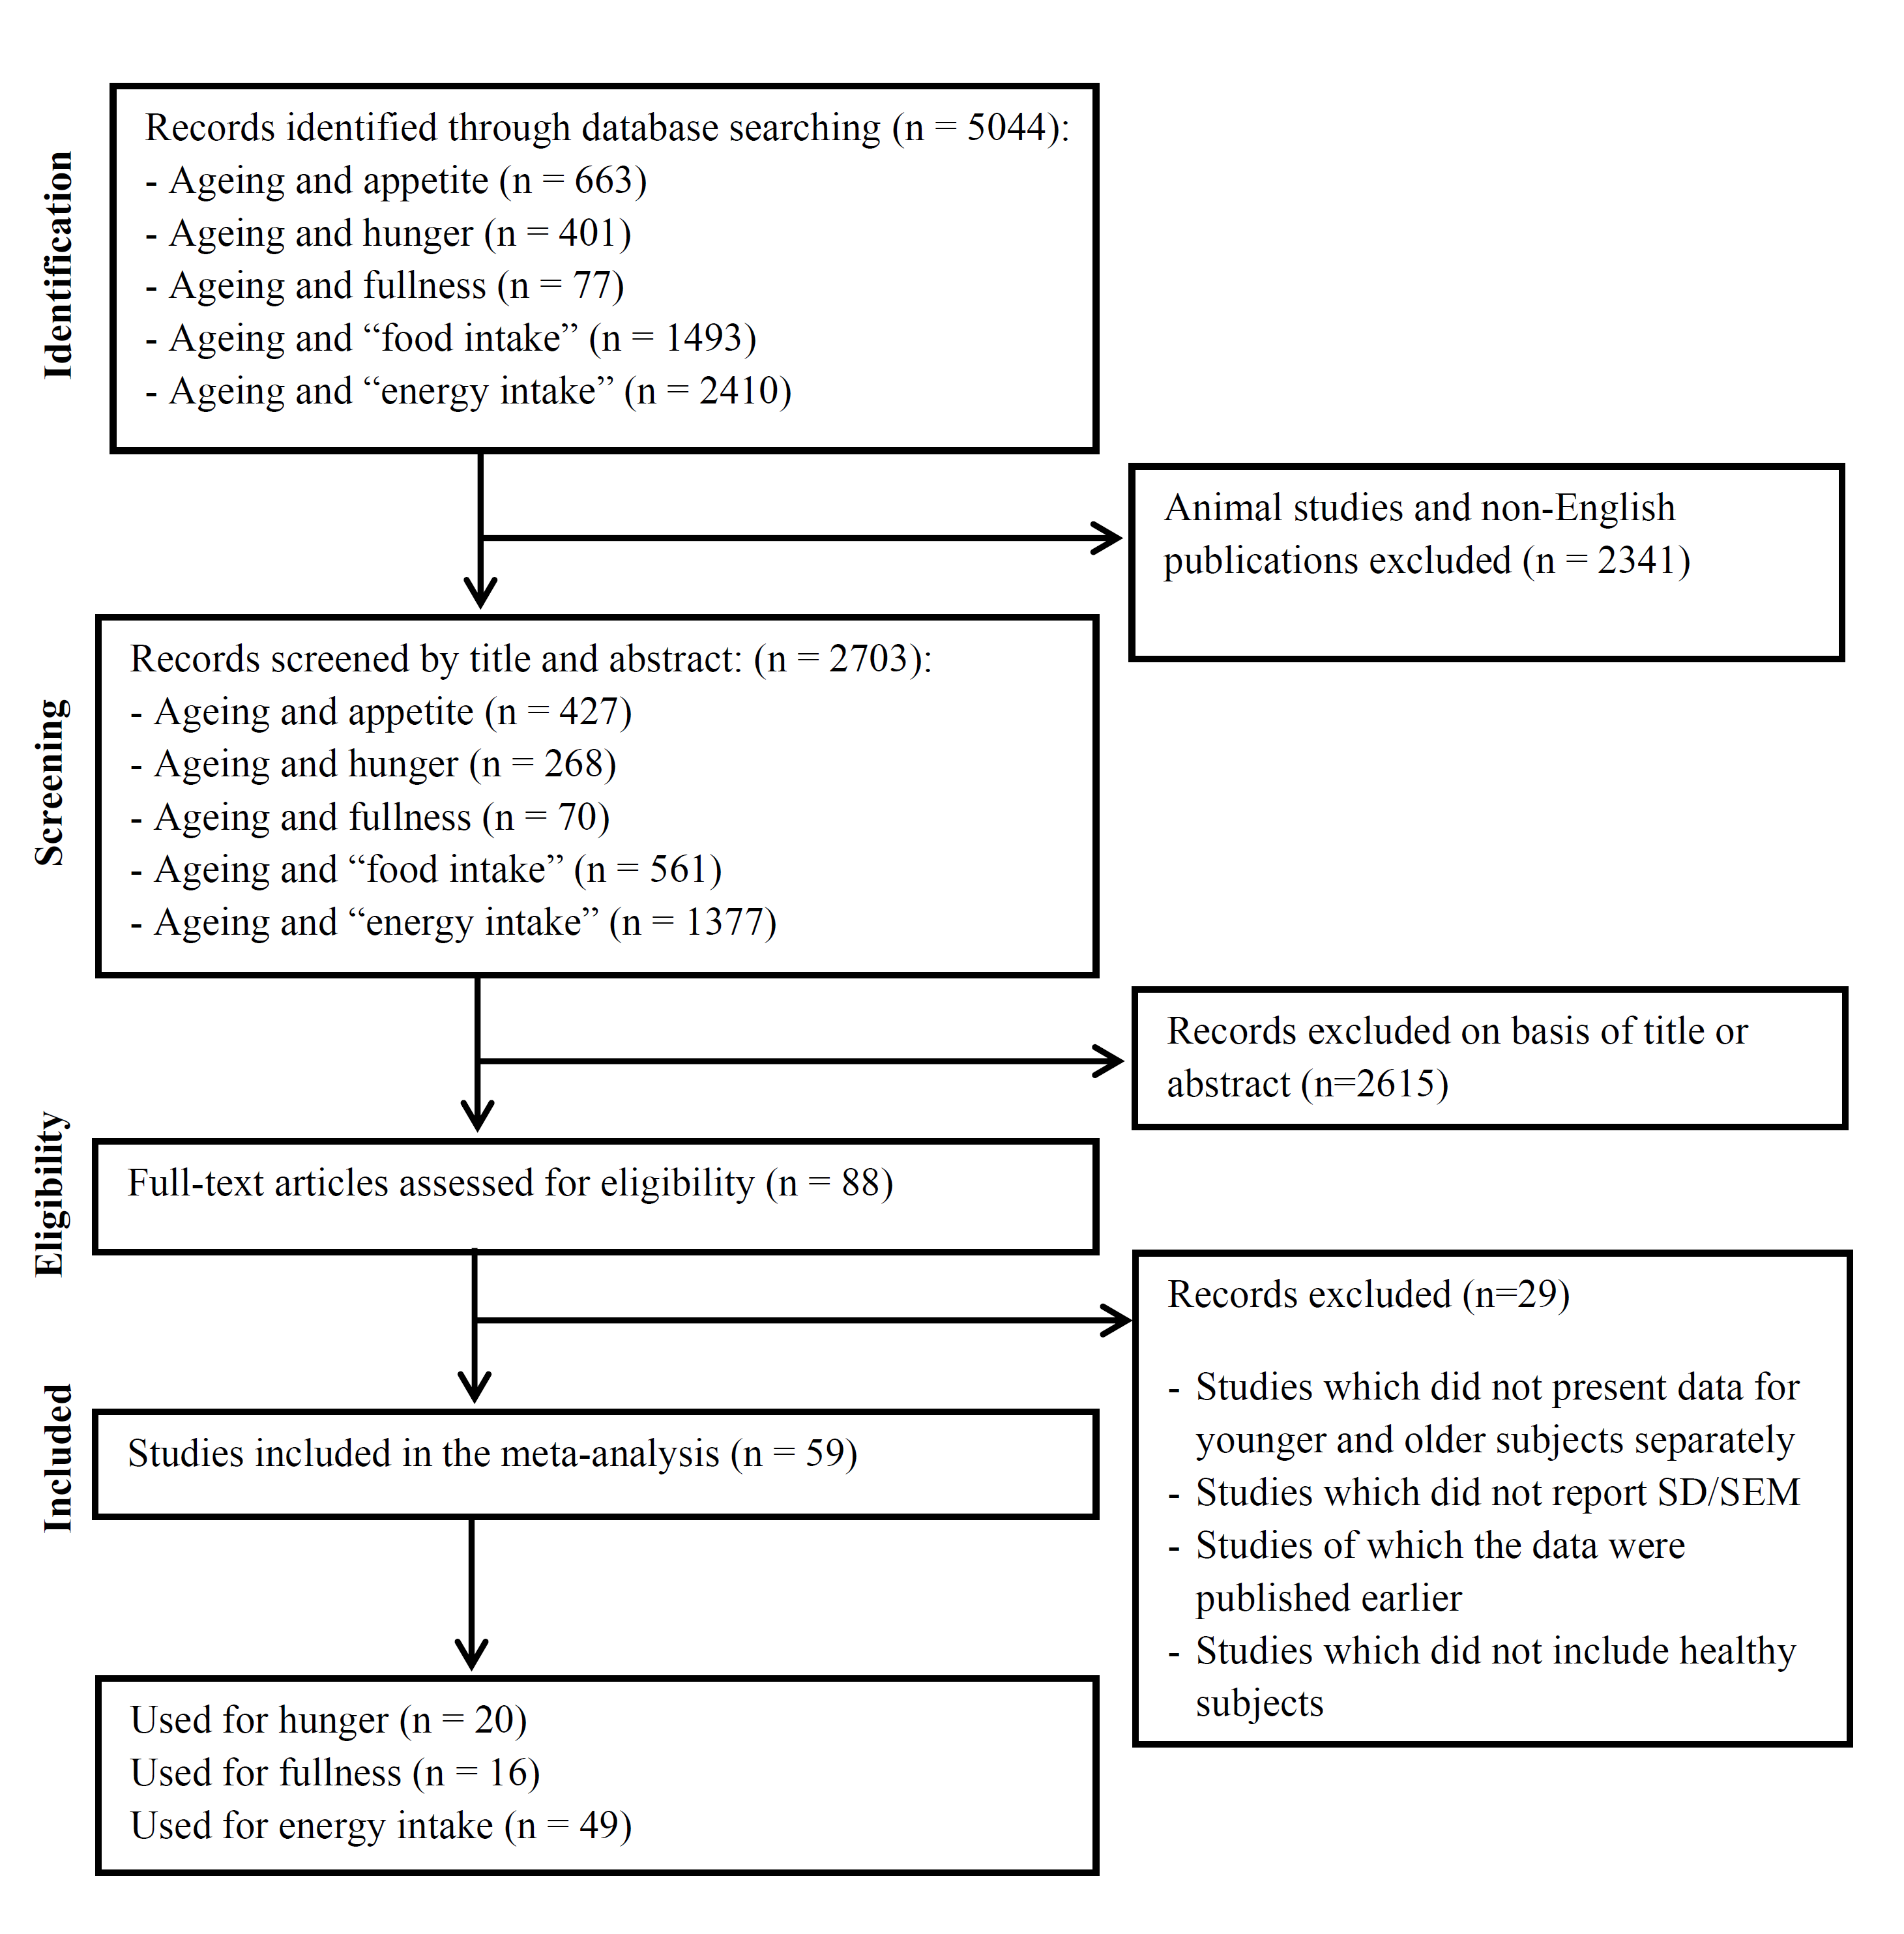
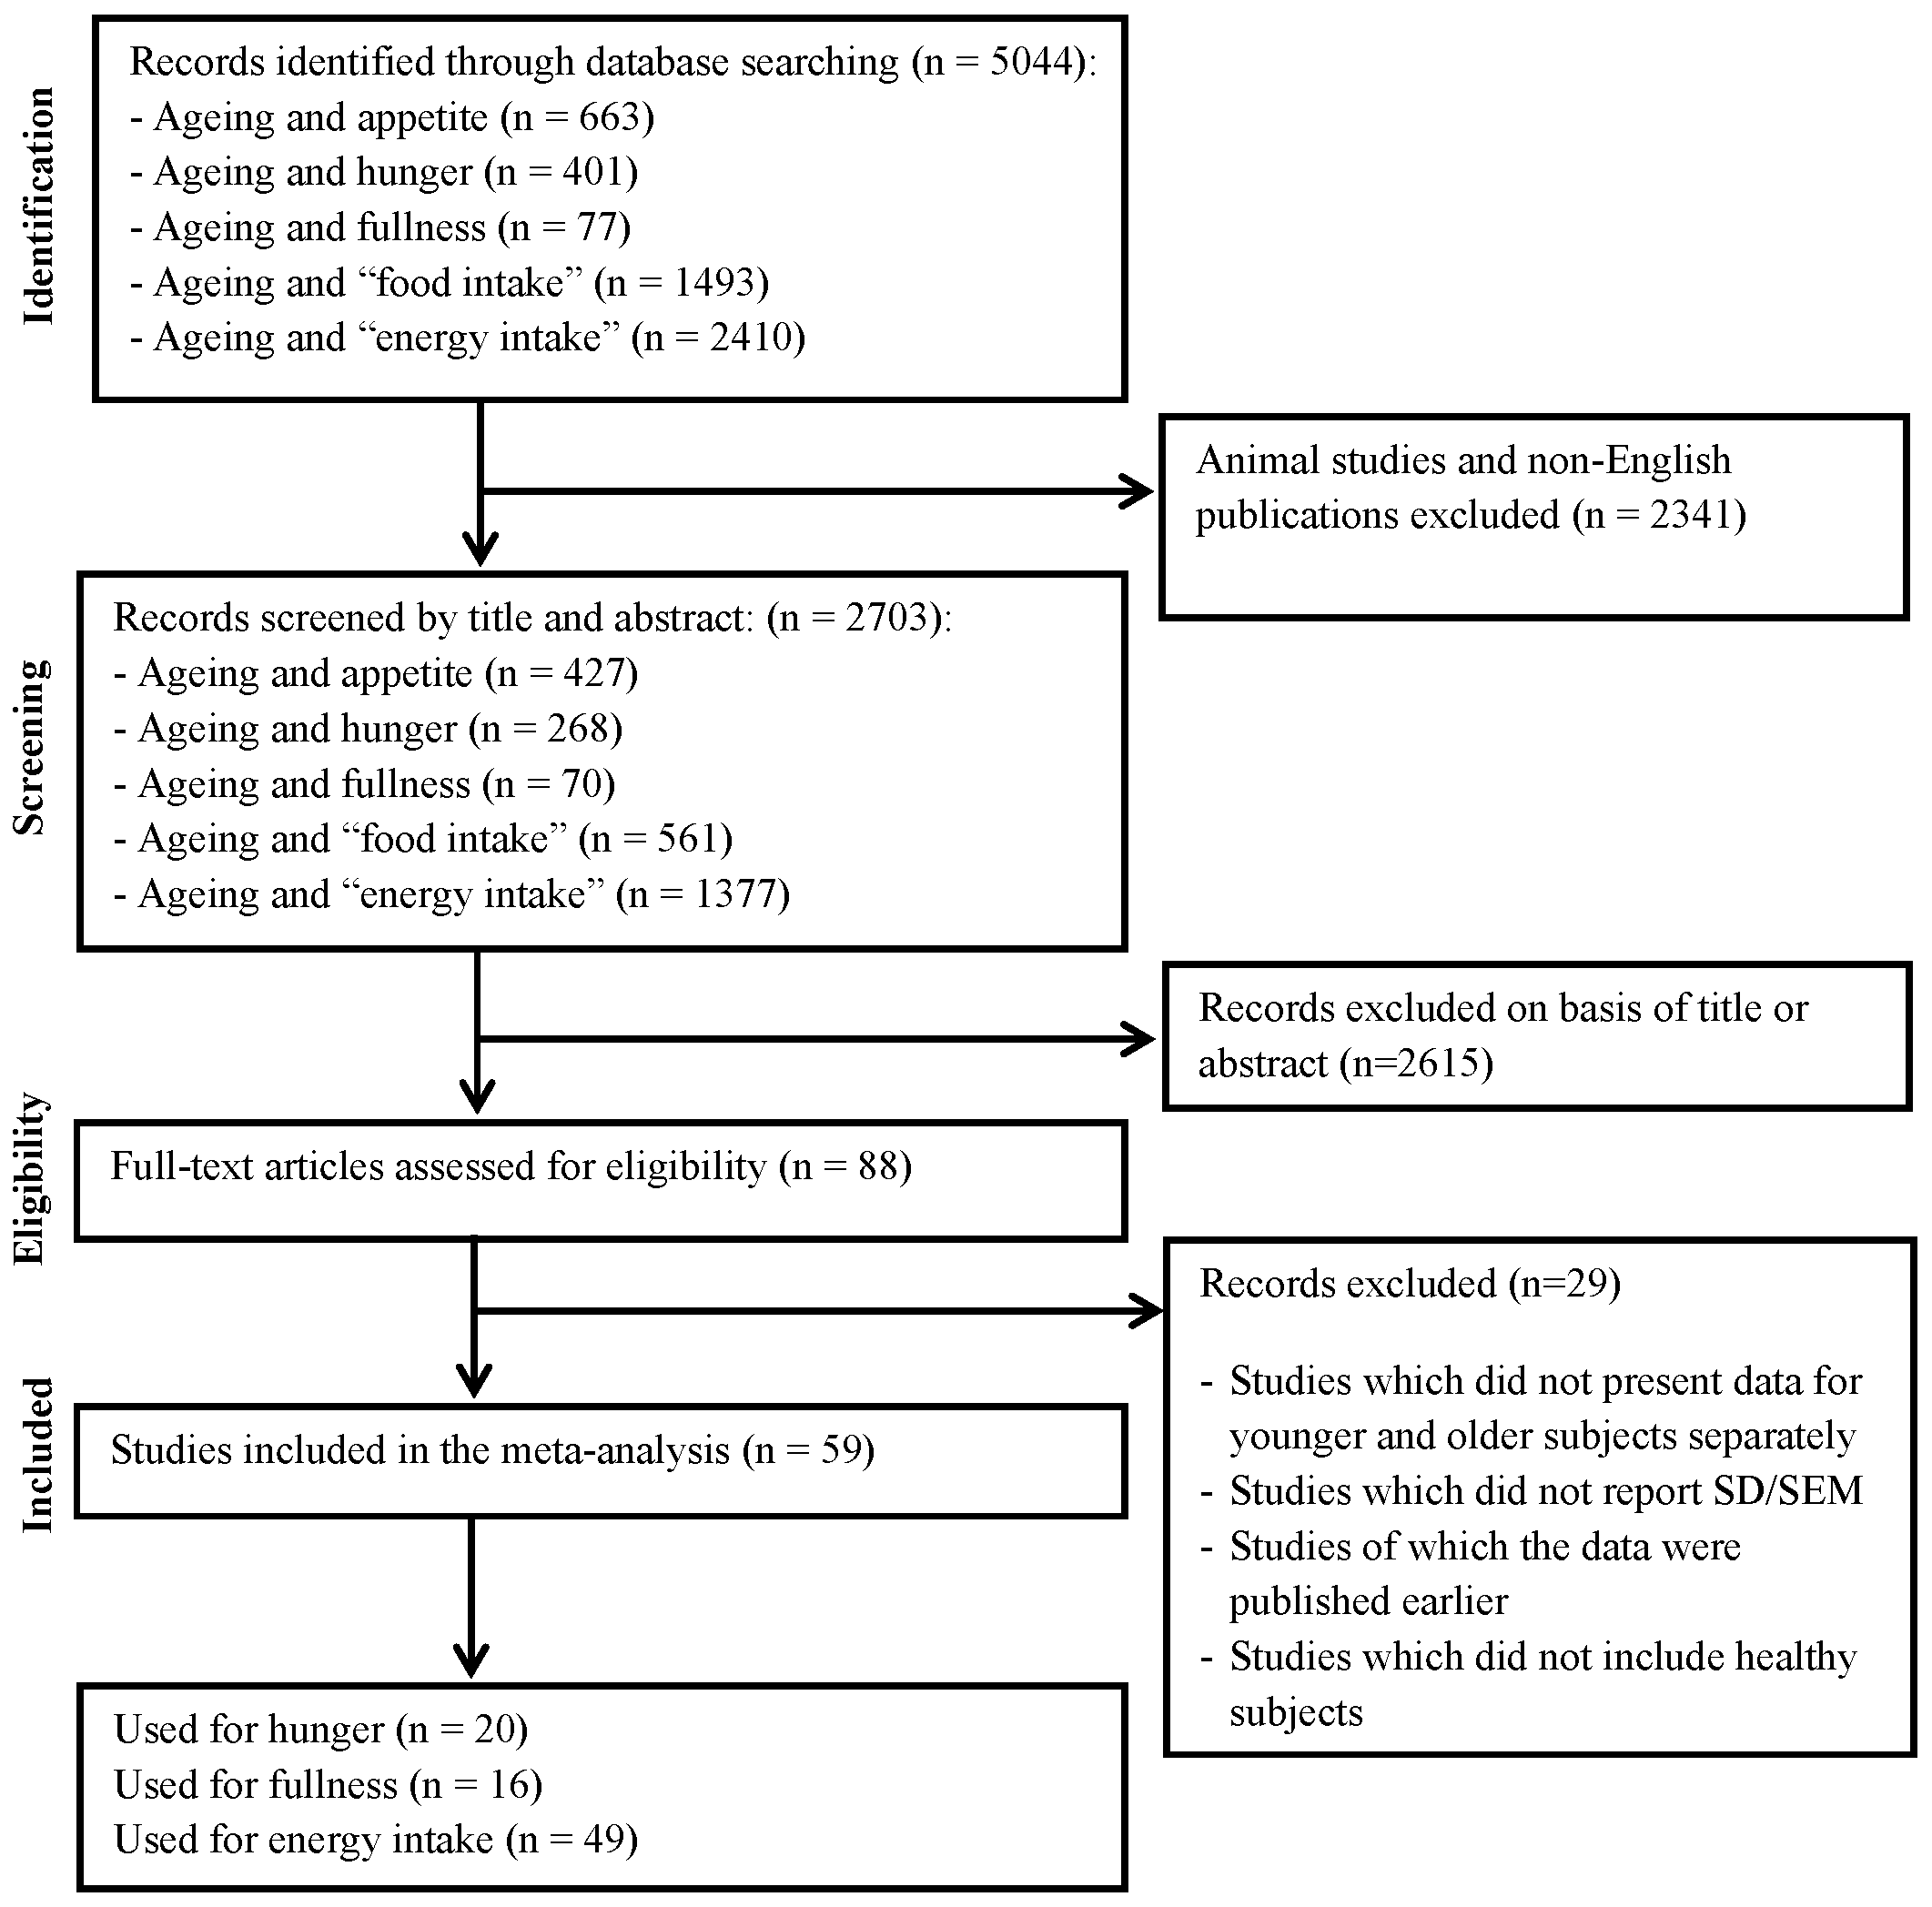
2.1. Search Strategy, Study Selection, Data Extraction and Quality Assessment
2.2. Data Analysis

| Study (No in References) | N Young/Older | Age (Years) Young/Older | Mean Body Mass (kg) Young/Older | Mean BMI (kg/m2) Young/Older | Outcomes Used for Meta-Analysis |
|---|---|---|---|---|---|
| Alam et al. 2012 [26] | 131/526 | 34 ± 9/69 ± 6 | 62.4 ± 13.5/63.5 ± 10.2 † | 23.2 ± 2.2/22.3 ± 1.7 † | Energy intake of 24-h food intake recalls |
| Apolzan et al. 2009 [27] | 24/32 | 25 ± 5/71 ± 6 | 75.5 ± 21.1/74.1 ± 18.7 † | 25.2 ± 3.9/26.0 ± 5.1 † | Energy intake of 24-h food intake recalls |
| Arciero et al. 2009 [28] | 0 M; 10 F/0 M; 10 F | 19 ± 2/55 ± 5 | 62.5 ± 7.3/72.1 ± 9.4 * | Energy intake of 3-day weighed food records | |
| Bell et al. 2003 [29] | 7 M; 5 F/12 M; 9 F | 23 ± 3/68 ± 5 | 70.4 ± 11.8/77.2 ± 13.7 † | 23.7 ± 2.4/26.6 ± 3.7 * | Energy intake of 4-day weighed food records |
| Cheng et al. 1978 [30] | 8 M; 0 F/7 M; 0 F | 26 ± 3/67 ± 5 | 66.5 ± 7.2/61.6 ± 11.3 † | Energy intake of weighed food records | |
| Church et al. 1984 [31] | 7 M; 8 F/6 M; 8 F | 20-35/36-53 | 45.0-95.3/52.6-85.4 | Energy intake of weighed food records | |
| Clarkston et al. 1997 [32] | 10 M; 9 F/5 M; 9 F | 30 ± 35/76 ± 19 | 25.3 ± 3.4/25.2 ± 1.7 † | Hunger/fullness during fasting and postprandial (456 kcal oral mixed nutrient preload) conditions | |
| Cook et al. 1997 [33], MacIntosh et al. 1999 [34] # | 7 M; 0 F/8 M; 0 F | 27 (20–34)/70 (65–75) | 26.8 (24.4–31.8)/25.8 (18.2–30) † | - Energy intake of 5-day weighed food records - Energy intake during postprandial conditions ‡ (348 kcal intraduodenal lipid infusion) - Hunger/fullness during fasting conditions | |
| Davy et al. 2001 [35] | 6 M; 0 F/5 M; 0 F | 25 ± 2/63 ± 7 | 79.0 ± 7.3/82.0 ± 8.9 † | Energy intake of 4-day weighed food records | |
| Di Francesco et al. 2010 [36] | 6 M; 6 F/5 M; 7 F | 28 ± 2/75 ± 6 | 18.9–26.5/21.1–28.3 † | Hunger during fasting and postprandial (800 kcal oral mixed nutrient preload) conditions ^ | |
| Di Francesco et al. 2006 [37] | 4 M; 4 F/4 M; 4 F | 30 ± 3/78 ± 3 | 22.7–25.7/22.1–29.4 † | Hunger/fullness during fasting and postprandial (800 kcal oral mixed nutrient preload) conditions | |
| Di Francesco et al. 2005 [38] | 5 M; 4 F/5 M; 5 F | 32 ± 8/77 ± 3 | 22.7–28.1/23.5–29.3 | Hunger/fullness during fasting and postprandial ‡ (800 kcal oral mixed nutrient preload) conditions | |
| Drewnowski et al. 1996 [39] | 12 M; 12 F/12 M; 12 F | 23 ± 1/67 ± 2 | 22.7 ± 1.0/24.5 ± 1.2 | Energy intake of 14-day weighed food records | |
| Flint et al. 2008 [40] | 16 M; 14 F/16 M; 14 F | 25 ± 4/68 ± 5 | 71.0 ± 10.4/73.8 ± 17.0 † | 24.6 ± 2.2/24.7 ± 2.2 † | Energy intake of 4-day weighed food records |
| Fukagawa et al. 1990 [20] | 6 M; 0 F/6 M; 0 F | 21 ± 2/72 ± 7 | Energy intake of 14-day dietary recalls | ||
| Giada et al. 1995 [41] | 24 M; 0 F/24 M; 0 F | 24 ± 4/57 ± 6 | 23.7 ± 2.4/26.8 ± 2.5 † | Energy intake of 7-day weighed food records | |
| Howarth et al. 2007 [42] | 1021 M; 771 F/491 M; 402 F | 39 ± 17/71 ± 12 | 25.2 ± 4.2/25.4 ± 6.0 † | Energy intake of 24-h food intake recalls | |
| Ishikawa et al. 1999 [43] | 53 M; 16 F/50 M; 32 F | 30-49/50-69 | 69.2 ± 10.4/62.9 ± 8.6 | 25.2 ± 3.0/25.0 ± 2.7 | Energy intake of 2-day weighed food records |
| Keene et al. 1998 [44] | 7 M; 5 F/4 M; 6 F | 25/75 | Energy intake during postprandial conditions ‡ (447 kcal oral mixed nutrient preload) | ||
| Kos et al. 1996 [45] | 0 M; 38 F/0 M; 17 F | 29 ± 3/59 ± 4 | 61.6 ± 9.7/57.4 ± 8.3 † | 21.7 ± 3.1/21.8 ± 2.8 † | Energy intake of 4-day weighed food records |
| Lieberman et al. 1989 [46] | 21 M; 20 F/21 M; 24 F | 26 (20–35)/73 (65–95) | Energy intake of 4-day weighed food records | ||
| Macintosh et al. 2001 [47] | 5 M; 7 F/5 M; 7 F | 23 (20-26)/72 (65-84) | 24.7 ± 2.4/25.0 ± 1.7 † | - Energy intake during fasting conditions ‡ - Energy intake of 3-day weighed food records - Hunger/fullness during fasting conditions | |
| Macintosh et al. 2001 [48] | 6 M; 6 F/6 M; 6 F | 23 ± 4/71 ± 5 | 23.5 ± 2.8/24.1 ± 2.4 † | - Energy intake during fasting conditions ‡ - Energy intake of 3-day weighed food records - Hunger during fasting conditions | |
| Macintosh et al. 2001 [49] | 13 M; 0 F/13 M; 0 F | 24 ± 5/72 ± 6 | 23.9 ± 2.2/23.5 ± 3.6 † | - Energy intake during postprandial conditions ‡ (347 kcal intraduodenal lipid infusion) - Energy intake of 3-day weighed food records - Hunger/fullness during postprandial conditions ‡ (347 kcal intraduodenal lipid preload) | |
| McGandy et al. 1966 [50] | 13 M; 0 F/37 M; 0 F | 20-34/75-99 | 74.5 ± 1.2/70.9 ± 1.0 | Energy intake of 7-day weighed food records | |
| Morais et al. 2000 [51] | 4 M; 3 F/3 M; 5 F | 28 ± 5/72 ± 3 | 63.5 ± 10.6/64.2 ± 10.2 † | 21.4 ± 2.1/24.8 ± 3.1 * | Energy intake of 6-day weighed food records |
| Morais et al. 1997 [52] | 8 M; 7 F/8 M; 8 F | 28 ± 5/73 ± 5 | 62.6 ± 7.4/64.1 ± 8.7 † | 21.2 ± 1.8/23.8 ± 3.2 * | Energy intake of 6-day weighed food records |
| Moriguti et al. 2000 [53] | 5 M; 6 F/9 M; 9 F | 26 ± 3/68 ± 3 | 65.6 ± 9.6/80.0 ± 14.9 * | 23.2 ± 1.6/27.5 ± 3.4 * | Energy intake of provided food items (7 days) |
| Nagengast et al. 1988 [54] | 5 M; 6 F/6 M; 5 F | 22 ± 6/67 ± 5 | 67.6 ± 5.0/69.1 ± 12.3 † | Food intake recalls | |
| Poehlman et al. 1990 [55] | 42 M; 0 F/26 M; 0 F | 25 ± 5/67 ± 5 | 75.5 ± 10.7/78.4 ± 7.6 † | Energy intake of 3-day weighed food records | |
| Polito et al. 2005 [56] | 48 M; 47 F/103 M; 96 F | 61 ± 4/74 ± 4 | 71.5 ± 8.1/67.9 ± 9.0 | 26.1 ± 2.4/25.3 ± 2.7 | Energy intake of 4-day weighed food records |
| Rayner et al. 2000 [57] | 5 M; 0 F/5 M; 0 F | 23 (22–27)/71 (68–73) | 24.4 (20.7–31.2)/25.6 (22.4–30.7) | - Energy intake during fasting conditions ‡ - Hunger/fullness during fasting conditions ^ | |
| Roberts et al. 1996 [58] | 7 M; 0 F/9 M; 0 F | 24 ± 1/70 ± 7 | 76.2 ± 12.4/72.9 ± 9.3 † | 23.9 ± 3.4/23.4 ± 3.3 † | Energy intake of provided food items (10 days) |
| Roberts et al. 1994; 1995 [22,59] # | 17 M; 0 F/18 M; 0 F | 23 ± 2/68 ± 6 | 71.6 ± 11.1/78.8 ± 12.6 | 23.4 ± 2.6/25.2 ± 3.6 | Energy intake of provided food items (7 days) |
| Rolls et al. 1995 [60] | 16 M; 0 F/16 M; 0 F | 24 ± 5/69 ± 6 | 74.0 ± 7.2/84.3 ± 12.8 * | 22.7 ± 2.0/26.2 ± 3.6 * | - Energy intake during fasting and postprandial (510 kcal oral mixed nutrient preload) conditions - Hunger/fullness during fasting and postprandial ‡ (510 kcal oral mixed nutrient preload) conditions |
| Rolls et al. 1991 [61] | 12 M; 12 F/12 M; 12 F | 26 ± 4/75 ± 5 | 68.9 ± 3.0/66.0 ± 3.2 | 23.5 ± 3.0/24.1 ± 2.8 | Hunger/fullness during fasting conditions |
| Sawaya et al. 2001 [62] | 9 M; 0 F/10 M; 0 F | 23 ± 1/69 ± 1 | 72.9 ± 2.7/74.7 ± 3.4 † | 22.7 ± 0.5/24.4 ± 0.9 † | Hunger during fasting conditions |
| Sawaya et al. 1996 [63] | 0 M; 10 F/0 M; 10 F | 25 ± 4/74 ± 4 | 54.8 ± 4.1/58.7 ± 9.8 † | 20.9 ± 1.9/24.1 ± 2.8 * | Energy intake of 7-day weighed food records |
| Schneider et al. 2008 [64] | 5 M; 5 F/3 M; 6 F | 34 ± 8/76 ± 9 | 22.5 ± 2.9/23.6 ± 1.8 † | Hunger/fullness during fasting conditions ‡ | |
| Serra-Prat et al. 2013 [65] | 7 M; 12 F/13 M;7 F | 38 ± 11/81 ± 8 | 67.3 ± 9.0/72.6 ± 16.2 | 23.7 ± 2.8/27.9 ± 4.9 † | - Hunger during fasting and postprandial ‡ (400 kcal oral mixed nutrient preload) conditions |
| Serra-Prat et al. 2009 [66] | 7 M; 10 F/6 M; 4 F | 40 ± 10/80 ± 8 | 25.2 ± 3.3/26.7 ± 3.0 † | - Hunger during fasting and postprandial ‡ (380 kcal oral mixed nutrient preload) conditions | |
| Soenen et al. 2014 [23] | 10 M; 0 F/10 M; 0 F | 23 ± 4/74 ± 4 | 73 ± 7/79 ± 7 † | 22 ± 2/26 ± 2 * | - Energy intake during fasting and postprandial (180 kcal intraduodenal protein infusion) - Hunger/fullness during fasting and postprandial (180 kcal intraduodenal protein infusion) conditions |
| Stafleu et al. 1994 [67] | 0 M; 97 F/0 M; 97 F | 25 ± 3/76 ± 6 | 64.2 ± 10.6/70.5 ± 10.7 | 22.5 ± 3.5/26.8 ± 4.1 | Energy intake of food frequency questionnaires |
| Sturm et al. 2004 [68] | 6 M; 6 F/6 M; 6 F | 24 ± 1/74 ± 1 | 23.2 ± 2.1/24.1 ± 3.5 † | - Energy intake during fasting and postprandial ‡ (750 kcal oral mixed nutrient preload) conditions - Energy intake of 3-day weighed food records - Hunger/fullness during fasting and postprandial ‡ (750 kcal oral mixed nutrient preload) conditions | |
| Sturm et al. 2003 [69] | 0 M; 8 F/0 M; 8 F | 22 ± 4/77 ± 3 | 57.5 ± 5.4/58.0 ± 5.9 † | 20.5 ± 1.1/23.7 ± 2.3 * | - Energy intake during fasting and postprandial (280 kcal oral mixed nutrient preload) conditions - Energy intake of 3-day weighed food records - Hunger/fullness during fasting and postprandial (280 kcal oral mixed nutrient preload) conditions ‡ |
| Surrao et al. 1998 [70] | 0 M; 10 F/0 M; 10 F | 25 ± 4/74 ± 4 | 54.8 ± 4.1/58.7 ± 9.8 † | 20.9 ± 1.9/24.1 ± 2.5 * | Energy intake of a 7-day weighed food record |
| Temme et al. 2010 [71] | 413 M; 460 F/389 M; 355 F | Energy intakes of 24-h food intake recalls and food frequency questionnaires | |||
| Toth et al. 1996 [72] | 18 M; 0 F/30 M; 0 F | 23 ± 4/69 ± 5 | 79 ± 8/75 ± 5 † | Energy intake of 3-day weighed food records | |
| Van Pelt et al. 2001 [73] | 71 M; 0 F/66 M; 0 F | 27 ± 8/62 ± 8 | 75.1 ± 16.0/77.4 ± 16.2 | 23.4 ± 4.7/25.1 ± 4.4 | Energy intake of 4-day weighed food records |
| Van Walleghen et al. 2007 [74] | 14 M; 15 F/11 M; 10 F | 25 ± 5/69 ± 9 | 67.9 ± 1.7/70.8 ± 2.9 | 23.3 ± 3.7/24.7 ± 3.2 | - Energy intake during fasting conditions ‡ - Energy intake of 4-day weighed food records - Hunger/fullness during fasting conditions |
| Van Walleghen et al. 2007 [75] | 14 M; 15 F/13 M; 12 F | 24 ± 5/68 ± 10 | 67.6 ± 15.5/71.1 ± 16.5 | 23.3 ± 4.3/24.6 ± 3.8 | - Energy intake during fasting and postprandial (476 kcal for males and 360 kcal for females oral mixed nutrient preloads) conditions - Energy intake of 4-day weighed food records - Hunger/fullness during fasting and postprandial (476 kcal for males and 360 kcal for females oral mixed nutrient preload) conditions ‡ - Hunger/fullness during fasting conditions |
| Vaughan et al. 1991 [21] | 33 M; 31 F/17 M; 21 F | 24 ± 4/71 ± 6 | 84.5 ± 23.1/71.2 ± 13.5 * | Energy intake of provided food items (1 day) | |
| Winkels et al. 2010 [76] | 15 M; 0 F/17 M; 0 F | 24 (20–34)/68(64–85) | 75.8 ± 11.3/75.8 ± 7.6 | 23.0 ± 2.3/24.5 ± 1.9 | Energy intake of provided food items (14 days) |
| Wolk et al. 2004 [77] | 72 M; 0 F/94 M; 0 F | 42–54/65–76 | 25.6 ± 2.7/26.5 ± 3.7 | Energy intake of 24-h food intake recalls | |
| Wright et al. 1995 [78] | 41 M; 42 F/28 M; 43 F | 20–64/74–90 | 70.1 ± 10.4/64.8 ± 10.1 | Energy intake of 7-day weighed food records | |
| Wurtman et al. 1988 [79] | 21 M; 20 F/21 M; 24 F | 26 (19–35)/72 (65–94) | Energy intake of provided food items (5 days) | ||
| Yukawa et al. 2006 [80] | 8 M; 13 F/7 M; 11 F | 25 ± 5/75 ± 4 | 72.9 ± 12.4/73.6 ± 12.7 † | 24.7 ± 3.0/26.9 ± 3.0 * | Energy intake of provided food items (14 days) |
| Zandstra et al. 2000 [81] | 5 M; 28 F/6 M; 18 F | 22 ± 2/76 ± 5 | 71.0 ± 9.6/72.4 ± 8.9 | 23.3 ± 2.3/26.6 ± 3.5 | Energy intake during fasting and postprandial (502 kcal for young subjects) or 430 kcal for older subjects oral mixed nutrient preload) conditions ‡ |
| Zhou et al. 2013 [82] | 49 M; 10 F/15 M; 21 F | 20–29/50–59 | 59.0 ± 10.8/69.0 ± 12.3 | 21.7 ± 3.0/24.6 ± 3.1 | Fullness during fasting and postprandial (896 kcal oral mixed nutrient preload) conditions |
3. Results
3.1. Effect of Age on Energy Intake
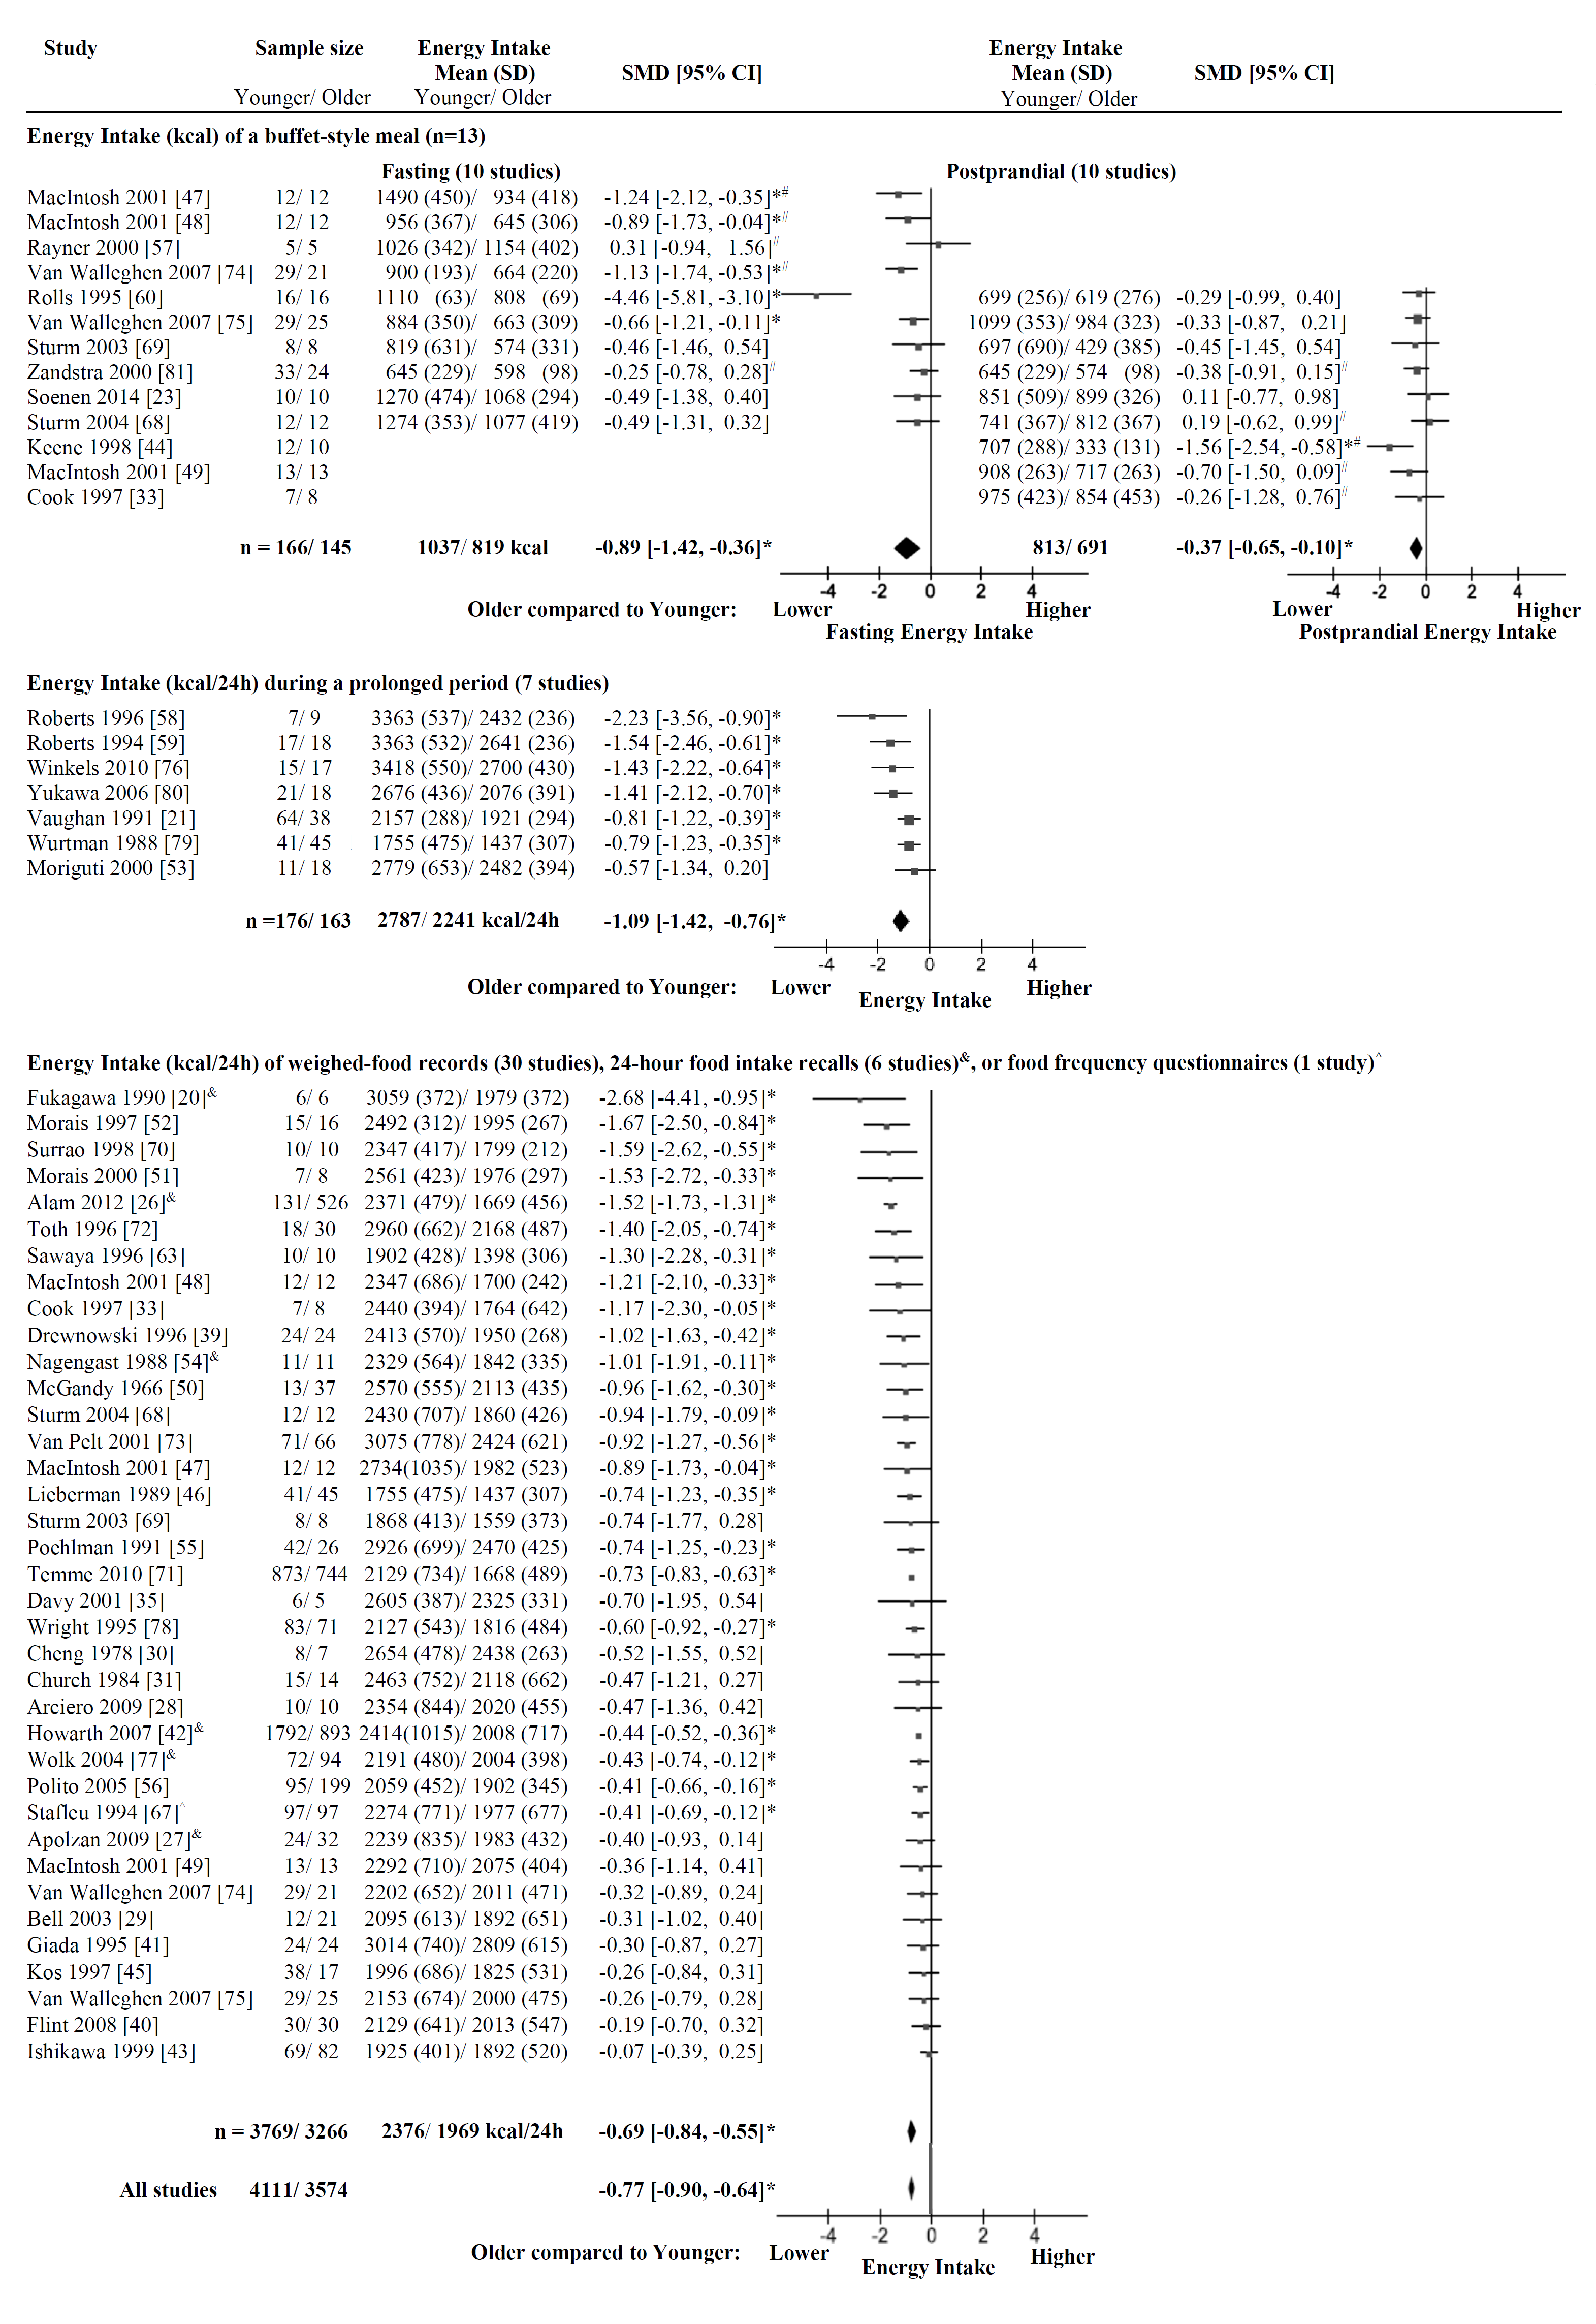
3.1.1. Energy Intake in the Total Group

3.1.2. Energy Intake of a Buffet-Style Meal
3.1.3. Energy Intake during a Prolonged Period
3.1.4. Energy Intake of Weighed-Food Records, 24-h Food Intake Recalls, or Food Frequency Questionnaires
3.2. Effect of Age on Appetite
3.2.1. Hunger
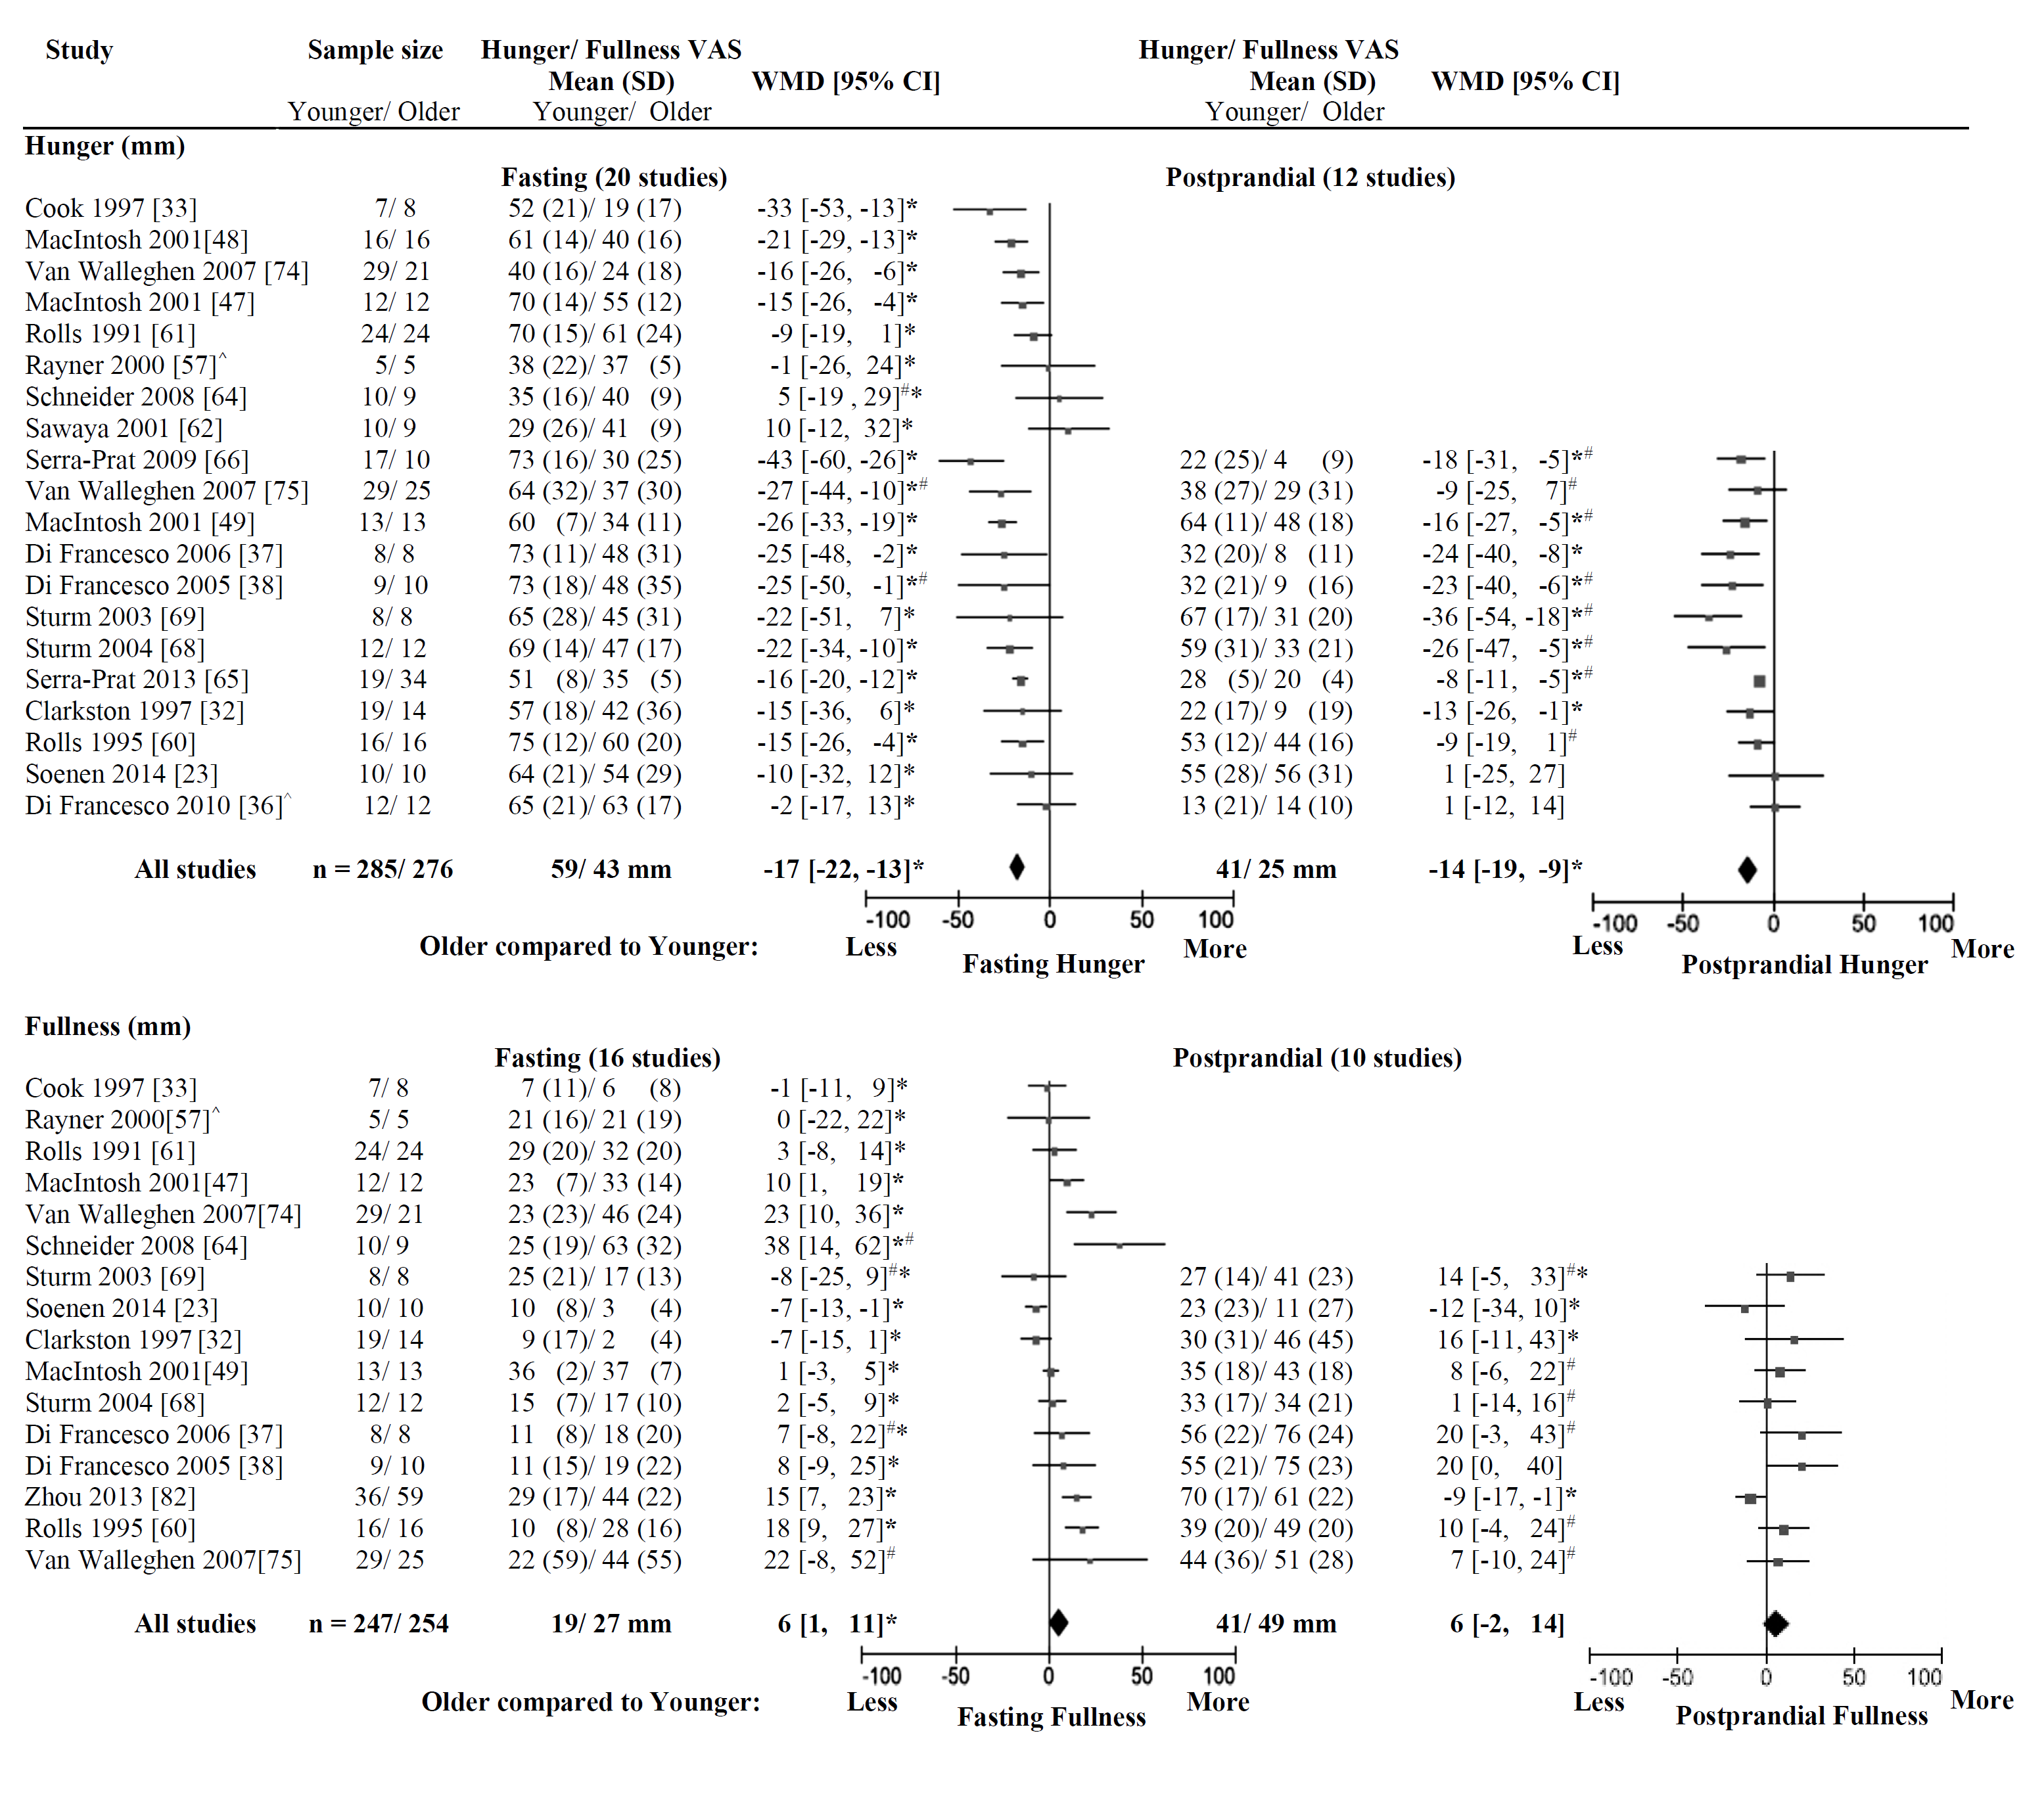
3.2.2. Fullness
4. Discussion
5. Conclusions
Acknowledgments
Author Contributions
Conflicts of Interest
References
- Australian Institute of Health and Welfare (AIHW). Australia's Health; Ausrtalia’s Health Series No. 14. Cat. No. AUS 178; AIHW: Canberra, Australia, 2014.
- Thibault, R.; Chikhi, M.; Clerc, A.; Darmon, P.; Chopard, P.; Genton, L.; Kossovsky, M.P.; Pichard, C. Assessment of food intake in hospitalised patients: A 10-year comparative study of a prospective hospital survey. Clin. Nutr. 2011, 30, 289–296. [Google Scholar] [CrossRef] [PubMed]
- Koehler, K.M. The New Mexico aging process study. Nutr. Rev. 1994, 52, S34–S37. [Google Scholar] [CrossRef] [PubMed]
- Sjogren, A.; Osterberg, T.; Steen, B. Intake of energy, nutrients and food items in a ten-year cohort comparison and in a six-year longitudinal perspective: A population study of 70- and 76-year-old swedish people. Age Ageing 1994, 23, 108–112. [Google Scholar] [CrossRef] [PubMed]
- Briefel, R.R.; McDowell, M.A.; Alaimo, K.; Caughman, C.R.; Bischof, A.L.; Carroll, M.D.; Johnson, C.L. Total energy intake of the us population: The third national health and nutrition examination survey, 1988–1991. Am. J. Clin. Nutr. 1995, 62, 1072S–1080S. [Google Scholar] [PubMed]
- Wallace, J.I.; Schwartz, R.S.; LaCroix, A.Z.; Uhlmann, R.F.; Pearlman, R.A. Involuntary weight loss in older outpatients: Incidence and clinical significance. J. Am. Geriatr. Soc. 1995, 43, 329–337. [Google Scholar] [CrossRef] [PubMed]
- Newman, A.B.; Yanez, D.; Harris, T.; Duxbury, A.; Enright, P.L.; Fried, L.P. Cardiovascular Study Research Group. Weight change in old age and its association with mortality. J. Am. Geriatr. Soc. 2001, 49, 1309–1318. [Google Scholar] [CrossRef] [PubMed]
- Schoenborn, C.A.; Adams, P.F.; Barnes, P.M. Body weight status of adults: United States, 1997–1998. Adv. Data 2002, 330, 1–15. [Google Scholar] [PubMed]
- Somes, G.W.; Kritchevsky, S.B.; Shorr, R.I.; Pahor, M.; Applegate, W.B. Body mass index, weight change, and death in older adults: The systolic hypertension in the elderly program. Am. J. Epidemiol. 2002, 156, 132–138. [Google Scholar] [CrossRef] [PubMed]
- Rolland, Y.; Abellan van Kan, G.; Gillette-Guyonnet, S.; Vellas, B. Cachexia versus sarcopenia. Curr. Opin. Clin. Nutr. Metab. Care 2011, 14, 15–21. [Google Scholar] [CrossRef] [PubMed]
- Rizza, W.; Veronese, N.; Fontana, L. What are the roles of calorie restriction and diet quality in promoting healthy longevity? Ageing Res. Rev. 2014, 13, 38–45. [Google Scholar] [CrossRef] [PubMed]
- Sohal, R.S.; Forster, M.J. Caloric restriction and the aging process: A critique. Free Radic. Biol. Med. 2014, 73, 366–382. [Google Scholar] [CrossRef] [PubMed]
- Evans, W.J.; Campbell, W.W. Sarcopenia and age-related changes in body composition and functional capacity. J. Nutr. 1993, 123, 465–468. [Google Scholar] [PubMed]
- Al Snih, S.; Ottenbacher, K.J.; Markides, K.S.; Kuo, Y.F.; Eschbach, K.; Goodwin, J.S. The effect of obesity on disability vs. mortality in older americans. Arch. Intern. Med. 2007, 167, 774–780. [Google Scholar] [CrossRef] [PubMed]
- Chapman, I.M. Weight loss in older persons. Med. Clin. N. Am. 2011, 95, 579–593. [Google Scholar] [CrossRef] [PubMed]
- Zhu, K.; Devine, A.; Suleska, A.; Tan, C.Y.; Toh, C.Z.J.; Kerr, D.; Prince, R.L. Adequacy and change in nutrient and food intakes with aging in a seven-year cohort study in elderly women. J. Nutr. Health Aging 2010, 14, 723–729. [Google Scholar] [CrossRef] [PubMed]
- Speakman, J.R.; Westerterp, K.R. Associations between energy demands, physical activity, and body composition in adult humans between 18 and 96 years of age. Am. J. Clin. Nutr. 2010, 92, 826–834. [Google Scholar] [CrossRef] [PubMed]
- Morley, J.E.; Silver, A.J. Anorexia in the elderly. Neurobiol. Aging 1988, 9, 9–16. [Google Scholar] [CrossRef]
- Soenen, S.; Chapman, I.M. Body weight, anorexia, and undernutrition in older people. J. Am. Med. Dir. Assoc. 2013, 14, 642–648. [Google Scholar] [CrossRef] [PubMed]
- Fukagawa, N.K.; Bandini, L.G.; Young, J.B. Effect of age on body composition and resting metabolic rate. Am. J. Physiol. 1990, 259, E233–E238. [Google Scholar] [PubMed]
- Vaughan, L.; Zurlo, F.; Ravussin, E. Aging and energy expenditure. Am. J. Clin. Nutr. 1991, 53, 821–825. [Google Scholar] [PubMed]
- Roberts, S.B.; Fuss, P.; Heyman, M.B.; Young, V.R. Influence of age on energy requirements. Am. J. Clin. Nutr. 1995, 62, 1053S–1058S. [Google Scholar] [PubMed]
- Soenen, S.; Giezenaar, C.; Hutchison, A.T.; Horowitz, M.; Chapman, I.; Luscombe-Marsh, N.D. Effects of intraduodenal protein on appetite, energy intake, and antropyloroduodenal motility in healthy older compared with young men in a randomized trial. Am. J. Clin. Nutr. 2014, 100, 1108–1115. [Google Scholar] [CrossRef] [PubMed]
- Moher, D.; Liberati, A.; Tetzlaff, J.; Altman, D.G.; Group, P. Preferred reporting items for systematic reviews and meta-analyses: The prisma statement. J. Clin. Epidemiol. 2009, 62, 1006–1012. [Google Scholar] [CrossRef] [PubMed]
- Higgins, J.P.; Green, S. (Eds.) Cochrane Handbook for Systematic Reviews of Interventions 5.1.0; The Cochrane Collaboration: London, UK, 2011.
- Alam, I.; Alam, I.; Paracha, P.I.; Pawelec, G. Higher estimates of daily dietary net endogenous acid production (NEAP) in the elderly as compared to the young in a healthy, free-living elderly population of Pakistan. Clin. Interv. Aging 2012, 7, 565–573. [Google Scholar] [CrossRef] [PubMed]
- Apolzan, J.W.; Flynn, M.G.; McFarlin, B.K.; Campbell, W.W. Age and physical activity status effects on appetite and mood state in older humans. Appl. Physiol. Nutr. Metab. 2009, 34, 203–211. [Google Scholar] [CrossRef] [PubMed]
- Arciero, P.J.; Ormsbee, M.J. Relationship of blood pressure, behavioral mood state, and physical activity following caffeine ingestion in younger and older women. Appl. Physiol. Nutr. Metab. 2009, 34, 754–762. [Google Scholar] [CrossRef] [PubMed]
- Bell, C.; Jones, P.P.; Seals, D.R. Oxidative stress does not modulate metabolic rate or skeletal muscle sympathetic activity with primary aging in adult humans. J. Clin. Endocrinol. Metab. 2003, 88, 4950–4954. [Google Scholar] [CrossRef] [PubMed]
- Cheng, A.H.; Gomez, A.; Bergan, J.G.; Lee, T.C.; Monckeberg, F.; Chichester, C.O. Comparative nitrogen balance study between young and aged adults using three levels of protein intake from a combination wheat-soy-milk mixture. Am. J. Clin. Nutr. 1978, 31, 12–22. [Google Scholar] [PubMed]
- Church, J.P.; Judd, J.T.; Young, C.W.; Kelsay, J.L.; Kim, W.W. Relationships among dietary constituents and specific serum clinical components of subjects eating self-selected diets. Am. J. Clin. Nutr. 1984, 40, 1338–1344. [Google Scholar] [PubMed]
- Clarkston, W.K.; Pantano, M.M.; Morley, J.E.; Horowitz, M.; Littlefield, J.M.; Burton, F.R. Evidence for the anorexia of aging: Gastrointestinal transit and hunger in healthy elderly vs. young adults. Am. J. Physiol. 1997, 272, R243–R248. [Google Scholar] [CrossRef] [PubMed]
- Cook, C.G.; Andrews, J.M.; Jones, K.L.; Wittert, G.A.; Chapman, I.M.; Morley, J.E.; Horowitz, M. Effects of small intestinal nutrient infusion on appetite and pyloric motility are modified by age. Am. J. Physiol. Regul. Integr. Comp. Physiol. 1997, 273, R755–R761. [Google Scholar]
- MacIntosh, C.G.; Andrews, J.M.; Jones, K.L.; Wishart, J.M.; Morris, H.A.; Jansen, J.B.; Morley, J.E.; Horowitz, M.; Chapman, I.M. Effects of age on concentrations of plasma cholecystokinin, glucagon-like peptide 1, and peptide YY and their relation to appetite and pyloric motility. Am. J. Clin. Nutr. 1999, 69, 999–1006. [Google Scholar] [PubMed]
- Davy, K.P.; Horton, T.; Davy, B.M.; Bessessen, D.; Hill, J.O. Regulation of macronutrient balance in healthy young and older men. Int. J. Obes. Relat. Metab. Disord. 2001, 25, 1497–1502. [Google Scholar] [CrossRef] [PubMed]
- Di Francesco, V.; Barazzoni, R.; Bissoli, L.; Fantin, F.; Rizzotti, P.; Residori, L.; Antonioli, A.; Graziani, M.S.; Zanetti, M.; Bosello, O.; et al. The quantity of meal fat influences the profile of postprandial hormones as well as hunger sensation in healthy elderly people. J. Am. Med. Dir. Assoc. 2010, 11, 188–193. [Google Scholar] [CrossRef] [PubMed]
- Di Francesco, V.; Zamboni, M.; Zoico, E.; Mazzali, G.; Dioli, A.; Omizzolo, F.; Bissoli, L.; Fantin, F.; Rizzotti, P.; Solerte, S.B.; et al. Unbalanced serum leptin and ghrelin dynamics prolong postprandial satiety and inhibit hunger in healthy elderly: Another reason for the “anorexia of aging”. Am. J. Clin. Nutr. 2006, 83, 1149–1152. [Google Scholar] [PubMed]
- Di Francesco, V.; Zamboni, M.; Dioli, A.; Zoico, E.; Mazzali, G.; Omizzolo, F.; Bissoli, L.; Solerte, S.B.; Benini, L.; Bosello, O. Delayed postprandial gastric emptying and impaired gallbladder contraction together with elevated cholecystokinin and peptide yy serum levels sustain satiety and inhibit hunger in healthy elderly persons. J. Gerontol. A Biol. Sci. Med. Sci. 2005, 60, 1581–1585. [Google Scholar] [CrossRef] [PubMed]
- Drewnowski, A.; Henderson, S.A.; Driscoll, A.; Rolls, B.J. Salt taste perceptions and preferences are unrelated to sodium consumption in healthy older adults. J. Am. Diet. Assoc. 1996, 96, 471–474. [Google Scholar] [CrossRef]
- Flint, K.M.; van Walleghen, E.L.; Kealey, E.H.; VonKaenel, S.; Bessesen, D.H.; Davy, B.M. Differences in eating behaviors between nonobese, weight stable young and older adults. Eat. Behav. 2008, 9, 370–375. [Google Scholar] [CrossRef] [PubMed]
- Giada, F.; Vigna, G.B.; Vitale, E.; Baldo-Enzi, G.; Bertaglia, M.; Crecca, R.; Fellin, R. Effect of age on the response of blood lipids, body composition, and aerobic power to physical conditioning and deconditioning. Metab. Clin. Exp. 1995, 44, 161–165. [Google Scholar] [CrossRef]
- Howarth, N.C.; Huang, T.T.; Roberts, S.B.; Lin, B.H.; McCrory, M.A. Eating patterns and dietary composition in relation to BMI in younger and older adults. Int. J. Obes. 2007, 31, 675–684. [Google Scholar] [CrossRef] [PubMed]
- Ishikawa, K.; Ohta, T.; Zhang, J.; Hashimoto, S.; Tanaka, H. Influence of age and gender on exercise training-induced blood pressure reduction in systemic hypertension. Am. J. Cardiol. 1999, 84, 192–196. [Google Scholar] [CrossRef]
- Keene, J.; Hope, T.; Rogers, P.J.; Elliman, N.A. An investigation of satiety in ageing, dementia, and hyperphagia. Int. J. Eat. Disord. 1998, 23, 409–418. [Google Scholar] [CrossRef]
- Kos, J.; Hasenfratz, M.; Battig, K. Effects of a 2-day abstinence from smoking on dietary, cognitive, subjective, and physiologic parameters among younger and older female smokers. Physiol. Behav. 1997, 61, 671–678. [Google Scholar] [CrossRef]
- Lieberman, H.R.; Wurtman, J.J.; Teicher, M.H. Aging, nutrient choice, activity, and behavioral responses to nutrients. Ann. N. Y. Acad. Sci. 1989, 561, 196–208. [Google Scholar] [CrossRef] [PubMed]
- MacIntosh, C.G.; Sheehan, J.; Davani, N.; Morley, J.E.; Horowitz, M.; Chapman, I.M. Effects of aging on the opioid modulation of feeding in humans. J. Am. Geriatr. Soc. 2001, 49, 1518–1524. [Google Scholar] [CrossRef] [PubMed]
- MacIntosh, C.G.; Morley, J.E.; Wishart, J.; Morris, H.; Jansen, J.B.; Horowitz, M.; Chapman, I.M. Effect of exogenous cholecystokinin (CCK)-8 on food intake and plasma CCK, leptin, and insulin concentrations in older and young adults: Evidence for increased CCK activity as a cause of the anorexia of aging. J. Clin. Endocrinol. Metab. 2001, 86, 5830–5837. [Google Scholar] [CrossRef] [PubMed]
- MacIntosh, C.G.; Horowitz, M.; Verhagen, M.A.; Smout, A.J.; Wishart, J.; Morris, H.; Goble, E.; Morley, J.E.; Chapman, I.M. Effect of small intestinal nutrient infusion on appetite, gastrointestinal hormone release, and gastric myoelectrical activity in young and older men. Am. J. Gastroenterol. 2001, 96, 997–1007. [Google Scholar] [CrossRef] [PubMed]
- McGandy, R.B.; Barrows, C.H., Jr.; Spanias, A.; Meredith, A.; Stone, J.L.; Norris, A.H. Nutrient intakes and energy expenditure in men of different ages. J. Gerontol. 1966, 21, 581–587. [Google Scholar] [CrossRef] [PubMed]
- Morais, J.A.; Ross, R.; Gougeon, R.; Pencharz, P.B.; Jones, P.J.H.; Marliss, E.B. Distribution of protein turnover changes with age in humans as assessed by whole-body magnetic resonance image analysis to quantify tissue volumes. J. Nutr. 2000, 130, 784–791. [Google Scholar] [PubMed]
- Morais, J.A.; Gougeon, R.; Pencharz, P.B.; Jones, P.J.; Ross, R.; Marliss, E.B. Whole-body protein turnover in the healthy elderly. Am. J. Clin. Nutr. 1997, 66, 880–889. [Google Scholar] [PubMed]
- Moriguti, J.C.; Das, S.K.; Saltzman, E.; Corrales, A.; McCrory, M.A.; Greenberg, A.S.; Roberts, S.B. Effects of a 6-week hypocaloric diet on changes in body composition, hunger, and subsequent weight regain in healthy young and older adults. J. Gerontol. A Biol. Sci. Med. Sci. 2000, 55, B580–B587. [Google Scholar] [CrossRef] [PubMed]
- Nagengast, F.M.; van der Werf, S.D.; Lamers, H.L.; Hectors, M.P.; Buys, W.C.; van Tongeren, J.M. Influence of age, intestinal transit time, and dietary composition on fecal bile acid profiles in healthy subjects. Dig. Dis. Sci. 1988, 33, 673–678. [Google Scholar] [CrossRef] [PubMed]
- Poehlman, E.T.; Melby, C.L.; Badylak, S.F. Relation of age and physical exercise status on metabolic rate in younger and older healthy men. J. Gerontol. 1991, 46, B54–B58. [Google Scholar] [CrossRef] [PubMed]
- Polito, A.; Intorre, F.; Andriollo-Sanchez, M.; Azzini, E.; Raguzzini, A.; Meunier, N.; Ducros, V.; O’Connor, J.M.; Coudray, C.; Roussel, A.M.; et al. Estimation of intake and status of vitamin A, vitamin E and folate in older European adults: The ZENITH. Eur. J. Clin. Nutr. 2005, 59 (Suppl. 2), S42–S47. [Google Scholar] [CrossRef] [PubMed]
- Rayner, C.K.; MacIntosh, C.G.; Chapman, I.M.; Morley, J.E.; Horowitz, M. Effects of age on proximal gastric motor and sensory function. Scand. J. Gastroenterol. 2000, 35, 1041–1047. [Google Scholar] [PubMed]
- Roberts, S.B.; Fuss, P.; Dallal, G.E.; Atkinson, A.; Evans, W.J.; Joseph, L.; Fiatarone, M.A.; Greenberg, A.S.; Young, V.R. Effects of age on energy expenditure and substrate oxidation during experimental overfeeding in healthy men. J. Gerontol. A Biol. Sci. Med. Sci. 1996, 51, B148–B157. [Google Scholar] [CrossRef] [PubMed]
- Roberts, S.B.; Fuss, P.; Heyman, M.B.; Evans, W.J.; Tsay, R.; Rasmussen, H.; Fiatarone, M.; Cortiella, J.; Dallal, G.E.; Young, V.R. Control of food intake in older men. JAMA 1994, 272, 1601–1606. [Google Scholar] [CrossRef] [PubMed]
- Rolls, B.J.; Dimeo, K.A.; Shide, D.J. Age-related impairments in the regulation of food intake. Am. J. Clin. Nutr. 1995, 62, 923–931. [Google Scholar]
- Rolls, B.J.; McDermott, T.M. Effects of age on sensory-specific satiety. Am. J. Clin. Nutr. 1991, 54, 988–996. [Google Scholar] [PubMed]
- Sawaya, A.L.; Fuss, P.J.; Dallal, G.E.; Tsay, R.; McCrory, M.A.; Young, V.; Roberts, S.B. Meal palatability, substrate oxidation and blood glucose in young and older men. Physiol. Behav. 2001, 72, 5–12. [Google Scholar] [CrossRef]
- Sawaya, A.L.; Tucker, K.; Tsay, R.; Willett, W.; Saltzman, E.; Dallal, G.E.; Roberts, S.B. Evaluation of four methods for determining energy intake in young and older women: Comparison with doubly labeled water measurements of total energy expenditure. Am. J. Clin. Nutr. 1996, 63, 491–499. [Google Scholar] [PubMed]
- Schneider, S.M.; al-Jaouni, R.; Caruba, C.; Giudicelli, J.; Arab, K.; Suavet, F.; Ferrari, P.; Mothe-Satney, I.; van Obberghen, E.; Hébuterne, X. Effects of age, malnutrition and refeeding on the expression and secretion of ghrelin. Clin. Nutr. 2008, 27, 724–731. [Google Scholar] [CrossRef] [PubMed]
- Serra-Prat, M.; Mans, E.; Palomera, E.; Clave, P. Gastrointestinal peptides, gastrointestinal motility, and anorexia of aging in frail elderly persons. Neurogastroenterol. Motil. 2013, 25, 291–301. [Google Scholar] [CrossRef] [PubMed]
- Serra-Prat, M.; Palomera, E.; Clave, P.; Puig-Domingo, M. Effect of age and frailty on ghrelin and cholecystokinin responses to a meal test. Am. J. Clin. Nutr. 2009, 89, 1410–1417. [Google Scholar] [CrossRef] [PubMed]
- Stafleu, A.; Vanstaveren, W.A.; Degraaf, C.; Burema, J.; Hautvast, J.G. Family resemblance in energy, fat, and cholesterol intake: A study among three generations of women. Prev. Med. 1994, 23, 474–480. [Google Scholar] [CrossRef] [PubMed]
- Sturm, K.; Parker, B.; Wishart, J.; Feinle-Bisset, C.; Jones, K.L.; Chapman, I.; Horowitz, M. Energy intake and appetite are related to antral area in healthy young and older subjects. Am. J. Clin. Nutr. 2004, 80, 656–667. [Google Scholar] [PubMed]
- Sturm, K.; MacIntosh, C.G.; Parker, B.A.; Wishart, J.; Horowitz, M.; Chapman, I.M. Appetite, food intake, and plasma concentrations of cholecystokinin, ghrelin, and other gastrointestinal hormones in undernourished older women and well-nourished young and older women. J. Clin. Endocrinol. Metab. 2003, 88, 3747–3755. [Google Scholar] [CrossRef] [PubMed]
- Surrao, J.; Sawaya, A.L.; Dallal, G.E.; Tsay, R.; Roberts, S.B. Use of food quotients in human doubly labeled water studies: Comparable results obtained with 4 widely used food intake methods. J. Am. Diet. Assoc. 1998, 98, 1015–1020. [Google Scholar] [CrossRef]
- Temme, E.; Huybrechts, I.; Vandevijvere, S.; de Henauw, S.; Leveque, A.; Kornitzer, M.; de Backer, G.; van Oyen, H. Energy and macronutrient intakes in belgium: Results from the first national food consumption survey. Br. J. Nutr. 2010, 103, 1823–1829. [Google Scholar] [CrossRef] [PubMed]
- Toth, M.J.; Arciero, P.J.; Gardner, A.W.; Calles-Escandon, J.; Poehlman, E.T. Rates of free fatty acid appearance and fat oxidation in healthy younger and older men. J. Appl. Physiol. 1996, 80, 506–511. [Google Scholar] [PubMed]
- Van Pelt, R.E.; Dinneno, F.A.; Seals, D.R.; Jones, P.P. Age-related decline in RMR in physically active men: Relation to exercise volume and energy intake. Am. J. Physiol. Endocrinol. Metab. 2001, 281, E633–E639. [Google Scholar] [PubMed]
- Van Walleghen, E.L.; Orr, J.S.; Gentile, C.L.; Davy, B.M. Pre-meal water consumption reduces meal energy intake in older but not younger subjects. Obesity 2007, 15, 93–99. [Google Scholar] [CrossRef] [PubMed]
- Van Walleghen, E.L.; Orr, J.S.; Gentile, C.L.; Davy, K.P.; Davy, B.M. Habitual physical activity differentially affects acute and short-term energy intake regulation in young and older adults. Int. J. Obes. 2007, 31, 1277–1285. [Google Scholar] [CrossRef] [PubMed]
- Winkels, R.M.; Jolink-Stoppelenburg, A.; de Graaf, K.; Siebelink, E.; Mars, M.; de Groot, L. Energy intake compensation after 3 weeks of restricted energy intake in young and elderly men. J. Am. Med. Dir. Assoc. 2011, 12, 277–286. [Google Scholar] [CrossRef] [PubMed]
- Wolk, K.; Larsson, S.C.; Vessby, B.; Wolk, A.; Brismar, K. Metabolic, anthropometric, and nutritional factors as predictors of circulating insulin-like growth factor binding protein-1 levels in middle-aged and elderly men. J. Clin. Endocrinol. Metab. 2004, 89, 1879–1884. [Google Scholar] [CrossRef] [PubMed]
- Wright, A.J.; Southon, S.; Bailey, A.L.; Finglas, P.M.; Maisey, S.; Fulcher, R.A. Nutrient intake and biochemical status of non-instutionalized elderly subjects in norwich: Comparison with younger adults and adolescents from the same general community. Br. J. Nutr. 1995, 74, 453–475. [Google Scholar] [CrossRef] [PubMed]
- Wurtman, J.J.; Lieberman, H.; Tsay, R.; Nader, T.; Chew, B. Calorie and nutrient intakes of elderly and young subjects measured under identical conditions. J. Gerontol. 1988, 43, B174–B180. [Google Scholar] [CrossRef] [PubMed]
- Yukawa, M.; Cummings, D.E.; Matthys, C.C.; Callahan, H.S.; Frayo, R.S.; Spiekerman, C.F.; Weigle, D.S. Effect of aging on the response of ghrelin to acute weight loss. J. Am. Geriatr. Soc. 2006, 54, 648–653. [Google Scholar] [CrossRef] [PubMed]
- Zandstra, E.H.; Mathey, M.F.; Graaf, C.; van Staveren, W.A. Short-term regulation of food intake in children, young adults and the elderly. Eur. J. Clin. Nutr. 2000, 54, 239–246. [Google Scholar] [CrossRef] [PubMed]
- Zhou, B.; Yamanaka-Okumura, H.; Adachi, C.; Kawakami, Y.; Inaba, H.; Mori, Y.; Katayama, T.; Takeda, E. Age-related variations of appetite sensations of fullness and satisfaction with different dietary energy densities in a large, free-living sample of Japanese adults. J. Acad. Nutr. Diet. 2013, 113, 1155–1164. [Google Scholar] [CrossRef] [PubMed]
- Apolzan, J.W.; Carnell, N.S.; Mattes, R.D.; Campbell, W.W. Inadequate dietary protein increases hunger and desire to eat in younger and older men. J. Nutr. 2007, 137, 1478–1482. [Google Scholar] [PubMed]
- Parker, B.A.; Sturm, K.; MacIntosh, C.G.; Feinle, C.; Horowitz, M.; Chapman, I.M. Relation between food intake and visual analogue scale ratings of appetite and other sensations in healthy older and young subjects. Eur. J. Clin. Nutr. 2004, 58, 212–218. [Google Scholar] [CrossRef] [PubMed]
- Gentilcore, D.; Hausken, T.; Horowitz, M.; Jones, K.L. Measurements of gastric emptying of low- and high-nutrient liquids using 3D ultrasonography and scintigraphy. Neurogastroenterol. Motil. 2006, 18, 1062–1068. [Google Scholar] [CrossRef] [PubMed]
- Bowen, J.; Noakes, M.; Clifton, P.M. Appetite regulatory hormone responses to various dietary proteins differ by body mass index status despite similar reductions in ad libitum energy intake. J. Clin. Endocrinol. Metab. 2006, 91, 2913–2919. [Google Scholar] [CrossRef] [PubMed]
- Pilichiewicz, A.N.; Chaikomin, R.; Brennan, I.M.; Wishart, J.M.; Rayner, C.K.; Jones, K.L.; Smout, A.J.; Horowitz, M.; Feinle-Bisset, C. Load-dependent effects of duodenal glucose on glycemia, gastrointestinal hormones, antropyloroduodenal motility, and energy intake in healthy men. Am. J. Physiol. Endocrinol. Metab. 2007, 293, E743–E753. [Google Scholar] [CrossRef] [PubMed]
- Pilichiewicz, A.N.; Papadopoulos, P.; Brennan, I.M.; Little, T.J.; Meyer, J.H.; Wishart, J.M.; Horowitz, M.; Feinle-Bisset, C. Load-dependent effects of duodenal lipid on antropyloroduodenal motility, plasma CCK and PYY, and energy intake in healthy men. Am. J. Physiol. Regul. Integr. Comp. Physiol. 2007, 293, R2170–R2178. [Google Scholar] [CrossRef] [PubMed]
- Brennan, I.M.; Little, T.J.; Feltrin, K.L.; Smout, A.J.; Wishart, J.M.; Horowitz, M.; Feinle-Bisset, C. Dose-dependent effects of cholecystokinin-8 on antropyloroduodenal motility, gastrointestinal hormones, appetite, and energy intake in healthy men. Am. J. Physiol. Endocrinol. Metab. 2008, 295, E1487–E1494. [Google Scholar] [CrossRef] [PubMed]
- Lejeune, M.P.; Westerterp, K.R.; Adam, T.C.; Luscombe-Marsh, N.D.; Westerterp-Plantenga, M.S. Ghrelin and glucagon-like peptide 1 concentrations, 24-h satiety, and energy and substrate metabolism during a high-protein diet and measured in a respiration chamber. Am. J. Clin. Nutr. 2006, 83, 89–94. [Google Scholar] [PubMed]
- Soenen, S.; Rayner, C.K.; Horowitz, M.; Jones, K.L. Gastric emptying in the elderly. Clin. Geriatr. Med. 2015, 31, 339–353. [Google Scholar] [CrossRef] [PubMed]
- Rigamonti, A.E.; Pincelli, A.I.; Corra, B.; Viarengo, R.; Bonomo, S.M.; Galimberti, D.; Scacchi, M.; Scarpini, E.; Cavagnini, F.; Muller, E.E. Plasma ghrelin concentrations in elderly subjects: Comparison with anorexic and obese patients. J. Endocrinol. 2002, 175, R1–R5. [Google Scholar] [CrossRef] [PubMed]
- Scheen, A.J. Diabetes mellitus in the elderly: Insulin resistance and/or impaired insulin secretion? Diabetes Metab. 2005, 31, 5S27–5S34. [Google Scholar] [CrossRef]
- Trahair, L.G.; Horowitz, M.; Rayner, C.K.; Gentilcore, D.; Lange, K.; Wishart, J.M.; Jones, K.L. Comparative effects of variations in duodenal glucose load on glycemic, insulinemic, and incretin responses in healthy young and older subjects. J. Clin. Endocrinol. Metab. 2012, 97, 844–851. [Google Scholar] [CrossRef] [PubMed]
- Amin, A.; Dhillo, W.S.; Murphy, K.G. The central effects of thyroid hormones on appetite. J. Thyroid Res. 2011, 2011. [Google Scholar] [CrossRef] [PubMed]
- Gesing, A.; Lewinski, A.; Karbownik-Lewinska, M. The thyroid gland and the process of aging; what is new? Thyroid Res. 2012, 5. [Google Scholar] [CrossRef] [PubMed]
- Suzuki, S.; Nishio, S.I.; Takeda, T.; Komatsu, M. Gender-specific regulation of response to thyroid hormone in aging. Thyroid Res. 2012, 5. [Google Scholar] [CrossRef] [PubMed]
- Visser, W.E.; Visser, T.J.; Peeters, R.P. Thyroid disorders in older adults. Endocrinol. Metab. Clin. N. Am. 2013, 42, 287–303. [Google Scholar] [CrossRef] [PubMed]
- Doty, R.L.; Shaman, P.; Applebaum, S.L.; Giberson, R.; Siksorski, L.; Rosenberg, L. Smell identification ability: Changes with age. Science 1984, 226, 1441–1443. [Google Scholar] [CrossRef] [PubMed]
- Morley, J.E. Anorexia of aging: Physiologic and pathologic. Am. J. Clin. Nutr. 1997, 66, 760–773. [Google Scholar] [PubMed]
- Newman, R.; Hariharan, K.; Reff, M.; Anderson, D.R.; Braslawsky, G.; Santoro, D.; Hanna, N.; Bugelski, P.J.; Brigham-Burke, M.; Crysler, C.; et al. Modification of the Fc region of a primatized IgG antibody to human CD4 retains its ability to modulate CD4 receptors but does not deplete CD4+ T cells in chimpanzees. Clin. Immunol. 2001, 98, 164–174. [Google Scholar] [CrossRef] [PubMed]
- Yeh, S.S.; Schuster, M.W. Geriatric cachexia: The role of cytokines. Am. J. Clin. Nutr. 1999, 70, 183–197. [Google Scholar] [PubMed]
- Berthelemy, P.; Bouisson, M.; Vellas, B.; Moreau, J.; Nicole, V.; Albarede, J.L.; Ribet, A. Postprandial cholecystokinin secretion in elderly with protein-energy undernutrition. J. Am. Geriatr. Soc. 1992, 40, 365–369. [Google Scholar] [CrossRef] [PubMed]
© 2016 by the authors; licensee MDPI, Basel, Switzerland. This article is an open access article distributed under the terms and conditions of the Creative Commons by Attribution (CC-BY) license (http://creativecommons.org/licenses/by/4.0/).
Share and Cite
Giezenaar, C.; Chapman, I.; Luscombe-Marsh, N.; Feinle-Bisset, C.; Horowitz, M.; Soenen, S. Ageing Is Associated with Decreases in Appetite and Energy Intake—A Meta-Analysis in Healthy Adults. Nutrients 2016, 8, 28. https://doi.org/10.3390/nu8010028
Giezenaar C, Chapman I, Luscombe-Marsh N, Feinle-Bisset C, Horowitz M, Soenen S. Ageing Is Associated with Decreases in Appetite and Energy Intake—A Meta-Analysis in Healthy Adults. Nutrients. 2016; 8(1):28. https://doi.org/10.3390/nu8010028
Chicago/Turabian StyleGiezenaar, Caroline, Ian Chapman, Natalie Luscombe-Marsh, Christine Feinle-Bisset, Michael Horowitz, and Stijn Soenen. 2016. "Ageing Is Associated with Decreases in Appetite and Energy Intake—A Meta-Analysis in Healthy Adults" Nutrients 8, no. 1: 28. https://doi.org/10.3390/nu8010028
APA StyleGiezenaar, C., Chapman, I., Luscombe-Marsh, N., Feinle-Bisset, C., Horowitz, M., & Soenen, S. (2016). Ageing Is Associated with Decreases in Appetite and Energy Intake—A Meta-Analysis in Healthy Adults. Nutrients, 8(1), 28. https://doi.org/10.3390/nu8010028