Lean Body Mass Associated with Upper Body Strength in Healthy Older Adults While Higher Body Fat Limits Lower Extremity Performance and Endurance

 ,
, 
Abstract
:1. Introduction
2. Experimental Section
2.1. Participants
2.2. Anthropometric Measures and Body Composition
2.3. Muscle Strength, Lower Body Extremity Performance, and Endurance
2.4. Nutritional Status and Dietary Intake
2.5. Reported Physical Activity
2.6. Data Analysis
3. Results

| Characteristics | Total | Men | Women | p Value |
|---|---|---|---|---|
| (n = 117) | (n = 65) | (n = 52) | ||
| Age (years) | 74.0 (13.0) | 73.0 (10.1) # | 73.9 (8.5) # | 0.612 |
| Height (m) | 162.3 (8.5) # | 161.4 (8.0) # | 163.5 (9.0) # | 0.199 |
| Weight (kg) | 71.9 (1.3) # | 71.7 (17.9) | 75.1 (10.7) # | 0.019 * |
| BMI (kg/m2) † | 27.10 (5.9) | 25.5 6.8) | 27.9 (5.2) | 0.045 * |
| Body Fat % | 34.7 (8.0) # | 34.8 (7.5) # | 34.6 (8.6) # | 0.908 |
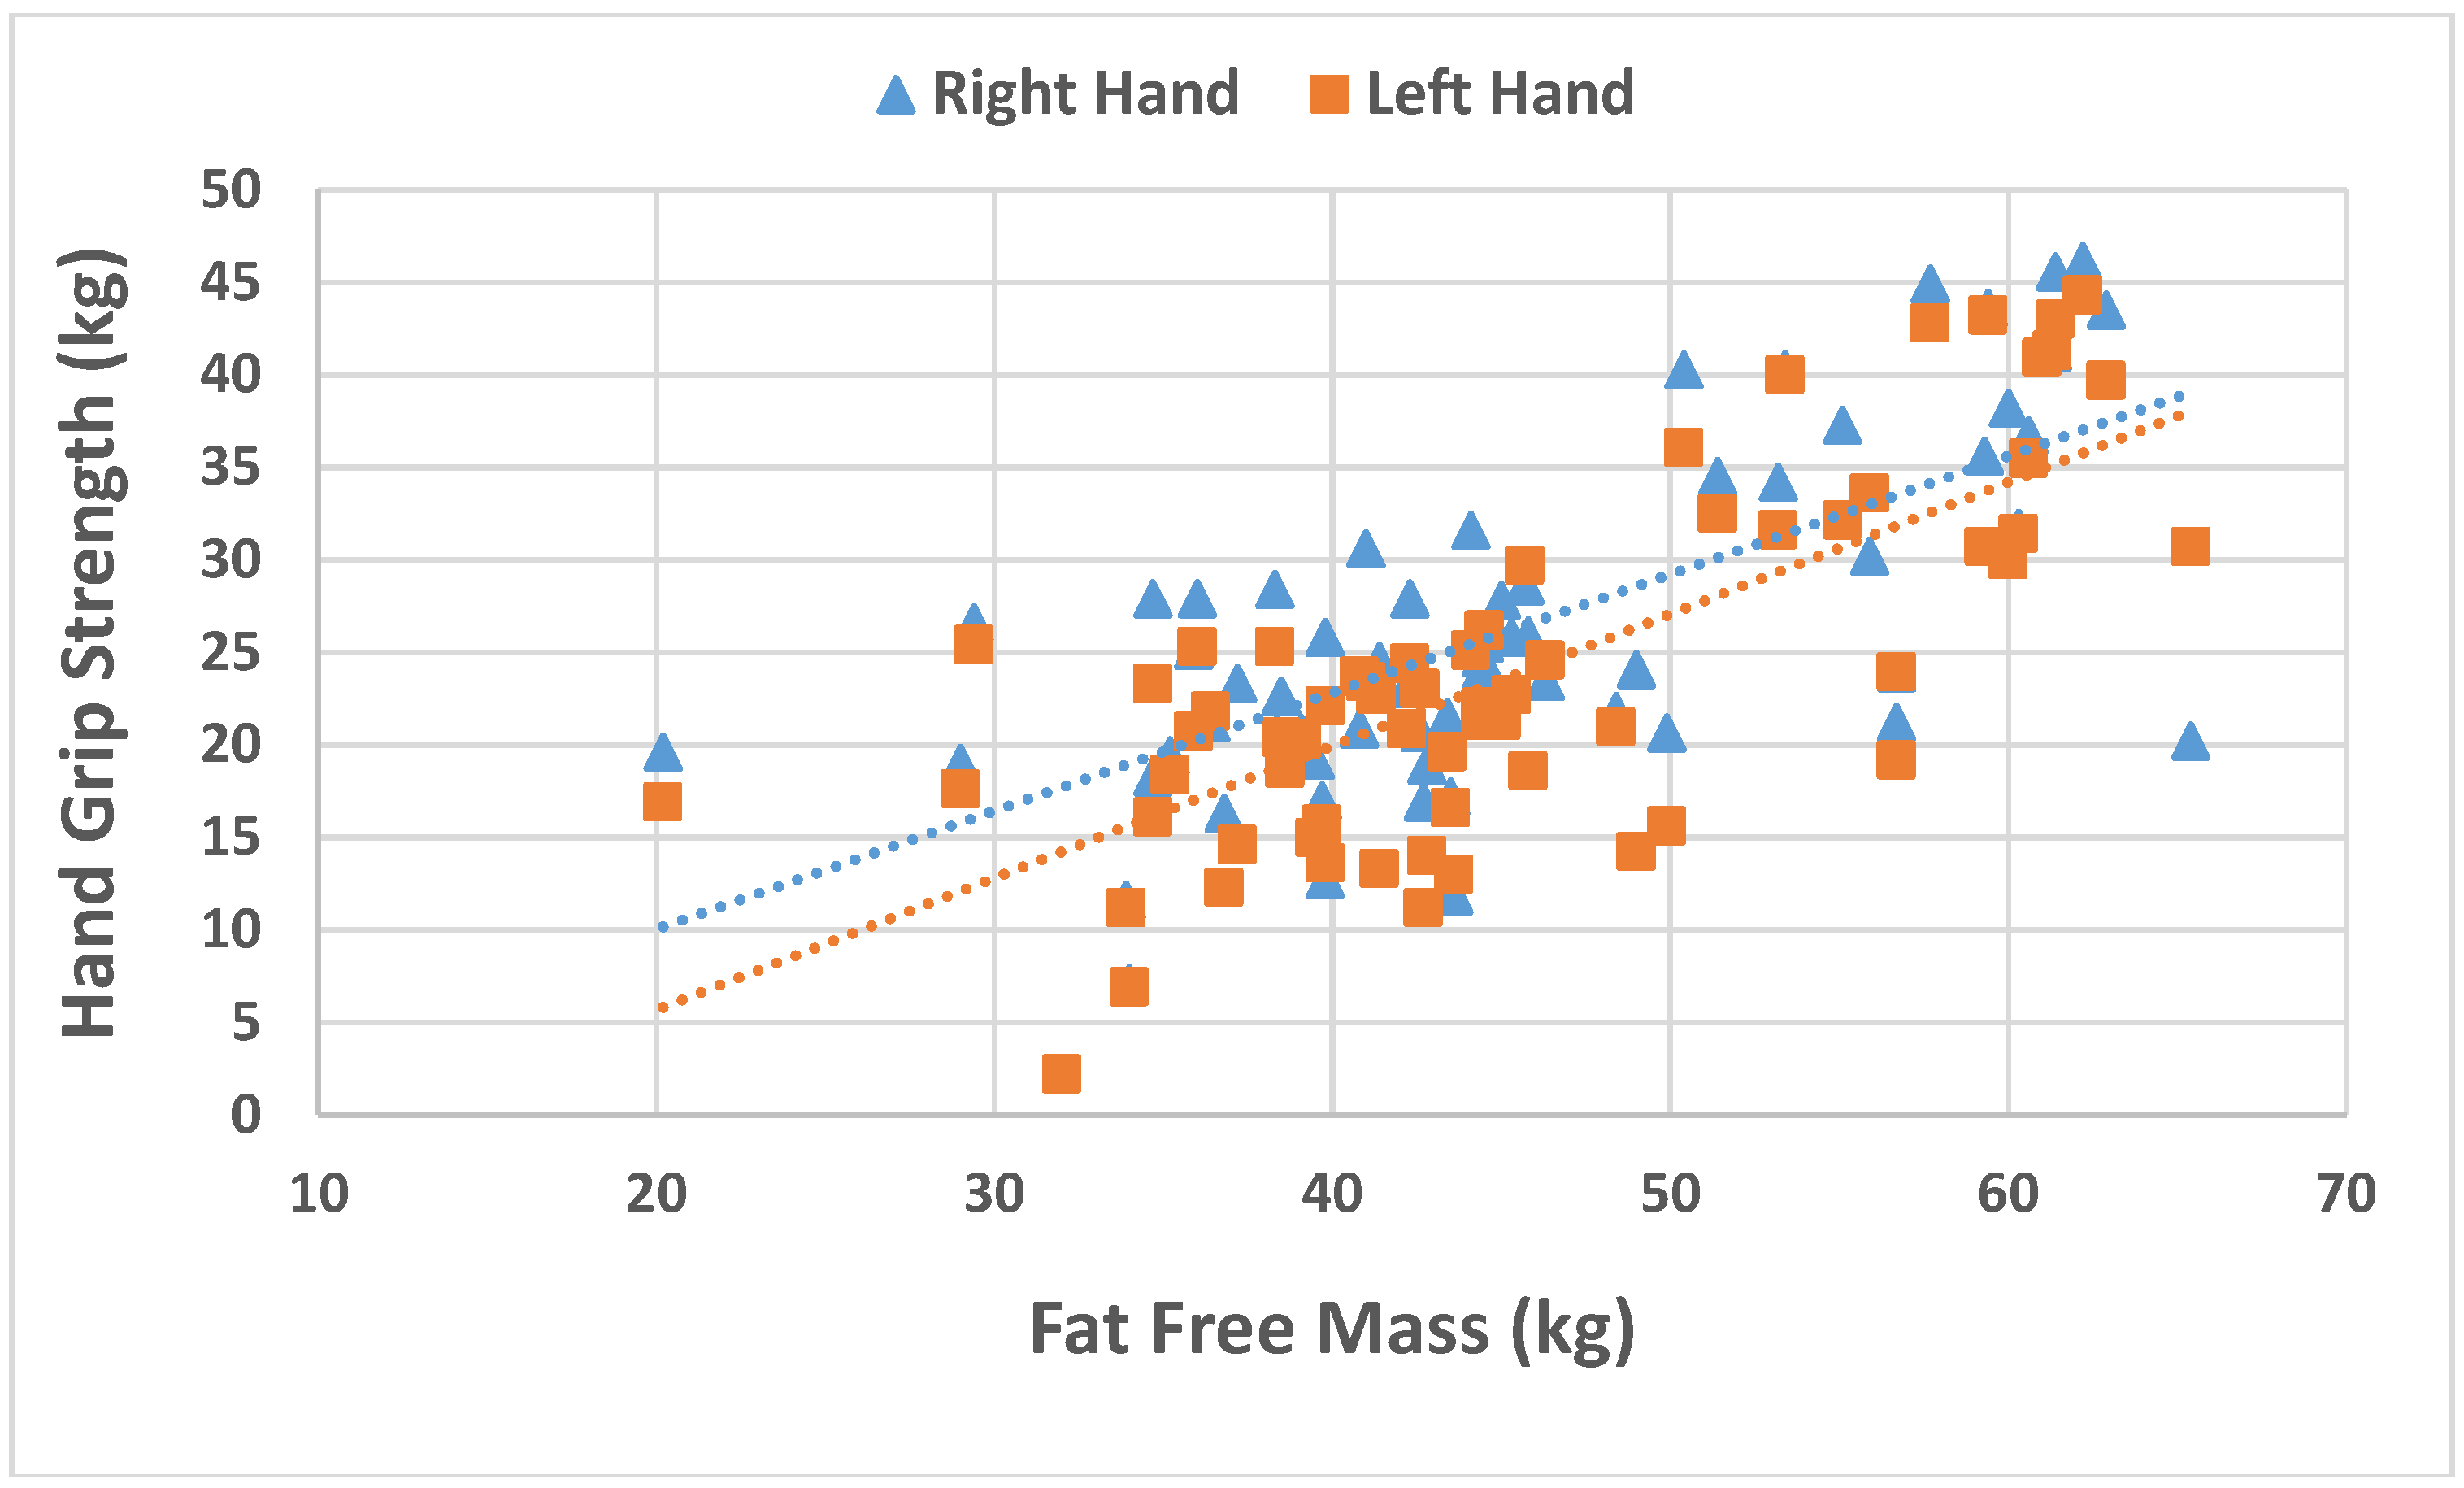
| Fat free mass (kg) | 46.7 (9.1) | 44.9 (9.2) | 48.9 (8.5) | 0.021 |
| MNA Score ‡ | 28.0 (3.0) | 27.5 (3.0) | 28.0 (2.5) | 0.105 |
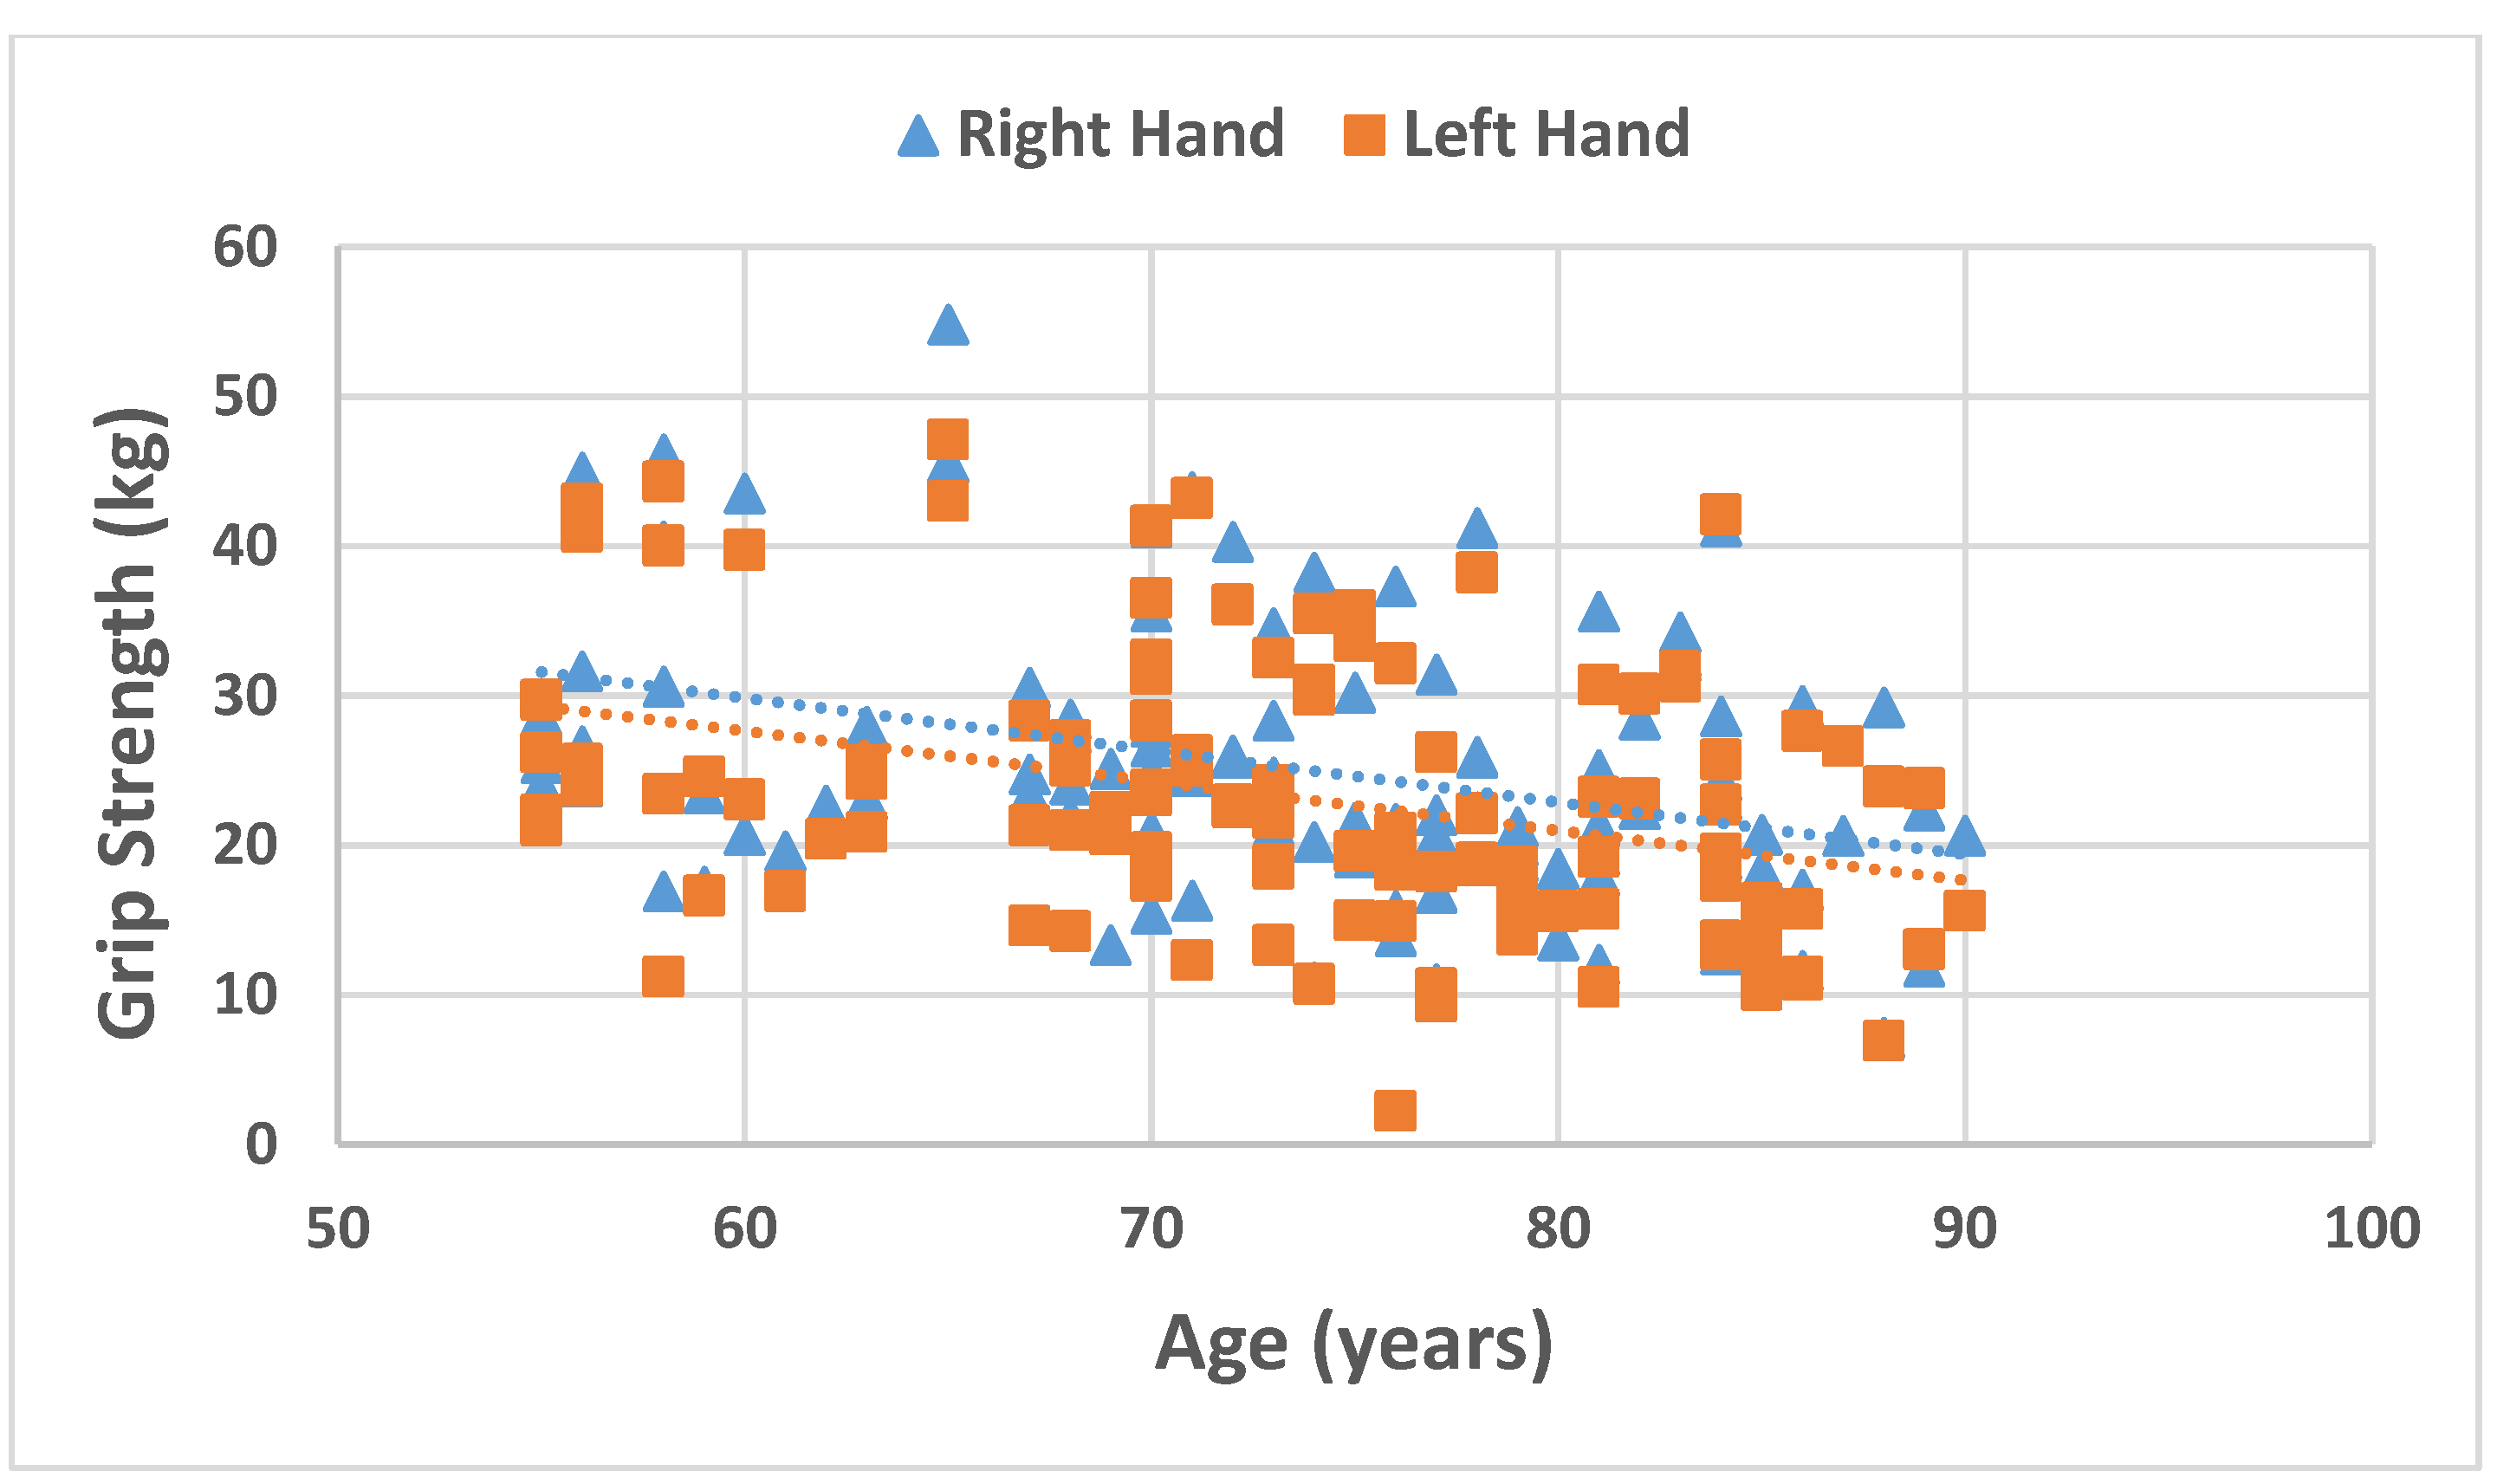
| Grip Strength RH (kg) § | 23.95 (10.0) | 23.72 (8.7) | 24.1 (17.3) | 0.231 |
| Grip Strength LH (kg) § | 22.4 (12.3) | 21.8 (8.0) # | 23.2 (16.1) | 0.089 |
| 6 Minute Walk (SMW) (m) | 366.4 (135.4) # | 359.8 (152.2) # | 373.7 (115.8) # | 0.636 |
| Sit-to-stand (STS) (reps) †† | 13.0 (6.0) | 13.5 (5.4) # | 13.3 (5.0) | 0.789 |
| Timed Up and Go (TUG) (s) ‡‡ | 9.6 (4.3) | 10.8 (2.9) # | 9.0 (4.8) | 0.727 |
| Physical Activity (AMI/wk) | 1520 (1858) | 1316 (1711) | 1776 (2077) | 0.050 * |
| Energy (kJ) §§ | 7287 (2643) | 7319 (2529) | 7255 (3100) | 0.745 |
| Protein (g) | 81.3 (36.2) | 82.9 (37.2) | 81.9 (29.4) # | 0.450 |
| Fat (g) | 65.3 (41.3) | 67.7 (28.8) # | 67.0 (26.4) | 0.881 |
| Carbohydrate (g) | 192.0 (81.9) | 195.0 (72.7) | 189.1 (93.1) | 0.882 |
| Upper Body Strength | Lower Body Strength | Lower Body Endurance | Physical Activity | ||||
|---|---|---|---|---|---|---|---|
| Hand Grip | STS | TUG † | SMW | AMI † | |||
| Right † | Left | ||||||
| (Men: n = 64; Women: n = 52) | (Men: n = 65; Women: n = 51) | (Men: n = 61; Women: n = 49) | (Men: n = 17; Women: n = 31) | (Men: n = 44; Women: n = 40) | (Men: n = 63; Women: n = 50) | ||
| R | r | r | r | r | R | ||
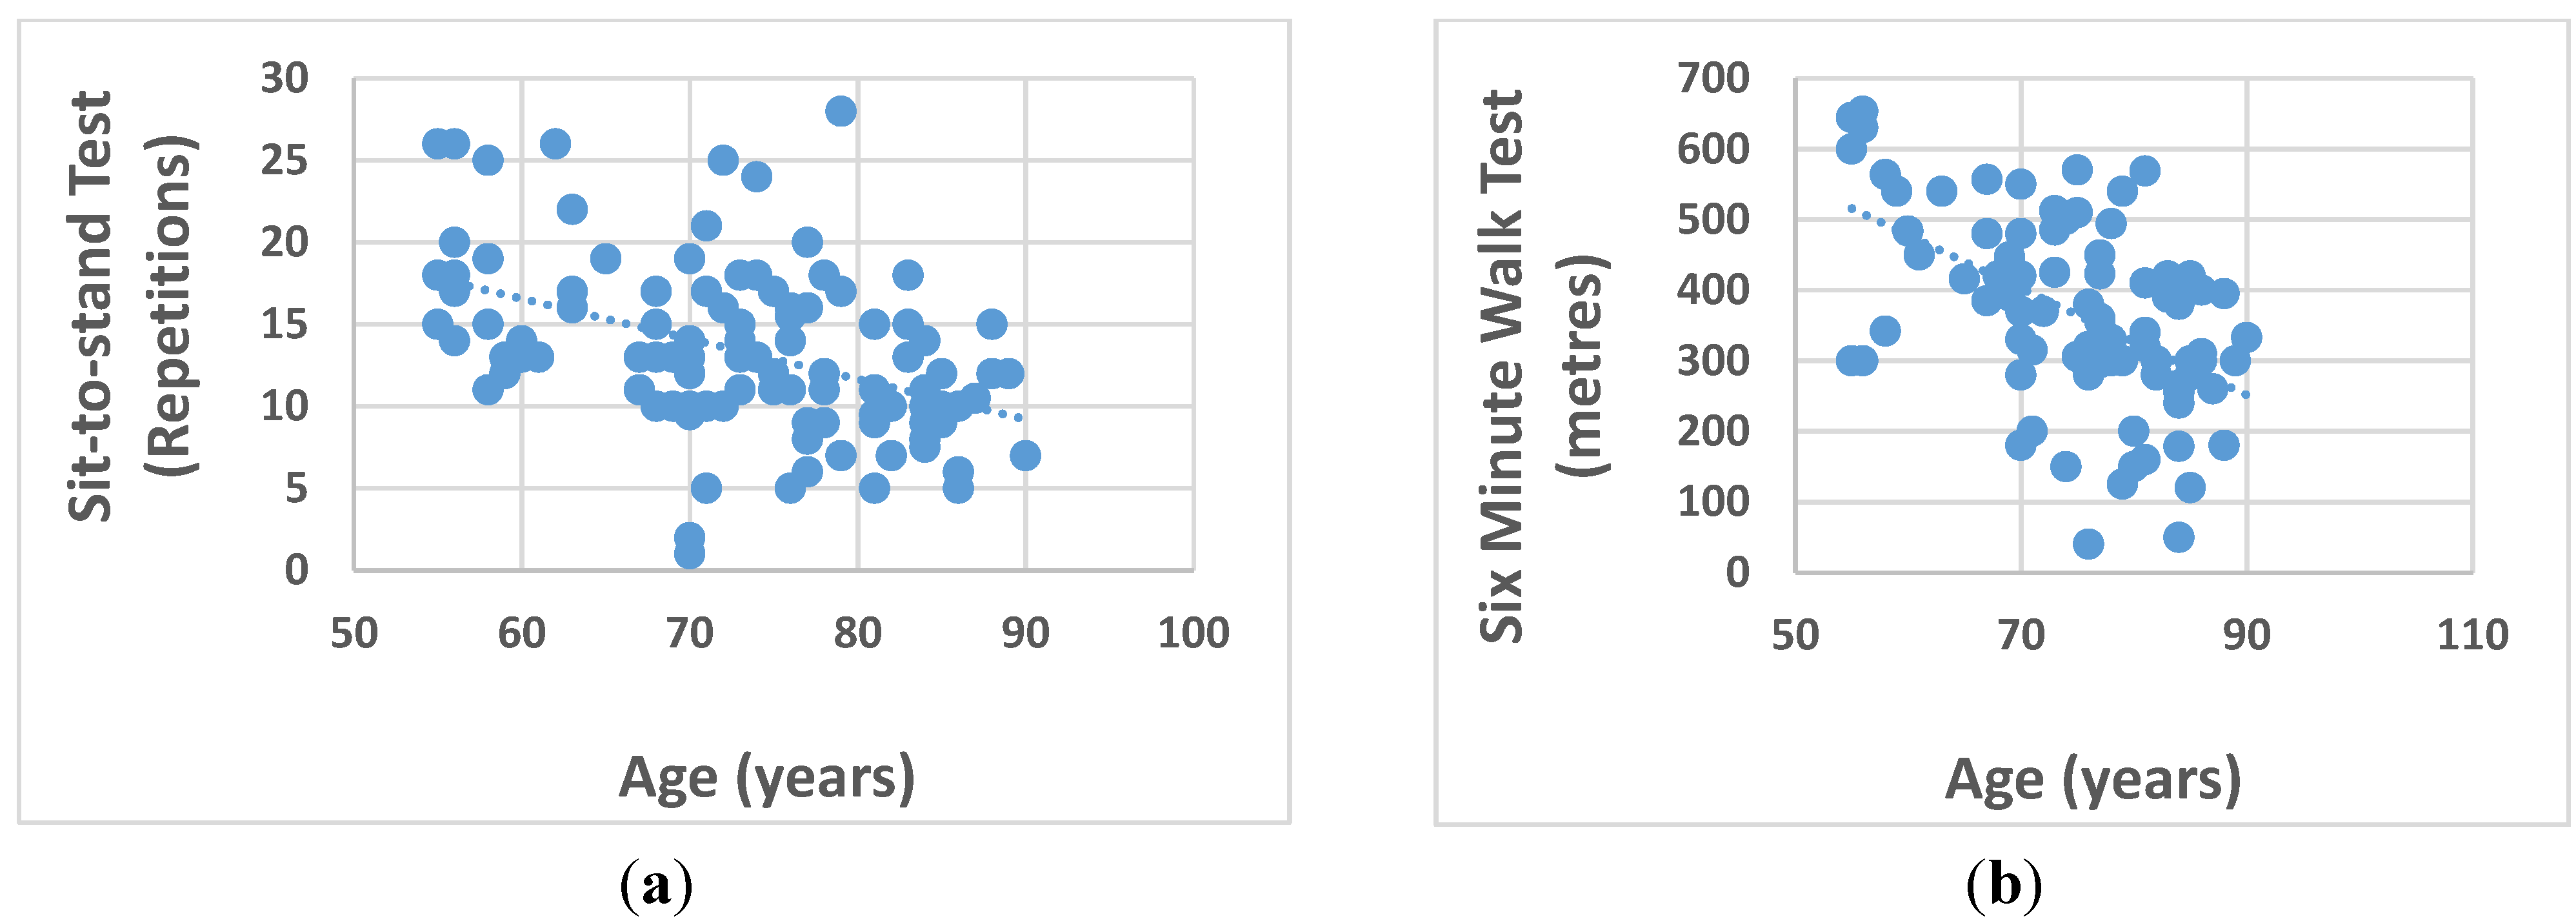
| Age | Men | −0.238 | −0.141 | −0.492 ** | 0.155 | −0.492 ** | −0.427 ** |
| Women | −0.547 ** | −0.620 ** | −0.413 ** | 0.449 * | −0.555 ** | −0.143 | |
| Weight (kg) | Men † | 0.213 | 0.338 ** | −0.198 | 0.452 | −0.295 | −0.097 |
| Women | 0.318 * | 0.313 * | 0.131 | 0.209 | 0.117 | 0.105 | |
| BMI (kg/m2) | Men † | −0.069 | 0.060 | −0.268 * | 0.386 | −0.362 * | −0.030 |
| Women † | −0.196 | −0.211 | −0.240 | 0.185 | −0.266 | −0.107 | |
| Body fat (%) | Men | −0.475 ** | −0.412 ** | −0.073 | 0.163 | −0.143 | 0.086 |
| Women | −0.580 ** | −0.673 ** | −0.569 ** | 0.268 | −0.634 ** | 0.204 | |
| MNA | Men † | 0.025 | 0.19 | 0.390 ** | 0.379 | 0.293 | 0.273 * |
| Women | 0.123 | 0.151 | 0.161 | −0.040 | 0.317 * | 0.181 | |
| Dietary intake | |||||||
| Energy (kJ) | Men † | 0.039 | 0.002 | 0.043 | −0.283 | −0.001 | −0.034 |
| Women | 0.429 ** | 0.431 ** | 0.196 | −0.242 | 0.342 * | 0.250 | |
| Protein (g) | Men † | 0.202 | 0.109 | 0.088 | −0.177 | 0.063 | 0.211 |
| Women | 0.186 | 0.173 | 0.167 | −0.237 | 0.190 | 0.199 | |
| Fat (g) | Men | 0.032 | −0.064 | −0.208 | −0.221 | −0.158 | −0.148 |
| Women | 0.287 * | 0.283 * | 0.101 | −0.106 | 0.279 | 0.282 * | |
| CHO (g) | Men † | 0.163 | 0.092 | 0.034 | −0.305 | −0.063 | 0.023 |
| Women | 0.429 ** | 0.460 ** | 0.192 | −0.228 | 0.279 | 0.110 | |


| Models | Beta coefficient | Standard Error | T | p |
|---|---|---|---|---|
| Right handgrip strength (ln transformed) | ||||
| Age | −0.009 | 0.003 | −2.780 | 0.007 |
| Gender | −0.002 | 0.057 | −0.040 | 0.968 |
| LnMLTPA | 0.036 | 0.031 | 1.163 | 0.248 |
| Regression residuals of protein intake/body weight | 0.000 | 0.001 | 0.258 | 0.797 |
| Body fat percentage | −0.011 | 0.004 | −2.859 | 0.005 |
| Fat free mass | 0.017 | 0.003 | 4.985 | 0.000 |
| Left hand grip strength (ln transformed) | ||||
| Age | −0.008 | −0.161 | −2.132 | 0.036 |
| Gender | −0.004 | −0.004 | −0.062 | 0.951 |
| LnMLTPA | 0.085 | 0.187 | 2.464 | 0.015 |
| Regression residuals of protein intake/body weight | −0.003 | −0.174 | −2.488 | 0.015 |
| Body fat percentage | −0.012 | −0.211 | −2.720 | 0.008 |
| Fat free mass | 0.025 | 0.505 | 6.382 | 0.000 |
| Six minute walk test | ||||
| Age | −5.256 | 1.402 | −3.750 | 0.000 |
| Gender | 11.240 | 25.284 | 0.445 | 0.658 |
| LnMLTPA | 29.885 | 13.197 | 2.264 | 0.027 |
| Regression residuals of protein intake/body weight | −0.099 | 0.409 | −0.243 | 0.809 |
| Body fat percentage | −5.589 | 1.691 | −3.305 | 0.002 |
| Fat free mass | −2.194 | 1.453 | −1.510 | 0.136 |
| Sit-to-stand test | ||||
| Age | −0.206 | 0.054 | −3.851 | 0.000 |
| Gender | 0.225 | 0.982 | 0.229 | 0.819 |
| LnMLTPA | 1.061 | 0.544 | 1.952 | 0.054 |
| Regression residuals of protein intake/body weight | −0.010 | 0.016 | −0.654 | 0.515 |
| Body fat percentage | −0.192 | 0.065 | −2.941 | 0.004 |
| Fat free mass | −0.093 | 0.057 | −1.616 | 0.110 |
| Models | Beta coefficient | Standard Error | T | p |
| Timed Up and Go test | ||||
| Age | 0.145 | 0.074 | 1.961 | 0.059 |
| Gender | 0.133 | 1.529 | 0.087 | 0.931 |
| LnMLTPA | −0.833 | 0.423 | −1.969 | 0.058 |
| Regression residuals of protein intake/body weight | −0.010 | 0.016 | −0.617 | 0.542 |
| Body fat percentage | 0.122 | 0.063 | 1.934 | 0.063 |
| Fat free mass | 0.160 | 0.065 | 2.446 | 0.021 |
4. Discussion
5. Conclusions
Acknowledgments
Author Contributions
Conflicts of Interest
References
- Raguso, C.A.; Kyle, U.; Kossovsky, M.P.; Roynette, C.; Paoloni-Giacobino, A.; Hans, D.; Genton, L.; Pichard, C. A 3-year longitudinal study on body composition changes in the elderly: Role of physical exercise. Clin. Nutr. 2006, 25, 573–580. [Google Scholar] [CrossRef] [PubMed]
- Wolfe, R.; Miller, S.; Miller, K. Optimal protein intake in the elderly. Clin. Nutr. 2008, 27, 675–684. [Google Scholar] [CrossRef] [PubMed]
- Tieland, M.; Borgonjen-Van den Berg, K.J.; van Loon, L.J.; de Groot, L.C. Dietary protein intake in community-dwelling, frail, and institutionalized elderly people: Scope for improvement. Eur. J. Nutr. 2011, 51, 173–179. [Google Scholar] [CrossRef] [PubMed]
- Campbell, W.W.; Barton, M.L., Jr.; Cry-Campbell, D.; Davey, S.L.; Beard, J.L.; Parise, G. Effects of an omnivorous diet compared with a lactoovovegetarian diet on resistance-training-induced changes in body composition and skeletal muscle in older men. Am. J. Clin. Nutr. 1999, 70, 1032–1039. [Google Scholar] [PubMed]
- Villareal, D.T.; Apovian, C.M.; Kusher, R.F.; Klein, S. Obesity in older adults: Technical review and position statement of the American Society for Nutrition and NAASO, The Obesity Society. Am. J. Clin. Nutr. 2005, 82, 923–934. [Google Scholar] [CrossRef] [PubMed]
- Harris, T.B. Invited commentary: Body composition in studies of aging: New opportunities to better understand health risks associated with weight. Am. J. Epidemiol. 2002, 156, 122–124. [Google Scholar] [CrossRef] [PubMed]
- Visvanathan, R.; Chapman, I. Preventing sarcopaenia in older people. Maturitas 2010, 66, 383–388. [Google Scholar] [CrossRef] [PubMed]
- Evans, W.J.C.; Sarcopenia, W.W. Age-related changes in body composition and functional capacity. J. Nutr. 1993, 123, 465–468. [Google Scholar] [PubMed]
- Morley, J.E. Sarcopenia: Diagnosis and treatment. J. Nutr. Health Aging 2008, 12, 452–456. [Google Scholar] [CrossRef] [PubMed]
- Doherty, T.J. Invited review: Aging and sarcopenia. J. Appl. Physiol. 2003, 95, 1717–1727. [Google Scholar] [CrossRef] [PubMed]
- Jenson, G.L.; Friedmann, J.M. Obesity is associated with functional decline in community-dwelling rural older persons. J. Am. Geriatr. Soc. 2002, 50, 918–923. [Google Scholar] [CrossRef]
- Kemmler, W.; von Stengel, S.; Engelke, K.; Häberle, L.; Mayhew, J.L.; Kalender, W.A. Exercise, body composition, and functional ability: A randomized controlled trial. Am. J. Prev. Med. 2010, 38, 279–287. [Google Scholar] [CrossRef] [PubMed]
- Inzitari, M.; Doets, E.; Bartali, B.; Benetou, V.; Di Bari, M.; Visser, M.; Volpato, S.; Gawbassi, G.; Topinkova, E.; de Groot, L.; et al. Nutrition in the age-related disablement process. J. Nutr. Health Aging 2001, 15, 559–604. [Google Scholar]
- Woo, J.; Leung, J.; Kwok, T. BMI, body composition, and physical functioning in older adults. Obesity 2007, 15, 1886–1894. [Google Scholar] [CrossRef] [PubMed]
- Shin, H.; Panton, L.B.; Dutton, G.R.; Ilich, J.Z. Relationship of physical performance with body composition and bone mineral density in individuals over 60 years of age: A systematic review. J. Aging Res. 2011, 2011, 191896. [Google Scholar] [CrossRef] [PubMed]
- Gale, C.R.; Martyn, C.N.; Cooper, C.; Sayer, A.A. Grip strength, body composition, and mortality. Int. J. Epidemiol. 2007, 36, 228–235. [Google Scholar] [CrossRef] [PubMed]
- Winter, J.E.; MacInnis, R.J.; Wattanapenpaiboon, N.; Nowson, C.A. BMI and all-cause mortality in older adults: A meta-analysis. Am. J. Clin. Nutr. 2014, 99, 875–890. [Google Scholar] [CrossRef] [PubMed]
- Visser, M.; Kritchevsky, S.B.; Goodpaster, B.H.; Newman, A.B.; Nevitt, M.; Stamm, E.; Harris, T.B. Leg muscle mass and composition in relation to lower extremity performance in men and women aged 70 to 79: The health, aging and body composition study. J. Am. Geriatr. Soc. 2002, 50, 897–904. [Google Scholar] [CrossRef] [PubMed]
- Ramlagan, S.; Peltzer, K.; Phaswana-Mafuya, N. Hand grip strength and associated factors in non-institutionalised men and women 50 years and older in South Africa. BMC Res. Notes 2014, 7, 1–7. [Google Scholar] [CrossRef] [PubMed]
- Abizanda, P.; Navarro, J.L.; García-Tomás, M.I.; López-Jiménez, E.; Martínez-Sánchez, E.; Paterna, G. Validity and usefulness of hand-held dynamometry for measuring muscle strength in community-dwelling older persons. Arch. Gerontol. Geriatr. 2012, 54, 21–27. [Google Scholar] [CrossRef] [PubMed]
- Jones, C.J.; Rikli, R.E.; Beam, W.C. A 30-s chair-stand test as a measure of lower body strength in community-residing older adults. Res. Q. Exerc. Sport 1999, 70, 113–119. [Google Scholar] [CrossRef] [PubMed]
- Galán-Mercant, A.; Cuesta-Vargas, A.I. Differences in trunk accelerometry between frail and non-frail elderly persons in functional tasks. BMC Res. Notes 2014, 7, 1–9. [Google Scholar] [CrossRef] [PubMed]
- Roberta, E.; Rikli, C.J.J. The reliability and validity of a 6-minute walk test as a measure of physical endurance in older adults. J. Aging Phys. Act. 1998, 6, 363–375. [Google Scholar]
- Guigoz, Y. The Mini Nutritional Assessment (MNA®) review of the literature—What does it tell us? J. Nutr. Health Aging 2006, 10, 466–485. [Google Scholar] [PubMed]
- Taylor, H.L.; Jacobs, D.R., Jr.; Schucker, B.; Knudsen, J.; Leon, A.S.; Debacker, G. A questionnaire for the assessment of leisure time physical activities. J. Chron. Dis. 1978, 31, 741–755. [Google Scholar] [CrossRef]
- Bohannon, R.W. Six-minute walk test: A meta-analysis of data from apparently healthy elders. Top. Geriatr. Rehabil. 2007, 23, 155–160. [Google Scholar] [CrossRef]
- Butler, A.A.; Menant, J.C.; Tiedemann, A.C.; Lord, S.R. Age and gender differences in seven tests of functional mobility. J. Neuroeng. Rehabil. 2009, 6, 31. [Google Scholar] [CrossRef] [PubMed]
- Pondal, M.; del Ser, T. Normative data and determinants for the timed “up and go” test in a population-based sample of elderly individuals without gait distrubances. J. Geriatr. Phys. Ther. 2008, 31, 57–63. [Google Scholar] [CrossRef] [PubMed]
- National Health, Medical Research Council. Nutrient Reference Values for Australia and New Zealand: including Recommended Dietary Intakes. Australia Government, Department of Health and Ageing, National Health and Medical Research Council: Canberra, Australia, 2006. Available online: http://www.nhmrc.gov.au/_files_nhmrc/publications/attachments/n35.pdf (accessed on 20 July 2015). [Google Scholar]
- Pisciottano, M.V.C.; Pinto, S.S.; Szejnfeld, V.L.; Castro, C.H.M. The relationship between lean mass, muscle strength, muscle strength and physical ability in independent healthy elderly women from the community. J. Nutr. Health Aging 2014, 18, 554–558. [Google Scholar] [CrossRef] [PubMed]
- Cooper, R.; Hardy, R.; Aihie Sayer, A.; Ben-Shlomo, Y.; Birnie, K.; Cooper, C.; Craig, L.; Deary, I.J.; Demakakos, P.; Gallacher, J.; et al. Age and gender differences in physical capability levels from mid-life onwards: The harmonisation and meta-analysis of data from eight UK cohort studies. PLoS ONE 2011, 6, e27899. [Google Scholar] [CrossRef] [PubMed] [Green Version]
- Dey, D.K.; Bosaeus, I.; Lissner, L.; Steen, B. Changes in body composition and its relation to muscle strength in 75-year-old men and women: A 5-year prospective follow-up study of the NORA cohort in Göteborg, Sweden. Nutrition 2009, 25, 613–619. [Google Scholar] [CrossRef] [PubMed]
- Binder, E.F.; Yarasheski, K.E.; Steger-May, K.; Sinacore, D.R.; Brown, M.; Schechtman, K.B.; Holloszy, J.O. Effects of progressive resistance training on body composition in frail older adults: Results of a randomized, controlled trial. J. Gerontol. A Biol. Sci. Med. Sci. 2005, 60, 1425–1431. [Google Scholar] [CrossRef] [PubMed]
- Vilaça, K.H.; Carneiro, J.A.; Ferriolli, E.; Lima, N.K.; de Paula, F.J.; Moriguti, J.C. Body composition, physical performance and muscle quality of active elderly women. Arch. Gerontol. Geriatr. 2014, 59, 44–48. [Google Scholar] [CrossRef] [PubMed]
- Tieland, M.; van de Rest, O.; Dirks, M.L.; van der Zwaluw, N.; Mensink, M.; van Loon, L.J.; de Groot, L.C. Protein supplementation improves physical performance in frail elderly people: A randomized, double-blind, placebo-controlled trial. J. Am. Med. Dir. Assoc. 2012, 13, 720–726. [Google Scholar] [CrossRef] [PubMed]
- Arnarson, A.; Gudny Geirsdottir, O.; Ramel, A.; Briem, K.; Jonsson, P.V.; Thorsdottir, I. Effects of whey proteins and carbohydrates on the efficacy of resistance training in elderly people: Double blind, randomised controlled trial. Eur. J. Clin. Nutr. 2013, 67, 821–826. [Google Scholar] [CrossRef] [PubMed]
- Ispoglou, T.W.H.; Preston, T.; McElhone, S.; McKenna, J.; Hind, K. Double-blind, placebo-controlled pilot trial of l-Leucine-enriched amino-acid mixtures on body composition and physical performance in men and women aged 65–75 years. Eur. J. Clin. Nutr. 2015. [Google Scholar] [CrossRef]
- Villareal, D.T.; Banks, M.; Sinacore, D.R.; Siener, C.; Klein, S. Effect of weight loss and exercise on frailty in obese older adults. Arch. Intern. Med. 2006, 166, 860–866. [Google Scholar] [CrossRef] [PubMed]
- Misic, M.M.; Rosengren, K.S.; Woods, J.A.; Evans, E.M. Muscle quality, aerobic fitness and fat mass predict lower-extremity physical function in community-dwelling older adults. Gerontology 2007, 53, 260–266. [Google Scholar] [CrossRef] [PubMed]
- Guralnik, J.M.; Simonsick, E.M.; Ferrucci, L.; Glynn, R.J.; Berkman, L.F.; Blazer, D.G.; Scherr, P.A.; Wallace, R.B. A short physical performance battery assessing lower extremity function: Association with self-reported disability and prediction of mortality and nursing home admission. J. Gerontol. 1994, 49, M85–M94. [Google Scholar] [CrossRef] [PubMed]
- Simonsick, E.M.; Newman, A.B.; Nevitt, M.C.; Kritchevsky, S.B.; Ferrucci, L.; Guralnik, J.M.; Harris, T.; Health ABC Study Group. Measuring higher level physical function in well-functioning older adults: Expanding familiar approaches in the health ABC study. J. Gerontol. A 2001, 56, M644–M649. [Google Scholar] [CrossRef]
- Sharkey, J.R.; Giuliani, C.; Haines, P.S.; Branch, L.G.; Busby-Whitehead, J.; Zohoori, N. Summary measure of dietary musculoskeletal nutrient (calcium, vitamin D, magnesium, and phosphorus) intakes is associated with lower extremity physical performance in homebound elderly men and women. Am. J. Clin. Nutr. 2003, 77, 847–856. [Google Scholar] [PubMed]
- Ritchie, J.D.; Miller, C.K.; Smiciklas-Wright, H. Tanita foot-to-foot bioelectrical impedance analysis system validated in older adults. J. Am. Diet Assoc. 2005, 105, 1617–1619. [Google Scholar] [CrossRef] [PubMed]
- Posner, B.M.; Martin-Munley, S.S.; Smigelski, C.; Cupples, L.A.; Cobb, J.L.; Schaefer, E.; Miller, D.R.; P’Agostino, R.B. Comparison of techniques for estimating nutrient intake: The framingham study. Epidemiology 1992, 3, 171–177. [Google Scholar] [CrossRef] [PubMed]
- De Keyzer, W.; Huybrechts, I.; de Vriendt, V.; Vandevijvere, S.; Slimani, N.; van Oyen, H.; de Henauw, S. Repeated 24-hour recalls versus dietary records for estimating nutrient intakes in a national food consumption survey. Food Nutr. Res. 2011, 55. [Google Scholar] [CrossRef] [PubMed] [Green Version]
- Bastiaanse, L.P.; Vlasveld, G.; Penning, C.; Evenhuis, H.M. Feasibility and reliability of the mini nutritional assessment (MNA) in older adults with intellectual disabilities. J. Nutr. Health Aging 2012, 16, 759–762. [Google Scholar] [CrossRef] [PubMed]
© 2015 by the authors; licensee MDPI, Basel, Switzerland. This article is an open access article distributed under the terms and conditions of the Creative Commons Attribution license (http://creativecommons.org/licenses/by/4.0/).
Share and Cite
Charlton, K.; Batterham, M.; Langford, K.; Lateo, J.; Brock, E.; Walton, K.; Lyons-Wall, P.; Eisenhauer, K.; Green, N.; McLean, C. Lean Body Mass Associated with Upper Body Strength in Healthy Older Adults While Higher Body Fat Limits Lower Extremity Performance and Endurance. Nutrients 2015, 7, 7126-7142. https://doi.org/10.3390/nu7095327
Charlton K, Batterham M, Langford K, Lateo J, Brock E, Walton K, Lyons-Wall P, Eisenhauer K, Green N, McLean C. Lean Body Mass Associated with Upper Body Strength in Healthy Older Adults While Higher Body Fat Limits Lower Extremity Performance and Endurance. Nutrients. 2015; 7(9):7126-7142. https://doi.org/10.3390/nu7095327
Chicago/Turabian StyleCharlton, Karen, Marijka Batterham, Kelly Langford, Jenna Lateo, Erin Brock, Karen Walton, Philippa Lyons-Wall, Katie Eisenhauer, Nick Green, and Cameron McLean. 2015. "Lean Body Mass Associated with Upper Body Strength in Healthy Older Adults While Higher Body Fat Limits Lower Extremity Performance and Endurance" Nutrients 7, no. 9: 7126-7142. https://doi.org/10.3390/nu7095327