Milk Consumption and Mortality from All Causes, Cardiovascular Disease, and Cancer: A Systematic Review and Meta-Analysis

 ,
, 

Abstract
:1. Introduction
2. Experimental Section
2.1. Literature Search
2.2. Study Selection
2.3. Data Extraction and Quality Assessment
2.4. Statistical Analysis
3. Results
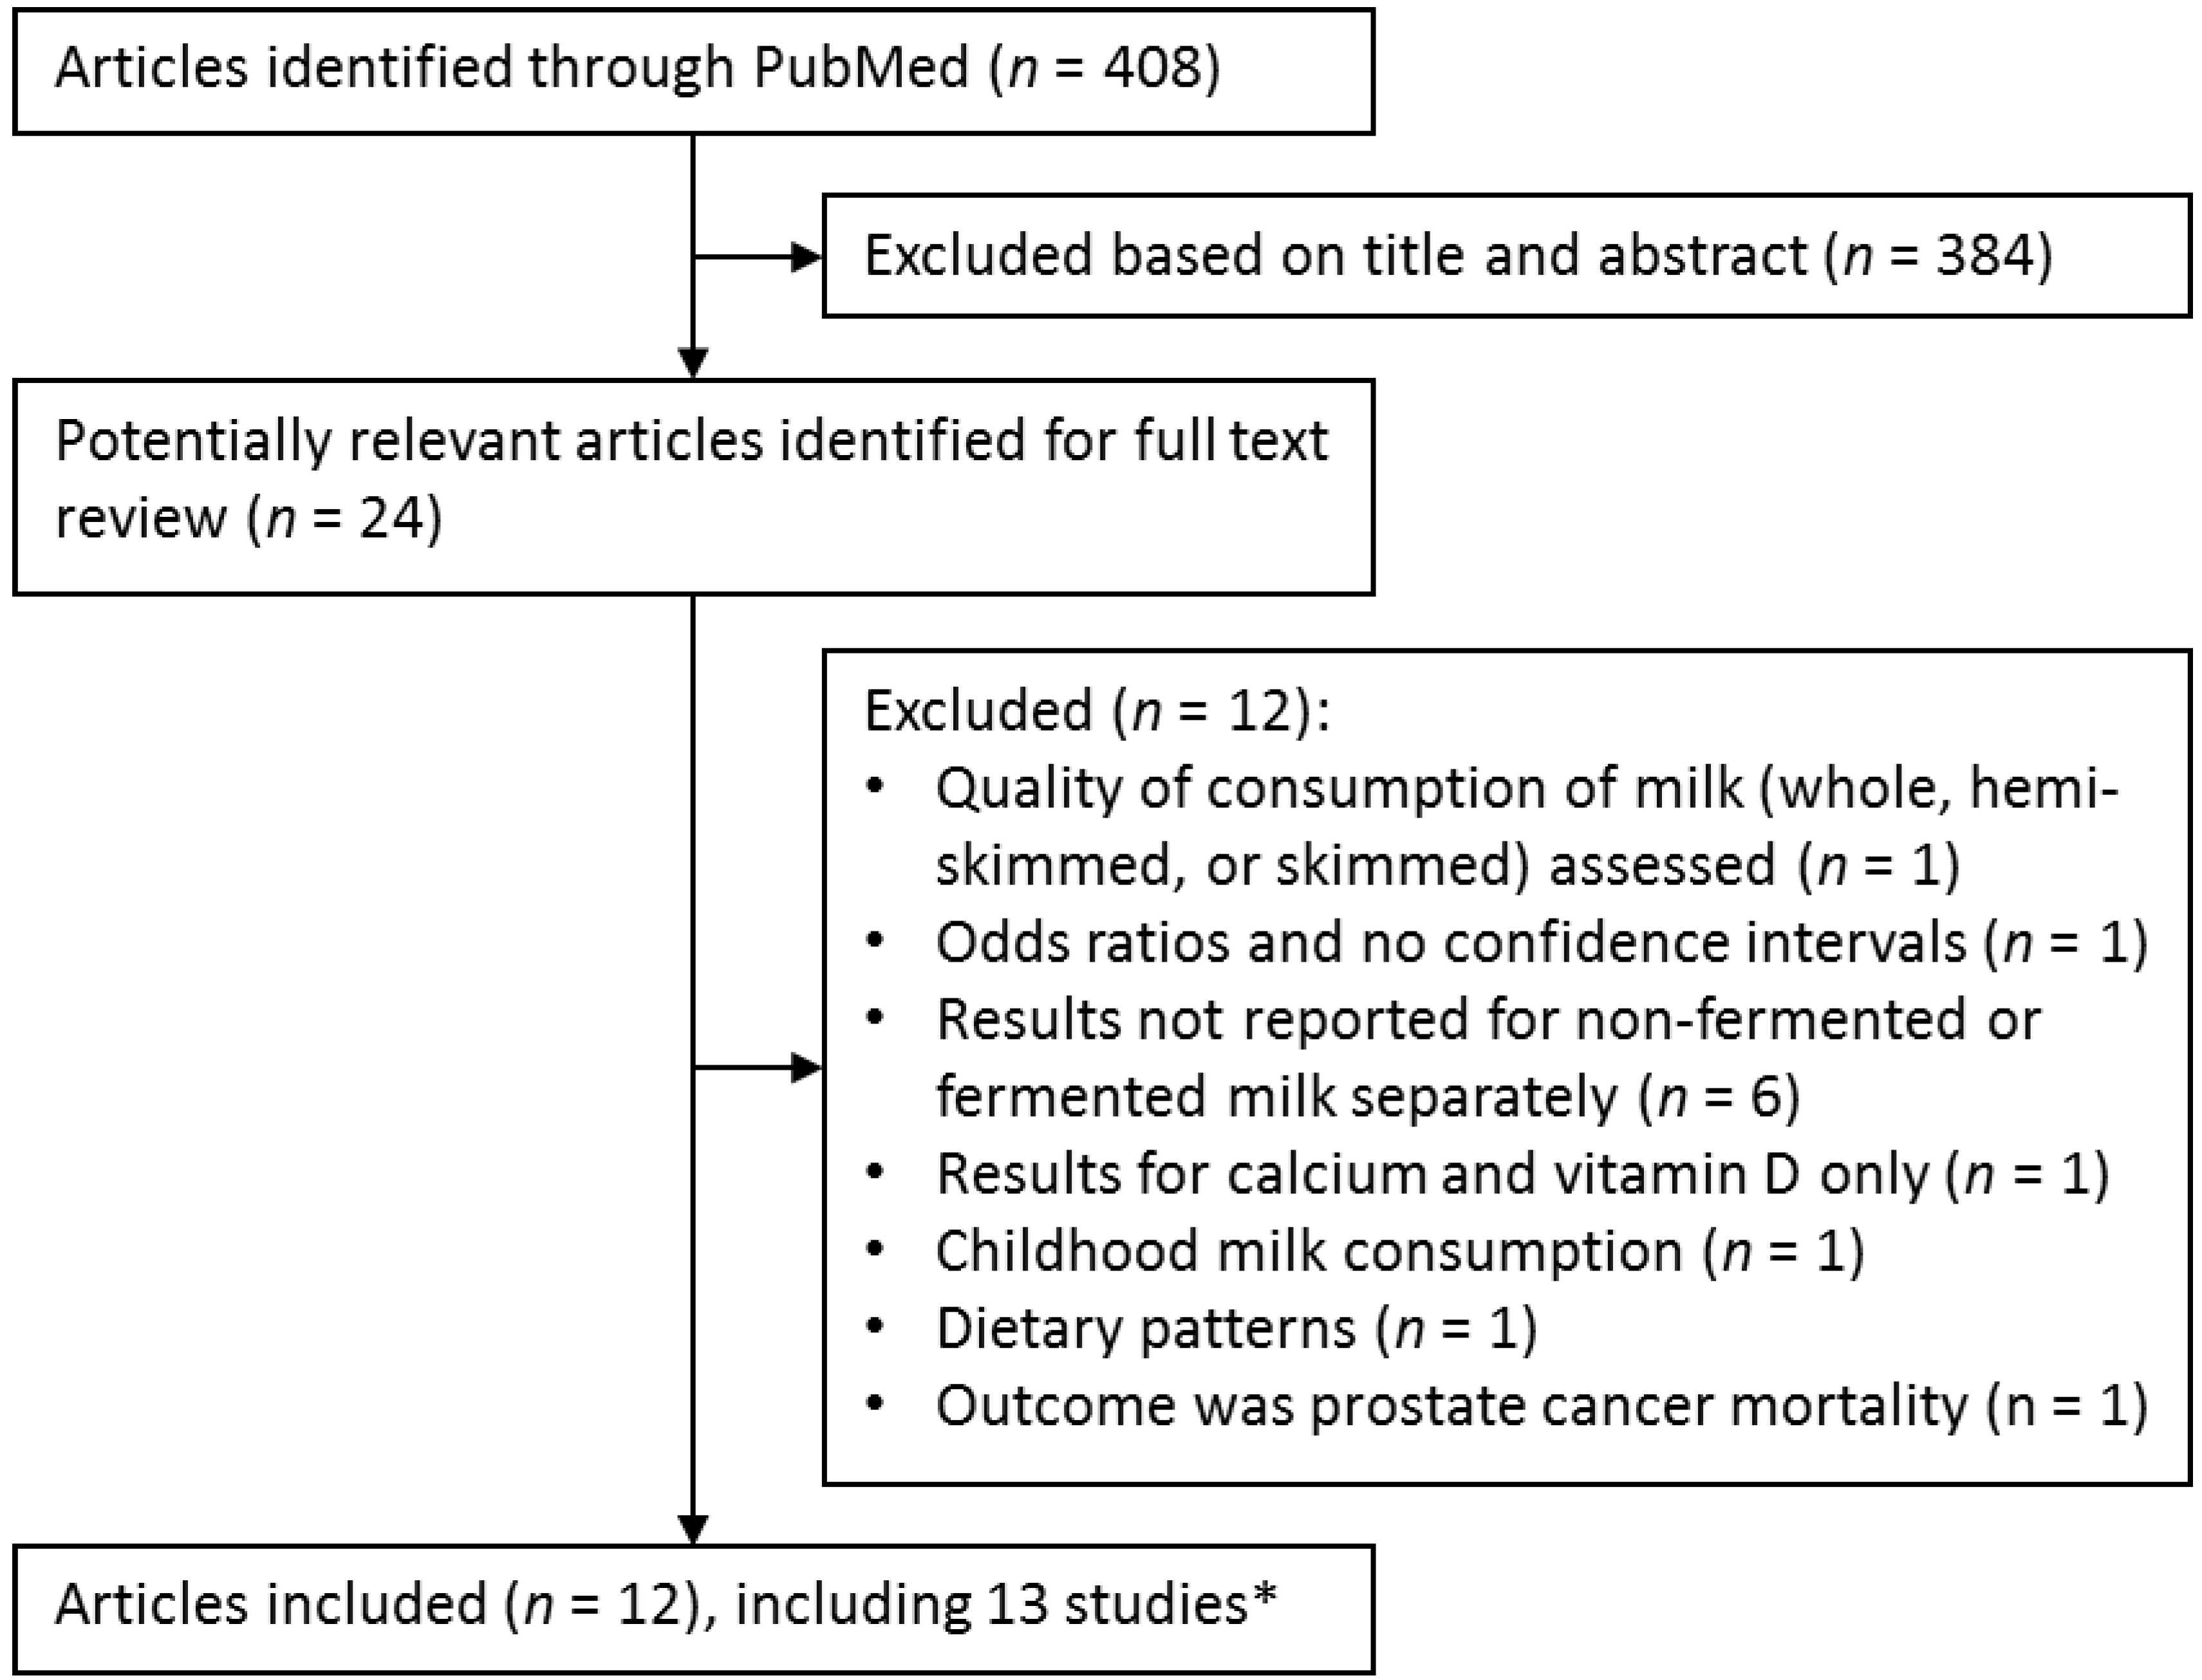
3.1. Literature Search
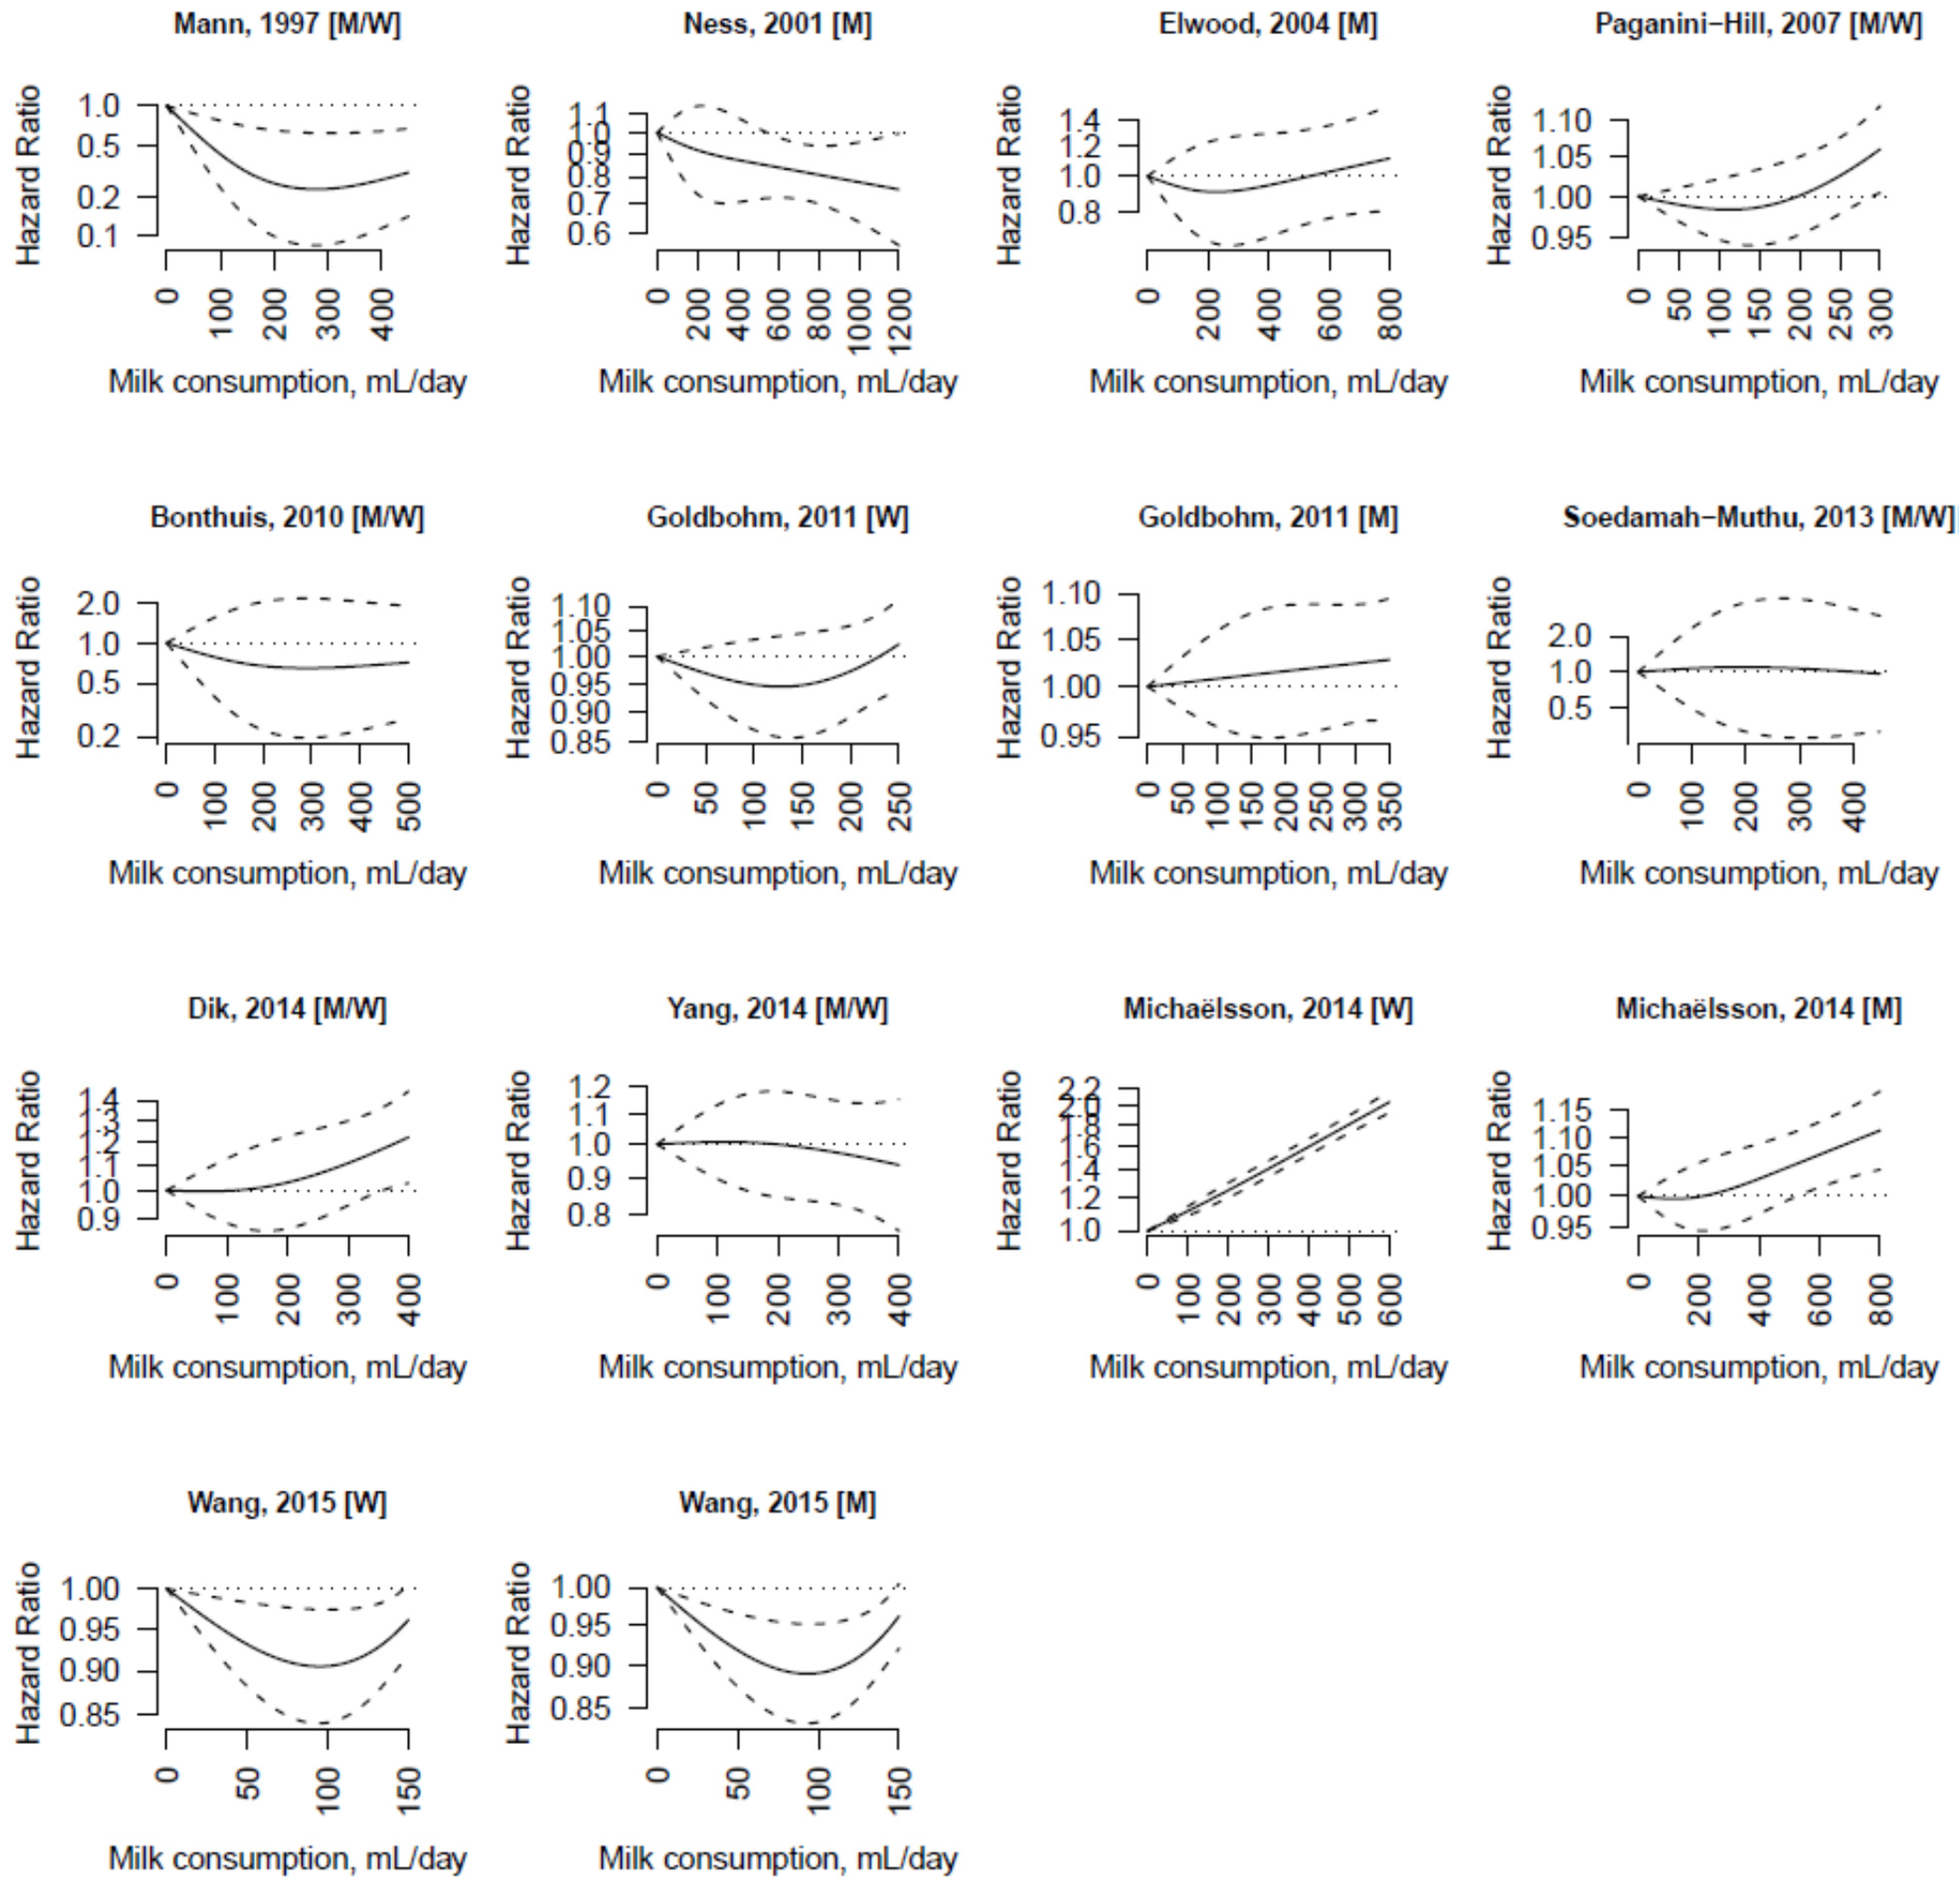
3.2. Study Characteristics

| First Author, Year | Cohort Name | Country | No. of Deaths | Sex (No. of Participants) | Age Range, Years | Duration of Follow-up, Years | Milk Intake Categories | HR (95% CI) | Adjustments |
|---|---|---|---|---|---|---|---|---|---|
| Mann, 1997 [21] | NA | UK | 392 | Women and men (10,802) | 16–79 | 13.3 | <280 mL/day a | 1.00 (ref.) | Age, sex, smoking, and social class |
| 280 mL/day | 0.70 (0.55–0.88) | ||||||||
| >280 mL/day | 0.87 (0.68–1.13) | ||||||||
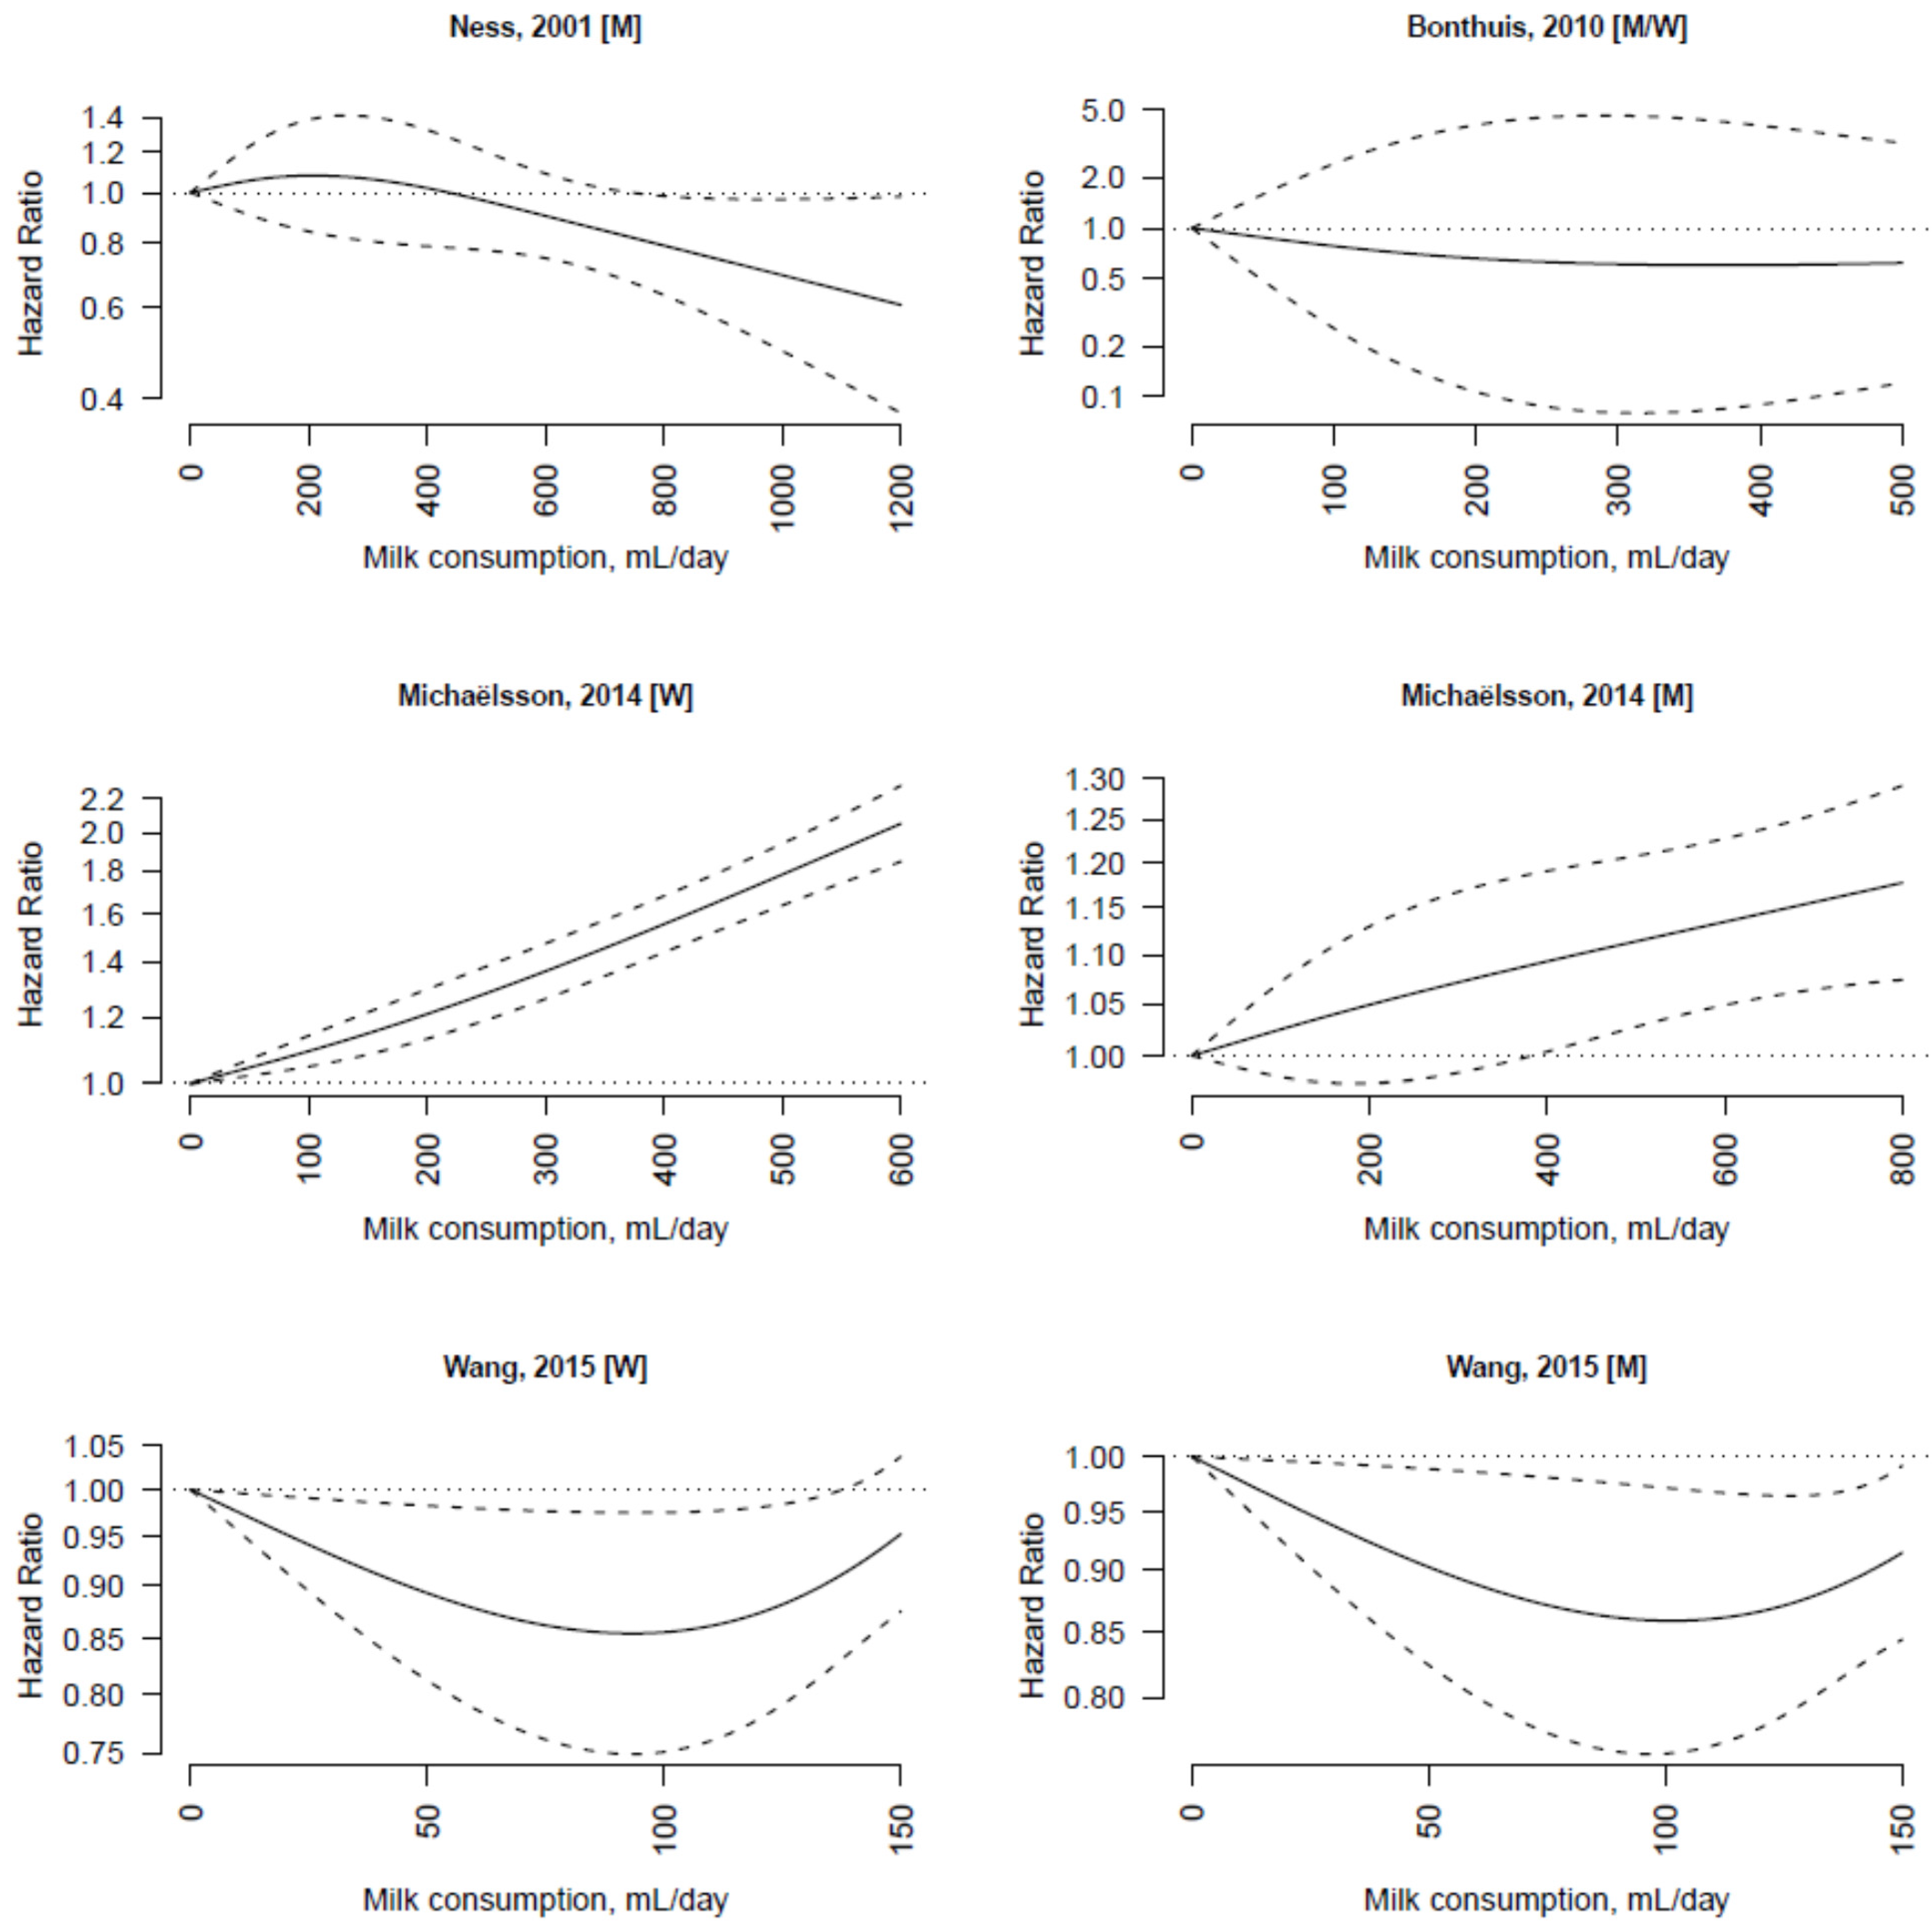
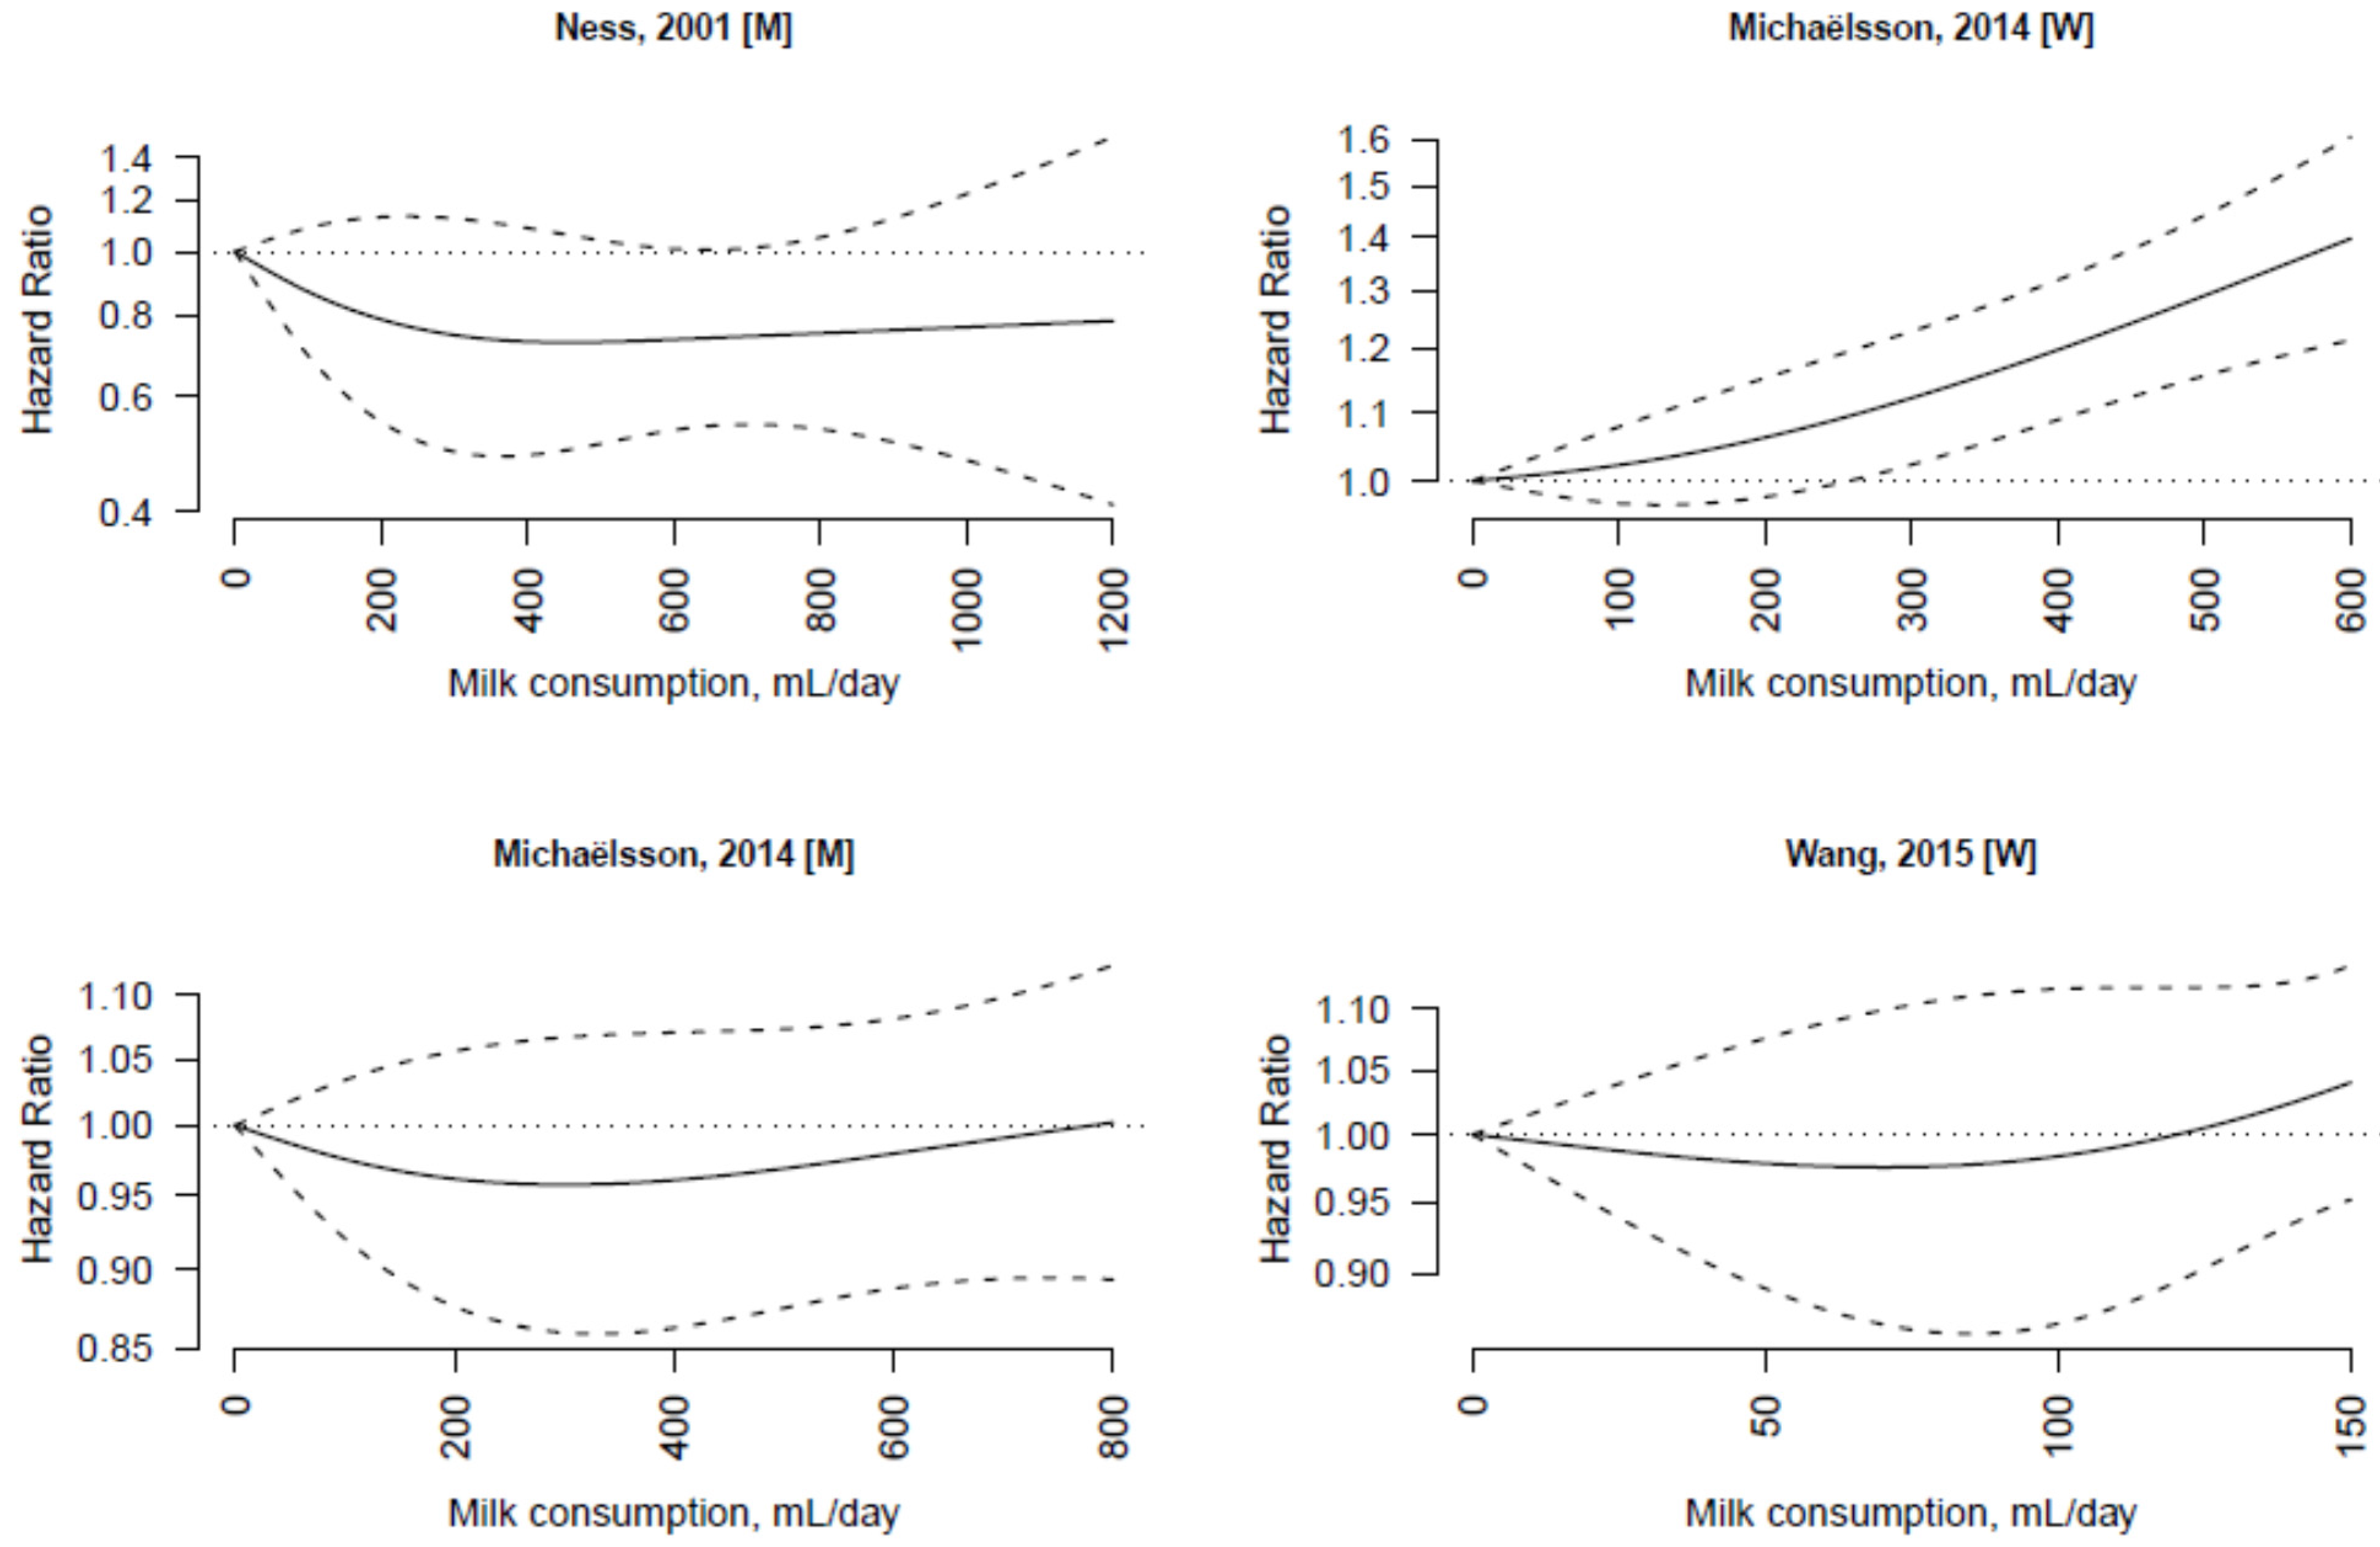
| Ness, 2001 [22] | Collaborative Study | Scotland | 2350 | Men (5,765) | 35–64 | 25 | <190 mL/day a | 1.00 (ref.) | Age, education, social class, father’s social class, smoking, BMI, diastolic blood pressure, cholesterol, adjusted FEV1, deprivation category, siblings, car user, angina, ECG ischemia, bronchitis, and alcohol intake |
| 190–750 mL/day | 0.90 (0.83–0.97) | ||||||||
| ≥760 mL/day | 0.81 (0.61–1.09) | ||||||||
| Elwood, 2004 [23] | Caerphilly Cohort Study | UK | 811 | Men (2512) | 45–59 | 20–24 | 0 | 1.00 (ref.) | Age, social class, smoking, BMI, systolic blood pressure, prior vascular disease, intake of fat, alcohol, and total energy |
| <280 mL/day a | 0.99 (0.73–1.34) | ||||||||
| 280–570 mL/day | 0.98 (0.72–1.35) | ||||||||
| >570 mL/day | 1.20 (0.80–1.80) | ||||||||
| Paganini-Hill, 2007 [24] | Leisure World Cohort Study | US | 11,396 | Women and men (13,624) | 44–101 | 23 | 0 glasses/day | 1.00 (ref.) | Age, sex, smoking, BMI, exercise, histories of hypertension, angina, heart attack, stroke, diabetes, rheumatoid arthritis, and cancer, alcohol intake |
| <1 glasses/day | 0.95 (0.90–1.00) | ||||||||
| 1 glasses/day | 1.01 (0.96–1.06) | ||||||||
| ≥2 glasses/day | 1.04 (0.98–1.10) | ||||||||
| Bonthuis, 2010 [25] | NA | Australia | 177 | Women and men (1529) | 25–78 | 14.4 | <198 g/day | 1.00 (ref.) | Age, sex, school leaving age, smoking, BMI, physical activity level, dietary supplement use, beta-carotene treatment during trial, presence of any medical condition, and alcohol and total energy intake |
| 198–328 g/day | 0.85 (0.54–1.33) | ||||||||
| ≥329 g/day | 0.93 (0.59–1.48) | ||||||||
| Goldbohm, 2011 [26] | Netherlands Cohort Study | Netherlands | 5478 in women: 10,658 in men | Women (62,573) and men (58,279) | 55–69 | 10 | Women | Women | Age, education, smoking, BMI, non-occupational and occupational physical activity, multivitamin use, intake of fruits and vegetables, monounsaturated fat, polyunsaturated fat, alcohol, and total energy |
| Q1: 0 g/day c | 1.00 (ref.) | ||||||||
| Q2: 21 g/day | 0.96 (0.87–1.05) | ||||||||
| Q3: 52 g/day | 0.96 (0.88–1.04) | ||||||||
| Q4: 107 g/day | 0.94 (0.86–1.04) | ||||||||
| Q5: 238 g/day | 1.00 (0.91–1.09) | ||||||||
| Men | Men | ||||||||
| Q1: 0 g/day c | 1.00 (ref.) | ||||||||
| Q2: 34 g/day | 0.99 (0.93–1.05) | ||||||||
| Q3: 90 g/day | 1.00 (0.94–1.08) | ||||||||
| Q4: 156 g/day | 1.01 (0.94–1.08) | ||||||||
| Q5: 342 g/day | 1.02 (0.95–1.09) | ||||||||
| Soedamah-Muthu, 2013 [27] | Whitehall II prospective cohort study | UK | 237 | Women and men (4526) | 56 b | 11.7 | 147 g/day | 1.00 (ref.) | Age, sex, ethnicity, employment grade, smoking, BMI, physical activity, family history of CHD/hypertension, fruit and vegetables, bread, meat, fish, coffee, tea, alcohol, and total energy intake |
| 294 g/day | 0.98 (0.72–1.34) | ||||||||
| 441 g/day (median) | 0.89 (0.64–1.25) | ||||||||
| Dik, 2014 [28] | European Prospective Investigation into Cancer and Nutrition | 10 European countries d | 1525 | Women and men (3859)e | 64.2 b | 4.1 | <24 g/day | 1.00 (ref.) | Age, sex, center, smoking, pre-diagnostic BMI, tumor sub-site (colon and rectum), disease stage, differentiation grade, and total energy intake |
| 24–147 g/day | 1.05 (0.90–1.23) | ||||||||
| 48–293 g/day | 1.04 (0.89–1.22) | ||||||||
| >293 g/day | 1.21 (1.03–1.43) | ||||||||
| Yang, 2014 [29] | Cancer Prevention Study II Nutrition Cohort | US | 949 | Women and men (2284) e | 64 b | 17 | Q1 f | 1.00 (ref.) | Age, sex, tumor stage, folate and total energy intake |
| Q2 | 1.01 (0.84–1.23) | ||||||||
| Q3 | 0.99 (0.82–1.19) | ||||||||
| Q4 | 0.95 (0.79–1.15) | ||||||||
| Michaëlsson, 2014 [30] | Swedish Mammography Cohort | Sweden | 15,541 | Women (61,433) | 39–74 | 20.1 | <200 g/day | 1.00 (ref.) | Age, education, living alone, smoking status, BMI, height, physical activity, cortisone use, use of estrogen replacement therapy, nulliparity, Charlson’s comorbidity index, calcium and vitamin D supplementation, healthy dietary pattern, alcohol and total energy intake |
| 200–399 g/day | 1.21 (1.16–1.25) | ||||||||
| 400–599 g/day | 1.60 (1.53–1.68) | ||||||||
| ≥600 g/day | 1.93 (1.80–2.06) | ||||||||
| Michaëlsson, 2014 [30] | Cohort of Swedish Men | Sweden | 10,112 | Men (45,339) | 45–79 | 11.2 | <200 g/day | 1.00 (ref.) | Age, education, living alone, smoking status, BMI, height, physical activity, cortisone use, Charlson’s comorbidity index, calcium and vitamin D supplementation, healthy dietary pattern, alcohol and total energy intake |
| 200–399 g/day | 0.99 (0.94–1.05) | ||||||||
| 400–599 g/day | 1.05 (1.00–1.11) | ||||||||
| ≥600 g/day | 1.10 (1.03–1.17) | ||||||||
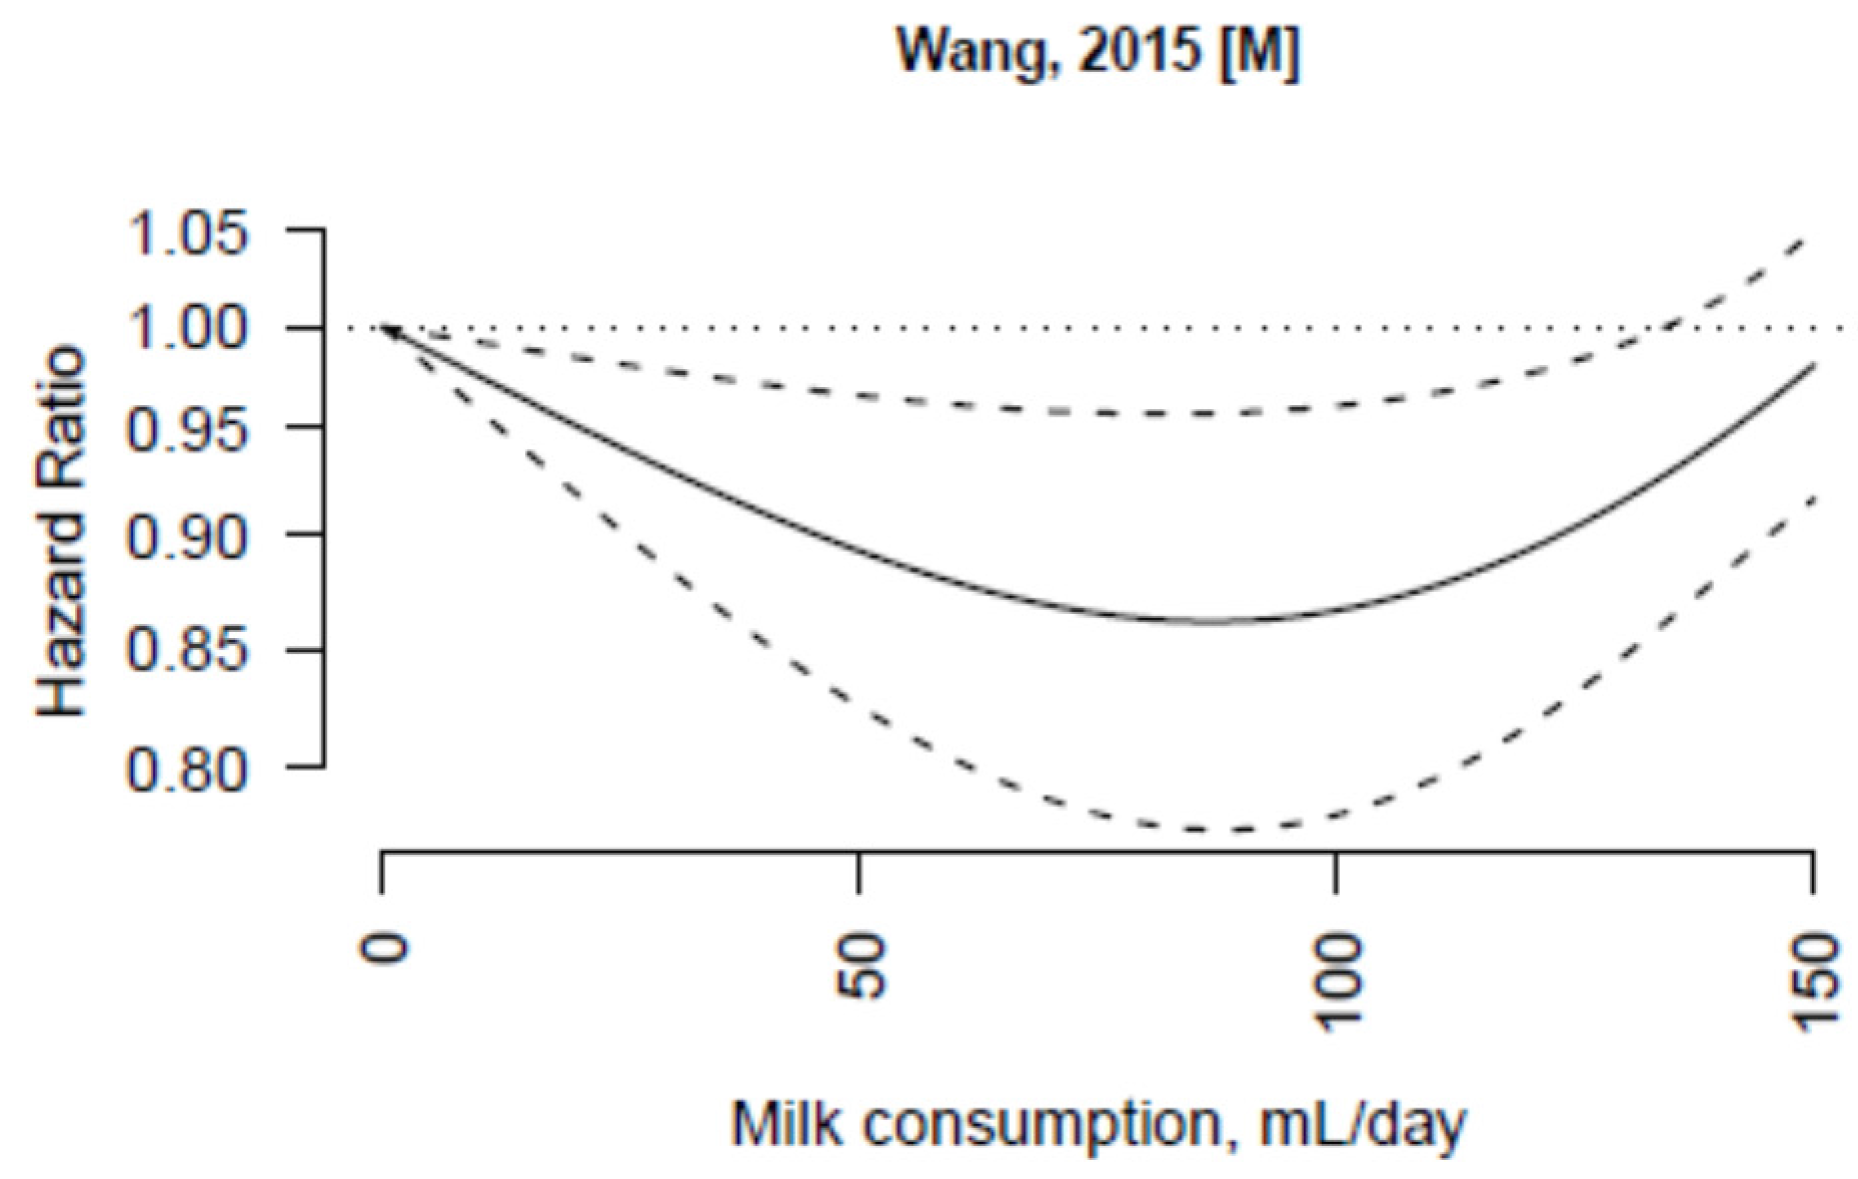
| Wang, 2015 [31] | Japan Collaborative Cohort Study | Japan | 9572 in women; 12,203 in men | Women (55,341); Men (39,639) | 40–79 | 19 | Women | Women | Age, education, smoking status, drinking status, BMI, physical activity, sleeping duration, participation in health check-ups, history of hypertension, diabetes, and liver disease, green-leafy vegetable intake |
| Never | 1.00 (ref.) | ||||||||
| 1–2 times/month | 1.00 (0.91–1.05) | ||||||||
| 1–2 times/week | 0.98 (0.91–1.05) | ||||||||
| 3–4 times/week | 0.91 (0.85–0.98) | ||||||||
| Almost daily | 0.96 (0.91–1.01) | ||||||||
| Men | Men | ||||||||
| Never | 1.00 (ref.) | ||||||||
| 1–2 times/month | 0.92 (0.86–0.99) | ||||||||
| 1–2 times/week | 0.91 (0.85–0.96) | ||||||||
| 3–4 times/week | 0.89 (0.84–0.96) | ||||||||
| Almost daily | 0.93 (0.89–0.98) |
3.3. Non-Fermented Milk
3.4. Fermented Milk
4. Discussion
5. Conclusions
Supplementary Files
Supplementary File 1Acknowledgments
Author Contributions
Conflicts of Interest
References
- Aune, D.; Navarro Rosenblatt, D.A.; Chan, D.S.; Vieira, A.R.; Vieira, R.; Greenwood, D.C.; Vatten, L.J.; Norat, T. Dairy products, calcium, and prostate cancer risk: A systematic review and meta-analysis of cohort studies. Am. J. Clin. Nutr. 2015, 101, 87–117. [Google Scholar] [CrossRef] [PubMed]
- Cho, E.; Smith-Warner, S.A.; Spiegelman, D.; Beeson, W.L.; van den Brandt, P.A.; Colditz, G.A.; Folsom, A.R.; Fraser, G.E.; Freudenheim, J.L.; Giovannucci, E.; et al. Dairy foods, calcium, and colorectal cancer: A pooled analysis of 10 cohort studies. J. Natl. Cancer Inst. 2004, 96, 1015–1022. [Google Scholar] [CrossRef] [PubMed]
- Patterson, E.; Larsson, S.C.; Wolk, A.; Akesson, A. Association between dairy food consumption and risk of myocardial infarction in women differs by type of dairy food. J. Nutr. 2013, 143, 74–79. [Google Scholar] [CrossRef] [PubMed]
- Hu, D.; Huang, J.; Wang, Y.; Zhang, D.; Qu, Y. Dairy foods and risk of stroke: A meta-analysis of prospective cohort studies. Nutr. Metab. Cardiovasc. Dis. 2014, 24, 460–469. [Google Scholar] [CrossRef] [PubMed]
- Huth, P.J.; Park, K.M. Influence of dairy product and milk fat consumption on cardiovascular disease risk: A review of the evidence. Adv. Nutr. 2012, 3, 266–285. [Google Scholar] [CrossRef] [PubMed]
- Aune, D.; Norat, T.; Romundstad, P.; Vatten, L.J. Dairy products and the risk of type 2 diabetes: A systematic review and dose-response meta-analysis of cohort studies. Am. J. Clin. Nutr. 2013, 98, 1066–1083. [Google Scholar] [CrossRef] [PubMed]
- Chen, M.; Sun, Q.; Giovannucci, E.; Mozaffarian, D.; Manson, J.E.; Willett, W.C.; Hu, F.B. Dairy consumption and risk of type 2 diabetes: 3 cohorts of US adults and an updated meta-analysis. BMC Med. 2014, 12, 215. [Google Scholar] [CrossRef] [PubMed]
- Bischoff-Ferrari, H.A.; Dawson-Hughes, B.; Baron, J.A.; Kanis, J.A.; Orav, E.J.; Staehelin, H.B.; Kiel, D.P.; Burckhardt, P.; Henschkowski, J.; Spiegelman, D.; et al. Milk intake and risk of hip fracture in men and women: A meta-analysis of prospective cohort studies. J. Bone Miner. Res. 2011, 26, 833–839. [Google Scholar] [CrossRef] [PubMed]
- Nestel, P.J.; Mellett, N.; Pally, S.; Wong, G.; Barlow, C.K.; Croft, K.; Mori, T.A.; Meikle, P.J. Effects of low-fat or full-fat fermented and non-fermented dairy foods on selected cardiovascular biomarkers in overweight adults. Br. J. Nutr. 2013, 110, 2242–2249. [Google Scholar] [CrossRef] [PubMed]
- Kumar, M.; Kumar, A.; Nagpal, R.; Mohania, D.; Behare, P.; Verma, V.; Kumar, P.; Poddar, D.; Aggarwal, P.K.; Henry, C.J.; et al. Cancer-preventing attributes of probiotics: An update. Int. J. Food Sci. Nutr. 2010, 61, 473–496. [Google Scholar] [CrossRef] [PubMed]
- Stroup, D.F.; Berlin, J.A.; Morton, S.C.; Olkin, I.; Williamson, G.D.; Rennie, D.; Moher, D.; Becker, B.J.; Sipe, T.A.; Thacker, S.B. Meta-analysis of observational studies in epidemiology: A proposal for reporting. Meta-analysis Of Observational Studies in Epidemiology (MOOSE) group. JAMA 2000, 283, 2008–2012. [Google Scholar] [CrossRef] [PubMed]
- The Newcastle-Ottawa Scale (NOS) for Assessing the Quality of Nonrandomised Studies in Meta-Analyses. Available online: http://www.ohri.ca/programs/clinical_epidemiology/oxford.asp (accessed on 1 August 2015).
- Orsini, N.; Bellocco, R.; Greenland, S. Generalized least squares for trend estimation of summarized dose-response data. Stata J. 2006, 6, 40–57. [Google Scholar]
- Orsini, N.; Li, R.; Wolk, A.; Khudyakov, P.; Spiegelman, D. Meta-analysis for linear and nonlinear dose-response relations: Examples, an evaluation of approximations, and software. Am. J. Epidemiol. 2012, 175, 66–73. [Google Scholar] [CrossRef] [PubMed]
- Ackson, D.; White, I.R.; Thompson, S.G. Extending DerSimonian and Laird’s methodology to perform multivariate random effects meta-analyses. Stat. Med. 2010, 29, 1282–1297. [Google Scholar] [CrossRef] [PubMed]
- Desquilbet, L.; Mariotti, F. Dose-response analyses using restricted cubic spline functions in public health research. Stat. Med. 2010, 29, 1037–1057. [Google Scholar] [CrossRef] [PubMed]
- Higgins, J.P.; Thompson, S.G. Quantifying heterogeneity in a meta-analysis. Stat. Med. 2002, 21, 1539–1558. [Google Scholar] [CrossRef] [PubMed]
- Crippa, A. Dosresmeta: Performing Multivariate Dose-Response Meta-Analysis; R Foundation for Statistical Computing: Vienna, Austria, 2013; Available online: http://CRAN.R-project.org/package=dosresmeta (accessed on 7 July 2015).
- Viechtbauer, W. Metafor: Meta-Analysis Package for R; R Foundation for Statistical Computing: Vienna, Austria, 2010; Available online: http://CRAN.R-project.org/package=metafor (accessed on 7 July 2015).
- R Development Core Team. R: A Language and Environment for Statistical Computing; R Foundation for Statistical Computing: Vienna, Austria, 2009; Available online: http://www.R-project.org (accessed on 7 July 2015).
- Mann, J.I.; Appleby, P.N.; Key, T.J.; Thorogood, M. Dietary determinants of ischaemic heart disease in health conscious individuals. Heart 1997, 78, 450–455. [Google Scholar] [CrossRef] [PubMed]
- Ness, A.R.; Smith, G.D.; Hart, C. Milk, coronary heart disease and mortality. J. Epidemiol. Community Health 2001, 55, 379–382. [Google Scholar] [CrossRef] [PubMed]
- Elwood, P.C.; Pickering, J.E.; Fehily, A.M.; Hughes, J.; Ness, A.R. Milk drinking, ischaemic heart disease and ischaemic stroke I. Evidence from the Caerphilly cohort. Eur. J. Clin. Nutr. 2004, 58, 711–717. [Google Scholar] [CrossRef] [PubMed]
- Paganini-Hill, A.; Kawas, C.H.; Corrada, M.M. Non-alcoholic beverage and caffeine consumption and mortality: The Leisure World Cohort Study. Prev. Med. 2007, 44, 305–310. [Google Scholar] [CrossRef] [PubMed]
- Bonthuis, M.; Hughes, M.C.; Ibiebele, T.I.; Green, A.C.; van der Pols, J.C. Dairy consumption and patterns of mortality of Australian adults. Eur. J. Clin. Nutr. 2010, 64, 569–577. [Google Scholar] [CrossRef] [PubMed]
- Goldbohm, R.A.; Chorus, A.M.; Galindo Garre, F.; Schouten, L.J.; van den Brandt, P.A. Dairy consumption and 10-y total and cardiovascular mortality: A prospective cohort study in the Netherlands. Am. J. Clin. Nutr. 2011, 93, 615–627. [Google Scholar] [CrossRef] [PubMed]
- Soedamah-Muthu, S.S.; Masset, G.; Verberne, L.; Geleijnse, J.M.; Brunner, E.J. Consumption of dairy products and associations with incident diabetes, CHD and mortality in the Whitehall II study. Br. J. Nutr. 2013, 109, 718–726. [Google Scholar] [CrossRef] [PubMed]
- Dik, V.K.; Murphy, N.; Siersema, P.D.; Fedirko, V.; Jenab, M.; Kong, S.Y.; Hansen, C.P.; Overvad, K.; Tjonneland, A.; Olsen, A.; et al. Prediagnostic intake of dairy products and dietary calcium and colorectal cancer survival—Results from the EPIC cohort study. Cancer Epidemiol. Biomark. Prev. 2014, 23, 1813–1823. [Google Scholar] [CrossRef] [PubMed]
- Yang, B.; McCullough, M.L.; Gapstur, S.M.; Jacobs, E.J.; Bostick, R.M.; Fedirko, V.; Flanders, W.D.; Campbell, P.T. Calcium, vitamin D, dairy products, and mortality among colorectal cancer survivors: The Cancer Prevention Study-II Nutrition Cohort. J. Clin. Oncol. 2014, 32, 2335–2343. [Google Scholar] [CrossRef] [PubMed]
- Michaëlsson, K.; Wolk, A.; Langenskiold, S.; Basu, S.; Warensjo Lemming, E.; Melhus, H.; Byberg, L. Milk intake and risk of mortality and fractures in women and men: Cohort studies. BMJ 2014, 349, g6015. [Google Scholar] [CrossRef] [PubMed]
- Wang, C.; Yatsuya, H.; Tamakoshi, K.; Iso, H.; Tamakoshi, A. Milk drinking and mortality: Findings from the Japan collaborative cohort study. J. Epidemiol. 2015, 25, 66–73. [Google Scholar] [CrossRef] [PubMed]
- Praagman, J.; Dalmeijer, G.W.; van der Schouw, Y.T.; Soedamah-Muthu, S.S.; Monique Verschuren, W.M.; Bas Bueno-de-Mesquita, H.; Geleijnse, J.M.; Beulens, J.W. The relationship between fermented food intake and mortality risk in the European Prospective Investigation into Cancer and Nutrition-Netherlands cohort. Br. J. Nutr. 2015, 113, 498–506. [Google Scholar] [CrossRef] [PubMed]
- Lock, A.L.; Bauman, D.E. Modifying milk fat composition of dairy cows to enhance fatty acids beneficial to human health. Lipids 2004, 39, 1197–1206. [Google Scholar] [CrossRef] [PubMed]
- Wang, X.; Ouyang, Y.; Liu, J.; Zhu, M.; Zhao, G.; Bao, W.; Hu, F.B. Fruit and vegetable consumption and mortality from all causes, cardiovascular disease, and cancer: Systematic review and dose-response meta-analysis of prospective cohort studies. BMJ 2014, 349, g4490. [Google Scholar] [CrossRef] [PubMed]
- Larsson, S.C.; Orsini, N. Red meat and processed meat consumption and all-cause mortality: A meta-analysis. Am. J. Epidemiol. 2014, 179, 282–289. [Google Scholar] [CrossRef] [PubMed]
- Crippa, A.; Discacciati, A.; Larsson, S.C.; Wolk, A.; Orsini, N. Coffee consumption and mortality from all causes, cardiovascular disease, and cancer: A dose-response meta-analysis. Am. J. Epidemiol. 2014, 180, 763–775. [Google Scholar] [CrossRef] [PubMed]
- Soedamah-Muthu, S.S.; Ding, E.L.; al-Delaimy, W.K.; Hu, F.B.; Engberink, M.F.; Willett, W.C.; Geleijnse, J.M. Milk and dairy consumption and incidence of cardiovascular diseases and all-cause mortality: Dose-response meta-analysis of prospective cohort studies. Am. J. Clin. Nutr. 2011, 93, 158–171. [Google Scholar] [CrossRef] [PubMed]
- O’Sullivan, T.A.; Hafekost, K.; Mitrou, F.; Lawrence, D. Food sources of saturated fat and the association with mortality: A meta-analysis. Am. J. Public Health 2013, 103, e31–e42. [Google Scholar] [CrossRef] [PubMed]
- Knoops, K.T.; Groot de, L.C.; Fidanza, F.; Alberti-Fidanza, A.; Kromhout, D.; van Staveren, W.A. Comparison of three different dietary scores in relation to 10-year mortality in elderly European subjects: The HALE project. Eur. J. Clin. Nutr. 2006, 60, 746–755. [Google Scholar] [CrossRef] [PubMed]
- Fortes, C.; Forastiere, F.; Farchi, S.; Rapiti, E.; Pastori, G.; Perucci, C.A. Diet and overall survival in a cohort of very elderly people. Epidemiology 2000, 11, 440–445. [Google Scholar] [CrossRef] [PubMed]
- Whiteman, D.; Muir, J.; Jones, L.; Murphy, M.; Key, T. Dietary questions as determinants of mortality: The OXCHECK experience. Public Health Nutr. 1999, 2, 477–487. [Google Scholar] [CrossRef] [PubMed]
- Engberink, M.F.; Soedamah-Muthu, S.S.; Boessenkool-Pape, J.; van Rooij, F.J.; Hofman, A.; Witteman, J.C. Dairy intake in relation to all-cause mortality and risk of cardiovascular disease: the Rotterdam Study; American Heart Association: San Francisco, CA, USA, 2010. [Google Scholar]
- Kahn, H.A.; Phillips, R.L.; Snowdon, D.A.; Choi, W. Association between reported diet and all-cause mortality. Twenty-one-year follow-up on 27,530 adult Seventh-Day Adventists. Am. J. Epidemiol. 1984, 119, 775–787. [Google Scholar] [PubMed]
© 2015 by the authors; licensee MDPI, Basel, Switzerland. This article is an open access article distributed under the terms and conditions of the Creative Commons Attribution license (http://creativecommons.org/licenses/by/4.0/).
Share and Cite
Larsson, S.C.; Crippa, A.; Orsini, N.; Wolk, A.; Michaëlsson, K. Milk Consumption and Mortality from All Causes, Cardiovascular Disease, and Cancer: A Systematic Review and Meta-Analysis. Nutrients 2015, 7, 7749-7763. https://doi.org/10.3390/nu7095363
Larsson SC, Crippa A, Orsini N, Wolk A, Michaëlsson K. Milk Consumption and Mortality from All Causes, Cardiovascular Disease, and Cancer: A Systematic Review and Meta-Analysis. Nutrients. 2015; 7(9):7749-7763. https://doi.org/10.3390/nu7095363
Chicago/Turabian StyleLarsson, Susanna C., Alessio Crippa, Nicola Orsini, Alicja Wolk, and Karl Michaëlsson. 2015. "Milk Consumption and Mortality from All Causes, Cardiovascular Disease, and Cancer: A Systematic Review and Meta-Analysis" Nutrients 7, no. 9: 7749-7763. https://doi.org/10.3390/nu7095363
APA StyleLarsson, S. C., Crippa, A., Orsini, N., Wolk, A., & Michaëlsson, K. (2015). Milk Consumption and Mortality from All Causes, Cardiovascular Disease, and Cancer: A Systematic Review and Meta-Analysis. Nutrients, 7(9), 7749-7763. https://doi.org/10.3390/nu7095363